")
Back to Journals » Cancer Management and Research » Volume 12
Differentiation of Treatment-Related Effects from Glioma Recurrence Using Machine Learning Classifiers Based Upon Pre-and Post-Contrast T1WI and T2 FLAIR Subtraction Features: A Two-Center Study
Authors Gao XY, Wang YD, Wu SM , Rui WT, Ma DN , Duan Y, Zhang AN, Yao ZW, Yang G , Yu YP
Received 31 December 2019
Accepted for publication 14 April 2020
Published 7 May 2020 Volume 2020:12 Pages 3191—3201
DOI https://doi.org/10.2147/CMAR.S244262
Checked for plagiarism Yes
Review by Single anonymous peer review
Peer reviewer comments 2
Editor who approved publication: Professor Yong Teng
Xin-Yi Gao,1– 3,* Yi-Da Wang,4,* Shi-Man Wu,5,* Wen-Ting Rui,5 De-Ning Ma,1 Yi Duan,4 An-Ni Zhang,1– 3 Zhen-Wei Yao,5 Guang Yang,4 Yan-Ping Yu1– 3
1Institute of Cancer and Basic Medicine (ICBM), Chinese Academy of Sciences, Hangzhou, People’s Republic of China; 2Department of Radiology, Cancer Hospital of the University of Chinese Academy of Sciences, Hangzhou, People’s Republic of China; 3Department of Radiology, Zhejiang Cancer Hospital, Hangzhou, People’s Republic of China; 4Department of Physics, Shanghai Key Laboratory of Magnetic Resonance, Shanghai, People’s Republic of China; 5Department of Radiology, Huashan Hospital, Fudan University, Shanghai, People’s Republic of China
*These authors contributed equally to this work
Correspondence: Yan-Ping Yu
Department of Radiology, Cancer Hospital of the University of Chinese Academy of Sciences, East Banshan Road, 1#, Hangzhou City, Zhejiang Province, People’s Republic of China
Tel/Fax +86-571-88122222
Email [email protected]
Guang Yang
Department of Physics, Shanghai Key Laboratory of Magnetic Resonance, North Zhongshan Road, 3663#, Shanghai, People’s Republic of China
Tel/Fax +86-21-62233873
Email [email protected]
Purpose: We propose three support vector machine (SVM) classifiers, using pre-and post-contrast T2 fluid-attenuated inversion recovery (FLAIR) subtraction and/or pre-and post-contrast T1WI subtraction, to differentiate treatment-related effects (TRE) from glioma recurrence.
Materials and Methods: Fifty-six postoperative high-grade glioma patients with suspicious progression after radiotherapy and chemotherapy from two centers were studied. Pre-and post-contrast T1WI and T2 FLAIR were collected. Each pre-contrast image was voxel-wise subtracted from the co-registered post-contrast image. Dataset was randomly split into training, and testing on a 7:3 ratio, accordingly subjected to a five fold cross validation. Best feature subsets were selected by Pearson correlation coefficient and recursive feature elimination, whereupon a radiomics classifier was built with SVM. The discriminating performance was assessed with the area under receiver-operating characteristic curve (AUC), accuracy, sensitivity, specificity, positive predictive value (PPV) and negative predictive value (NPV).
Results: In all, 186 features were extracted on each subtraction map. Top nine T1WI subtraction features, top thirteen T2 FLAIR subtraction features and top thirteen combination features were selected to build optimal SVM classifiers accordingly. The accuracies/AUCs/sensitivity/specificity/PPV/NPV of SVM based on sole T1WI subtraction were 80.00%/80.00% (CI: 0.5370– 1.0000)/100%/70.00%/62.50%/100%. Those results of SVM based on sole T2 FLAIR subtraction were 86.67%/84.00% (CI: 0.5962– 1.0000)/100%/80%/71.43%/100%. Those results of SVM based on both T1WI subtraction and T2 FLAIR subtraction were 93.33%/94.00% (CI: 0.7778– 1.0000)/100%/90%/83.33%/100%, respectively.
Conclusion: Pre- and post-contrast T2 FLAIR subtraction provided added value for diagnosis between recurrence and TRE. SVM based on a combination of T1WI and T2 FLAIR subtraction maps was superior to the sole use of T1WI or T2 FLAIR for differentiating TRE from recurrence. The SVM classifier based on combination of pre-and post-contrast subtraction T2 FLAIR and T1WI imaging allowed for the accurate differential diagnosis of TRE from recurrence, which is of paramount importance for treatment management of postoperative glioma patients after radiation therapy.
Keywords: glioma recurrence, treatment-related effects, T2 FLAIR enhancement, image subtraction, support vector machines
Introduction
Maximal safe surgical resection followed by concurrent chemotherapy and radiation therapy (CCRT) has become a standard treatment for patients with high-grade glioma.1 CCRT commonly leads to treatment-related effects (TRE) in the form of enhancement of conventional T1WI, which appears to be similar to glioma recurrence.2 This predicament becomes more complex because the recurrence often occurs within or adjacent to the primary site,3 which greatly overlaps with the radiation zone. The misdiagnosis may exclude the recurring tumor from proper therapy and bring overtreatment to TRE.4 Recurrent glioma and TRE show T1WI enhancement primarily by damaging the blood-brain barrier (BBB) according to underlying pathological changes.5 However, TRE could also lead to increased leakiness of the contrast agent due to increased capillary permeability along with the BBB alteration pathologically.6,7 The leakage of contrast agent from the vessel to the interstitial space is a major component of T2 fluid-attenuated inversion recovery (FLAIR) enhancement. There has been an interest in the usefulness of post-contrast T2 FLAIR to detect an increase in permeability of the BBB in brain inflammatory diseases with pathological confirmation.8 It should, therefore, be expected that enhanced T2 FLAIR could help differentiate TRE from recurrence. Previous studies have tried pre-contrast T2 FLAIR MRI in differentiating recurrence and TRE, none has tested the utility of T2 FLAIR enhancement. Thus, the utility of T2 FLAIR enhancement for differentiating recurrence and TRE is worth investigating.
Conventional T1WI and MRI are among the most widely used and easy-to-handle imaging methods for glioma diagnosis and clinical follow-up. Although it has been generally reported that advanced MRI sequences are more accurate than conventional ones,9 certain limitations hinder the popularity of advanced functional MRI sequences.10,11 In comparison with other functional MR imaging methods, classic T1WI and T2 FLAIR sequences are less vulnerable to artifacts, more accessible, and allow for higher spatial resolution.9 However, other tissue sources of bright signal appear as high signal on pre-contrast T1WI or T2 FLAIR, which greatly influence traditional enhancement observation. To overcome this limitation, a voxel-by-voxel image subtraction method has been adopted in several previous studies.12–14 Recently, Zivadinov et al further improved post-contrast T2 FLAIR accuracy by conducting pre- and post-contrast T2 FLAIR subtraction.12 With the help of pre- and post-contrast subtraction, still only a limited amount of readable conventional MRI features were able to be utilized, leaving a huge amount of precious image data information untouched.
Chung et al discovered that a bimodal histogram analysis based on dynamic contrast-enhanced MR could be a potential biomarker for differentiating recurrent glioblastoma (GBM) from radiation necrosis.1 The newly merged field of machine learning further allows the specifics of radiomics to be integrated into ancillary diagnostic methods. Previous studies have added the benefits of machine learning to the glioma World Health Organization grading classification,15 gene mutation,16,17 and survival.18 Only a few studies have attempted machine learning for the differential diagnosis between recurrence and TRE.19–21 Advances in voxel-wise pre- and post-contrast image subtraction along with machine learning could potentially help differential diagnosis between recurrence and TRE by mining the conventional image data to the utmost extent. However, the assessment of a previous single enhanced T1WI sequence alone did not show good results.22 Single T1WI subtraction alone provided only limited information on BBB damage. In this study, the combination of both pre-and post-contrast T2 FLAIR subtraction, as well as T1WI subtraction, using machine learning is assessed. To date, no multicenter investigations on the use of both pre-and post-contrast T2 FLAIR subtraction, as well as T1WI subtraction radiomic machine learning to distinguish TRE from recurrence, have been reported.
It is hypothesized that: 1) T2 FLAIR enhancement is complementary to T1WI enhancement in differentiating TRE from recurrence; and 2) radiomic features, which combine robust conventional T1WI enhancement subtraction and T2 FLAIR enhancement subtraction from enhancing lesions, can help distinguish recurrence and TRE by using machine learning.
Materials and Methods
Study Design, Ethical Approval, and Patient Consent
Figure 1 shows the flow chart of this study. All study protocols were approved by the local ethics committee of Zhejiang Cancer Hospital (grant number: 2019145) and the local ethics committee of Huashan hospital affiliated to Fudan University (grant number: 2017003) individually. Written informed consents were obtained from all patients.
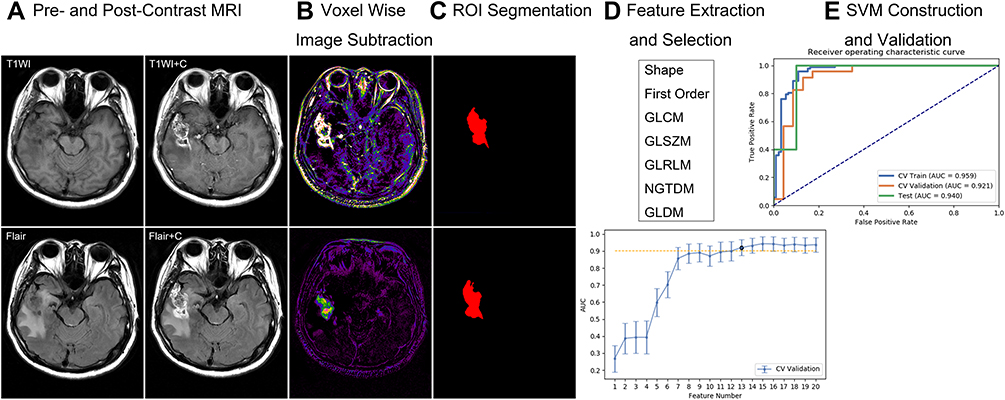 |
Figure 1 Flow chart of this study. (A) Pre- and post-contrast TIWI and T2 FLAIR MRI. (B) Voxel wise image subtraction. (C) Region of interest segmentation on subtraction map. (D) Feature extraction and selection. (E) SVM classifiers construction and validation. |
Patients
Patients suitable for this study included patients with pathologically proven glioma after gross total surgical resection who underwent subsequent chemoradiotherapy. Patients were eligible when T1WI enhancement initially appeared or enlarged during follow-ups (when TRE or recurrence was noticeable for the first time). The data of 56 patients who were diagnosed with high-grade glioma (including glioblastomas and anaplastic astrocytoma) between May 2017 and April 2019 in two individual centers were retrospectively reviewed. The specific radiation technique was intensity-modulated radiation therapy. The radiation dose was programmed according to the volume and location of the lesion. Subsequently, chemotherapy was in the form of a standard regimen of temozolomide. In this study, all recurrent lesions were pathologically confirmed by second surgical resections. The clinical diagnosis criteria for TRE were: 1) patients without additional treatment who were stable or regressive and did not show any adverse event clinically,23 2) did not progress on conventional MRI and MRI spectrum (MRS)/MRI perfusion (MRP) (clinical routine in the two centers), and 3) had a minimum 6-month follow-up coverage. The exclusion criteria were as follows: 1) the patient had first or second surgery at an external institution and pathological results were not available; 2) had insufficient diagnostic proof according to our clinical TRE criteria; or 3) had insufficient MRI quality to obtain image subtraction and further analysis (eg, motion artifact, missing sequence). A neuroradiologist (Y.P.Y.), blinded to clinical data, assessed the new or enlarged lesions. A senior radiology resident (A.N.Z) scrutinized each patient’s medical records.
Imaging Protocol
The enrolled patients had undergone MRI on either of two 3.0-T scanners (both were MEGNETOM Verio; Siemens Healthineers, Erlangen, Germany) in the two institutions using an 8-channel phased-array head coil. Post-contrast T2 FLAIR was added to the routine conventional MRI follow-up protocol, which was conducted in the following order: Sagittal or coronal T1WI; axial T1WI and T2 FLAIR; contrast-enhanced axial T1WI and contrast-enhanced axial T2 FLAIR. The conventional T1WI was a TSE sequence, the Siemens T2 FLAIR sequence was also known as “dark fluid” sequence. The voxel size of both the T1WI and T2 FLAIR was 0.8*0.7*4 mm3; and FOV, 220 mm2. The post-contrast T1WI was scanned 3 minutes after injection, and the duration was approximately 3 minutes. Then, the T2 FLAIR immediately followed as a delayed contrast scan. Gadolinium contrast agent (gadopentetate dimeglumine injection; Beijing Beilu Pharmaceutical Co., Ltd., Beijing, PR China, or gadodiamide injection; GE Healthcare CO., Ltd., Co. Cork, Ireland) was administered intravenously with a standardized protocol (0.1 mmol/Kg) by using an MR-compatible contrast medium injection system.
Image Preprocessing and Segmentation
To avoid multicenter MRI standardization bias, the enrolled patients in the two affiliations underwent a similar scan set up on similar Siemens scanners. For every study, the two enhanced MRI sequences of T1WI and T2 FLAIR were co-registered with reference to each pre-contrast T1WI and T2 FLAIR accordingly using SPM8 (Wellcome Department of Imaging Neuroscience, London, UK; http://www.fil.ion.ucl.ac.uk/spm/software/spm8/) under individual space. Subtraction maps were further calculated using the SPM8 “ImaCalc” tool function for each co-registered pre-and post-contrast T1WI images or T2 FLAIR images. To make the enhancement bright on the subtraction image, pre-contrast images were subtracted from post-contrast ones.
Every 2D subtraction map with a visible enhancement lesion was segmented manually by two neuroradiologists (reader 1:W.T.R., with 5 years of experience; reader 2: S.M.W., with 4 years of experience) using ITK-SNAP (http://www.itksnap.org). They were then scrutinized by a neuroradiology professor (Z.W.Y., with 25 years’ work experience) slice by slice. Figure 2 shows a representative of a segmented subtraction map. Intra- and interobserver reproducibility assessments were conducted according to Wu et al.24 Based on this, 25 lesions were initially chosen and an ICC greater than 0.75 was established as satisfying the reproducibility agreement. Up-sampling method was used to deal with class imbalance, in which random samples in the small class in the training data set were copied to make the number of samples in two classes equal.
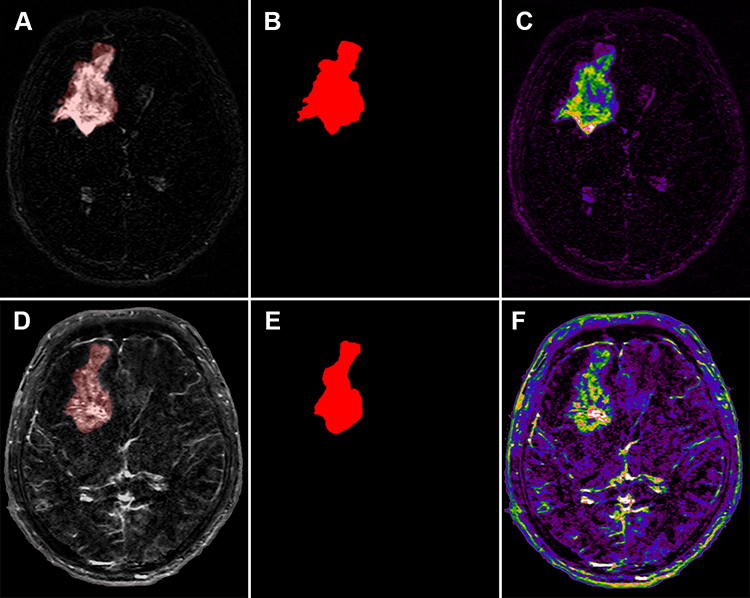 |
Figure 2 Glioma recurrence. (A) Pre- and post-contrast T2 FLAIR subtraction map. (B) Region of interest on T2 FLAIR subtraction map. (C) Color-encoded T2 FLAIR subtraction map. (D) Pre- and post-contrast T1WI subtraction map. (E) Region of interest on T1WI subtraction map. (F) Color-encoded T1WI subtraction map. |
Radiomic Feature Extraction and Selection
Radiomic features were extracted from each ROI with Pyradiomics (http://pyradiomics.readthedocs.io/en/latest/index.html). Images were normalized by centering at the mean intensity and dividing by one standard deviation to eliminate the influence of variation in grayscale ranges. Classes of features extracted included Shape, First Order, Gray Level Co-occurrence Matrix, Gray Level Size Zone Matrix, Gray Level Run Length Matrix, Neighboring Gray Tone Difference Matrix, and Gray Level Dependence Matrix.
In order to be potentially clinically effective, the SVM classifiers were designed based on the T1WI subtraction features (classifier 1) or the T2 FLAIR subtraction features (classifier 2) and combined features (classifier 3) individually. Due to the discrepancy between the relatively small sample size and the high-dimensional feature size, dimension reduction and feature selection were performed. Since the dimension of the feature space was high, the similarity of each feature pair was compared. According to a previous study,25 if the Pearson correlation coefficient value of the feature pair was larger than 0.86, one of them was removed. After this process, the dimension of the feature space was reduced, and each feature was independent of each other. Then, the recursive feature elimination (RFE) was used to select features before building the model. By removing the redundant features and keeping the highly important features, the RFE method helps to avoid overfitting and reduce the computational burden.
Model Construction
With the selected best features, the SVM model was built to construct the diagnostic classifier. The kernel function has the ability to map the features into a higher dimension to search the hyper-plane for separating cases with different labels. The linear kernel function was used here because it was easier to explain the coefficients of the features for the final model. The best feature number was found by comparing the performance of a 5-fold cross-validation on the training cohort using the SVM.
Model Validation and Comparison
A receiver operating characteristic curve (ROC) analysis was performed to evaluate the different model’s performance in the training cohort and testing cohort. The area under the ROC curve (AUC) was calculated for quantification. The accuracy, sensitivity, specificity, positive predictive value (PPV), and negative predictive value (NPV) were also calculated at a cutoff value that maximized the value of the Youden index. To calculate the 95% Confidence Interval (CI), we used a non-parametric bootstrap method.26 In each step of the calculation, a bootstrap dataset was produced by sampling n samples from the test data set randomly with replacement, where n was size of the test data set. Then, the bootstrap data set was used to calculate a bootstrap version of the statistics, including AUC. This step was repeated for 1000 times to get a bootstrap distribution of the statistics of interest from which CI was calculated.
All of the above processes were implemented using FeAture Explorer (FAE, v0.2.5, https://github.com/salan668/FAE) on Python (3.6.8, https://www.python.org/).
Results
Clinical and Imaging Data
As shown in Table 1, 49 lesions were finally included in this study from two different hospitals in China. Eight patients with eight lesions were excluded due to incomplete series (7) and motion artifacts (1). Interestingly, after pre- and post-contrast T1WI enhancement subtraction, nine lesions displayed slight enhancement on their T1WI enhancement subtraction maps. In contrast, all of these lesions showed intense enhancement on the T2 FLAIR subtraction map. All of the lesions were clinically diagnosed with TRE. None of the recurrence lesions displayed this phenomenon. These lesions were further excluded because it was difficult to circumscribe these slightly enhanced T1WI ROI accurately. Figure 3 shows an example of this phenomenon. The lower bound of both inter-observer (ICC = 0.87) and intra-observer reproducibility (ICC = 0.90) of lesion segmentation reached the satisfactory standard of this study. After testing the ICC, the remaining ROIs were finished by reader 1.
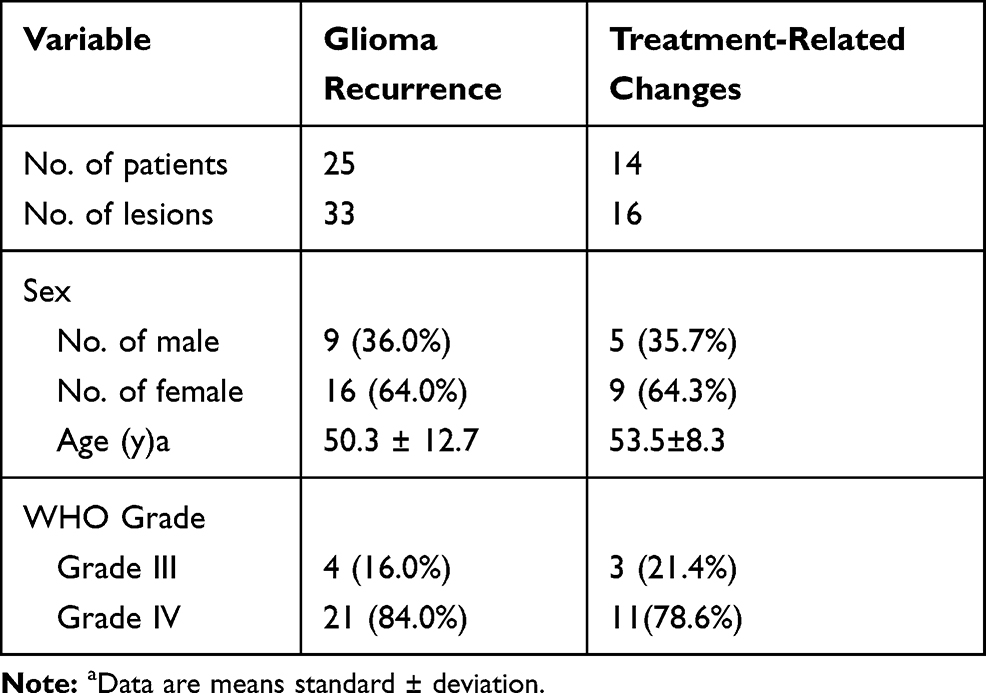 |
Table 1 Demographic Data for the Final SVM Study Patients |
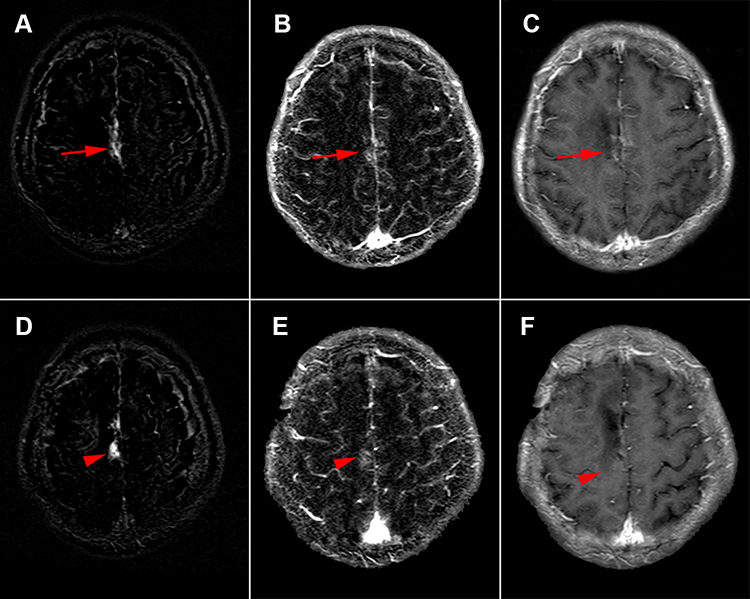 |
Figure 3 Treatment-related effects. (A, D) Pre- and post-contrast T2 FLAIR subtraction map in two planes. Lesions with intense enhancement (arrow & arrowhead) represent treatment-related effects. (B, E) The corresponding pre- and post-contrast T1WI subtraction map in two planes. The lesions show slightly (arrow and arrowhead) enhancement. (C, F) The corresponding post-contrast T1WI in the two planes with suspicious enhancement (arrow and arrowhead). |
Classifier 1: SVM Based on Single T1WI Enhancement Subtraction
During this process, only features extracted from the T1WI enhancement subtraction maps were used to train an SVM classifier. Forty-nine lesions (TRE: 16; recurrence: 33) were randomly split into training (TRE: 11; recurrence: 23; total: 34) and testing (TRE: 5; recurrence: 10; total: 15) at a 7:3 ratio. The top nine features were chosen by the classifier across a total of 93 features. Figure 4A demonstrates the OSE feature selection method. The SVM classifier provided a diagnostic accuracy of 80.00%. The AUC was 84.20% in the training cohort, 75.50% in the validation cohort, and 80.00% (95% CI: 0.5370–1.0000) in the test cohort, with 100% sensitivity and 70% specificity (Table 2). Figure 4B shows the ROC curve of classifier 1.
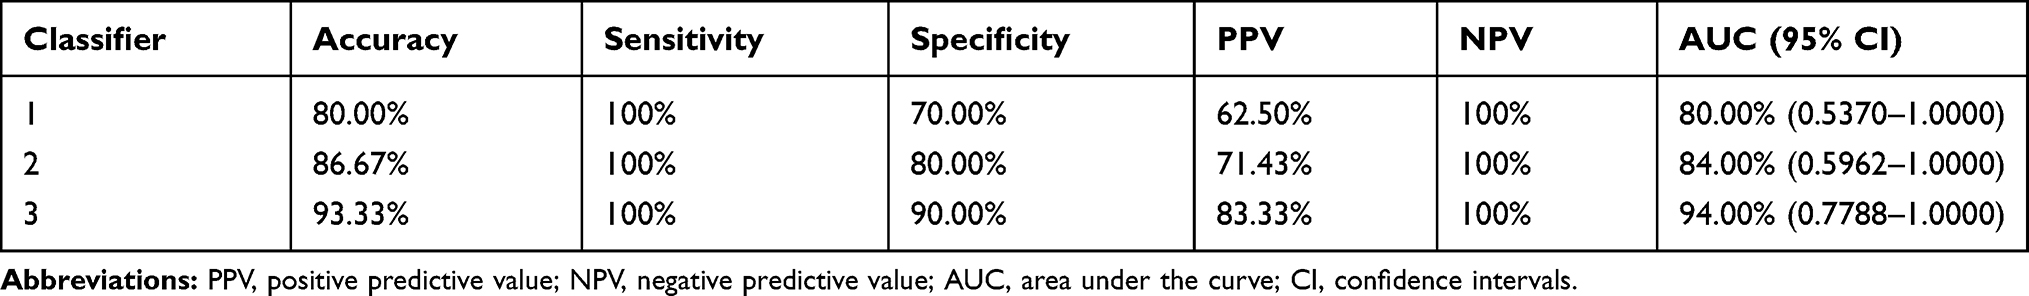 |
Table 2 Diagnostic Efficiency of the Three Classifiers |
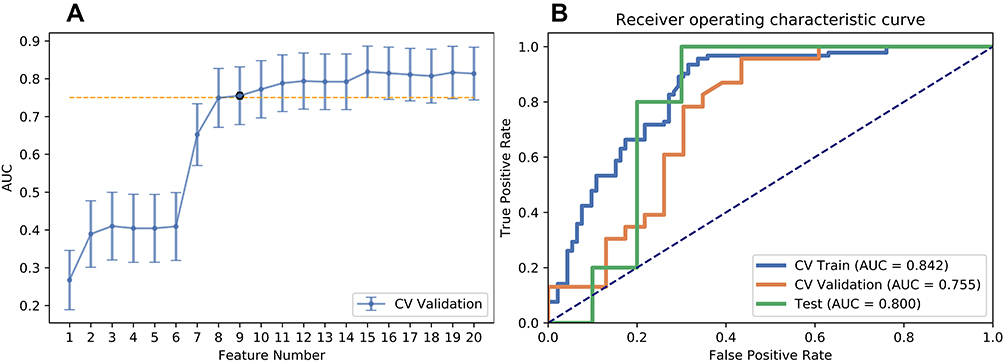 |
Figure 4 Results of classifier 1. (A) Selections of optimal features using recursive feature elimination (RFE) method. (B) The receiver-operating characteristic curve of classifier 1. |
Classifier 2: SVM Based on Single T2 FLAIR Enhancement Subtraction
During this process, only features extracted from the T2 FLAIR enhancement subtraction maps were used to train an SVM classifier. A total of 49 lesions (TRE: 16; recurrence: 33) were randomly split into training (TRE: 11; recurrence: 23; total: 34) and testing (TRE: 5; recurrence: 10; total: 15) at a 7:3 ratio. The top 13 features were chosen by the classifier across a total of 93 features. Figure 5A shows the OSE feature selection method. The SVM classifier provided a diagnostic accuracy of 86.67%. The AUC was 94.70% in the training cohort, 85.80% in the validation cohort, and 84.00% (95% CI: 0.5962–1.0000) in the test cohort, with 100% sensitivity and 80% specificity (Table 2). Figure 5B shows the ROC curve of classifier 2.
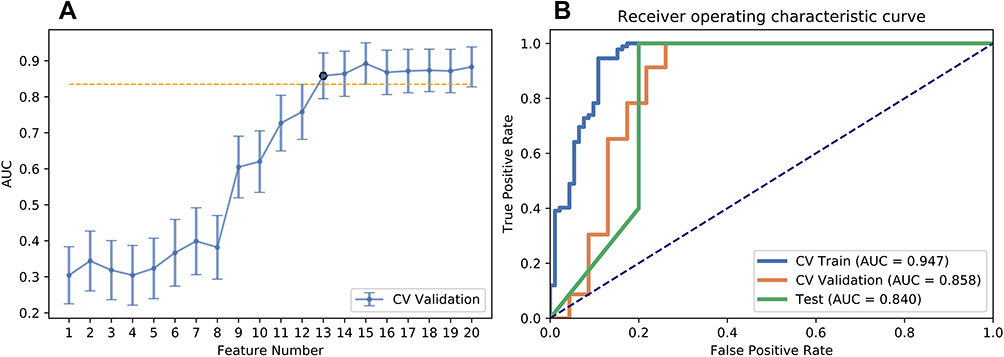 |
Figure 5 Results of classifier 2. (A) Selections of optimal features using recursive feature elimination (RFE) method. (B) The receiver-operating characteristic curve of classifier 2. |
Classifier 3: SVM Based on a Combination of the T1WI Enhancement Subtraction and the T2 FLAIR Subtraction
Features extracted from both the T1WI and T2 FLAIR enhancement subtraction maps were used to train an SVM classifier. A total of 49 lesions (TRE: 16; recurrence: 33) were randomly split into training (TRE: 11; recurrence: 23; total: 34) and testing (TRE: 5; recurrence: 10; total: 15) at a 7:3 ratio. The top 13 features were chosen by the classifier across a total of 186 features. Figure 6A shows the OSE feature selection method. The SVM classifier provided a diagnostic accuracy of 93.33%. The AUC was 95.90% in the training cohort, 92.10% in the validation cohort, and 94.00% (95% CI: 0.7778–1.0000) in the test cohort, with 100% sensitivity and 90% specificity (Table 2). Figure 6B demonstrates the ROC curve of classifier 3.
 |
Figure 6 Results of classifier 3. (A) Selections of optimal features using recursive feature elimination (RFE) method. (B) The receiver-operating characteristic curve of classifier 3. |
Discussion
Even with access to advanced MRI sequences, it is still challenging to differentiate TRE from recurrence when a newly appeared or enlarged lesion presents itself upon a routine T1WI follow-up. In this two-center study, conventional T2 FLAIR enhancement as well as the voxel-wise image subtraction method were used to differentially diagnose between recurrence and TRE. With the help of machine learning, the image data of both conventional T1WI enhancement and T2 FLAIR enhancement were mined to the utmost extent. A machine learning model based on both T1WI enhancement subtraction and T2 FLAIR enhancement subtraction (Accuracy: 93.33%; AUC: 94.00%; Sensitivity: 100%; Specificity: 90.00%; NPV: 100%; PPV: 83.33%) achieved the best performance among the three classifiers. The diagnostic ability was comparable to some previous studies based on advanced MRI sequences. A previous meta-analysis by Zhang et al showed the diagnostic quality of diffusion-weighted imaging (DWI) for differentiating recurrence from TRE with a sensitivity of 82% and specificity of 84%.27 The polled sensitivities and specificities found using a recent meta-analysis were 90% to 88% (95% CI:0.85–0.94; 0.83–0.92) and 89% to 85% (95% CI: 0.78–0.96; 0.77–0.91) for dynamic susceptibility contrast (DSC) and dynamic contrast-enhanced (DCE), respectively.2 Deuschl et al reported a predictive value of approximately 82% based on conventional MRI image (including T1WI, T2 FLAIR, DWI, and contrast-enhanced T1WI) observation guided by response assessment in neuro-oncology (RANO) classification.28 By combining the enhanced areas in the T1WI and the apparent diffusion coefficient (ADC), Reimer et al reported an AUC between 77.9% and 90.9%.29 Jena et al reported an AUC between 86.0% and 96.6% using combined DCE-MRI and MRS.3 Novel nonradioactive advanced methods, including arterial spin labeling (ASL)23 and diffusion tensor imaging (DTI),30 accomplished a relatively better diagnostic accuracy.
However, advanced MRI methods have gained less popularity due to several limitations compared with classic T1WI and T2 FLAIR. The relatively complicated image acquisition and the vacancy of easily accessible post-possessing software hinder the widely routine application of MRI Perfusion. In comparison with MRI perfusion, MRS showed a better diagnostic value in distinguishing recurrence and TRE. However, MRS could be misleading due to the fact that the spectrum largely overlaps with abundant brain metabolites, which is illegible on the 3.0T MR scanner.10 In addition, the spectrum baseline is vulnerable to material like blood, which is common in a glioma treated brain. Also, MRS is restricted in borderline areas and is not available for the entire brain.11 ASL and DTI are hindered by relatively lower spatial resolutions and longer scanning protocols. To note, T1WI and T2 FLAIR sequences are robust and have gained widespread clinical acceptance in neuroradiology practice. Additionally, enhanced T1WI and T2 FLAIR sequences are relatively easy to perform and unlikely to be influenced by sequence type variations among different MR scanners in general. Previous conventional MRI studies have suggested that a differential diagnosis between recurrence and TRE in glioma is challenging based on the naked eye.31 Santra et al reported a naked eye diagnosis based on conventional T1WI yielding a 70.5% accuracy, 24.1% sensitivity, and 94.6% specificity.22 It would be arduous for the radiologists to distinguish the enhancement if a certain area appears bright on the T1WI. Previous observational studies have resulted in an inter-reader variability and confusing reliable differentiation diagnosis.19 Recently, to overcome the methodical limitations of previous studies, the voxel-by-voxel image subtraction method has been employed in several studies.32 Hu et al applied voxel-wise pre- and post- contrast T1WI image subtraction as binary masks to relative cerebral volume (rCBV) to reliably estimate histologic tumor fraction in recurrent glioma, which strengthened the usefulness of subtraction methods.33 By using subtraction data mining, this single T1WI subtraction-based classifier method further elevated the diagnostic accuracy to 80.00%, with 100% sensitivity and 70% specificity. Recently, Elshafeey et al built a multicenter-based SVM classifier using radiomic features obtained from 98 patients’ Ktrans and rCBV maps, achieving an accuracy of 90.82% (area under the curve (AUC) = 89.10%, sensitivity = 91.36%, 67 specificity = 88.24%, p = 0.017).21 In comparison with their study, this two-center analysis initially was based on the use of a conventional T1WI and T2 FLAIR-based radiomic SVM classifier and reached slightly inferior results. In this manner, this proposed model may potentially complement advanced MRI methods and act as an alternative when advanced MRI methods are not available.
In this study, the T2 FLAIR complement T1WI yielded different aspects of pathology. Glioma recurrence is characterized by the presence of tumor cells, vascular proliferation, and increased cellularity.34 In contrast, TRE is characterized by liquefactive necrosis, inflammation, endothelial damage, and vascular hyalinization.35 During this process, increased capillary permeability along with brain blood barrier alteration ultimately leads to increased leakiness of the contrast agent and/or increased enhancement.6,7 Previous studies have proven that contrast-enhanced T2 FLAIR is very sensitive to an increase in the permeability of BBB, which was tested in a series of brain inflammation investigations.8 This study echoed this unique characteristic of contrast-enhanced T2 FLAIR since the sensitivity reached 100% in classifier 2. Interestingly, nine clinically proven lesions with TRE presented as a subtle enhancement on their T1WI enhancement subtraction maps and intense enhancement on the T2 FLAIR subtraction maps. This phenomenon might be explained by T2 FLAIR enhancement’s high sensitivity to detect increased leakiness of TRE according to its congenital nature. Harris et al suggested a positive correlation between FLAIR and contrast-enhanced double inversion recovery (DIR) and a negative correlation between contrast-enhanced DIR post-contrast signal intensity and rCBV.36 However, they did not directly compare the correlation between FLAIR enhancement and high rCBV lesion by lesion. In this study, it was found that the AUC and specificity of pre-and post-contrast T2 FLAIR subtraction SVM was higher than pre-and post-contrast T1WI subtraction SVM. There was also improved SVM diagnostic accuracy by adding the T2 FLAIR subtraction map to T1WI subtraction map. Recently, Ismail et al19 reported an accuracy of 90.2% using machine learning based on shape features extracted from the T1WI enhancement image and the pre-contrast T2 FLAIR image, which was relatively lower than the result of the classifier 3 in this study. These results may suggest that T2 FLAIR enhancement is a sensitive complementary technique that provides independent information for the differential diagnosis between recurrence and TRE. The increased diagnostic accuracy combined with the T2 FLAIR subtraction suggests that the combined use of pre-and post-contrast T1WI and T2 Fair might be beneficial for daily clinical decisions compared with the sole use of pre-and post-contrast T1WI. Hence, in a routine follow-up of treated glioma patients, especially when the advanced technique is not available, it is recommended to add a simple T2 FLAIR sequence directly after T1WI enhancement. With the help of further pre-and post-contrast image subtraction and a built SVM classifier, the combination method can serve as a practical and easy surrogate for postoperative glioma patient follow-up and can provide personalized automatic differential diagnostic information. Integration of all processing steps into a single software suite may be possible to achieve faster automatic diagnoses in the future.
In the best SVM classifier developed in this study, 13 top features among a total of 186 features were selected, including three first-order features, eight gray-level co-occurrence matrix (GLCM) features, and two gray-level run length (GLRLM) features. Both the contributing GLRLM features were extracted from the T1WI enhancement subtractions, namely a short-run emphasis (SRE) and a long run high gray-level emphasis (LRHGLE). The SRE represents higher texture fineness in the subtraction map. The LRHGLE correlated with the high signal19 in the T1WI subtraction maps, underlying the degree of enhancement. Besides, nine clinically proved lesions with TRE present subtle enhancement on their T1WI enhancement subtraction maps and intense enhancement on T2 FLAIR subtraction maps were found. Hence, the enhancement degree of T1WI helped to differentiate recurrence and TRE.
Nearly 36% of postoperative treated glioma patients with enhanced T1WI lesions were due to TRE, whereas true progression occurred in 60% of patients.37 In the data set of this study, nearly 33% of lesions were clinically diagnosed as TRE, whereas 67% of lesions were pathologically proven as recurrence after the second surgery. A relatively strict clinical diagnosis criterion was applied for the TRE in order to exclude potential recurrence lesions.
TRE can be subdivided into early pseudo-progression late radiation induced brain necrosis by timing. Pseudo-progression occurs within 6 months after radiotherapy, whereas radiation necrosis typically appears 12–18 months after radiation therapy. Pseudo-progression and necrosis share many histologic similarities, such as inflammation and necrosis, that reflect similar imaging characteristics.34 Hence, in this study, both early and late TRE were considered.
This study had some limitations. First, it was a retrospective study with a relatively small sample size. Further prospective studies on a larger scale are necessary to strengthen these results. Second, the diagnoses of TRE were not pathologically confirmed. Relatively strict clinical criteria were conducted instead. Since an invasive biopsy involves hazards such as infection, hemorrhage, and neurological deficits, it not routinely conducted in both of the two institutions. In addition, pathology based on biopsy may lead to a false-negative result due to the heterogeneity of treated glioma. Further studies with strict point-to-point pathological validation are recommended. Third, since only T1WI enhanced and T2 FLAIR enhanced lesions were involved, the possible non-enhanced tumor infiltration area was not assessed. Carefully selected advanced parameters that reflect glioma non-enhanced infiltration should be added in future studies in order to further improve the diagnostic accuracy and balance between costs and effects based on these findings. Finally, we excluded 9 lesions with merely subtle enhancement on T1 FLAIR because it would be difficult to draw an accurate ROI. All these nine patients were TRE and showed intense T2 FLAIR and may lead to potential bias. Further studies with a larger sample size are needed to investigate whether it could be a unique radiological sign for TRE.
Pre- and post-contrast T2 FLAIR subtraction provided added value for diagnosis between recurrence and TRE. SVM based on a combination of T1WI and T2 FLAIR subtraction maps was superior to the sole use of T1WI or T2 FLAIR for differentiating TRE from recurrence. The SVM classifier based on a combination of pre-and post-contrast subtraction T2 FLAIR and T1WI imaging allowed for the accurate differential diagnosis of TRE from recurrence, which is of paramount importance for treatment management of postoperative glioma patients after radiation therapy.
Abbreviations
SVM, support vector machines; TRE, treatment-related effects; PCC, Pearson correlation coefficient; RFE, recursive feature elimination; AUC, area under receiver-operating characteristic curve; PPV, positive predictive value; NPV, negative predictive value; CCRT, concurrent chemotherapy and radiation therapy; BBB, blood-brain barrier; FLAIR, fluid-attenuated inversion recovery; GBM, glioblastoma; MRS, MRI spectrum; MRP, MRI perfusion; ROC, receiver operating characteristic curve; CI, confidence interval; DWI, diffusion-weighted imaging; DSC, dynamic susceptibility contrast; DCE, dynamic contrast-enhanced; ADC, apparent diffusion coefficient; ASL, arterial spin labeling; DTI, diffusion tensor imaging; rCBV, relative cerebral volume; DIR, contrast-enhanced double inversion recovery; GLCM, gray level co-occurrence matrix; GLRLM, gray level run length; SRE, short-run emphasis; LRHGLE, long-run high gray-level emphasis.
Acknowledgments
We thank LetPub for its linguistic assistance during the preparation of this manuscript.
Funding
This study was supported by the Chinese National Natural Science Foundation (grant number: 81702371).
Disclosure
Y.P.Y. and G.Y. shared the corresponding authorship. The authors report no conflicts of interest in this work.
References
1. Chung WJ, Kim HS, Kim N, Choi CG, Kim SJ. Recurrent glioblastoma: optimum area under the curve method derived from dynamic contrast-enhanced T1-weighted perfusion MR imaging. Radiology. 2013;269(2):561–568. doi:10.1148/radiol.13130016
2. Patel P, Baradaran H, Delgado D, et al. MR perfusion-weighted imaging in the evaluation of high-grade gliomas after treatment: a systematic review and meta-analysis. Neuro-Oncology. 2017;19(1):118–127. doi:10.1093/neuonc/now148
3. Jena A, Taneja S, Jha A, et al. Multiparametric evaluation in differentiating glioma recurrence from treatment-induced necrosis using simultaneous F-FDG-PET/MRI: a single-institution retrospective study. AJNR Am J Neuroradiol. 2017;38(5):899–907. doi:10.3174/ajnr.A5124
4. Radbruch A, Fladt J, Kickingereder P, et al. Pseudoprogression in patients with glioblastoma: clinical relevance despite low incidence. Neuro Oncol. 2015;17(1):151–159. doi:10.1093/neuonc/nou129
5. Furuse M, Nonoguchi N, Yamada K, et al. Radiological diagnosis of brain radiation necrosis after cranial irradiation for brain tumor: a systematic review. Radiat Oncol. 2019;14(1):28. doi:10.1186/s13014-019-1228-x
6. Prager AJ, Martinez N, Beal K, Omuro A, Zhang Z, Young RJ. Diffusion and perfusion MRI to differentiate treatment-related changes including pseudoprogression from recurrent tumors in high-grade gliomas with histopathologic evidence. Am J Neuroradiol. 2015;36(5):877–885. doi:10.3174/ajnr.A4218
7. Fatterpekar GM, Galheigo D, Narayana A, Johnson G, Knopp E. Treatment-related change versus tumor recurrence in high-grade gliomas: a diagnostic conundrum–use of dynamic susceptibility contrast-enhanced (DSC) perfusion MRI. Am J Roentgenol. 2012;198(1):19–26. doi:10.2214/AJR.11.7417
8. Eisele P, Griebe M, Szabo K, et al. Investigation of leptomeningeal enhancement in MS: a postcontrast FLAIR MRI study. Neurology. 2015;84(8):770–775. doi:10.1212/WNL.0000000000001286
9. Evelhoch JL, LoRusso PM, He Z, et al. Magnetic resonance imaging measurements of the response of murine and human tumors to the vascular-targeting agent ZD6126. Clin Cancer Res. 2004;10(11):3650–3657. doi:10.1158/1078-0432.CCR-03-0417
10. Smits M, van den Bent MJ. Imaging correlates of adult glioma genotypes. Radiology. 2017;284(2):316–331. doi:10.1148/radiol.2017151930
11. Heiss WD. Positron emission tomography imaging in gliomas: applications in clinical diagnosis, for assessment of prognosis and of treatment effects, and for detection of recurrences. Eur J Neurol. 2017;24(10):. doi:10.1111/ene.13385.
12. Zivadinov R, Ramasamy DP, Hagemeier J, et al. Evaluation of leptomeningeal contrast enhancement using pre-and postcontrast subtraction 3D-FLAIR imaging in multiple sclerosis. Am J Neuroradiol. 2018;39(4):642–647. doi:10.3174/ajnr.A5541
13. Jalbert LE, Neill E, Phillips JJ, et al. Magnetic resonance analysis of malignant transformation in recurrent glioma. Neuro Oncol. 2016;18(8):1169–1179. doi:10.1093/neuonc/now008
14. Daniels D, Guez D, Last D, et al. Early biomarkers from conventional and delayed-contrast MRI to predict the response to bevacizumab in recurrent high-grade gliomas. Am J Neuroradiol. 2016;37(11):2003–2009. doi:10.3174/ajnr.A4866
15. AYang Y, Yan LF, Zhang X, et al. Optimizing texture retrieving model for multimodal MR image-based support vector machine for classifying glioma. J Magn Reson Imaging. 2019;49(5):1263–1274. doi:10.1002/jmri.26524
16. De Looze C, Beausang A, Cryan J, et al. Machine learning: a useful radiological adjunct in determination of a newly diagnosed glioma’s grade and IDH status. J Neurooncol. 2018;139(2):491–499. doi:10.1007/s11060-018-2895-4
17. Li Y, Qian Z, Xu K, et al. MRI features predict p53 status in lower-grade gliomas via a machine-learning approach. NeuroImage Clin. 2018;17(undefined):306–311. doi:10.1016/j.nicl.2017.10.030
18. Papp L, Pötsch N, Grahovac M, et al. Glioma survival prediction with combined analysis of in vivo C-MET PET features, ex vivo features, and patient features by supervised machine learning. J Nucl Med. 2018;59(6):892–899. doi:10.2967/jnumed.117.202267
19. Ismail M, Hill V, Statsevych V, et al. Shape features of the lesion habitat to differentiate brain tumor progression from pseudoprogression on routine multiparametric MRI: a multisite study. Am J Neuroradiol. 2018;39(12):2187–2193. doi:10.3174/ajnr.A5858
20. Hu X, Wong KK, Young GS, Guo L, Wong ST. Support vector machine multiparametric MRI identification of pseudoprogression from tumor recurrence in patients with resected glioblastoma. J Magn Reson Imaging. 2011;33(2):296–305. doi:10.1002/jmri.22432
21. Elshafeey N, Kotrotsou A, Hassan A, et al. Multicenter study demonstrates radiomic features derived from magnetic resonance perfusion images identify pseudoprogression in glioblastoma. Nat Commun. 2019;10(1):3170. doi:10.1038/s41467-019-11007-0
22. Santra A, Sharma P, Kumar R, et al. Comparison of glucoheptonate single photon emission computed tomography and contrast-enhanced MRI in detection of recurrent glioma. Nucl Med Commun. 2011;32(3):206–211. doi:10.1097/MNM.0b013e328341c3e9
23. Liu J, Li C, Chen Y, et al. Diagnostic performance of multiparametric MRI in the evaluation of treatment response in glioma patients at 3T. J Magn Reson Imaging. 2019;undefined(undefined):undefined.
24. Wu S, Zheng J, Li Y, et al. A radiomics nomogram for the preoperative prediction of lymph node metastasis in bladder cancer. Clin Cancer Res. 2017;23(22):6904–6911. doi:10.1158/1078-0432.CCR-17-1510
25. Liu Z, Li Z, Qu J, et al. Radiomics of multiparametric MRI for pretreatment prediction of pathologic complete response to neoadjuvant chemotherapy in breast cancer: a multicenter study. Clin Cancer Res. 2019;25(12):3538–3547. doi:10.1158/1078-0432.CCR-18-3190
26. Efron B. Better bootstrap confidence intervals. J Am Stat Assoc. 1987;82(397):171–185. doi:10.1080/01621459.1987.10478410
27. Zhang H, Ma L, Shu C, Wang YB, Dong LQ. Diagnostic accuracy of diffusion MRI with quantitative ADC measurements in differentiating glioma recurrence from radiation necrosis. J Neurol Sci. 2015;351(null):65–71. doi:10.1016/j.jns.2015.02.038
28. Deuschl C, Kirchner J, Poeppel TD, et al. 11C-MET PET/MRI for detection of recurrent glioma. Eur J Nucl Med Mol Imaging. 2018;45(4):593–601. doi:10.1007/s00259-017-3916-9
29. Reimer C, Deike K, Graf M, et al. Differentiation of pseudoprogression and real progression in glioblastoma using ADC parametric response maps. PLoS One. 2017;12(4):e0174620. doi:10.1371/journal.pone.0174620
30. Razek AA, El-Serougy L, Abdelsalam M, Gaballa G, Talaat M. Differentiation of residual/recurrent gliomas from postradiation necrosis with arterial spin labeling and diffusion tensor magnetic resonance imaging-derived metrics. Neuroradiology. 2018;60(2):169–177. doi:10.1007/s00234-017-1955-3
31. Yoon RG, Kim HS, Koh MJ, et al. differentiation of recurrent glioblastoma from delayed radiation necrosis by using voxel-based multiparametric analysis of MR imaging data. Radiology. 2017;285(1):206–213. doi:10.1148/radiol.2017161588
32. Kickingereder P, Radbruch A, Burth S, et al. MR perfusion-derived hemodynamic parametric response mapping of bevacizumab efficacy in recurrent glioblastoma. Radiology. 2016;279(2):542–552. doi:10.1148/radiol.2015151172
33. Hu LS, Eschbacher JM, Heiserman JE, et al. Reevaluating the imaging definition of tumor progression: perfusion MRI quantifies recurrent glioblastoma tumor fraction, pseudoprogression, and radiation necrosis to predict survival. Neuro Oncol. 2012;14(7):919–930. doi:10.1093/neuonc/nos112
34. Da Cruz LH, Rodriguez I, Domingues RC, Gasparetto EL, Sorensen AG. Pseudoprogression and pseudoresponse: imaging challenges in the assessment of posttreatment glioma. Am J Neuroradiol. 2011;32(11):1978–1985. doi:10.3174/ajnr.A2397
35. Yoshii Y. Pathological review of late cerebral radionecrosis. Brain Tumor Pathol. 2008;25(2):51–58. doi:10.1007/s10014-008-0233-9
36. Harris RJ, Cloughesy TF, Pope WB, et al. Pre- and post-contrast three-dimensional double inversion-recovery MRI in human glioblastoma. J Neurooncol. 2013;112(2):257–266. doi:10.1007/s11060-013-1057-y
37. Abbasi AW, Westerlaan HE, Holtman GA, et al. Incidence of tumour progression and pseudoprogression in high-grade gliomas: a systematic review and meta-analysis. Clin Neuroradiol. 2018;28(3):401–411. doi:10.1007/s00062-017-0584-x
 © 2020 The Author(s). This work is published and licensed by Dove Medical Press Limited. The full terms of this license are available at https://www.dovepress.com/terms.php and incorporate the Creative Commons Attribution - Non Commercial (unported, v3.0) License.
By accessing the work you hereby accept the Terms. Non-commercial uses of the work are permitted without any further permission from Dove Medical Press Limited, provided the work is properly attributed. For permission for commercial use of this work, please see paragraphs 4.2 and 5 of our Terms.
© 2020 The Author(s). This work is published and licensed by Dove Medical Press Limited. The full terms of this license are available at https://www.dovepress.com/terms.php and incorporate the Creative Commons Attribution - Non Commercial (unported, v3.0) License.
By accessing the work you hereby accept the Terms. Non-commercial uses of the work are permitted without any further permission from Dove Medical Press Limited, provided the work is properly attributed. For permission for commercial use of this work, please see paragraphs 4.2 and 5 of our Terms.