Back to Journals » Diabetes, Metabolic Syndrome and Obesity » Volume 14
Differences in Several Factors in the Development of Erosive Esophagitis Among Patients at Various Stages of Metabolic Syndrome: A Cross-Sectional Study
Authors Sogabe M, Okahisa T, Kurihara T, Kagawa M, Kagemoto K ![]() , Kida Y, Tomonari T, Taniguchi T, Okamoto K, Miyamoto H
, Kida Y, Tomonari T, Taniguchi T, Okamoto K, Miyamoto H ![]() , Sato Y
, Sato Y ![]() , Nakasono M, Takayama T
, Nakasono M, Takayama T
Received 20 December 2020
Accepted for publication 9 March 2021
Published 12 April 2021 Volume 2021:14 Pages 1589—1600
DOI https://doi.org/10.2147/DMSO.S298326
Checked for plagiarism Yes
Review by Single anonymous peer review
Peer reviewer comments 2
Editor who approved publication: Dr Konstantinos Tziomalos
Masahiro Sogabe,1,2 Toshiya Okahisa,1,2 Takeshi Kurihara,2 Miwako Kagawa,2 Kaizo Kagemoto,1 Yoshifumi Kida,1 Tetsu Tomonari,1 Tatsuya Taniguchi,1 Koichi Okamoto,1 Hiroshi Miyamoto,1 Yasushi Sato,1 Masahiko Nakasono,3 Tetsuji Takayama1
1Department of Gastroenterology and Oncology, Tokushima University Graduate School of Biomedical Sciences, Tokushima, Japan; 2Department of Internal Medicine, Shikoku Central Hospital of the Mutual Aid Association of Public School Teachers, Shikokuchuo, Japan; 3Department of Internal Medicine, Tsurugi Municipal Handa Hospital, Tsurugi, Japan
Correspondence: Masahiro Sogabe
Department of Gastroenterology and Oncology, Tokushima University Graduate School of Biomedical Sciences, 3-18-15 Kuramoto-Cho, Tokushima City, Tokushima, 770-8503, Japan
Tel +81-88-633-7124
Fax +81-88-633-9235
Email [email protected]
Background: Erosive esophagitis (EE) is strongly associated with metabolic syndrome (MS), but is not always recognized in individuals with MS and the prevalence of EE in individuals with non-MS is not low.
Aim: To examine the differences in clinical factors associated with EE at various stages of MS, as well as the differences in metabolites between subjects with MS, with and without EE.
Methods: A total of 7,097 persons who underwent health checkups including esophagogastroduodenoscopy were analyzed. We examined the differences in clinical factors for EE among subjects with non-MS, pre-MS, and MS and compared metabolites between 34 subjects with MS, with and without EE.
Results: EE prevalence was significantly higher in the MS and pre-MS groups than in the non-MS group (p < 0.001). EE severity was higher in the MS group than in the pre-MS and non-MS groups (p < 0.001). In the non-MS group, there were significant differences between subjects with and without EE with respect to Helicobacter pylori (H. pylori) and smoking. In the pre-MS and MS groups, there were significant differences in H. pylori, hiatal hernia, and drinking in those with and without EE. The levels of glutamine, hypoxanthine, and lactic acid metabolites were significantly different between subjects with MS, with and without EE (all p < 0.05).
Conclusion: Although H. pylori and lifestyle factors such as smoking and drinking are important for EE, differences in these factors should be considered at various stages of MS. Additionally, several metabolites may be involved in the development of EE in MS.
Keywords: metabolic syndrome, erosive esophagitis, metabolite analysis
Introduction
The incidence of esophageal adenocarcinoma (EAC) has increased markedly in the last few decades.1,2 Barrett’s esophagus (BE), caused by long-standing pathologic exposure to gastroduodenal refluxate, is known to be a precursor lesion of EAC.3–7 Therefore, preventing EE is important for suppressing the onset of BE and EAC. The prevalence of gastroesophageal reflux disease (GERD), including erosive esophagitis (EE), which is strongly associated with obesity and metabolic syndrome (MS), has been increasing in both developed and developing countries including Japan and western countries from 1970 to 1990.8,9 Although obesity and MS are important for onset of EE,10–12 EE is sometimes undiagnosed in individuals with MS and the prevalence of EE in the non-obese population is not low.13 However, there are few reports about EE at various stages of MS and the difference between MS subjects with and without EE. This study aimed to measure the differences in clinical factors associated with EE among subjects with non-MS, pre-MS, and MS, and to measure the differences in metabolites between subjects with MS, with and without EE.
Methods
Study Population and Design
This single-center cross-sectional study was performed at the Shikoku Central Hospital of the Mutual Aid Association of Public School Teachers in Shikoku region, Japan. A total of 14,227 healthy subjects who underwent comprehensive medical surveys, including physical examinations, blood-test screening, and examination of the stomach (esophagogastroduodenoscopy or upper gastrointestinal series) between April 2017 and March 2019 were enrolled. Subjects with a history of digestive tract surgery, who took medications such as H2-receptor antagonists or proton pump inhibitors, or who were diagnosed with gastric or esophageal cancer at the time of esophagogastroduodenoscopy were excluded from this study. The study protocol was approved by our institutional ethics committee, and all procedures were performed in accordance with the Declaration of Helsinki. All subjects were informed that their clinical data might be analyzed retrospectively, and informed consent was obtained.
Diagnosis of MS
We used the Japanese diagnostic criteria for MS.14 The criteria used for diagnosing MS in this study were as follows: waist circumference (WC) greater than 85 cm for males or 90 cm for females, and the presence of two or more of the following: (1) impaired glucose tolerance (IGT): fasting plasma glucose (FPG) ≥110 mg/dL or medication for diabetes; (2) dyslipidemia: triglycerides (TG) ≥150 mg/dl, and/or high-density lipoprotein cholesterol (HDL-C) < 40 mg/dL or medication for dyslipidemia; and (3) hypertension: blood pressure ≥130/85 mmHg or medication for hypertension. In this study, we designated individuals who fulfilled these criteria as the MS group. Individuals who did not fulfill the MS criteria were divided into two groups as follows: the non-MS group was defined as individuals having no MS component; the pre-MS group was defined as individuals having a WC > 85 cm for males or 90 cm for females along with one other component of MS.
Evaluation of H. pylori Infection
Serological Helicobacter pylori (H. pylori) status was assessed using an enzyme-linked immunosorbent assay (Eiken Chemical, Tokyo, Japan). The seropositive antibody titer threshold for H. pylori infection was set at 3 U/mL. An increase in Δ13C values of >2.5‰ by urea breath test (UBT) indicated positive results. In this study, non-H. pylori infection was defined as follows: (1) subjects with H. pylori antibody seronegativity and/or UBT negativity, and no endoscopically atrophic gastritis (AG); (2) subjects who did not undergo a H. pylori antibody test in this study, had no history of eradication therapy, had endoscopically regular arrangement of collecting venules, and absence of AG; and (3) subjects with a history of eradication therapy and confirmed for the absence of H. pylori using UBT. We instituted a strict definition of non-H. pylori infection; therefore, individuals not fulfilling the above criteria were defined to have H. pylori infection in this study.
Assessment of Esophagogastroduodenoscopy
Standard endoscopic examination of the esophagus, stomach, and duodenum was performed by endoscopy specialists from the Gastroenterology Department of our hospital. All examiners had more than 10 years of experience in endoscopy. Esophagogastroduodenoscopy was performed using a conventional single-channel endoscope (GIF-H290, -HQ290, or -H290Z; Olympus, Tokyo, Japan). A hiatal hernia was diagnosed by the presence of a gastric wall above the diaphragmatic hiatus unaccompanied by underlying longitudinally arrayed vessels.15 EE was diagnosed according to the Los Angeles classification system.16 In this study, EE higher than grade A was defined as EE. Endoscopic findings from each subject were validated independently by a double endoscopy specialist.
Serum Metabolomics
Assessments of metabolomics were performed for 34 subjects with MS during 2019 April. The method of liquid chromatography coupled with tandem mass spectrometry (LC-MS/MS) (Nexera UHPLC system with on-line LC-MS 8040, Shimadzu Corporation, Kyoto, Japan) was adopted for the metabolomics. The levels of the target metabolites were determined from the peak areas in mass chromatography, monitoring each mass-to-charge ratio of the individual target, and represented as relative amounts (relative areas) after normalization based on the peak area of the internal standard. In all, 101 primary metabolites including amino acids, organic acids, and so on were measured, and a total of 52 metabolites were obtained from subjects with MS.
Statistical Analysis
Continuous variables were expressed as mean ± standard deviation (SD), and categorical data were expressed as counts, with percentages shown in parentheses. Differences were considered to be statistically significant at P values of less than 0.05. Statistically significant differences in the quantitative data between the two groups were determined using the χ2-test or Mann–Whitney U-test. Statistically significant differences among three groups were determined using the m × n χ2-test or Kruskal–Wallis test. If the Kruskal–Wallis test revealed differences between groups, post hoc pairwise comparisons were performed using the Mann–Whitney U-test with Bonferroni correction. Factors with a significant influence on EE prevalence were determined using univariate analysis. All parameters with P-values <0.05 by univariate analysis were assessed using stepwise multivariate logistic regression analysis. Using a logistic regression model, both odds ratio (OR) and 95% confidence interval (CI) were calculated. Correlations between variables were assessed by calculating Spearman rank correlation coefficients. All statistical analyses were performed using MedCalc Statistical Software for Windows (MedCalc Software; Ostend, Belgium).
Results
Subject Description and Baseline Characteristics Among the Non-MS, Pre-MS, and MS Groups
Supplementary Figure 1 shows the flow diagram of subject enrollment in this study. Of the 14,227 subjects who underwent a regular health checkup between April 2017 and March 2019 at our hospital, we excluded 1,487 subjects referring to individuals who did not get evaluated for MS, 7,130 subjects who did not undergo esophagogastroduodenoscopy or selected the upper gastrointestinal series in substitution for esophagogastroduodenoscopy for the evaluation of the upper gastrointestinal tract, and 125 subjects who fulfilled the other exclusion criteria; the remaining 7,097 subjects were enrolled in the study. The baseline characteristics of the 7,097 subjects are summarized in Table 1. The prevalence of non-MS, pre-MS, and MS groups was 69.2%, 13.6%, and 17.2%, respectively.
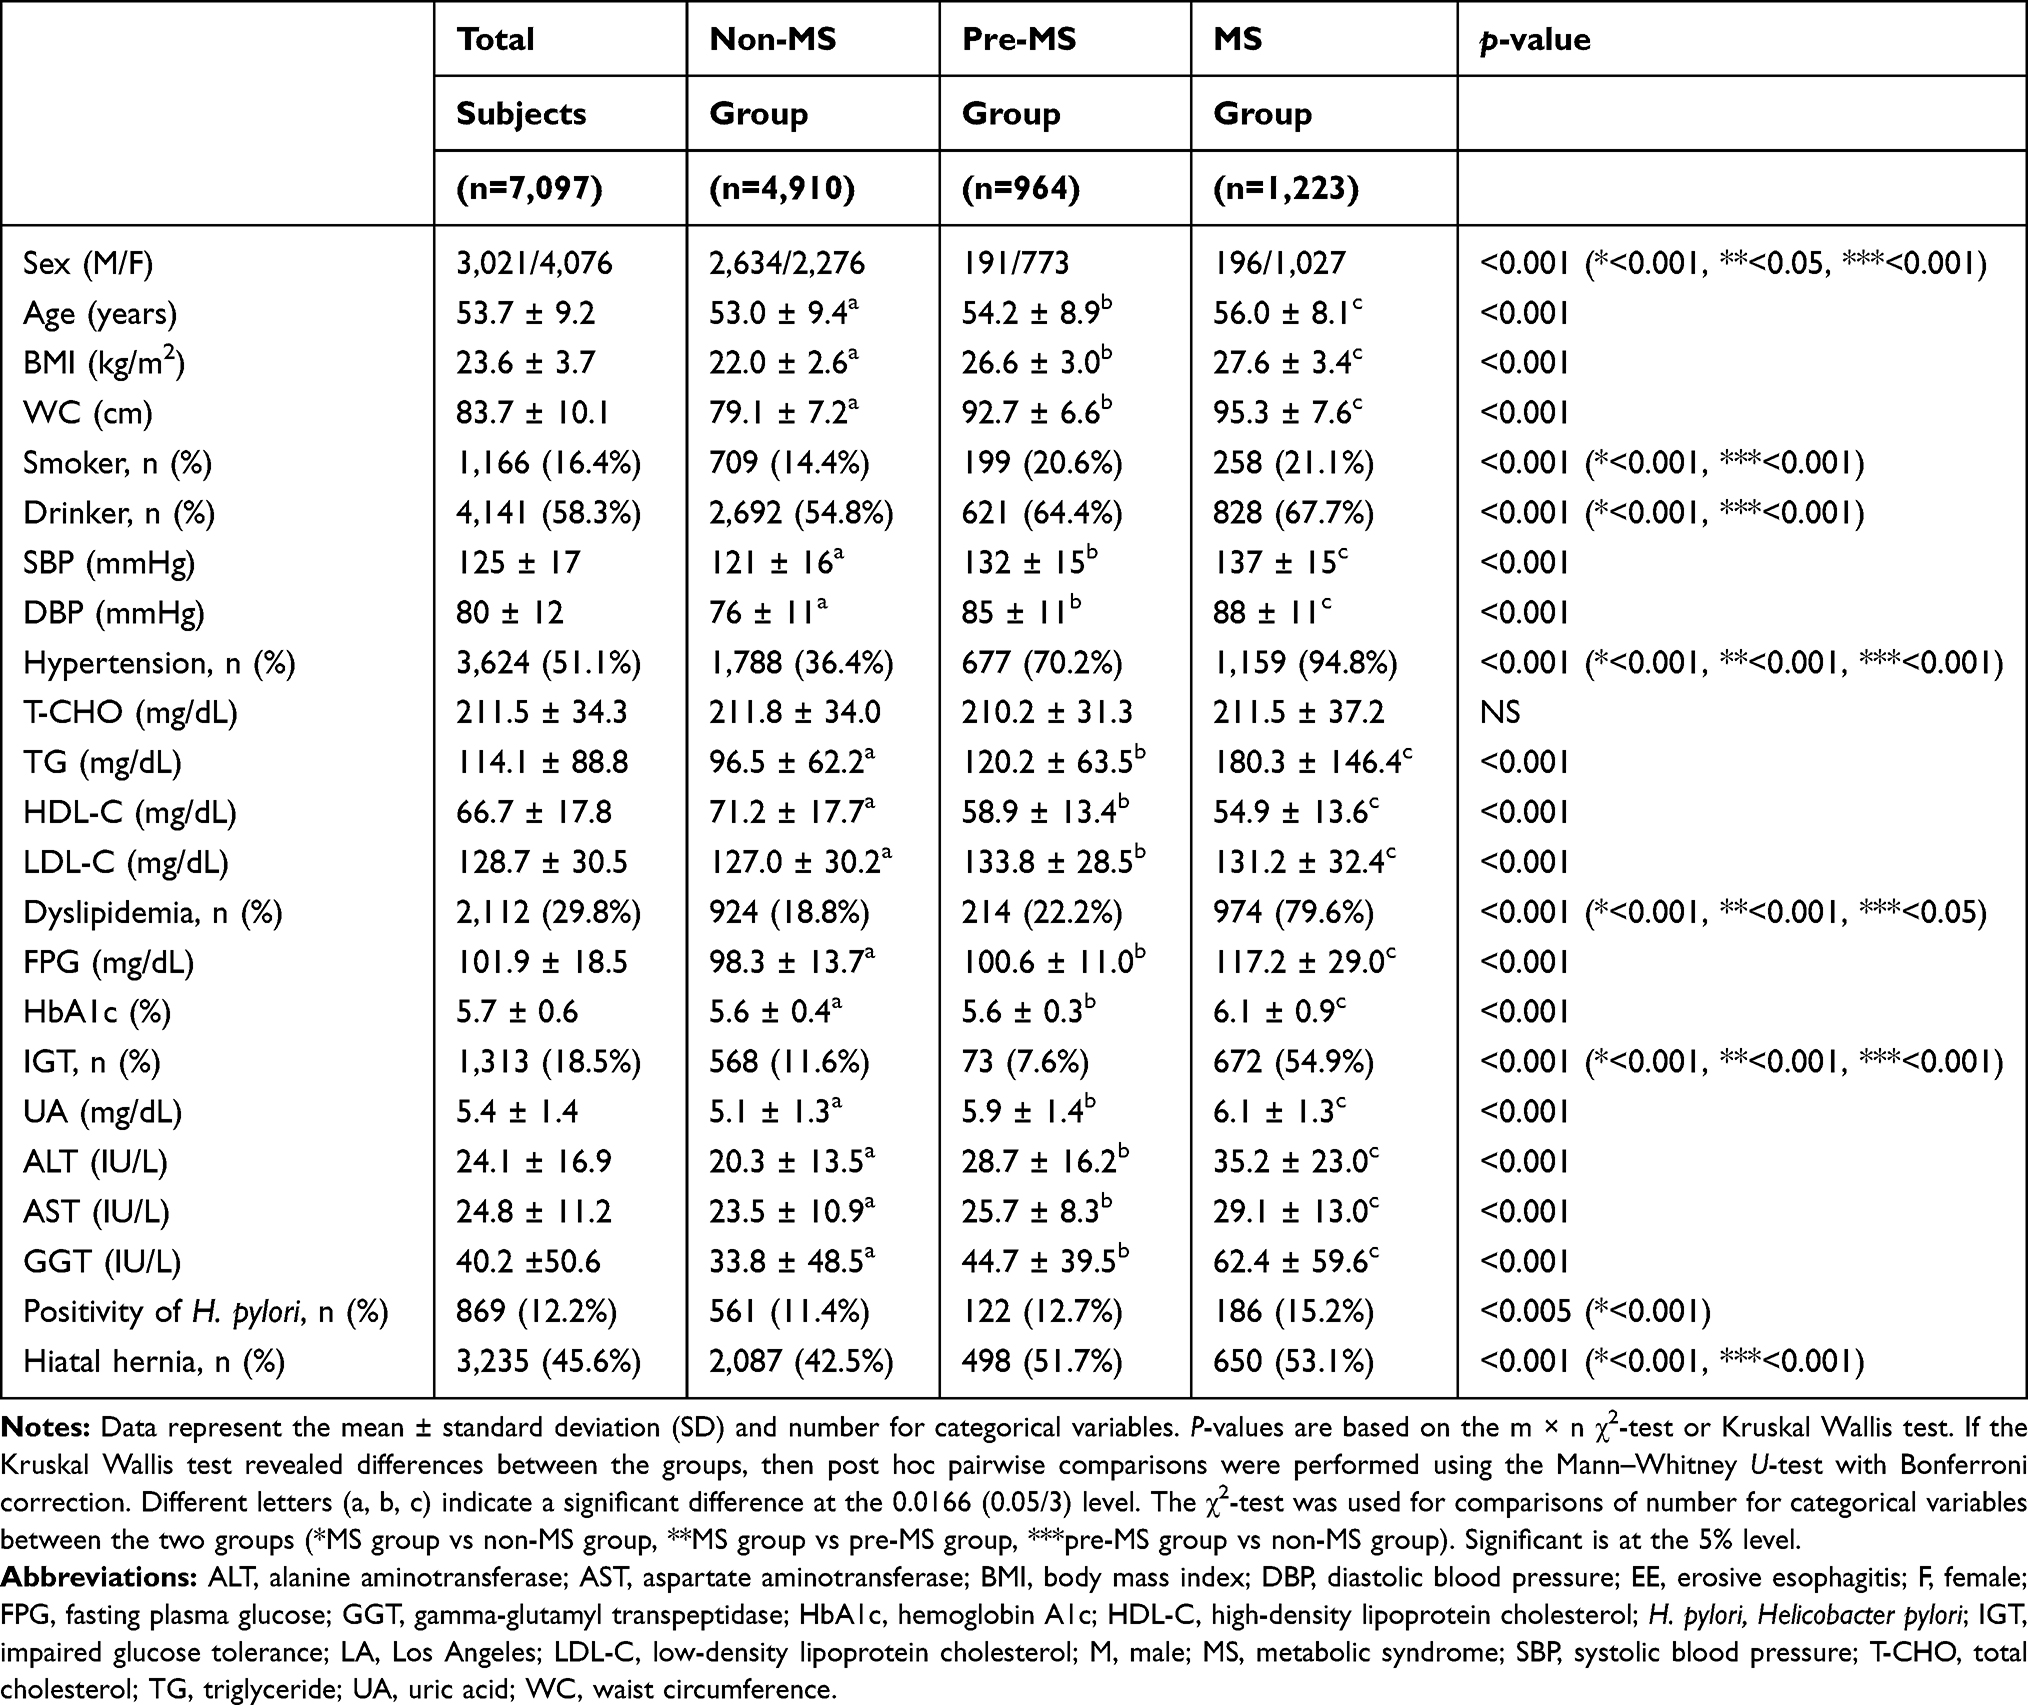 |
Table 1 Baseline Characteristics Among Non-MS, Pre-MS, and MS Groups (n=7,097) |
Comparison of EE Prevalence and Severity Among Non-MS, Pre-MS, and MS Groups
A comparison of EE prevalence and severity among the non-MS, pre-MS, and MS groups is shown in Figure 1. EE prevalence in the non-MS, pre-MS, and MS groups was (722/4,910) 14.7%, (278/964) 28.8%, and (348/1,223) 28.5%, respectively (Figure 1A). There was a significant difference in the prevalence of EE among the three groups (p < 0.001). EE prevalence was significantly higher in the MS and pre-MS groups than in the non-MS group (p < 0.001 and p < 0.001, respectively). The prevalence of grade A, B, C, and D in the non-MS group with EE was 88.7%, 10.5%, 0.8%, and 0%, respectively (Figure 1B). The prevalence of grade A, B, C, and D in the pre-MS group with EE was 85.6%, 12.2%, 1.4%, and 0.7%, respectively. The prevalence of grade A, B, C, and D in the MS group with EE was 79.6%, 16.1%, 4.3%, and 0%, respectively. The ratio of high severity EE was higher in the MS group than in the pre-MS and non-MS groups (p < 0.001 and p < 0.001, respectively).
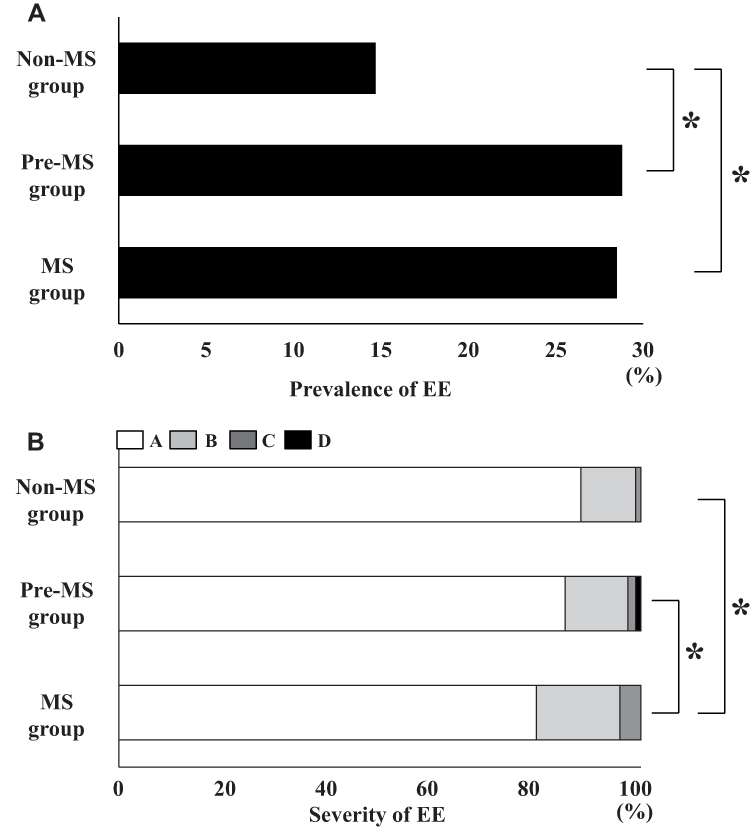 |
Figure 1 Comparison of EE prevalence and severity among the non-MS, pre-MS, and MS groups. (A) Comparison of EE prevalence among the non-MS, pre-MS, and MS groups. (B) Comparison of EE severity among the non-MS, pre-MS, and MS groups. The white bar indicates grade A of EE. The light gray bar indicates the grade B of EE. The dark gray bar indicates the grade C of EE. The black bar indicates the grade D of EE. EE, erosive esophagitis; MS, metabolic syndrome; *P < 0.001. |
Factors Associated with EE in the Non-MS, Pre-MS, and MS Groups
The results of univariate and multivariate analyses for factors associated with EE in the non-MS, pre-MS, and MS groups are summarized in Tables 2–4. Multivariate analysis in the non-MS group showed that sex, age, H. pylori, and smoking were significant independent predictors of EE (Table 2). The odds ratios (ORs) (95% confidence interval (CI), p-value) for EE were as follows: males, 2.147 (1.716–2.687, p < 0.001); age, 1.011 (1.000–1.021, p < 0.05); smoking, 1.616 (1.305–2.001, p < 0.001); and positive for H. pylori, 0.281 (0.193–0.409, p < 0.001). Multivariate analysis in the pre-MS group showed that drinking, H. pylori, and hiatal hernia were significant independent predictors of EE (Table 3). The ORs (95% CI, p-value) for EE were as follows: drinking, 1.413 (1.029–1.940, p < 0.05); positive for H. pylori, 0.508 (0.311–0.829, p < 0.01); hiatal hernia, 1.480 (1.111–1.972, p < 0.01). Multivariate analysis in the MS group showed that age, drinking, TG, H. pylori, and hiatal hernia were significant independent predictors for EE (Table 4). The ORs (95% CI, p-value) for EE were as follows: age, 0.974 (0.957–0.992, p < 0.005); drinking, 1.468 (1.075–2.005, p < 0.05); TG, 1.001 (1.000–1.002, p < 0.05); positive for H. pylori, 0.283 (0.176–0.456, p < 0.001); and hiatal hernia, 1.504 (1.154–1.961, p < 0.005).
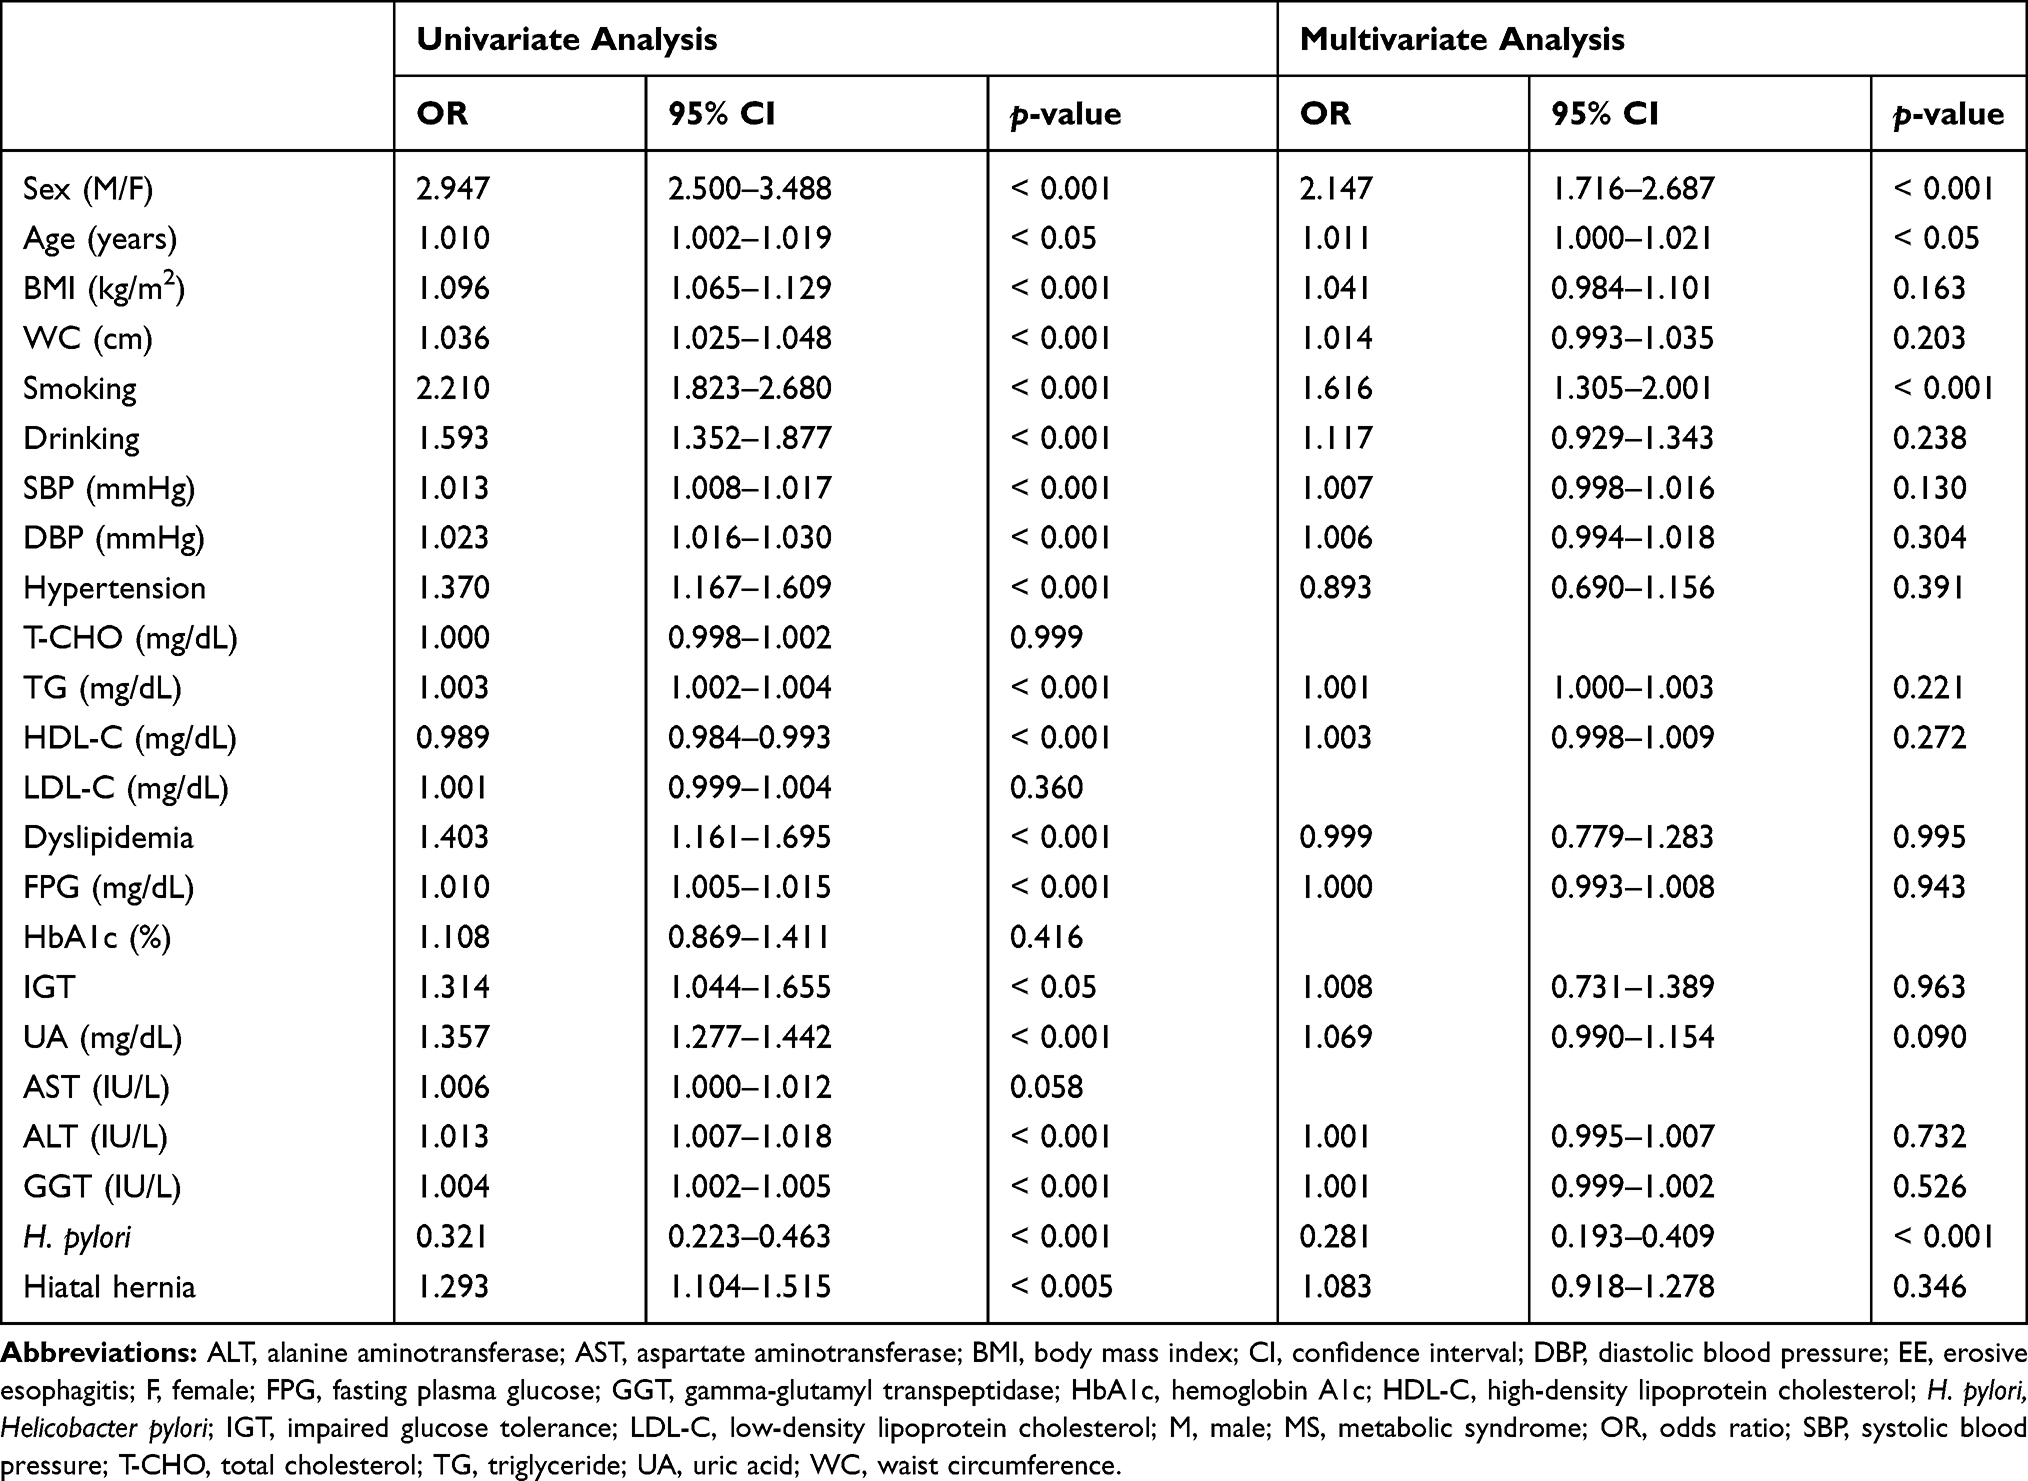 |
Table 2 Univariate and Multivariate Analyses for Factors Associated with EE in the Non-MS Group (n=4,910) |
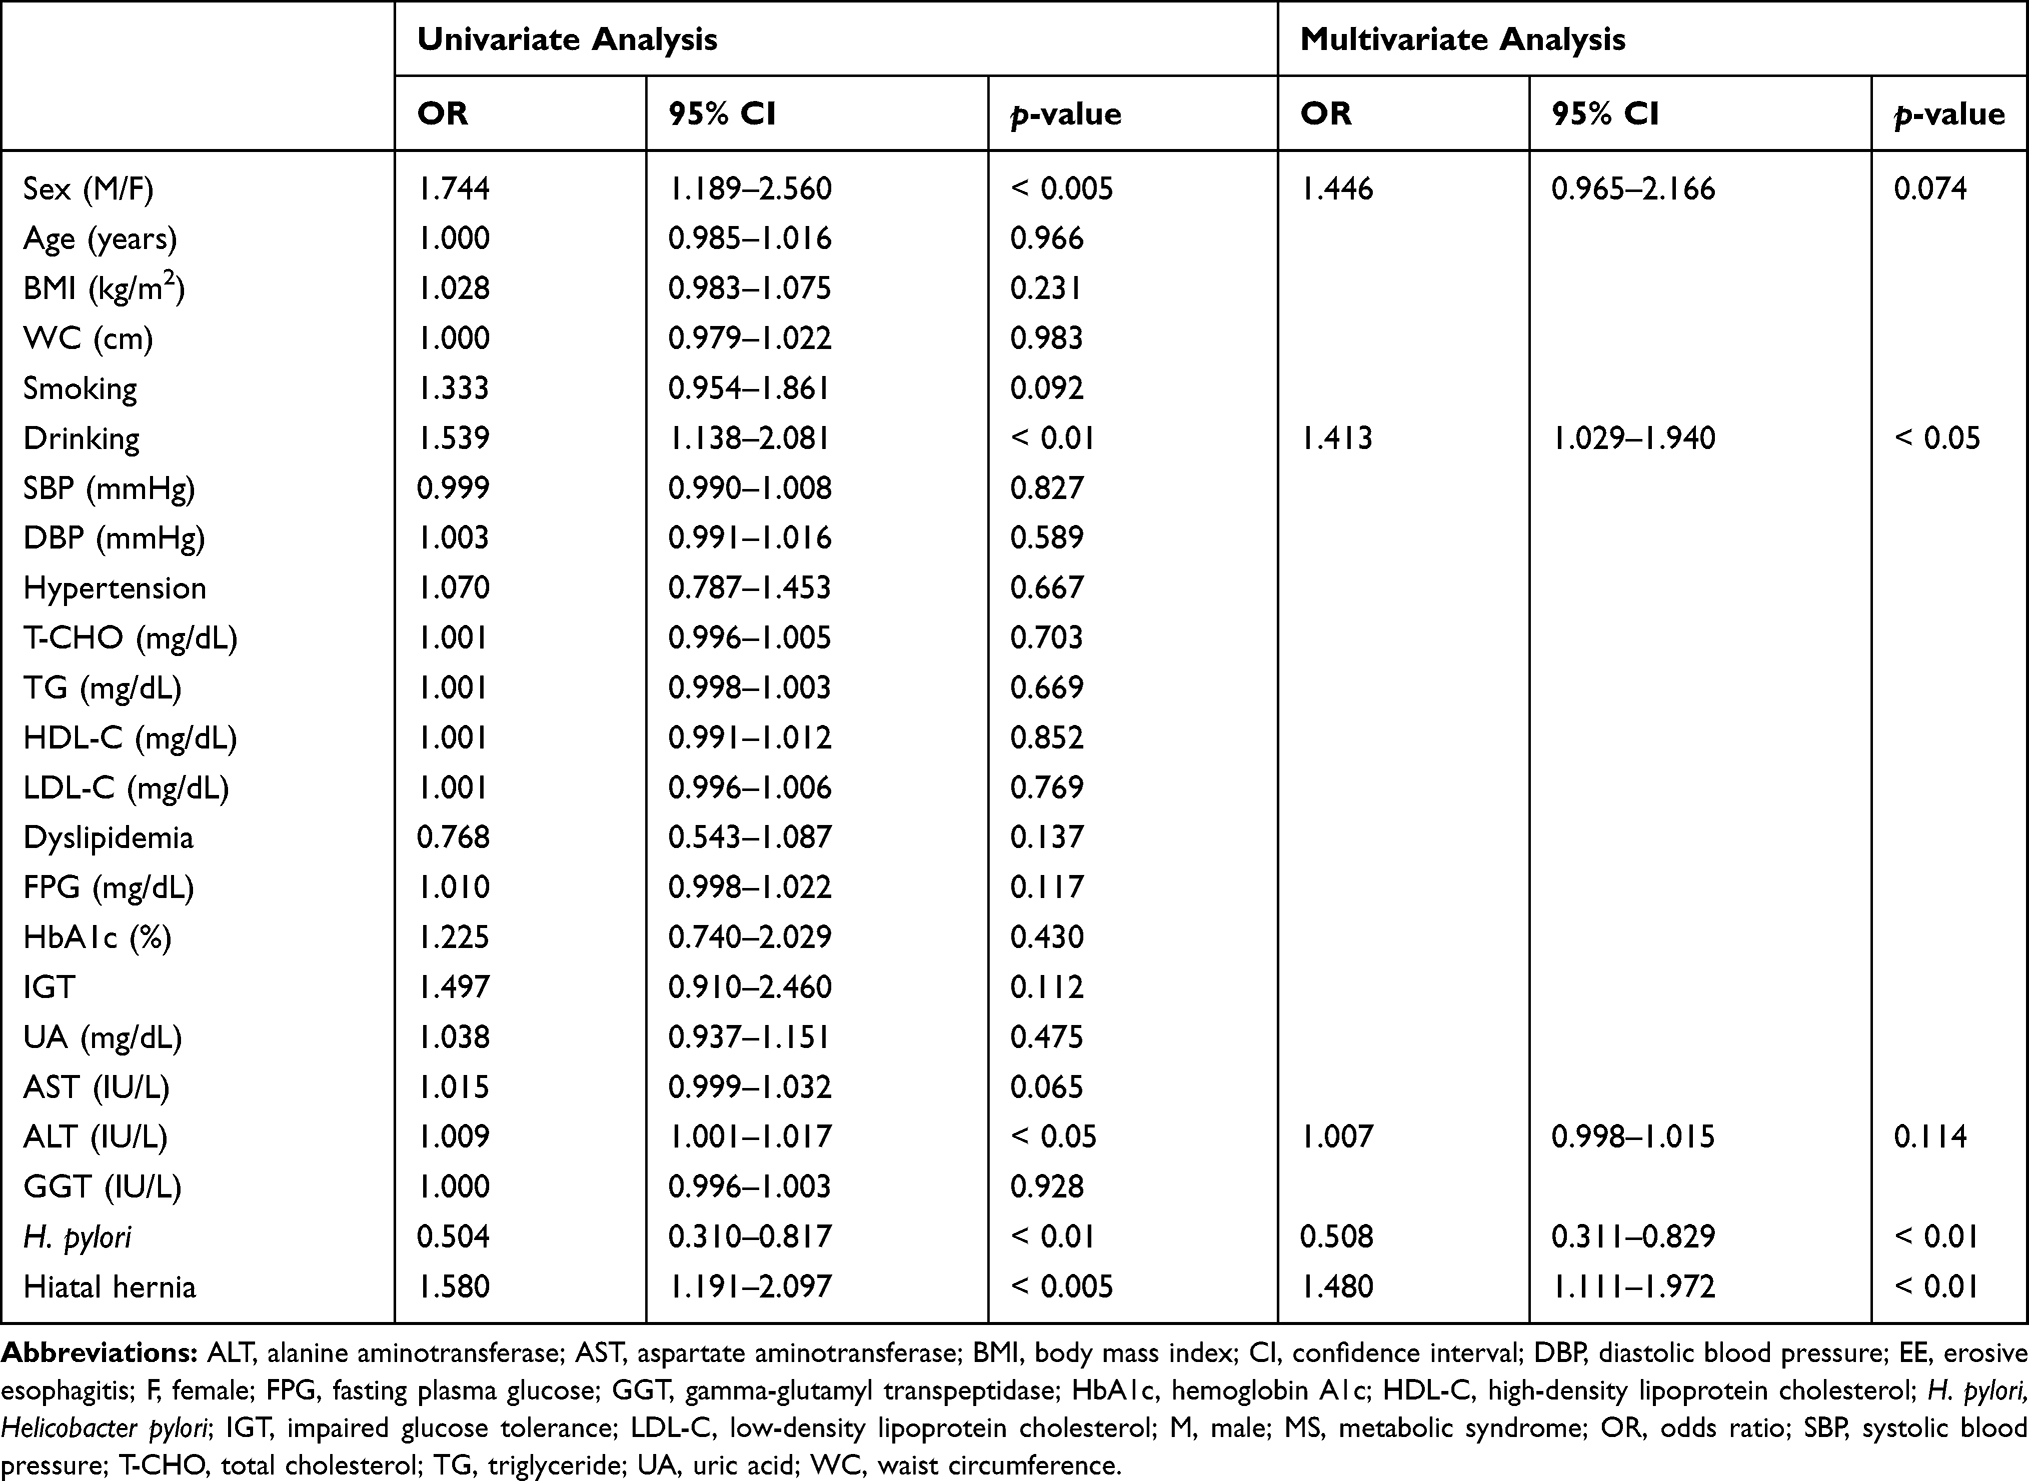 |
Table 3 Univariate and Multivariate Analyses for Factors Associated with EE in the Pre-MS Group (n=964) |
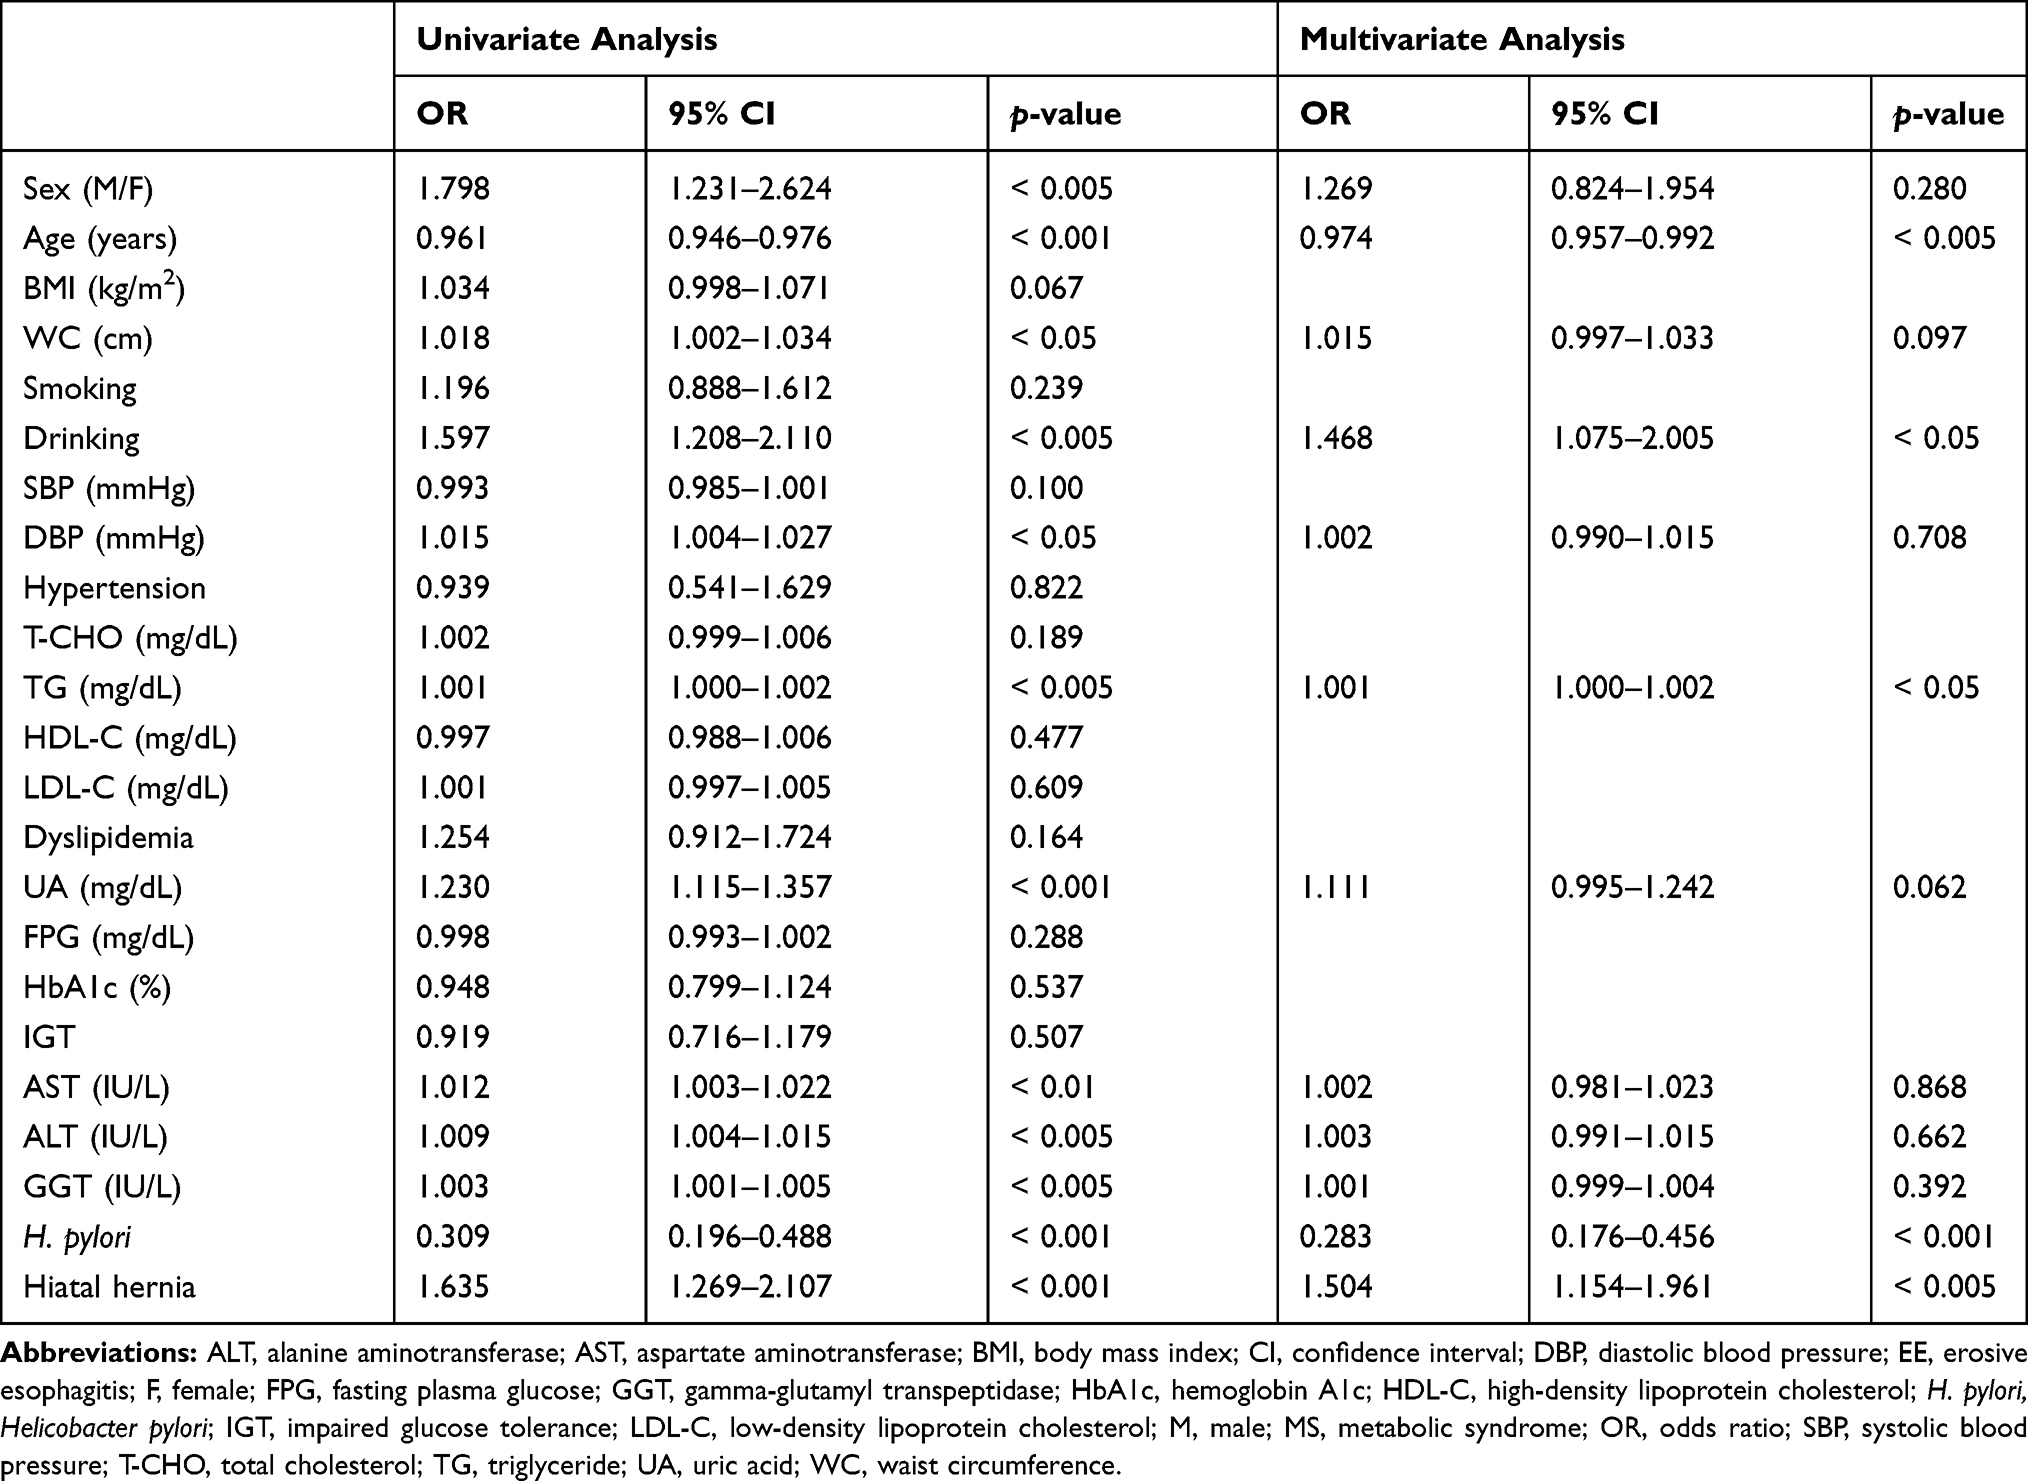 |
Table 4 Univariate and Multivariate Analyses for Factors Associated with EE in the MS Group (n=1,223) |
Comparison of Baseline Characteristics Between 34 Subjects with and without EE in the MS Group
A comparison of the baseline characteristics between 34 subjects with and without EE in the MS group is shown in Supplementary Table 1. There was no significant difference in the baseline factors between the subjects with and without EE.
Comparison of Metabolites Between 34 Subjects with and without EE in the MS Group
A comparison of 52 metabolites between 34 subjects with and without EE in the MS group is shown in Table 5. There were significant differences in three of the 52 metabolites between the subjects with and without EE. The mean glutamine levels in the subjects without EE were significantly higher than those in the subjects with EE (p < 0.05). The mean hypoxanthine and lactic acid levels in the subjects with EE were significantly higher than those in the subjects without EE (p < 0.01 and p < 0.05, respectively).
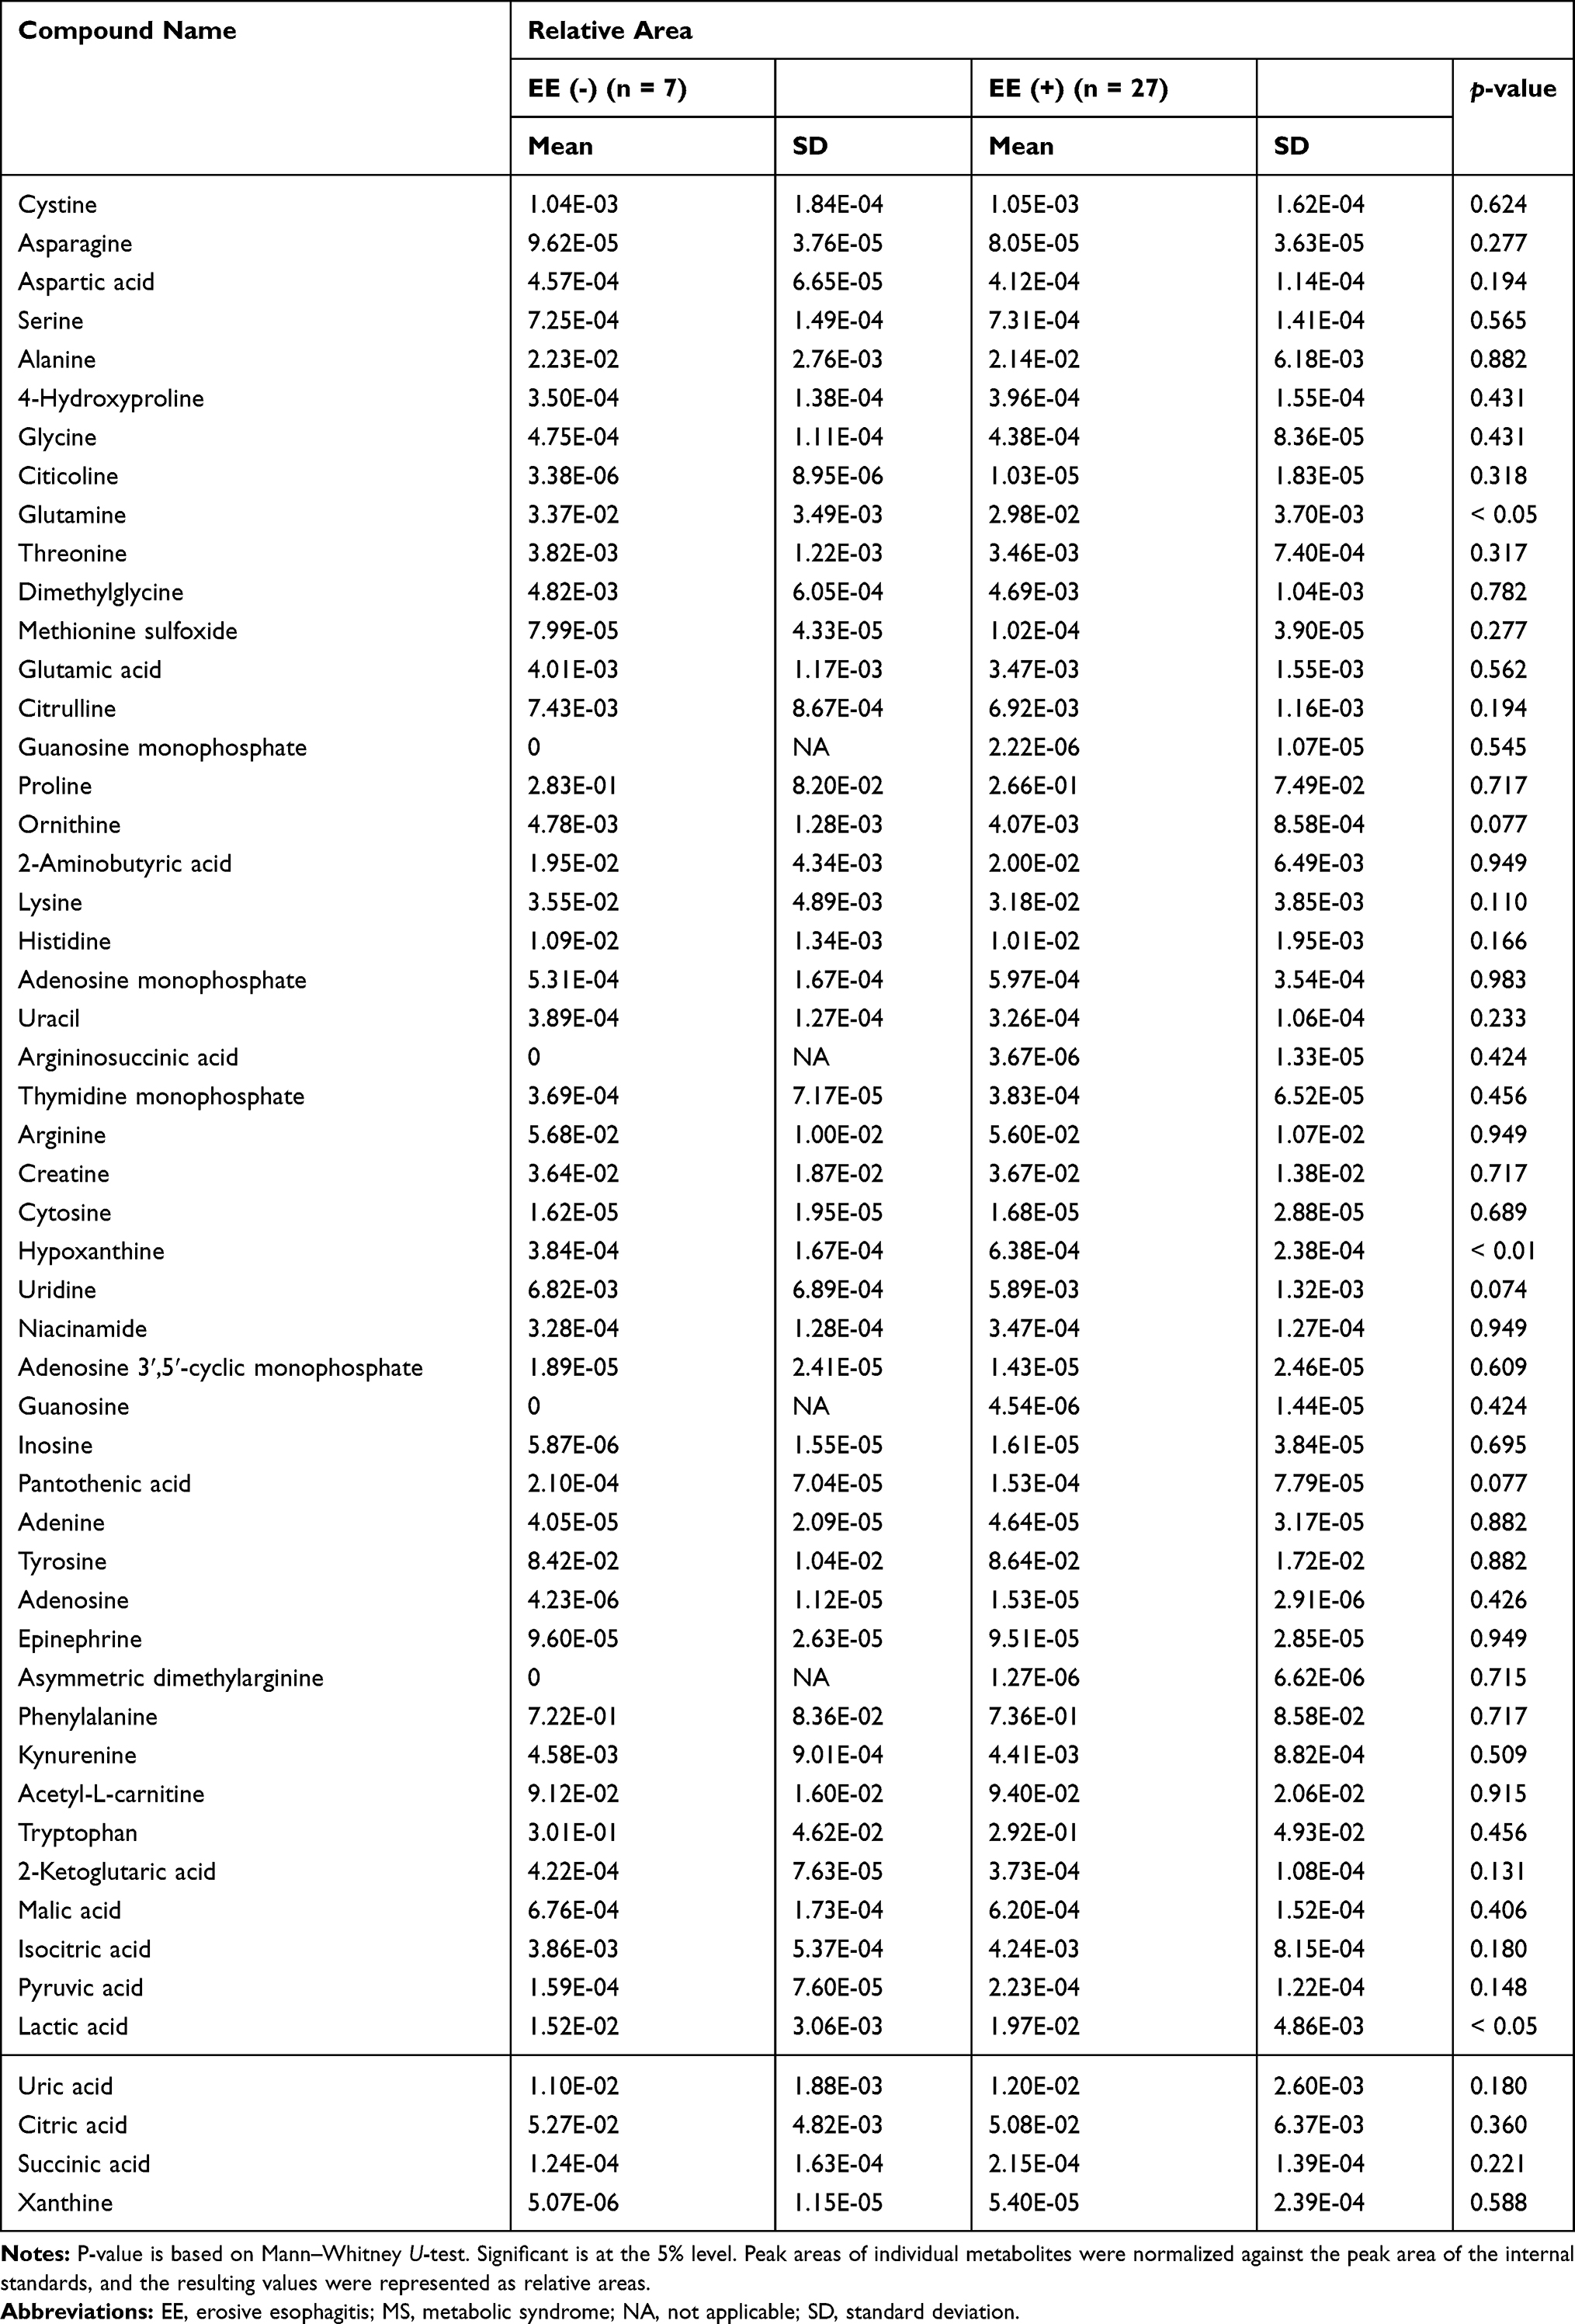 |
Table 5 Comparison of 52 Metabolites Between 34 Subjects with and without EE in the MS Group |
Correlations Between Clinical Parameters and Metabolites Significantly Associated with EE
Spearman rank coefficients for clinical parameters and metabolites with statistically significant differences between subjects with and without EE in the MS group are shown in Table 6. Glutamine levels were significantly correlated with drinking and EE (p < 0.05). Hypoxanthine levels were significantly correlated with smoking, hiatal hernia, and EE (p < 0.05, p < 0.005, and p < 0.05, respectively). Lactic acid levels correlated significantly with EE (p < 0.05).
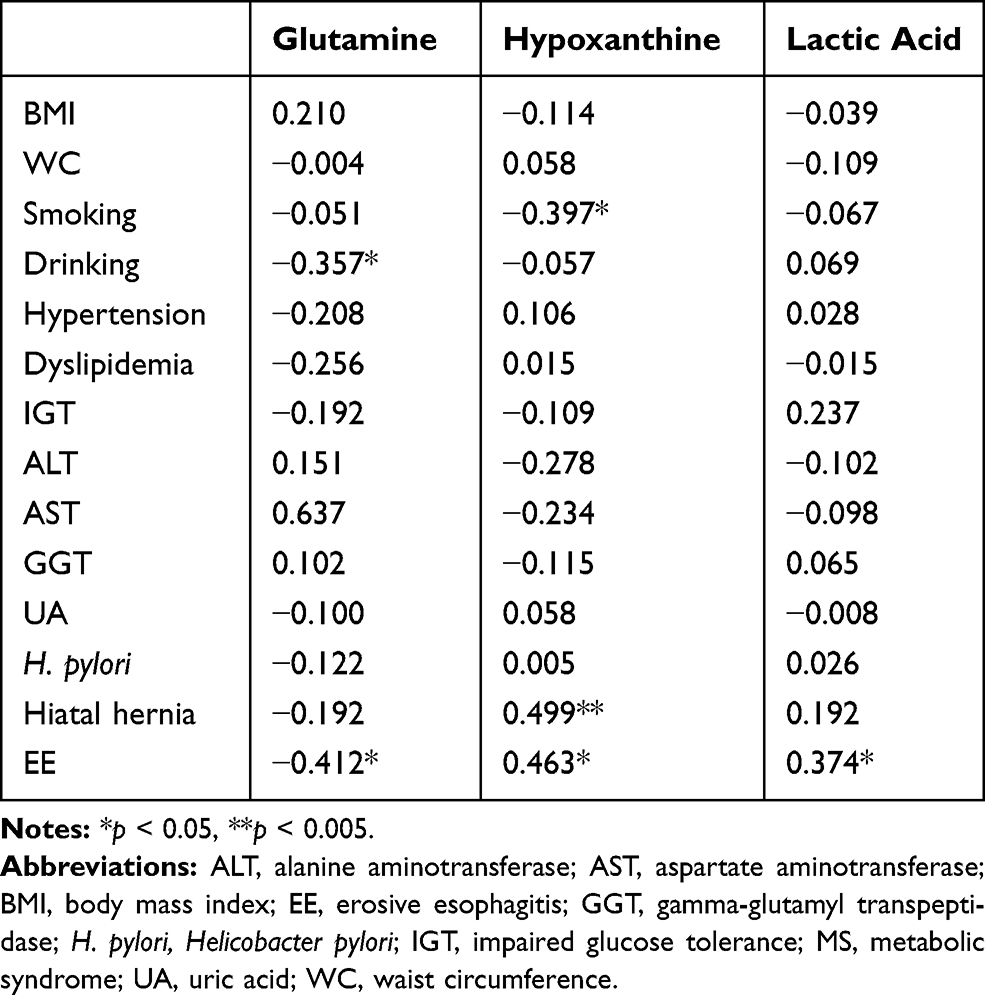 |
Table 6 Spearman Rank Coefficients for Clinical Parameters and Metabolites with Statistically Significant Differences Between Subjects with and without EE in the MS Group |
Discussion
This is the first study to clarify the differences in subjects with EE at various stages of MS as well as measuring the differences in metabolites with respect to EE in the context of medical checkups.
The present study showed that values of physical measurements such as body mass index (BMI) and WC, and almost all factors related to hypertension, dyslipidemia, and IGT were progressively greater in the non-MS, pre-MS, and MS groups, in accordance with previous reports that BMI, WC, blood pressure, HOMA-IR, and other factors increased with the number of MS components.17–19 EE prevalence in the pre-MS and MS-groups was about two times higher than that in the non-MS group. On the contrary, EE prevalence in the non-MS group was 14.7%; as this prevalence was not low,13 this point cannot be ignored. In addition, the ratio of high EE severity increased progressively in non-MS group, pre-MS group, and the MS group; however, independent predictors of EE varied among the three groups. These findings imply that the prevalence, severity, and risk factors for EE differ at various stages of MS.
Smoking is known to decrease lower esophageal sphincter (LES) pressure and affect esophageal defense, which reduces esophageal clearance and saliva secretion, and a number of articles have reported that smoking is a risk factor for EE.20–24 Although the prevalence of smoking in the non-MS group was lower than that in the pre-MS and MS groups in the present study, smoking was a significant factor for EE in the non-MS group. These results suggest that, even in non-obese individuals including the non-MS group, it is necessary to monitor smoking in the context of EE.
Several previous studies have shown that alcohol consumption is a risk factor for GERD. Drinking is considered to be associated with an increase in gastric acid secretion and a decrease in LES pressure.23,25–27 The present study showed that drinking was not a significant factor for EE in the non-MS group whereas it was a significant factor for EE in the pre-MS and MS groups. These results suggest that the influence of alcohol consumption on EE may differ among the non-MS, pre-MS, and MS groups. For example, the difference in the calorie intake by drinking, motility of the digestive tract by IGT, and abdominal fat might have contributed to the results in the present study.28–30
The present study showed that the younger was a significant factor for EE in the MS group. The prevalence of smoking between the young subjects (age <50) and elder subjects (age ≥50) in the MS group was 26.4% and 19.8%, respectively. The prevalence of drinking between the young subjects (age <50) and elder subjects (age ≥50) in the MS group was 73.1% and 66.4%, respectively. Additionally, the prevalence of smoking and drinking in the young subjects (age <50) was significantly higher than in the elder subjects (age ≥50) (all, <0.05). Therefore, the age associated with EE in the MS group might be influenced by lifestyle such as smoking and drinking.
Although the mechanisms controlling the development of hiatal hernia are currently unclear, many studies demonstrated that obesity is an independent risk factor for the development of both hiatal hernia and GERD.31 Additionally, EE was reported to be associated with hiatal hernia in several studies.32,33 The present study, in accordance with previous reports, demonstrated that hiatal hernia was significant and independent risk factors for EE in the pre-MS group and the MS group.
In some previous reports, H. pylori infection in patients with EE was significantly less than that in patients without EE; further, H. pylori serostatus has shown an inverse association with GERD.12,34 This may be caused by ammonia generation, decreased acid production due to gastric atrophy, and a neuroimmunological influence.34 The present study showed that the prevalence of positive H. pylori infection in all subjects with EE (67/1,348, 5.0%) was significantly lower than in all subjects without EE (784/5,749, 13.6%), and that absence of H. pylori was a highly significant predictor of EE in the three groups.
Metabolomics involves the measurement of large numbers of low-molecular-weight metabolites including sugars, amino acids, and hormones. Although several studies have provided insight into the pathogenesis of several cancers,35–41 few studies have investigated the association between metabolomics and GERD, including EE.42 An increase of glutamine in glutaminolysis is a notable feature of tumor cells.43 Under hypoxic conditions, glutamine is converted to glutamate and further to α-ketoglutarate by glutaminase and other enzymes to enable adenosine triphosphate (ATP) production through the tricarboxylic acid cycle.44,45 The present study showed that glutamine levels were significantly lower in subjects with EE than in those without EE. Hypoxic conditions may advance further in subjects with EE than in those without EE in MS. However, there may be no association between hypoxic conditions and the developing from EE to EA because in fact, most patients with EE do not progress to EA. The association between cancer and hypoxanthine varies with the kind of cancer. Hypoxanthine levels were significantly higher in subjects with EE than in those without EE in MS in the present study. Several studies have reported that enzymes associated with the purine biosynthetic pathway are enhanced in tumor cells because purine nucleotides are essential for tumor cell proliferation,46 and an increase in hypoxanthine is thought to most likely reflect an upregulation in purine metabolism due to hypoxia and oxidative stress. We found that the lactic acid levels were significantly higher in subjects with EE than in those without EE. Lactic acid is a known component of the Warburg effect and aerobic glycolysis, and dysregulated lactate metabolism is thought to be one of the hallmarks of carcinogenesis.47 Lactate can serve as an energy source in several cancers, inducing glycolytic enzymes, which leads to an increase in ATP supply. Our results suggest elevation of lactate produced by the aerobic or anaerobic glycolysis pathway in subjects with EE. The metabolomic analysis in the present study identified three metabolites that were significantly correlated with EE in MS. Our results suggest metabolomics should be further investigated as a useful tool during medical checkup.
Several limitations exist in the present study that should be acknowledged. First, the present study is an observational single-center study. Multi-center studies are needed to validate our findings. Second, there was a possibility of selection bias because most of the participants in the present study were healthy individuals without symptoms. Whether hospitalized patients for EE would produce similar results to the present study is not clear. Thirds, the definition of non-H. pylori infection in the present study was strict. Therefore, there was a possibility of false positives for H. pylori infection. Finally, the number of subjects who were investigated with metabolomics was small because metabolomics is not usually included in medical checkups. Therefore, it was difficult to analyze for the severity of EE using these subjects. Further large-scale clinical studies on EE in both patients and healthy individuals will be required in the future.
Conclusion
We demonstrated that the prevalence of EE in the pre-MS and MS groups was higher than that in the non-MS group. The ratio of high EE severity increased progressively in the non-MS, pre-MS, and MS groups. Although H. pylori is a common significant independent predictor of EE, other independent EE predictors were different among the three groups. Lifestyle factors such as smoking and drinking are important for EE, and several metabolites may help identify the risk of EE in individuals with MS.
Abbreviations
AG, atrophic gastritis; ALT, alanine aminotransferase; AST, aspartate aminotransferase; BE, Barrett’s esophagus; BMI, body mass index; DBP, diastolic blood pressure; EAC, esophageal adenocarcinoma; EE, erosive esophagitis; F, female; FPG, fasting plasma glucose; GERD, gastroesophageal reflux disease; GGT, gamma-glutamyl transpeptidase; HbA1c, hemoglobin A1c; HDL-C, high-density lipoprotein cholesterol; H. pylori, Helicobacter pylori; IGT, impaired glucose tolerance; LA, Los Angeles; LES, lower esophageal sphincter; LDL-C, low-density lipoprotein cholesterol; M, male; MS, metabolic syndrome; SBP, systolic blood pressure; T-CHO, total cholesterol; TG, triglyceride; UA, uric acid; UBT, urea breath test; WC, waist circumference.
Ethics and Consent
All subjects were informed that their clinical data might be analyzed retrospectively, and informed consent was obtained. The study protocol was approved by the Ethics Committee in Shikoku Central Hospital of the Mutual Aid Association of Public School Teachers (H28-49), and all procedures were performed in accordance with the Declaration of Helsinki.
Acknowledgments
The authors would like to thank all subjects in our study.
Author Contributions
All authors made a significant contribution to the work reported, whether that is in the conception, study design, execution, acquisition of data, analysis and interpretation, or in all these areas; took part in drafting, revising or critically reviewing the article; gave final approval of the version to be published; have agreed on the journal to which the article has been submitted; and agree to be accountable for all aspects of the work.
Funding
This work was partly supported by Grants-in-Aid for Scientific Research (KAKENHI) (C) to MS from the Japan Society for the Promotion of Science (JSPS; Grant number 16K09057). The funding organizations played no role in the design and conduct of the study; in the collection, management, analysis and interpretation of data; or in the preparation, review and approval of the manuscript.
Disclosure
The authors have no conflicts of interest to declare.
References
1. Bird-Lieberman EL, Fitzgerald RC. Early diagnosis of oesophageal cancer. Br J Cancer. 2009;101(1):1–6. doi:10.1038/sj.bjc.6605126
2. Ferlay J, Shin HR, Bray F, Forman D, Mathers C, Parkin DM. Estimates of worldwide burden of cancer in 2008: GLOBOCAN 2008. Int j Cancer. 2010;127(12):2893–2917. doi:10.1002/ijc.25516
3. Altorki NK, Oliveria S, Schrump DS. Epidemiology and molecular biology of Barrett’s adenocarcinoma. Semin Surg Oncol. 1997;13(4):270–280. doi:10.1002/(SICI)1098-2388(199707/08)13:4<270::AID-SSU9>3.0.CO;2-2
4. Isolauri J, Luostarinen M, Isolauri E, Reinikainen P, Viljakka M, Keyriläinen O. Natural course of gastroesophageal reflux disease: 17–22 year follow-up of 60 patients. Am J Gastroenterol. 1997;92(1):37–41.
5. Cook MB, Coburn SB, Lam JR, Taylor PR, Schneider JL, Corley DA. Cancer incidence and mortality risks in a large US Barrett’s oesophagus cohort. Gut. 2018;67(3):418–529. doi:10.1136/gutjnl-2016-312223
6. Desai TK, Krishnan K, Samala N, et al. The incidence of oesophageal adenocarcinoma in non-dysplastic Barrett’s oesophagus: a meta-analysis. Gut. 2012;61(7):970–976. doi:10.1136/gutjnl-2011-300730
7. Sharma P. Clinical practice. Barrett’s esophagus. N Engl J Med. 2009;361(26):2548–2556. doi:10.1056/NEJMcp0902173
8. Dent J, El-Serag HB, Wallander MA, Johansson S. Epidemiology of gastro-oesophageal reflux disease: a systematic review. Gut. 2005;54(5):710–717. doi:10.1136/gut.2004.051821
9. Fujiwara Y, Arakawa T. Epidemiology and clinical characteristics of GERD in the Japanese population. J Gastroenterol. 2009;44(6):518–534. doi:10.1007/s00535-009-0047-5
10. Nilsson M, Lundegårdh G, Carling L, Ye W, Lagergren J. Body mass and reflux oesophagitis: an oestrogen-dependent association? Scand J Gastroenterol. 2002;37:626–630. doi:10.1080/00365520212502
11. El-Serag HB, Graham DY, Satia JA, Rabeneck L. Obesity is an independent risk factor for GERD symptoms and erosive esophagitis. Am J Gastroenterol. 2005;100(6):1243–1250. doi:10.1111/j.1572-0241.2005.41703.x
12. Park JH, Park DI, Kim HJ, et al. Metabolic syndrome is associated with erosive esophagitis. World J Gastroenterol. 2008;14(35):5442–5447. doi:10.3748/wjg.14.5442
13. Chih PC, Yang YC, Wu JS, Chang YF, Lu FH, Chang CJ. Overweight associated with increased risk of erosive esophagitis in a non-obese Taiwanese population. PLoS One. 2013;8(11):e77932. doi:10.1371/journal.pone.0077932
14. The Examination Committee of Criteria for Metabolic Syndrome. The definition and criteria of metabolic syndrome. J Jpn Soc Intern Med. 2005;94(4):794–809. doi:10.2169/naika.94.794
15. Amano K, Adachi K, Katsube T, et al. Role of hiatus hernia and gastric mucosal atrophy in the development of reflux esophagitis in the elderly. J Gastroenterol Hepatol. 2001;16(2):132–136. doi:10.1046/j.1440-1746.2001.02408.x
16. Armstrong D, Bennett JR, Blum AL, et al. The endoscopic assessment of esophagitis: a progress report on observer agreement. Gastroenterology. 1996;111(1):85–92. doi:10.1053/gast.1996.v111.pm8698230
17. Golabi P, Otgonsuren M, de Avila L, Sayiner M, Rafiq N, Younossi ZM. Components of metabolic syndrome increase the risk of mortality in nonalcoholic fatty liver disease (NAFLD). Medicine. 2018;97(13):e0214. doi:10.1097/MD.0000000000010214
18. Grundy SM, Brewer HB
19. Eckel RH, Alberti KG, Grundy SM, Zimmet PZ. The metabolic syndrome. Lancet. 2010;375(9710):181–183. doi:10.1016/S0140-6736(09)61794-3
20. Thomas GA, Rhodes J, Ingram JR. Mechanisms of disease: nicotine a review of its actions in the context of gastrointestinal disease. Nat Clin Pract Gastroenterol Hepatol. 2005;2(11):536–544. doi:10.1038/ncpgasthep0316
21. Dodds WJ, Dent J, Hogan WJ, et al. Mechanisms of gastroesophageal reflux in patients with reflux esophagitis. N Engl J Med. 1982;307(25):1547–1552. doi:10.1056/NEJM198212163072503
22. Fujiwara Y, Kubo M, Kohata Y, et al. Cigarette smoking and its association with overlapping gastroesophageal reflux disease, functional dyspepsia, or irritable bowel syndrome. Intern Med. 2011;50(21):2443–2447. doi:10.2169/internalmedicine.50.6012
23. Gunji T, Sato H, Iijima K, et al. Risk factors for erosive esophagitis: a cross-sectional study of a large number of Japanese males. J Gastroenterol. 2011;46(4):448–455. doi:10.1007/s00535-010-0359-5
24. Ness-Jensen E, Lagergren J. Tobacco smoking, alcohol consumption and gastro-oesophageal reflux disease. Best Pract Res Clin Gastroenterol. 2017;31(5):501–508. doi:10.1016/j.bpg.2017.09.004
25. Lee SJ, Song CW, Jeen YT, et al. Prevalence of endoscopic reflux esophagitis among Koreans. J Gastroenterol Hepatol. 2001;16(4):373–376. doi:10.1046/j.1440-1746.2001.02464.x
26. Kaltenbach T, Crockett S, Gerson LB. Are lifestyle measures effective in patients with gastroesophageal reflux disease? An evidence-based approach. Arch Intern Med. 2006;166(9):965–971. doi:10.1001/archinte.166.9.965
27. Vemulapalli R. Diet and lifestyle modifications in the management of gastroesophageal reflux disease. Nutr Clin Pract. 2008;23(3):293–298. doi:10.1177/0884533608318106
28. Zhang Q, Horowitz M, Rigda R, Rayner C, Worynski A, Holloway RH. Effect of hyperglycemia on triggering of transient lower esophageal sphincter relaxations. Am J Physiol Gastrointest Liver Physiol. 2004;286(5):G797–G803. doi:10.1152/ajpgi.00383.2003
29. Chung SJ, Kim D, Park MJ, et al. Metabolic syndrome and visceral obesity as risk factors for reflux oesophagitis: a cross sectional case-control study of 7078 Koreans undergoing health check-ups. Gut. 2008;57(10):1360–1365. doi:10.1136/gut.2007.147090
30. Nam SY, Choi IJ, Ryu KH, Park BJ, Kim HB, Nam BH. Abdominal visceral adipose tissue volume is associated with increased risk of erosive esophagitis in men and women. Gastroenterology. 2010;139(6):1902–1911. doi:10.1053/j.gastro.2010.08.019
31. Soricelli E, Casella G, Rizzello M, Calì B, Alessandri G, Basso N. Initial experience with laparoscopic crural closure in the management of hiatal hernia in obese patients undergoing sleeve gastrectomy. Obes Surg. 2010;20(8):1149–1153. doi:10.1007/s11695-009-0056-8
32. Yasuhara H, Miyake Y, Toyokawa T, et al. Large waist circumference is a risk factor for reflux esophagitis in Japanese males. Digestion. 2010;81(3):181–187. doi:10.1159/000235919
33. Murao T, Sakurai K, Mihara S, Marubayashi T, Murakami Y, Sasaki Y. Lifestyle change influences on GERD in Japan: a study of participants in a health examination program. Dig Dis Sci. 2011;56(10):2857. doi:10.1007/s10620-011-1679-x
34. Rajendra S, Ackroyd R, Robertson IK, Ho JJ, Karim N, Kutty KM. Helicobacter pylori, ethnicity and the gastro-oesophageal reflux disease spectrum: a study from the East. Helicobacter. 2007;12(2):177–183. doi:10.1111/j.1523-5378.2007.00489.x
35. Liu YY, Yang ZX, Ma LM, Wen XQ, Ji HL, Li K. 1H-NMR spectroscopy identifies potential biomarkers in serum metabolomic signatures for early stage esophageal squamous cell carcinoma. Peer J. 2019;7:e8151. doi:10.7717/peerj.8151
36. Zhang H, Wang L, Hou Z, et al. Metabolomic profiling reveals potential biomarkers in esophageal cancer progression using liquid chromatography-mass spectrometry platform. Biochem Biophys Res Commun. 2017;491(1):119–125. doi:10.1016/j.bbrc.2017.07.060
37. Zhu ZJ, Qi Z, Zhang J, et al. Untargeted metabolomics analysis of esophageal squamous cell carcinoma discovers dysregulated metabolic pathways and potential diagnostic biomarkers. J Cancer. 2020;11(13):3944–3954. doi:10.7150/jca.41733
38. Dudka I, Thysell E, Lundquist K, et al. Comprehensive metabolomics analysis of prostate cancer tissue in relation to tumor aggressiveness and TMPRSS2-ERG fusion status. BMC Cancer. 2020;20(1):437. doi:10.1186/s12885-020-06908-z
39. Huang S, Guo Y, Li Z, et al. A systematic review of metabolomic profiling of gastric cancer and esophageal cancer. Cancer Biol Med. 2020;17(1):181–198. doi:10.20892/j.issn.2095-3941.2019.0348
40. Zhou J, Shrestha P, Qiu Z, et al. Distinct microbiota dysbiosis in patients with non-erosive reflux disease and esophageal adenocarcinoma. J Clin Med. 2020;9(7):2162. doi:10.3390/jcm9072162
41. Zhang L, Li S. Lactic acid promotes macrophage polarization through MCT-HIF1α signaling in gastric cancer. Exp Cell Res. 2020;388(2):111846. doi:10.1016/j.yexcr.2020.111846
42. Buas MF, Gu H, Djukovic D, et al. Candidate serum metabolite biomarkers for differentiating gastroesophageal reflux disease, Barrett’s esophagus, and high-grade dysplasia/esophageal adenocarcinoma. Metabolomics. 2017;13(3):23. doi:10.1007/s11306-016-1154-y
43. Daye D, Wellen KE. Metabolic reprogramming in cancer: unraveling the role of glutamine in tumorigenesis. Seminars Cell Dev Biol. 2012;23(4):362–369. doi:10.1016/j.semcdb.2012.02.002
44. Zhang A, Sun H, Wang P, Wang X. Salivary proteomics in biomedical research. Clin Chim Acta. 2013;415:261–265. doi:10.1016/j.cca.2012.11.001
45. Zhang X, Xu L, Shen J, et al. Metabolic signatures of esophageal cancer: NMR-based metabolomics and UHPLC-based focused metabolomics of blood serum. Biochim Biophys Acta. 2013;1832(8):1207–1216. doi:10.1016/j.bbadis.2013.03.009
46. Di Virgilio F. Purines, purinergic receptors, and cancer. Cancer Res. 2012;72(21):5441–5447. doi:10.1158/0008-5472.CAN-12-1600
47. San-Millán I, Brooks GA. Reexamining cancer metabolism: lactate production for carcinogenesis could be the purpose and explanation of the Warburg Effect. Carcinogenesis. 2017;38(2):119–133. doi:10.1093/carcin/bgw127
 © 2021 The Author(s). This work is published and licensed by Dove Medical Press Limited. The
full terms of this license are available at https://www.dovepress.com/terms
and incorporate the Creative Commons Attribution
- Non Commercial (unported, 3.0) License.
By accessing the work you hereby accept the Terms. Non-commercial uses of the work are permitted
without any further permission from Dove Medical Press Limited, provided the work is properly
attributed. For permission for commercial use of this work, please see paragraphs 4.2 and 5 of our Terms.
© 2021 The Author(s). This work is published and licensed by Dove Medical Press Limited. The
full terms of this license are available at https://www.dovepress.com/terms
and incorporate the Creative Commons Attribution
- Non Commercial (unported, 3.0) License.
By accessing the work you hereby accept the Terms. Non-commercial uses of the work are permitted
without any further permission from Dove Medical Press Limited, provided the work is properly
attributed. For permission for commercial use of this work, please see paragraphs 4.2 and 5 of our Terms.