Back to Journals » International Journal of Nanomedicine » Volume 19
Dexamethasone-Loaded Lipid Calcium Phosphate Nanoparticles Treat Experimental Colitis by Regulating Macrophage Polarization in Inflammatory Sites
Authors Dong K, Zhang Y, Ji HR, Guan ZL, Wang DY, Guo ZY, Deng SJ, He BY, Xing JF, You CY
Received 28 September 2023
Accepted for publication 20 January 2024
Published 27 January 2024 Volume 2024:19 Pages 993—1016
DOI https://doi.org/10.2147/IJN.S442369
Checked for plagiarism Yes
Review by Single anonymous peer review
Peer reviewer comments 2
Editor who approved publication: Prof. Dr. Anderson Oliveira Lobo
Kai Dong,1,2 Ying Zhang,2 Hong Rui Ji,2 Ze Lin Guan,2 Dan Yang Wang,2 Zi Yang Guo,2 Shu Jing Deng,2 Bin Yang He,2 Jian Feng Xing,2 Cui Yu You1
1Department of Pharmacy, The First Affiliated Hospital of Xi’an Jiaotong University, Xi’an, Shaanxi, People’s Republic of China; 2School of Pharmacy, Xi’an Jiaotong University, Xi’an, Shaanxi, People’s Republic of China
Correspondence: Jian Feng Xing, School of Pharmacy, Xi’an Jiaotong University, 76 Yanta West Road, Xi’an, Shaanxi, 710061, People’s Republic of China, Tel +86-29-82655139, Fax +86-29-82655139, Email [email protected] Cui Yu You, Department of Pharmacy, The First Affiliated Hospital of Xi’an Jiaotong University, 277 Yanta West Road, Xi’an, Shaanxi, 710061, People’s Republic of China, Tel +86-29-85323241, Fax +86-29-85323240, Email [email protected]
Background: The M1/M2 polarization of intestinal macrophages exerts an essential function in the pathogenesis of ulcerative colitis (UC), which can be adjusted to alleviate the UC symptoms.
Purpose: A kind of pH-sensitive lipid calcium phosphate core-shell nanoparticles (NPs), co-loading with dexamethasone (Dex) and its water-soluble salts, dexamethasone sodium phosphate (Dsp), was constructed to comprehensively regulate macrophages in different states towards the M2 phenotype to promote anti-inflammatory effects.
Methods: Dex and Dsp were loaded in the outer lipid shell and inner lipid calcium phosphate (Cap) core of the LdCaPd NPs, respectively. Then, the morphology of NPs and methods for determining drug concentration were investigated, followed by in vitro protein adsorption, stability, and release tests. Cell experiments evaluated the cytotoxicity, cellular uptake, and macrophage polarization induction ability of NPs. The in vivo distribution and anti-inflammatory effect of NPs were evaluated through a 2,4,6-trinitrobenzene sulfonic acid (TNBS)-induced BALB/c mice ulcerative colitis model.
Results: The LdCaPd NPs showed a particle size of about 200 nm and achieved considerable loading amounts of Dex and Dsp. The in vitro and in vivo studies revealed that in the acidic UC microenvironment, the cationic lipid shell of LdCaPd underwent protonated dissociation to release Dex first for creating a microenvironment conducive to M2 polarization. Then, the exposed CaP core was further engulfed by M1 macrophages to release Dsp to restrict the pro-inflammatory cytokines production by inhibiting the activation and function of the nuclear factor kappa-B (NF-κB) through activating the GC receptor and the NF kappa B inhibitor α (I-κBα), respectively, ultimately reversing the M1 polarization to promote the anti-inflammatory therapy.
Conclusion: The LdCaPd NPs accomplished the sequential release of Dex and Dsp to the UC site and the inflammatory M1 macrophages at this site, promoting the regulation of macrophage polarization to accelerate the remission of UC symptoms.
Keywords: ulcerative colitis, calcium phosphate, macrophage polarization, colon targeted delivery system, dexamethasone
Graphical Abstract:

Introduction
Ulcerative colitis (UC) is a chronic and non-specific inflammatory disease involved in the colon and rectum mucosa, characterized by local inflammatory cell infiltration and the aggregation of inflammatory mediators in the local intestine.1 Numerous neutrophils, lymphocytes, and macrophages appear alternately during the development of UC, making the course of UC persistent and recurring, thus seriously affecting the health and quality of patients’ life, and increasing the risk of UC-related cancers.2–5 Currently, there is no cure for UC, and some patients need total colorectal resection.6 Therefore, the treatment of UC has become a thorny clinical issue.
The pathogenesis of UC is related to multiple factors, among which the macrophages at the intestine inflammatory site exert essential functions.7,8 The phenotype and function of intestinal macrophages are constantly changing dynamically.9,10 Various environmental stimuli trigger macrophage polarization in different directions to produce the classical pathway-activated macrophages (M1) and the alternative pathway-activated macrophages (M2).11 Macrophages in intestinal tissues are usually activated and polarized into the M1 phenotype under the stimulation of abnormal intestinal antigens and inflammatory factors to accelerate intestinal mucosa damage.12 The M1 macrophages secrete cytokines, chemokines, and adhesion factors (eg, TNF-α, IL-1β, and IL-12) that destroy the intestinal mucosal barrier to recruit neutrophils to the inflammation site to release proteolytic enzymes that destroy tissue and lead to ulceration, thereby promoting the development of inflammation.13–17 Besides, M1 macrophages also up-regulate the activity of pathogenic type 1 helper T lymphocytes (Th1) to promote the release of inflammatory factors, thus disrupting the balance between Th1 and Th2 to aggravate the intestinal inflammatory response.18 Nevertheless, when the microenvironment of the colonic inflammation site is conducive to the M2 polarization, it can polarize the macrophage to the M2 phenotype, which not only secrete high levels of anti-inflammatory factors, such as IL-10, etc., to inhibit the proliferation and activation of T cells and downregulate immune response, but also secrete growth factors to promote the fibroblast proliferation and angiogenesis, including transforming growth factor-β (TGF-β), vascular endothelial growth factor (VEGF) and epidermal growth factor (EGF), thus playing an anti-inflammatory role in the late phase of inflammatory response to promote the repair of damaged mucosa, ultimately relieving the UC symptoms.19,20 Research showed that the mechanism of some drugs against experimental colitis might be related to the regulation of M1/M2 polarization of macrophages.21 Since there are no precise and effective treatment strategies for UC patients, regulating the macrophages’ M1/M2 polarization will become a novel macrophage-centered treatment strategy and provide a broad prospect for UC therapy.
Currently, medication is one of the main treatment methods for UC.22 Glucocorticoids (GC) and aminosalicylic acids (ASA) are the classic drugs for the clinical treatment of UC, and GC can treat moderate to severe UC that are ineffective against ASAs.23–27 The binding of GC to its receptor can inhibit the signal conduction and activation of inflammatory transcription factors, including nuclear factor kappa B (NF-κB) and activator protein-1 (AP-1), thus inhibiting the inflammatory mediators’ generation to produce anti-inflammatory and immune suppressive effects.28,29 For the NF-κB signaling pathway involved in the M1 polarization, GC can inhibit the activation of NF-κB by enhancing the gene transcription of NF-suppressor protein α (I-κBα) to up-regulate the I-κBα level to inhibit the activation of NF-κB.30,31 Meanwhile, the activated GC receptors can directly interact with the activated NF-κBp65 to block the bond between NF-κB and the target DNA, ultimately inhibiting the M1 polarization of macrophages and alleviating the inflammatory response of UC by restraining the NF-κB activation.32 Moreover, the anti-inflammatory effect of GC is also related to its ability to induce M2 polarization.33,34 Dexamethasone (Dex) is a highly effective anti-inflammatory GC, while the dose-time-dependent side effects and complications (eg, adrenal cortex necrosis, diarrhea, emaciation) caused by the long-term use of Dex are unacceptable.35 Therefore, unique design thoughts should be introduced into the construction of Dex preparations so that the drugs can effectively reach the lesion site to exert anti-inflammatory effects and reduce the adverse reactions caused by systemic absorption.
The application of nanomaterials as the carriers can achieve the targeted delivery of anti-UC drugs (eg, GC, ASA) to the colonic lesion, thereby improving their efficacy and effectively reducing their toxic side effects.36,37 Calcium phosphate (CaP) is a well-known biomaterial with high biocompatibility and biodegradability.38 The CaP nanoparticles (NPs) have been extensively investigated for many biomedical applications, such as tumor therapy,39 bone regeneration,40 and dentistry,41 due to their versatility in encapsulating many types of therapeutic compounds, including small molecule drugs, siRNA, DNA, and peptides.42–44 CaP NPs are readily stable at neutral pH but soluble at low pH,45 which makes them suitable to maintain stability in the neutral bloodstream after intravenous administration (i.v). When accumulating in the colonic inflammation site by the enhanced permeability and retention effect (EPR), the CaP NPs are easily engulfed by M1 macrophages, and rapidly degrade and release drugs in the acidic intracellular environment. Furthermore, calcium ions can form stable chelates with various acid radical ions (phosphate, acetate, etc.) through coordination bonds, which enable CaP NPs to encapsulate large amounts of Dex salts containing these anhydride ions in their cores.46 Moreover, since CaP NPs are usually modified with phospholipid to maintain their structure stability,47 the hydrophobic Dex can be directly loaded into the lipid layer of CaP NPs, thus forming a dual drug co-loaded nanosystem, which can achieve sequential release of Dex and Dex salts to the inflammatory tissue and macrophages of the UC lesion to achieve the comprehensive regulation of macrophage polarization.
Therefore, based on the assumption of regulating the M1/M2 polarization strategy of colonic macrophages in the treatment of UC and the application characteristics of CaP NPs, this study constructed a CaP-based drug delivery system that could not only target the colonic inflammation site to release Dex directly but also been phagocytosed by macrophages located in this region, finally achieving the comprehensive M1/M2 polarization regulation to treat UC.48–50 To this end, by preparing the pH-sensitive lipid calcium phosphate core-shell nanoparticles (NPs), LdCaPd, Dex was loaded onto the outer pH-sensitive lipid layer of LdCaPd, while the dexamethasone sodium phosphate (Dsp) was loaded into the inner CaP NPs of LdCaPd (Figure 1). After i.v., LdCaPd NPs accumulated in the colonic inflammation site by EPR effect. The Dex was first released to the acidic inflammatory tissue due to the pH-responsive dissociation of the outer lipid layer to construct a microenvironment that polarizes monocyte-macrophages directly to the M2 phenotype. Then, the inner CaP NPs were further engulfed by the inflammatory M1 macrophages to release Dsp via the pH-responsive dissociation of CaP. Dsp inhibits the activation and function of NF-κB by activating GC receptors and upregulating I-κBα levels, respectively, finally reversing the pro-inflammatory M1 macrophages to the anti-inflammatory M2 macrophages to exert the therapeutic effect on UC (Scheme 1) In conclusion, this study achieved the extensive regulation of macrophage polarization in the UC lesion site by simultaneously regulating the microenvironment for macrophages polarization and directly reversing M1 macrophages polarization, thus providing new research thoughts and methods on UC therapy.
 |
Scheme 1 Schematic illustration of the release behavior and action mechanism of LdCaPd NPs in the inflamed colon tissue and macrophage. |
 |
Figure 1 Schematic illustration of the preparation of LdCaPd NPs. |
Experimental Methods
Materials
Dexamethasone (Dex), dexamethasone sodium phosphate (Dsp), cyclohexane, and calcium chloride (CaCl2) were purchased from Aladdin Chemistry Co. Ltd. (Shanghai, China). 1.2-dioleoyl-sn-glyceryl-3-phosphatidic acid (DOPA), 1.2-Dioleoyl-3-trimethylammonium propane (DOTAP), cholesterol, and DSPE-PEG2000 were purchased from the Avanti Polar Lipids Co. Ltd. (New Jersey, USA). Fetal bovine serum (FBS), DMEM, and McCoy’s 5A culture medium were purchased from Gibco Co. Ltd. (Massachusetts, USA). The CCK-8 assay kit, TNF-α ELISA assay kit (TNF-α, IL-1β, IL-10, Arg-1, and TGF-β1) were purchased from Beyotime Biotechnology Co. Ltd. (Shanghai, China). The anti-mannose receptor/CD206 rabbit pAb, FITC conjugated goat anti-rabbit IgG, nitric oxide synthase (iNOS) rabbit polyclonal antibody, Cy3 conjugated goat anti-rabbit IgG and the Western blotting assay related reagents were purchased from the Servicebio Co. Ltd (Wuhan, China). All other reagents were analytical grade and obtained from commercially available sources.
Cells and Animals
The HT-29 human colon cancer cell line and RAW264.7 mouse monocyte-macrophage leukemia cell line were purchased from the Cell Bank of Shanghai, Institute of Biochemistry and Cell Biology, Chinese Academy of Sciences (Shanghai, China). Cells were cultured in the DMEM medium under fully humidified conditions (37°C with 5% CO2), supplemented with 10% FBS, 100IU/mL penicillin, and 100 mg/mL streptomycin sulfate. Cells could be used in experiments when they were in the logarithmic phase of growth. Male BALB/c mice (20 ± 2 g) were obtained from the laboratory animal center of Xi’an Jiaotong University. Mice had ad libitum access to water and food under controlled temperature (20–25°C) and relative humidity conditions (50–60%). Moreover, mice were quarantined for one week before treatment. The animal care and experimental protocols were in strict accordance with the guidelines of the laboratory animal center of Xi’an Jiaotong University and approved by the institutional animal care and use committee of Xi’an Jiaotong University (No. XJTULAC 2019–068).
Construction of LdCaPd NPs
The construction of LdCaPd NPs involved two steps: first, the CaP NPs loaded with Dsp (CaPd NPs) were prepared. Second, the CaPd NPs were used as the template to prepare the LdCaPd NPs to load Dex via the hydrophobic forces. In the preparation of CaPd NPs, the Igepal CO-520 and cyclohexane were first mixed uniformly in a ratio of 29:71 (v/v) to prepare the oil phase, which was then mixed with CaCl2 solution (2.5 M, 300 μL) to establish the emulsion A. The Dsp (200 μg) and Na2HPO4 solution (500 mM, pH 9) were also dispersed in another oil phase (10 mL) constructed by Igepal CO-520 and cyclohexane with stirring, followed by adding DOPA (20 mM, 200 μL) to form emulsion B. The emulsion A was slowly added to emulsion B and stirred for 1 h, followed by adding absolute ethanol (20 mL) and standing for 1 h to demulsify, which was then centrifuged at 10,000 g (15 min) to separate the precipitation. The precipitation was washed repeatedly with absolute ethanol to obtain CaPd NPs.
In the preparation of LdCaPd NPs, the CaPd NPs were dispersed in CHCl3 (1 mL), then mixed with a certain amount of Dex, 70 µL of the mixture of DOTAP and cholesterol (20 mM, nDOTAP: ncholesterol = 1:1), and DSPE-PEG2000 (3 mM, 100 µL) in CHCl3 (5 mL). The CHCl3 was then removed by rotary evaporation, and the deionized water was added for hydration to obtain the LdCaPd NPs, which were preserved after freeze-drying. During the fabrication process, the concentration of Dsp and Dex, the calcium/phosphorus mol ratio (Ca/P ratio), and the stirring speed significantly influenced the formation of CaPd and LdCaPd NPs. Therefore, a series of single-factor experiments were performed to explore the above factors’ influence on the appearance of CaPd and LdCaPd NPs. Furthermore, the drug-loading coefficient (DL%) and entrapment efficiency (EE%) were calculated by the following equations, respectively:


Where Wt represented the weights of Dsp or Dex in the LdCaPd NPs; Ws represented the weights of all components in the LdCaPd NPs. W0 represented the weights of the feeding Dsp or Dex. Furthermore, the rhodamine B-loaded calcium phosphate NPs (CaPRB NPs) and fluorescein isothiocyanate (FITC) - rhodamine B co-loaded LFCaPRB NPs were prepared according to the above methods, which were employed in the cellular uptake assay.
Characterization
The in vitro detection methodology of Dex and Dsp was shown in the supporting information (Supplementary Material 1. Experimental Methods). The particle size, Zeta potential, and polydispersity index (PDI) of LdCaPd NPs were tested by dynamic light scattering (DLS) using a Malvern Zetasizer Nano ZS (Malvern Instruments, Malvern, UK). Transmission electron microscope (TEM, Talos F200X, ThermoFisher Scientific, USA) and scanning electron microscope (SEM, ZEISS Gemini 500, Carl Zeiss, Germany) were used to investigate the morphological features of LdCaPd NPs. The energy dispersive spectrometer (EDS) analysis was performed on LdCaPd NPs to analyze the elemental composition in their structures qualitatively. Furthermore, to investigate the interaction between drug and carrier and the existence form of drugs in NPs, the freeze-dried blank calcium phosphate NPs, CaPd NPs, LdCaPd NPs, CaCl2, Dex, Dsp, and the physical mixture of raw materials were detected by X-ray photoelectron spectroscopy (XRD, AXIS Supra, Shimadzu KRATOS, Japan). The scanning speed was 2°/min, and the scanning range was 10° - 60°.
Protein Adsorption Test
20 mg CaPd NPs or LdCaPd NPs were suspended in 4 mL of pH 7.4 PBS containing bovine serum protein (BSA, 2.0 mg/mL), then stirred at 25°C for 96 h. The solution was filtered by a 0.22 mm syringe at predetermined times, and the amount of protein adsorbed by NPs was calculated by the difference in protein concentration before and after adsorption analyzed by UV spectrometer at the wavelength of 280 nm.
In vitro Stability and Release Tests
The in vitro stability of LdCaPd NPs was evaluated by DLS. Briefly, The LdCaPd NPs solution was stored at room temperature for 7 d. The particle sizes and Zeta potential were measured daily by a Malvern Zetasizer Nano ZS. The data were recorded and analyzed to evaluate the storage stability of the LdCaPd NPs. In the in vitro release study, the CaPd NPs and LdCaPd NPs were suspended in PBS with different pH values (pH 5.5 and pH 7.4), then immersed in a dialysis bag (MWCO 8–10 kDa) and dialyzed against a PBS release medium with the corresponding pH value at 37 °C under sink conditions and moderate shaking. All the release medium was withdrawn and replenished with an equal volume of fresh medium at predetermined time intervals. The collected release medium was measured by high-performance liquid chromatography (HPLC) to detect the concentration of the released Dsp and Dex at each time point. The experiment was repeated three times, and the results at each time point were the relative value, which was the ratio of the tested value to the initial value.
Cytotoxicity
The cytotoxicity of LdCaPd NPs on RAW 264.7 and HT-29 cells was evaluated by the CCK8 assay. Specifically, cells in the logarithmic growth phase were digested with 0.25% trypsin-EDTA solution and pipetted into single suspended cells, followed by counted on a hemocytometer to adjust the cell density to 5×10⁴ cells/mL with culture medium (the RAW 264.7 cells were adjusted by DMEM and the HT-29 cells were adjusted by McCoy’s 5A). Then, cells were seeded in 96-well plates with a density of 5×10³ cells per well and continued to be incubated for 24 h. The LdCaPd NPs and CaPd NPs solutions were diluted with culture media (for RAW 264.7 cells, diluted with DMEM, for HT-29 cells, diluted with McCoy’s 5A) into different concentrations (For LdCaPd NPs, the sum of the concentrations of Dsp and Dex in LdCaPd NPs was set as the incubation concentration, For CaPd NPs, the concentrations of Dsp in CaPd NPs was set as the incubation concentration) and filtered through a 0.22 μm cellulose acetate filter. Then, the culture medium was replaced by the fresh medium containing NPs of different concentrations and continued culturing for another 24 h. Finally, the culture media were replaced by FBS free medium (100 μL) containing 10% CCK8 (v/v), which could form water-soluble orange and yellow formazan products in the presence of electron coupling vector 1- Methoxyphenazine methosulfate (PMS). After coincubation for 2 h, the absorbance was measured at the wavelength of 450 nm using a microplate reader (ELX808, BioTek, USA) to determine the cell viability by comparing untreated cells. In this part, the Dsp was also used as the positive control, and its treatment method was the same as that of the LdCaPd and CaPd NPs.
Cellular Uptake
The LPS (100 ng/mL) stimulated and unstimulated RAW 264.7 cells were seeded separately in the 12-well plates containing coverslips and incubated overnight. Then, the culture medium was replaced by the fresh medium containing free rhodamine B, rhodamine B-loaded calcium phosphate NPs (CaPRB NPs), and fluorescein isothiocyanate (FITC) - rhodamine B co-loaded LCaP NPs (LFCaPRB NPs) and continue culturing for another 12 h. After that, coverslips with cells were taken off and washed with ice-cold PBS to remove free dyes. The final samples were analyzed by an inverted fluorescence microscope (Leica DMIL, Germany). The ImageJ software (National Institutes of Health, USA) was used to analyze the fluorescence in each image semi-quantitatively.
Investigation of the Effect of LdCaPd NPs on Macrophage Polarization
To investigate whether LdCaPd NPs could induce the M2 polarization of macrophages, the RAW 264.7 cells were seeded in 12-well plates at 2×10⁵ cells/well and incubated overnight. Then, the culture medium was replaced by the fresh medium containing Dsp, or LdCaPd NPs incubated for 24 h. Macrophages were fixed, permeabilized, and blocked with 4% paraformaldehyde/0.5% Triton/10% BSA protocol. Anti-mannose receptor/CD206 rabbit pAb was incubated, followed by FITC conjugated goat anti-rabbit IgG. Then, the nuclei were counterstained with DAPI, and observed by an inverted fluorescence microscope (Leica DMIL, Germany). Moreover, the iNOS rabbit polyclonal antibody and Cy3 conjugated goat anti-rabbit IgG were stained using the same methods. The positive cell number of CD206 was counted using Image J software.
To investigate whether LdCaPd NPs could reverse the M1 polarization of macrophages, RAW 264.7 cells were seeded in 12-well plates at 2×10⁵ cells/well and incubated overnight. Then, cells were stimulated with LPS (100 ng/mL) for 12 h. After that, the LPS culture medium was replaced by the fresh medium containing Dsp or LdCaPd NPs (the sum of the concentrations of Dsp and Dex in LdCaPd NPs was set as the incubation concentration, which was equal to the concentration of Dsp, namely 100 nM) and incubated for 24 h. Cells were washed with ice-cold PBS and collected, followed by incubation with PE rat anti-mouse CD86, APC rat anti-mouse CD206, and FITC rat anti-mouse CD11b antibody label M1 and M2 phenotypes of macrophages, respectively, and analyzed by flow cytometry (FACSCalibur, BD, USA). The data was processed with the Flowjo 10.6 software. Moreover, the reversal degree of the M1 polarization of LPS-induced macrophages by LdCaPd NPs was also verified by observing the immunofluorescence expressions of CD206 and iNOS. Furthermore, to verify that LPS-induced M1 polarization leads to the acidification of the colonic microenvironment, thus facilitating the pH-responsive release of LdCaPd NPs, RAW 264.7 cells (5 × 10⁵ cells/well) were incubated with LPS (100 ng/mL) for 24 h, and the effect of M1 polarization induced by LPS on the pH values of the inflammatory tissue microenvironment was verified by detecting changes in the color and pH values of the culture medium.
To investigate the effects of LdCaPd NPs on the inflammatory cytokines’ expression, RAW 264.7 cells were first stimulated with LPS (100 ng/mL) for 12 h to construct the in vitro inflammatory cell models. The LPS-stimulated and unstimulated cells were seeded separately in 6-well plates at 4×10⁵ cells/well incubated overnight. Then, the culture medium was replaced by the fresh medium containing Dsp or LdCaPd NPs (the sum of the concentrations of Dsp and Dex in LdCaPd NPs was set as the incubation concentration, which was equal to the concentration of Dsp, namely 100 nM), and incubated for 24 h. After the culture medium was aspirated and centrifuged, the expression of inflammatory factors and protein (TNF-α, IL-1β, IL-10, and Arg-1) in the supernatant of the medium was determined by enzyme-linked immunosorbent assay (ELISA).
qRT-PCR
The mRNA levels of NF-κB and I-κBα were evaluated by qRT-PCR. RAW 264.7 cells stimulated with lipopolysaccharide (LPS, 100 ng/mL) were seeded in 6-well plates at the density of 1×10⁵ cells/well and incubated overnight. The culture medium was replaced by the fresh medium containing Dsp or LdCaPd NPs (the sum of the concentrations of Dsp and Dex in LdCaPd NPs was set as the incubation concentration, which was equal to the concentration of Dsp, namely 100 nM), and incubated for 24 h. Then, the total RNA was isolated from cells by the TRIzol reagent (Invitrogen, Carlsbad, California, USA), followed by measuring its concentration using a NanoDrop spectrometer (ND-2000, Thermo Scientific, USA). The qRT-PCR was performed on a CFX96 real-time PCR detection system (Bio-Rad, Hercules, California, USA) by using TB Green Premix Ex Tag II (TaKaRa Bio Inc., Japan) with 25 μL reaction mixtures. The relative mRNA expression levels of NF-κB and I-κBα were calculated by specific primers normalized to GAPDH according to the 2−ΔΔCt method (enlisted in Table S1).
In vivo Distribution and Pharmacokinetic Studies
Construction of Experimental Colitis Model Induced by TNBS
Mice were fasted for 24 hours but kept free drinking water before modeling. After mice were lightly anesthetized with ether, the ulcerative colitis model was established by enema administration with 2.5% 2,4,6-trinitrobenzene sulfonic acid (TNBS) solution (dissolved in 50% ethanol). Mice were hung upside down, and TNBS solution was slowly injected into the colon of the mice through the anus with a blunt head gavage needle. After maintaining the upside-down state for a few seconds, the mice were placed in the cage. The enema dose of each mouse was 0.1 mL, and the mice in the control group were injected with an equal volume of normal saline by enema administration.
Distribution of LdCaPd NPs in Mice with Experimental Colitis
The in vivo distribution study employed FITC-labeled LFCaP NPs to explore the in vivo distribution characteristics of LdCaPd NPs. Specifically, using FITC marked DSPE-PEG2000 instead of DSPE-PEG2000 to prepare the LFCaP NPs according to the method in Construction of LdCaPd NPs. Male mice were randomly divided into three groups (n = 3 per group): (1) inducing experimental colitis model by TNBS and i.v. with the LFCaP NPs solution (0.1 mL); (2) inducing experimental colitis model by TNBS and i.v. with the FITC solution (0.1 mL); (3) normal control and i.v. with the LFCaP NPs solution (0.1 mL). After 1 h, the in vivo fluorescence distribution of FITC was observed with an IVIS imaging system (LumazoneFA2048, Teledyne Photometrics, USA). Then, mice were sacrificed, and the colon and other organs were harvested and separated for further verification of the distribution of different preparations in these organs.
Pharmacokinetics Study in Rats
The in vivo methodological HPLC study was shown in the supporting information (Supplementary Material 1. Experimental Methods). In the pharmacokinetics study, male rats were randomly divided into two groups (n = 6 per group): the LdCaPd NPs-treated group and the Dsp-treated group. The given dose was 6 mg/kg according to the concentration of Dsp, administered via the tail vein. Blood samples were drawn from the jugular vein at time points of 5 min, 15 min, 30 min, 45 min, 1 h, 2 h, 4 h, 8 h,12 h. Each sample was immediately centrifuged (12,000 rpm, 10 min) followed by the collection of supernatant plasma (100 mL). Subsequent operations are carried out according to the plasma sample processing method in the supporting information, and the final supernatant (100 μL) was taken for HPLC analysis. The Phoenix WinNonlin software (v5.2, Certara, USA) was used for the calculation of pharmacokinetic parameters.
Anti Experimental Colitis Study
The mice experimental colitis model was induced according to the procedure in Construction of Experimental Colitis Model Induced by TNBS. Mice in the control group received normal saline instead of TNBS solution. 40 male mice were randomly divided into 4 groups: (1) control-no colitis induced (injected intravenously (i.v.) with the saline, n = 10); (2) TNBS (i.v. with the saline, n = 10); (3) TNBS + Dsp (i.v., 0.5 mg/kg, n = 10); (4) TNBS + LdCaPd NPs (i.v., the drug concentration in LdCaPd NPs was the sum of the Dsp and Dex concentrations, which was equal to the concentration of Dsp, namely 0.5 mg/kg, n = 10). From the second day after modeling (Day 1), mice were administered twice every other day (Day 1 and 3), and the mice were sacrificed on the 6th day. During the experiment, the body weight changes of the mice in each group were recorded. The mice’s feces were collected daily to measure the measuring fecal occult blood. The evaluation criteria of fecal occult blood level are shown in Table S2. Moreover, the fecal occult blood index was combined with bodyweight change and fecal character to calculate the disease activity index (DAI) score, whose scoring standard was manifested in Table S3.
At the end of the experiment, the mice’s blood samples were collected under isoflurane anesthesia. Then, the mice were sacrificed to excise the entire colons. The colon length of each mouse was measured, followed by washing them with precooled saline. The cleaned colon tissues were divided into two parts. One part was homogenized, followed by detecting the myeloperoxidase (MPO) activity, superoxide dismutase (SOD), and malondialdehyde (MDA) with corresponding assay kits, detecting inflammatory cytokines with corresponding ELISA assay kits and performing the Western blotting assay on the quantitative expression of NF-κB p65, pNF-κB p65, I-κBα, and pI-κBα. For the Western blotting assay, proteins were extracted from the colon tissue homogenate and quantified by BCA protein assay kits. The calibrated amounts of proteins were separated by sodium dodecyl sulfate-polyacrylamide gel electrophoresis (SDS-PAGE) gel and blotted onto a polyvinylidene fluoride (PVDF) membrane. Protein blots were blocked with 5% nonfat milk for 2 h at room temperature, then incubated with corresponding primary antibodies (NF-κB p65, pNF-κB p65, I-κBα, and pI-κBα) overnight, followed by incubated with appropriate secondary antibodies for 2 h at room temperature. The protein bands were developed by a chemiluminescence imaging system (ChemiDoc XRS+, Bio-Rad, USA) and quantitative protein band density with ImageJ software. Moreover, the other part of the isolated colon tissue was fixed with 4% paraformaldehyde and used for histopathological observation and immunohistochemistry investigation. Specifically, after being fixed with paraformaldehyde, the colon tissue was embedded in paraffin and sectioned. All the tissue sections were stained with hematoxylin and eosin (H&E) for histopathological observation and histological scoring (the scoring standards were described in the supporting information: Supplementary Material 1. Experimental Methods). Moreover, the colon tissue sections were also taken for immunohistochemistry to investigate the effect of LdCaPd NPs on macrophage polarization (marking CD86 and CD206) in inflammatory colon tissue.
Safety Evaluation
The blood compatibility of LdCaPd NPs was evaluated by the hemolysis test. The whole blood from the sacrificed rats was mixed with heparin, then centrifuged (2000 r/min, 5 min) to collect the red blood cells, followed by preparing the isotonic red blood cell PBS suspension (2%, v/v). The LdCaPd NPs solution was diluted with PBS to 30, 60, 90, 120, and 150 μg/mL gradient concentrations. LdCaPd NPs solution (3 mL) with different concentrations was mixed with the prepared red blood cell suspension, and then incubated water bath (37 °C) for 4 h. After centrifuging at 2000 r/min for 5 min, the absorbance of the supernatant of each experimental group was measured at 540 nm with UV-vis. The negative and positive controls were the isotonic phosphate buffer and deionized water. The hemolysis ratio (HR) of NPs is calculated according to the following equation:

Where Asample, Anegative and Apositive are the absorbance values of the sample group, negative control group, and positive control group at the wavelength of 540 nm, respectively. The biocompatibility of LdCaPd NPs was also evaluated by the histological investigation during the anti-experimental colitis study, namely that at the end of the treatment, other major organs (heart, liver, spleen, lung, and kidney) in each group were also taken out, followed by fixed with 4% paraformaldehyde and used for H&E staining and histopathological observation.
Statistical Analysis
In this work, the experimental data were presented as mean ± SD and statistically analyzed by one-way ANOVA and LSD test using SPSS Statistical Software (v.22; IBM, Chicago, IL, USA). p < 0.05 was statistically significant.
Results and Discussion
Preparation of LdCaPd NPs
This study delivered Dex and Dsp to the site of colitis and inflammatory macrophages, respectively, to regulate macrophage polarization via the LdCaPd NPs due to the essential role of macrophage polarization in the development of UC. The DOPA-modified CaP NPs were first fabricated by the reverse microemulsion method to load Dsp. Then, the CaPd NPs were employed as the template, whose hydrophobic lipid layer (in the structure of DOPA) self-assembled with the hydrophobic parts of the cationic phospholipids, DOTAP, and DSPE-PEG2000 to load Dex, and forming the final NPs (Figure 1).
During the fabrication process, multiple factors affected the final morphology and function of LdCaPd NPs. The influences of stirring speed, calcium/phosphorus (Ca/P) molar ratio, and dosages of Dsp on the fabrication of the CaPd NPs are shown in Figure S1. The stirring speed greatly impacted the fabrication of CaPd NPs, because stirring the inverse microemulsion would cause the fusion and division between microemulsion particles. The faster-stirring rate resulted in a greater particle dispersion degree, thus helping to form the uniform and dispersed NPs. As shown in Figure S1A, the particle size and PDI decreased with increased stirring speed. The phosphate ion in the DOPA microemulsion reacts with calcium ions to generate CaP NPs. Therefore, controlling the calcium/phosphorus (Ca/P) mol ratio is crucial for the formation and particle size distribution of CaPd NPs. From Figure S1B, the small Ca/P mol ratio tended to form large NPs, and the latter would create a visible settlement. However, when the Ca/P mol ratio increased, the particle size of CaPd NPs decreased significantly, and the distribution was more uniform, indicating that increasing the Ca2+ concentration is conducive to forming a more uniform nanosystem. Moreover, the phosphate in the structure of Dsp could react with Ca2+ to enhance the loading efficiency of Dsp. Therefore, the effects of different Dsp dosages on the morphology and loading efficiency of CaPd NPs were investigated. From Figure S2A and B, the increased Dsp dosage within a certain range showed no significant effect on the particle sizes of NPs. However, when the feeding amount was raised to 400 μg, the loading capacity of CaPd NPs reached saturation, and the drug loading efficiency did not increase significantly with the continuous feeding increase. During the fabrication of LdCaPd NPs, the hydrophobic tail of DOPA phospholipids in the CaP NPs extended outward, which was then self-assembled with the hydrophobic parts of the DOTAP phospholipids and DSPE-PEG2000 under hydration conditions, simultaneously loading Dex onto the lipid hydrophobic layer. Therefore, the effects of different dosages of Dex on the morphology and loading efficiency of LdCaPd NPs were also investigated. From Figure S2C and D, the morphology of NPs did not change significantly with the increase in Dex dosage. At the same time, the drug loading capacity rate reached saturation when the dosage exceeded 200 μg to saturation. Therefore, when the stirring speed was 700 rpm, the Ca/P mol ratio was 100, the dosages of Dsp and Dex were 200 µg, the final parameters were listed as follows: particle size: 197.8 ± 1.14 nm; Zeta potential: 39.36 ± 6.26 mV; PDI: 0.18 ± 0.02; EEDsp: 47.95% ± 10.43; DLDsp: 7.99% ± 1.74; EEDex: 57.64% ± 10.51; DLDex: 10.06% ± 2.08.
Characterization
The in vitro detection methodology of Dex and Dsp was shown in the supporting information (Supplementary Material 2. Results, data were shown in Figures S3–S5, Tables S4–S6), all the data demonstrated that the constructed analysis method could achieve the quantitative analysis of Dex and Dsp. The morphology and structure of LdCaPd NPs fabricated by the optimized preparation method were further characterized by TEM and SEM. The TEM images showed that the DOPA-wrapped CaPd NPs were a spheroid-like structure (Figure 2A). Moreover, the core-shell structure of LCaPd NPs was formed after being modified with DOTAP and DSPE-PEG2000 (Figure 2B). After loaded with Dex, no difference occurred in the morphology and volume between LCaPd NPs and LdCaPd NPs (Figure 2C), indicating the weak effect of Dex on the morphology of final NPs. The SEM results also demonstrated that the three kinds of NPs showed uniformly dispersed spherical structures, and the particle sizes gradually increased with the addition of the positively charged lipid phosphate (Figure S6A–C). The particle sizes and Zeta potentials from CaPd NPs to LdCaPd NPs exhibited a gradually increasing trend due to the wrapping of the positively charged phospholipid materials (Figure S7). The EDS results revealed that the main elements in CaP NPs were Ca, O, and P, and the Ca/P ratio was 1.32, which was closer to the Ca/P ratio described in the references (Figure S8).51 The XRD analysis verified the interaction between drug and carrier and the existence form of drugs in NPs. The results indicated that Dsp, Dex, and CaCl2 powders showed prominent crystallization characteristics, with diffraction peaks at 12° and 32°, respectively. Similar characteristic diffraction peaks could also be observed in the mixture of the three species. However, after continuous encapsulation by DOPA and DOTAP, the related distinct peaks disappeared, indicating that the amorphous CaP could be prepared by CaCl2 and sodium phosphate, and Dex and Dsp were successfully encapsulated in the lipid calcium phosphate NPs. (Figure 2D).
 |
Figure 2 Characterization and in vitro release studies of LdCaPd NPs. (A–C) TEM images of CaPd NPs (A), LCaPd NPs (B), and LdCaPd NPs (C), scale bars: 100 nm. (D). XRD spectra of different compositions. a. LdCaPd NPs; b. the mixture of raw materials; c. Dex; d. CaPd NPs; e. CaCl2; f. Dex. (E). In vitro release behavior of CaPd NPs in the release medium with different pH values. (F and G). In vitro release behavior of LdCaPd NPs in the release medium with different pH values, (F). Dex released from LdCaPd NPs, (G). Dsp released from LdCaPd NPs. In (E–G), **P < 0.01: significantly different from that in pH 7.4 release media. Mean ± SD, n = 3. |
In vitro Studies
It has been discovered that plasma protein is the most abundant component in biological fluids, which can adsorb onto the surface of NPs in blood circulation and form a coating called “protein crown” on the surface of NPS through electrostatic, van der Waals forces, and hydrophobic interactions, finally affecting the blood circulation time, in vivo distribution, and targeting of NPs.52 The protein adsorption test used PBS (pH 7.4) containing 2 mg/mL BSA to simulate the plasma environment, incubating LdCaPd NPs and CaPd NPs in the solution for varying times to investigate the protein adsorption on the surface of NPs. From Figure S9, the amount of protein adsorbed on the surfaces of the two NPs significantly increased with increasing incubation time, while their Zeta potentials showed downward trends. In addition, because the surface positive charge of LdCaPd NPs was stronger than that of CaPd NPs, the amount of protein ultimately adsorbed and the change degree of potential charges of LdCaPd NPs were higher than those of the latter. However, the protein adsorption capacity of the two NPs was relatively low (less than 20 mg/g) and positively charged within 24 h, indicating that the protein adsorption did not significantly affect the NPs’ structure in a short time. Literature research showed that lipid NPs can be distributed to the target site within a relatively short time after i.v.53 and our subsequent in vivo distribution and targeting experiments (In vivo Distribution and Pharmacokinetic Studies) also demonstrated that the LdCaPd NPs were distributed to the colonic inflammatory site within 1 h after injection. Therefore, we believe that protein adsorption would not impact the degradation and drug release of NPs significantly at the inflammatory site. The storage stability of LdCaPd NPs has an important impact on their therapeutic performance. The particle size changes of LdCaPd NPs after being stored at room temperature for 7 d were shown in Figure S10. The particle sizes, Zeta potential, and PDI remain unchanged for 7 days, indicating the good storage stability of LdCaPd NPs, which facilitates their application.
Figure 2E–G were the in vitro release behavior investigations of CaPd NPs (Figure 2E) and LdCaPd NPs (Figure 2F and G) in different release media. As shown in Figure 2E, in the pH 5.5 PBS solution simulating the intracellular lysosome environment, CaPd NPs exhibited the rapid release character with a cumulative release rate of over 60% at the 4th h. However, in the pH 7.4 PBS solution simulating the blood circulation, the release of Dsp from CaPd NPs was relatively slow (less than 20%) at the 4th h, and the final cumulative release rate was around 50%. The results indicated that the pH-responsiveness of CaP NPs enables them to be relatively stable in blood circulation while releasing the loading drugs after being engulfed by cells and transported to the acidic lysosome environment.54 However, the inflammatory environment of the colon is also acidic, which may cause the dissociation and early release of drugs from CaPd NPs before they are taken up by cells. Therefore, in this study, the cationic lipid DOTAP and DSPE-PEG2000 were used to further modify the CaPd NPs, and Dex was loaded into the lipid layer to construct the LdCaPd NPs, thus trying to achieve the release of Dex and Dsp into inflammatory sites and inflammatory macrophages, respectively. As shown in Figure 2F, Dex covered under the cationic lipid DOTAP layer released faster in the acidic condition (pH 5.5) than in the neutral condition (pH 7.4). In the first 4 h, the Dex showed obvious burst release in the pH 5.5 release medium, and the final cumulative release was about 90%. In contrast, the release was slower in the pH 7.4 medium with the final cumulative release of around 60%, indicating that the LdCaPd NPs could keep stable in the blood circulation while achieving rapid release of Dsp to the acidic inflammatory tissue of the colon due to the pH-responsive dissociation of DOTAP. Moreover, Figure 2G showed the accumulated release curve of Dsp from the LdCaPd NPs, which exhibited a special “S” release curve in the pH 5.5 release medium, namely that the release rate was relatively slow at the initial stage (0–3 h), then appeared burst release within 4–8 h, finally slowed down again. The final cumulative release rate reached 88%. However, in the pH 7.4 release medium, Dsp released from LdCaPd NPs was slower than from CaPd NPs, and the final cumulative release rate was just 45%. The unique release character of LdCaPd NPs might be related to their structure: the outer DOTAP layers of LdCaPd NPs were protonated under acidic conditions to lead to the massive release of Dex first within a short period. Then, the exposed CaP NPs dissolved under acidic conditions to release Dsp, resulting in the hysteresis of the burst release and the special “S” release curve of Dsp. From the results of the in vitro studies, we could assume that the LdCaPd NPs could keep stability in the blood circulation with neutral pH conditions after i.v. When the LdCaPd NPs targeted the colonic inflammatory environment through the EPR effect, the outer DOTAP layers were protonated and dissociated under acidic conditions to achieve the massive release of Dex first to create a microenvironment conducive to the M2 polarization of macrophages, while the Dsp was still protected by the inner CaP NPs and release less amount compared to Dex at this moment. The CaPd NPs were then engulfed by inflammatory M1 macrophages and triggered the degradation of CaP in the acidic lysosome, thus releasing large amounts of Dsp in the cytoplasm to regulate the M1 polarization.
Cytotoxicity and Cellular Uptake
The cytotoxicity test employed RAW 264.7 and HT-29 cell lines to evaluate the biocompatibility of LdCaPd NPs by the CCK8 assay. As shown in Figure 3A and B, after being incubated with Dsp or LdCaPd NPs with a concentration range from 0 to 128 μg/mL, the cell viabilities of RAW 264.7 and HT-29 cells at all concentrations were higher than 80%. Moreover, the CaPd NPs also showed satisfactory cytocompatibility on the two cells (Figure S11), indicating that the prepared nanosystems and their components have good biocompatibility and can be further applied to in vivo anti-inflammatory therapy.
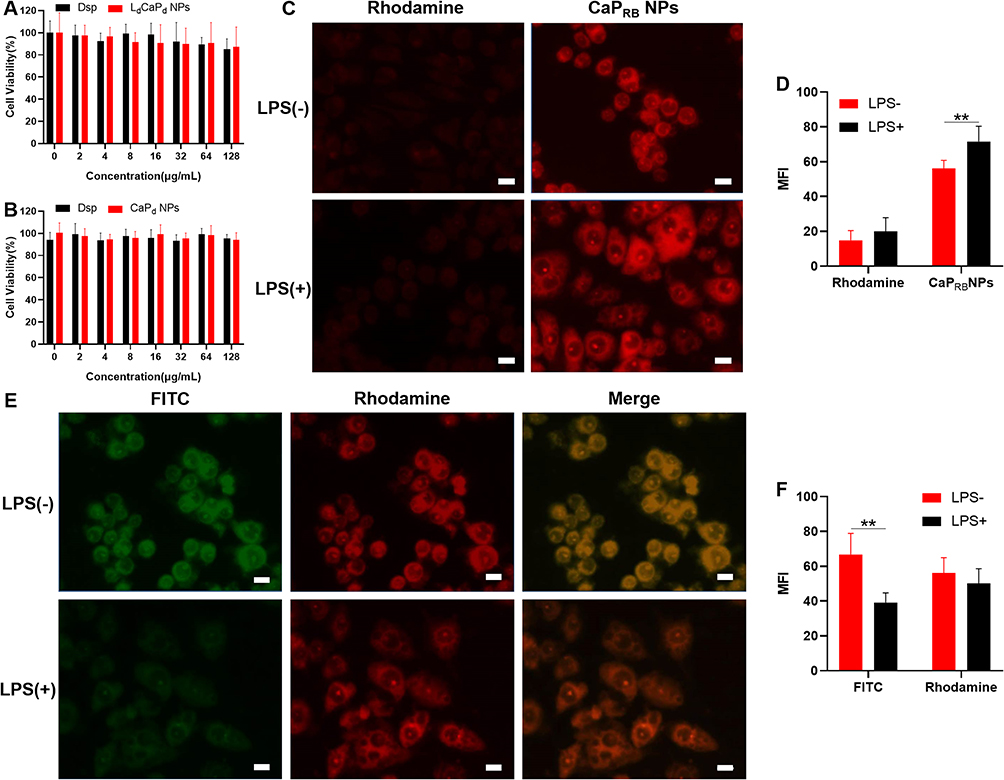 |
Figure 3 Cytotoxicity and cellular uptake investigation. (A) Cytotoxicity of LdCaPd NPs in RAW 264.7 (A) and HT-29 cells (B). (C) The uptake of free rhodamine B and CaPRB NPs by RAW 264.7 cells. (D). Semi-quantitative calculation results of Figure 2C. (E) The uptake of LFCaPRB NPs by RAW 264.7 cells. Green for FITC and Red for rhodamine B. (F). Semi-quantitative calculation results of Figure 2E. Scale bars: 10 μm. LPS: lipopolysaccharide, **P < 0.01, mean ± SD, n = 3. |
To investigate the uptake behavior of macrophages to LdCaPd NPs, the water-soluble fluorescent dye, rhodamine B, was selected instead of Dsp, and the FITC labeled DSPE-PEG2000 was employed to prepare fluorescent labeled CaPRB NPs and LFCaPRB NPs using the aforementioned method. CaPRB NPs were incubated with LPS-activated or unpolarized macrophages, followed by the cell uptake results with a fluorescence microscope. As shown in Figure 3C. the fluorescence signal in macrophages co-incubated with CaPRB NPs was more significant than that of the cells incubated with free rhodamine B, indicating that the macrophages could uptake more NPs than the free fluorescent dye, which might be due to the better fusion of CaP NPs with the cell membrane of macrophages through their outer phospholipid (DOPA), thereby enhancing the uptake of NPs by cells.55 Besides, the cells polarized by LPS also showed a significant effect on the uptake of CaPRB NPs, manifesting stronger fluorescence intensity of rhodamine B in polarized macrophages (Figure 3D). To further verify the feasibility of lipid calcium phosphate core-shell NPs releasing loaded Dex through the rupture of their pH-sensitive lipid shell in acidic inflammatory environments, dual fluorescent lipid calcium phosphate NPs, LFCaPRB, were selected to co-incubate with LPS polarized or unpolarized macrophages. The results were shown in Figure 3E and F. Both green fluorescence (FITC) and red fluorescence (rhodamine B) could be observed in macrophages without the incubation of LPS, indicating the complete absorption of LFCaPRB NPs by these cells. However, after being activated by LPS, the green fluorescence of FITC in macrophages decreased significantly, while the red fluorescence of rhodamine B remained stable, indicating that macrophages mainly ingested CaPRB NPs rather than LFCaPRB NPs. The possible reasons for this phenomenon were listed as follows: the glucose metabolism of activated M1 macrophages shifts from oxidative phosphorylation to glycolysis, thus increasing the consumption of glucose and accumulation of lactate, finally leading to the acidification of the colon tissue microenvironment in which macrophages reside.56 Moreover, we also confirmed that LPS-induced macrophage polarization could induce microenvironment acidification (See Macrophages Polarization and Anti-Inflammation). Therefore, in the acidic microenvironment, the outer cationic lipid, DOTAP, was dissociated and achieved the early release of FITC from the outer phospholipid layer of LFCaPRB NPs. Moreover, the CaPRB NPs are further engulfed by activated M1 macrophages to complete the intracellular delivery of rhodamine B. Therefore, the outer pH-sensitive lipid layer of LFCaPRB NPs ruptured under the stimulation of acidified inflammatory microenvironment to release FITC, while the interior CaPRB NPs continued to be ingested by macrophages. This experiment verified that LdCaPd NPs could achieve the successive deliver of Dex and Dsp to the colonic inflammation site and macrophages.
Macrophages Polarization and Anti-Inflammation
Macrophages are the critical members of immune cells, which polarize in different directions to mainly produce M1 or M2 phenotypes when stimulated by various factors.57,58 The M1 polarization promoted by the intestinal microenvironment will weaken the immune regulation balance and aggravate UC’s development.59 However, the M2 polarization will alleviate the UC symptoms. The LdCaPd NPs could comprehensively induce the M2 polarization of macrophages in colonic inflammatory sites: the Dex released first to the colonic acidic inflammatory tissue via the pH-responsive protonated dissociation of DOTAP in LdCaPd, followed by creating a favorable environment for inducing the M2 polarization. Furthermore, the inner CaP NPs were exposed and continued to deliver Dsp to the M1 inflammatory macrophages, thus further promoting the transition to the M2 phenotype by inhibiting the NF-κB activation and function, finally exerting the anti-inflammatory effects. The acidic inflammatory environment is the prerequisite for LdCaPd NPs to release drugs. In this study, LPS was used to induce the M1 polarization of macrophages. The relationship between macrophage polarization and the formation of an acidic inflammatory environment was investigated by observing and measuring the color changes and pH values of the culture medium. As shown in Figure S12A, compared with the unused DMEM medium containing fetal bovine serum (10%, v/v), The colors of both DMEM medium with and without LPS were changed from purple to pink after incubation for 24 h, which was due to the color change of the acid-base indicator, phenol red, added to the medium with the decrease of pH, and the color of LPS culture medium is more inclined towards red.60 Then, the pH of each culture medium was measured by a pH meter. The pH of the LPS culture medium was significantly lower than that of the untreated culture medium and the LPS-free culture medium with the same incubation time (Figure S12B). The possible causes were that after being polarized by LPS, the M1 macrophages are mainly powered by glycolysis,61 which enables cells to secrete large amounts of lactic acid to lead to the microenvironment acidification,62,63 thus facilitating LdCaPd NPs to achieve the first release of Dex to the microenvironment, followed by releasing Dsp to the cytoplasm of macrophages to complete the comprehensive regulation of macrophage polarization.
Then, the pathways and methods of M2 polarization induced by LdCaPd NPs were further explored. LdCaPd NPs could dissociate the outer DOTAP layer through its pH-responsive protonation to release Dex, which can polarize the unpolarized macrophages and recruited monocytes to the M2 phenotype to exert anti-inflammatory effects.64,65 This work used unpolarized RAW 264.7 cells, CD206 (M2 marker), and iNOS (M1 marker) to observe the M2 polarization characteristics of LdCaPd NPs by immunofluorescence staining.66 As shown in Figure 4A, less CD206 and iNOS staining were observed in unpolarized macrophages. However, after incubation with Dsp or LdCaPd NPs, the CD206 signal was significantly enhanced while the iNOS signal remained at a low level. Moreover, the fluorescence intensity of CD206 in the LdCaPd NPs group was stronger than that in the Dsp group, indicating that the LdCaPd NPs can polarize unpolarized macrophages to the M2 phenotype to play the anti-inflammatory effect. Moreover, the LdCaPd NPs also release the inner CaP NPs to be engulfed by the polarized M1 macrophages, thus releasing Dsp into the cytoplasm to reverse the phenotype of pro-inflammatory macrophages, which can further enhance the polarization regulation ability of NPs. As shown in Figure 4B, the LPS-induced macrophages mainly showed M1 phenotype with high expression of iNOS, while Dsp and LdCaPd NPs treated macrophages significantly inhibited the expression of CD206 and enhanced the expression of iNOS, and the changes in the LdCaPd NPs group were more obvious, indicating that the co-loading of Dex and Dsp could exert a synergistic effect on the macrophage polarization, thus significantly promoting the anti-inflammatory function of the M2 macrophages. The effect of LdCaPd NPs on macrophage polarization was further investigated by flow cytometry. As shown in Figure 4I–K, macrophages were first polarized to M1 after adding LPS, manifesting as a significant increase in the number of cells expressing the biomarker CD86 representing the M1 phenotype. However, when cells were incubated with Dsp or LdCaPd NPs, the number of cells expressing CD86 decreased significantly (Figure 4I and J). In contrast, the number of cells expressing the biomarker CD206 of the M2 phenotype increased significantly, especially in the group treated with LdCaPd NPs. (Figure 4I and K). The above results showed that compared with free drugs, LdCaPd NPs were more conducive to the transformation of macrophages from the M1 phenotype (CD11b+, CD86+) to the M2 phenotype (CD11b+, CD206+) and finally realized the effective regulation of macrophage polarization and improve the therapeutic effect on inflammation.
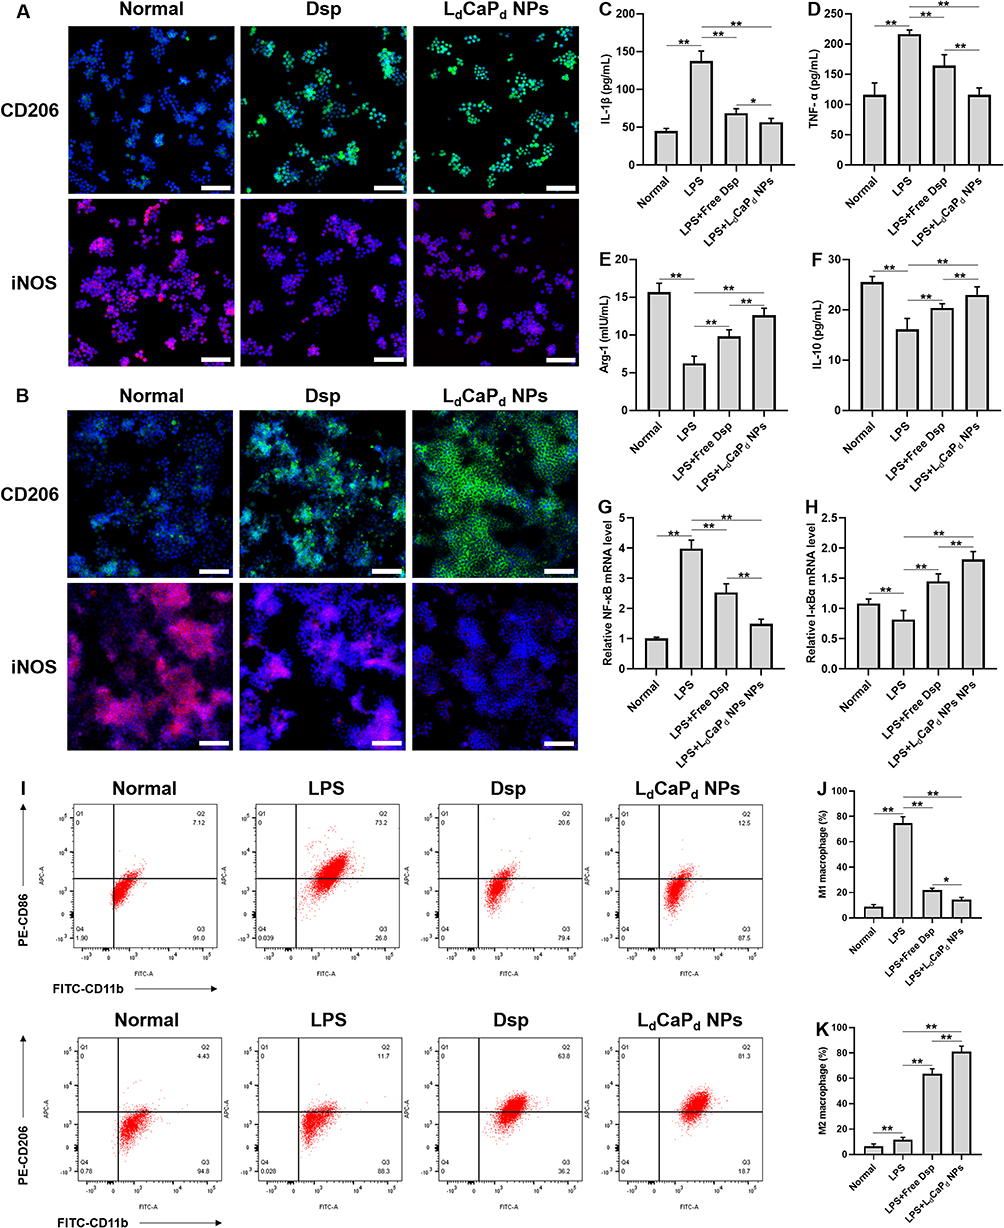 |
Figure 4 The effect of LdCaPd NPs on macrophage polarization and inflammatory factor expression. (A). Representative fluorescence images of a cluster of differentiation CD206 (green) and nitric oxide synthase (iNOS, red) staining of unpolarized RAW 264.7 cells after being treated with different preparations. (B) Representative fluorescence images of a cluster of differentiation CD206 (green) and nitric oxide synthase (iNOS, red) staining of LPS-induced RAW 264.7 cells treated with different preparations after 12 h. (C–F). Effects of Dsp and LdCaPd NPs on cytokines expression in macrophages. (C). IL-1β; (D). TNF-α; (E). Arg-1; (F). IL-10; (G and H). NF-κB mRNA level (G) and I-κBα mRNA level (H) as determined by qRT-PCR in RAW 264.7 cells. (I). Flow cytometry analysis of the effects of Dsp and LdCaPd NPs on the phenotypic transformation of M1 and M2 macrophages. (J and K). Quantitative analysis of the effect of Dsp and LdCaPd NPs on macrophage polarization by flow cytometry. (J) M1 macrophage (%). (K) M2 macrophage (%). Scale bar: 100 µm, **P < 0.01, *P < 0.05, mean ± SD, n = 3. |
The effects of different preparations on the secretion of inflammatory cytokines by macrophages, including pro-inflammatory cytokines (TNF-α and IL-1β) and anti-inflammatory cytokines and protein (IL-10 and Arg-1), were investigated. As shown in Figure 4C–F, the production of TNF-α and IL-1β significantly increased in RAW 264.7 cells after being induced by LPS, while the content of Arg-1 and IL-10 dramatically decreased in the same cells. After being incubated with different preparations, the expression of pro-inflammatory factors in macrophages decreased significantly. In contrast, the expression of anti-inflammatory factors increased, which was more evident in the group treated with LdCaPd NPs. These results indicated that LdCaPd NPs could significantly inhibit the secretion of pro-inflammatory cytokines and promote the expression of anti-inflammatory cytokines in macrophages, thus playing an excellent anti-inflammatory effect.
The qRT-PCT test was employed to investigate the possible mechanism of LdCaPd NPs to inhibit inflammation. Studies showed that the NF-κB is easily activated by LPS stimulation, which in turn regulates the transcription and protein synthesis of a series of inflammatory cytokines, such as interleukin, adhesion molecules, chemokines, and MHC I/II antigens, leading to the overproduction of these inflammatory factors and causing colonic mucosal damage.67,68 Dex can act as a ligand to bind and activate its corresponding receptor, the latter couples the nucleus with the RelA subunit of NF-κB to inhibit its function.69 On the other hand, Dex enhances the upregulate of the protein levels of I-κBα protein by enhancing its gene transcription, thereby blocking the processes of nuclear translocation and DNA binding of NF-κB.70,71 From the results of the qRT-PCT test (Figure 4G and H), compared with the LPS group, the Dsp and LdCaPd NPs significantly decreased the mRNA level of NF-κB (Figure 4G), while dramatically increasing the mRNA level of I-κBα (Figure 4H), during which the LdCaPd NPs showed the significant effect than that of Dsp, indicating that LdCaPd NPs could deliver more Dex and Dsp to macrophages to play the above functions to inhibiting expression and function of NF-κB.
In vivo Distribution and Pharmacokinetic Studies
The in vivo distribution was evaluated by detecting the in vivo fluorescence distribution of FITC-labeled LFCaP NPs. Results showed that after i.v. for 1 h, the aggregation of FITC fluorescence could be observed in the abdomen of UC model mice treated with LFCaP NPs. At the same time, the free FITC did not exert obvious fluorescence signals in the abdomen of UC model mice. Moreover, no fluorescent signal was observed in the abdomen of the healthy mice after being treated with LFCaP NPs. The fluorescence signals from the major organs also revealed that more FITC fluorescence signal was observed in the colon than in other organs in the experimental colitis mice treated with LFCaP NPs. However, the FITC fluorescence signals in the colon were similar to that in other organs in the experimental colitis mice treated with free FITC and healthy mice treated with LFCaP NPs solution (Figure 5A). These results indicated that LdCaPd NPs could passively target to the colitis tissue through the EPR effect to improve the local drug concentration. The in vivo HPLC methodological investigation of Dex and Dsp was shown in the supporting information (Supplementary Material 2. Results, data were shown in Figures S13, S14, Tables S7 and S8), which demonstrated the feasibility of in vivo quantitative analysis of Dex and Dsp. In the pharmacokinetic study, since the surface of LdCaPd NPs was modified with a hydrophilic PEG chain, which endows LdCaPd NPs longer circulation time than drug molecules after i.v., thus making LdCaPd NPs probably target the colonic inflammatory sites through the EPR effect and perform the treating effect fully. Furthermore, since Dsp was encapsulated in the CaP core of LdCaPd NPs, whose in vivo transport process is significantly different from that of direct injection of free Dsp. Therefore, this experiment investigated the pharmacokinetic behavior of LdCaPd NPs by detecting the content of Dsp in the blood. The plasma concentration-time profiles of Dsp and LdCaPd NPs after i.v. administration was shown in Figure 5B, and the main pharmacokinetic parameters were listed in Table S9. The AUC0-12 and AUC0-∞ of the LdCaPd NPs treated group are 4.57 and 4.34 times that of the Dsp-treated group, respectively. Moreover, compared with the Dsp-treated group, the half-life time (t1/2) and peak concentration of the LdCaPd NPs treated group were prolonged and increased, respectively. These results indicated that the i.v. administration of LdCaPd NPs can achieve the long-circulation effect, which was beneficial to enrich LdCaPd NPs in the colitis sites through the EPR effect, thus playing the therapeutic role.
 |
Figure 5 In vivo distribution and pharmacokinetics behavior of LdCaPd NPs on experimental colitis mice. (A) Fluorescence distribution images in vivo and in various organs of mice. (B) Plasma concentration curves of Dsp (i.v. administration of 6 mg/kg) and LdCaPd NPs (i.v. administration of NPs containing 6 mg/kg Dsp) in rats. Mean ± SD, n = 6. |
Anti-Ulcerative Colitis Study
The anti-ulcerative colitis study mainly investigated the therapeutic effect of LdCaPd NPs on experimental colitis mice and explored the therapeutic mechanism of LdCaPd NPs. In the therapeutic effect investigation of LdCaPd NPs, the weight loss degree in mice was a critical indicator for assessing the severity of UC. The weight changes of mice during treatment were shown in Figure 6A. The body weight loss of the normal group increased steadily, while the body weight of the TNBS group continued to decrease. After being treated with Dsp and LdCaPd NPs, the weight-loss trends of the mice were reversed after the 2nd day, and the final body weights of mice treated with LdCaPd NPs were higher than that of the Dsp-treated group, revealing the better effects of LdCaPd NPs than Dsp. DAI is the aggregated indicator of the quantitative evaluation of the overall condition of mice during treatment, including bloody stools, diarrhea, reduced activity, and weight loss.72 The DAI scores of the normal group remained stable throughout the experiment, while the DAI scores of the TNBS group were much higher than those of the normal group, indicating the severity of the induced experimental colitis. On the 2nd day of treatment, the DAI scores of the two treatment groups showed downward trends. After 5 days of treatment, the DAI index of these treatment groups was significantly decreased compared with the TNBS group. The DAI index of the LdCaPd NPs treated group was lower than that of the Dsp treated group (Figure 6B). The TNBS-induced experimental colitis may lead to the compensatory hypertrophy of colon tissues, which would result in the significant thickening of the colon wall and shortening of the colon length. Hence, colon shortening is regarded as an indirect indicator of colitis. As shown in Figure 6F and G, the colon length of the TNBS group was much shorter than that of the normal group due to the inflammation, mucosal damage, and edema in the colon after the TNBS modeling. After being treated with LdCaPd NPs and Dsp, the colon lengths were significantly improved, and the colon lengths of the LdCaPd NPs group were more prolonged than that of the Dsp group, indicating that the precise drug release of LdCaPd NPs in the colon lesion and macrophages could more effectively exert anti-inflammatory effects and restore the colon length. MPO is a kind of peroxidase that mainly exists in inflammatory cells, and can be used as a biological marker to assess UC status.73 From Figure 6C, the MPO activity of the TNBS group was significantly higher than the normal group (P < 0.01), indicating the significant development of inflammation after the TNBS modeling. The MPO activities of the two treatment groups dramatically decreased compared with the TNBS group (P < 0.01), and the LdCaPd NPs group was lower than the Dsp group (P < 0.01) and was close to the normal group. Large numbers of reactive oxygen species (ROS) are generated during the development of UC, which promotes the UC by aggravating the oxidative stress degree in inflammatory sites. MDA and SOD reflect the oxidative damage degree and antioxidant levels in inflammatory tissues.74,75 As shown in Figure 6D and E, the MDA or SOD levels of the TNBS group were much higher (MDA) or lower (SOD) than that of the normal group (P < 0.01). However, these parameters of the treatment groups significantly reduced (MDA) or increased (SOD) compared with the TNBS group (P < 0.01). ROS increases gradually with the inflammation production and promotes the inflammation development by expending antioxidant substances.76 Therefore, LdCaPd NPs and Dsp inhibited the inflammatory factors production by regulating macrophage polarization, thereby reducing the ROS production, and recovering the activity of SOD to improve the antioxidant capacity. Since LdCaPd NPs could comprehensively regulate the macrophage polarization by creating a microenvironment conducive to M2 polarization and directly regulating macrophage polarization, their inhibitory ability on inflammatory factors and oxidative stress was stronger than that of Dsp. The histomorphology changes of the colon tissues in the different groups were evaluated by H&E staining. As shown in Figure 6H, the colon tissues of the normal group had complete epithelial barriers and clear crypt structures (6Ha and 6He). In contrast, tissues of the TNBS group exhibited all the characteristics of TNBS-induced inflammation, including the atrophy and loss of the epithelial barriers, the loss of crypt structures, and the inflammatory cell infiltration into the lamina propria of the colon (6Hb and 6Hf). In contrast, relatively complete epithelial cell barriers, clear crypt structures, and almost no inflammatory cell infiltration were observed in the LdCaPd NPs treated group (6Hd and 6Hh), almost the same as in the normal group. These results demonstrate the excellent anti-inflammatory effects of LdCaPd NPs. The histological changes were also quantified by a colon damage scoring system. The TNBS group showed the highest histological score, while the Dsp and the LdCaPd NPs decreased the score by 72% and 85%, respectively (Figure S15).
 |
Figure 6 In vivo therapeutic effect of LdCaPd NPs on experimental colitis mice. (A) Effects of Dsp and LdCaPd NPs on weight changes in mice. (B) The influence of Dsp and LdCaPd NPs on the variation of DAI index of mice. (C) Effects of Dsp and LdCaPd NPs on MPO activities. (D) Effects of Dsp and LdCaPd NPs on MDA levels. (E). Effects of Dsp and LdCaPd NPs on SOD activities. (F). Images of the effect of Dsp and LdCaPd NPs on the colon length of mice. (G) Statistical data of colon length of mice after treatment. (H) H&E staining results of mouse colon tissue after treatment with LdCaPd NPs, from a to d, the scale bar is 200 μm, from e to h, the scale bar is 100 μm. In (A and B) **P < 0.01, significantly different from the TNBS-treated group; In (C–E and G) **P < 0.01, *P < 0.05. Mean ± SD, n = 10. |
When UC occurs, monocyte macrophages in intestinal tissues or recruited from the bloodstream are activated and polarized to M1 macrophages by stimulation via the abnormal intestinal antigens and inflammatory factors, thereby accelerating the damage of intestinal mucosa.77 M1 macrophages secrete cytokines, chemokines, and adhesion factors that destroy the intestinal mucosal barrier to recruit neutrophils to the inflammation site to release protease hydrolysis and destroy the tissue, finally promoting inflammation and resulting in ulcers.21,78 Dex not only up-regulates the I-κBα level to inhibit the activation of NF-κB but also activates GC receptors to block the bond between NF-κB and the target DNA, thereby inhibiting the M1 polarization of macrophages to exert the anti-inflammatory effects. Furthermore, Dex can also promote the transformation of macrophages or monocytes into the M2 phenotype, thereby secreting anti-inflammatory cytokines. Therefore, the inflammatory cytokine levels in colon tissue and serum were investigated to demonstrate the therapeutic mechanism of LdCaPd NPs. Figure 7A–D showed the pro- and anti-inflammatory cytokines change in serum. In Figure 7A and B, after being treated with TNBS, IL-1β, and TNF-α significantly increased, while these cytokines dramatically decreased in the LdCaPd NPs and Dsp groups, and these indicators of the LdCaPd NPs group were lower than that of the Dsp group under the same dose conditions (P < 0.01). However, TGF-β1 and IL-10 (Figure 7C and D) in the TNBS group were significantly reduced compared with the normal group (P < 0.01). After being treated with Dsp or LdCaPd NPs, these cytokines dramatically increased compared with the TNBS group (P < 0.01). Meanwhile, TGF-β1 and IL-10 in the LdCaPd NPs group showed a more significant increase than that of the Dsp group (P < 0.01). These inflammatory cytokines in colon tissues were also detected, which showed similar change trends with those in serum (Figure 7E–H). We further investigated the signaling pathway in which LdCaPd NPs exerted therapeutic effects by Western blot analysis. As shown in Figure 7I, compared with the normal group, the phosphorylated NF-κB p65 (pNF-κB p65) in the other three groups showed varying degrees of increase after being treated with TNBS, indicating that applying TNBS could promote NF-κB to lead to the generation and development of the inflammation. However, after treatment with Dsp or LdCaPd NPs, the corresponding protein expression changed significantly: the expression of pNF-κB p65 decreased, and the expression of phosphorylated I-κBα (pI-κBα) upregulated, which was more pronounced in the LdCaPd NPs group (Figure 7J and K), Moreover, the ratio between NF-κB p65 and p-NF-κB p65 (NF-kB p65/p-NF-kB p65, Figure S16A) and the ratio between I-κBα and pNF-κB p65 (I-κBα and pNF-κB p65, Figure S16B) also demonstrated the effective regulation of the NF-κB pathway by LdCaPd NPs. These results indicated that: TNBS causes protein haptenization in colon tissue, resulting in the production of corresponding antibodies and leading to the immune response and the production of inflammatory cytokines,79,80 which activates NF-κB and regulates its translocation to the nucleus and bonding with the target DNA, thus producing more pro-inflammatory cytokines. LdCaPd NPs can achieve the comprehensive regulatory effect on the macrophage polarization, namely by releasing Dex first to construct a suitable M2 polarized microenvironment, then delivering Dsp to the inflammatory macrophages to activate the GC receptor and upregulate the I-κBα level to inhibit the NF-κB function to achieve the directly regulation of macrophage polarization. The comprehensive regulatory effect of LdCaPd NPs on the inflammatory environment and inflammatory macrophages can fully mobilize the anti-inflammatory effect of macrophages, resulting in better therapeutic effects than Dsp. The immunohistochemistry assay results are shown in Figure 7L, compared with the TNBS group, the CD86 decreased while the CD206 levels increased in colon tissues in both Dsp and LdCaPd NPs treated groups. These indicators changed more significantly in the LdCaPd NPs treated groups (P < 0.01). The decrease in the CD86 (M1 marker) and the increase in the CD206 (M2 marker) in colon tissue indicate that macrophages are converted from M1 to M2 (Figure S17). These results suggested that LdCaPd NPs could effectively inhibit M1 polarization of macrophages and promote the transformation of macrophages into the M2 phenotype, thereby accelerating the recovery of UC through inhibiting colitis and applying the healing-promoting effect of M2 macrophages, finally achieving the UC treating function through the regulation of the macrophages M1/M2 polarization by Dex/Dsp.
 |
Figure 7 Therapeutic mechanism investigation of LdCaPd NPs. (A–D). Effects of LdCaPd NPs on the expression of IL-1β (A), TNF-α (B), TGF-β1 (C), and IL-10 (D) in mouse serum. (E–H) Effects of LdCaPd NPs on the expression of IL-1β (E), TNF-α (F), TGF-β1 (G), and IL-10 (H) in mouse colon tissue. (I) Western blotting results of the inflammatory-related proteins: NF-κB p65, pNF-κB p65, I-κBα, and pI-κBα. (J) The content of the expression of NF-κB p65, and pNF-κB p65 as compared to β-actin. (K) The content of the expression of I-κBα, pI-κBα as compared to β-actin. (L) Immunohistochemical staining results of colon tissue of mice treated with LdCaPd NPs, scale bars: 100 μm. **P < 0.01, *P < 0.05, significantly different from the TNBS-treated group. Mean ± SD, n = 10. |
Safety Evaluation
The blood compatibility of LdCaPd NPs plays a crucial role in their safety through i.v. administration, which urged us to investigate the hemolysis of LdCaPd NPs. LdCaPd NPs with different concentrations (calculated by the concentration of Dex, and the final concentration was the sum of the Dsp and Dex concentrations in LdCaPd NPs ranging from 30 to 150 μg/mL) were co-incubated with rats’ erythrocyte suspension. The red blood cells in the positive control group were broken, and hemolysis occurred, expressed as dark red supernatant. However, there was no hemolysis in the negative control group and LdCaPd NPs with varying concentrations (Figure S18A). The quantitative analysis results also demonstrated that the hemolysis ratio gradually increased with the increase in drug concentration while the hemolysis ratio was still less than 2 when the concentration reached 150 μg/mL (Figure S18B). According to the American Society for Testing and Materials Designation (ASTM) F756-00, samples were regarded as safe and non-hemolytic provided their hemolytic rates were less than or equal to 5%.81 Therefore, the LdCaPd NPs have good hemocompatibility within the concentration from 0 to 150 μg/mL. Conducting biocompatibility tests on nanomaterials is the precursor for their security application. Therefore, the histological analysis was performed in the main organs of mice in anti-colitis experiments. From Figure S19, the sections of major organs in the Dsp and LdCaPd NPs groups, including heart, liver, spleen, lung, and kidney, did not exhibit obvious inflammation or other pathological changes compared with the normal group 5 days of treatment, indicating that LdCaPd NPs have good biocompatibility.
Conclusion
To summarize, this study constructed a kind of pH-sensitive lipid calcium phosphate core-shell NPs, LdCaPd, co-loaded with Dex and Dsp. The LdCaPd NPs showed good biocompatibility. After i.v., LdCaPd NPs could be enriched in the colitis sites depending on the EPR effect. Dex loaded in the lipid layer of LdCaPd NPs was released to the acidic inflammatory tissues depending on the pH-responsiveness of LdCaPd NPs forming a microenvironment that induced the M2 polarization of macrophages. Then, the inner CaP NPs that loaded Dsp were further engulfed by inflammatory M1 macrophages, followed by releasing Dsp to the cytoplasm by the pH-responsiveness of CaP to inhibit the M1 polarization of macrophages and reverse them to the M2 phenotype. This study provides new research thoughts and methods for multiple responses to target inflammatory sites and macrophages and the treatment of colitis by regulating the M1/M2 polarization of macrophages.
Acknowledgment
The authors thank the Instrument Analysis Center of Xi’an Jiaotong University for the help and funding (Subsidy fund for the operation of large instruments and equipment, No. YB2023189) on the characterization.
Funding
This work was supported financially by the National Natural Science Foundation of China (No. 81973253), the China Postdoctoral Science Foundation (No. 2021M702633), the Key R&D Program Project for Shaanxi Province (No. 2022SF-081, 2020SF-218), and the Fundamental Research Funds for the Central Universities (No. xzy012023097).
Disclosure
The authors report no conflicts of interest in this work.
References
1. Ungaro R, Mehandru S, Allen PB, Peyrin-Biroulet L, Colombel JF. Ulcerative colitis. Lancet. 2017;389(10080):1756–1770. doi:10.1016/S0140-6736(16)32126-2
2. Espaillat MP, Kew RR, Obeid LM. Sphingolipids in neutrophil function and inflammatory responses: mechanisms and implications for intestinal immunity and inflammation in ulcerative colitis. Adv Bio Regul. 2017;63:140–155. doi:10.1016/j.jbior.2016.11.001
3. Iwamuro M, Takahashi T, Watanabe N, et al. Enriched CD45RA(-)CD62L(+) central memory T and decreased CD3(+)CD56(+) natural killer T lymphocyte subsets in the rectum of ulcerative colitis patients. Inter J Immuno Pharmacol. 2022;2022:36.
4. Zhang JX, Zhao YG, Hou TL, et al. Macrophage-based nanotherapeutic strategies in ulcerative colitis. J Control Release. 2020;320:363–380. doi:10.1016/j.jconrel.2020.01.047
5. Kaymak I, Williams KS, Cantor JR, Jones RG. Immunometabolic Interplay in the Tumor Microenvironment. Cancer Cell. 2021;39(1):28–37. doi:10.1016/j.ccell.2020.09.004
6. Rubin PH, Friedman S, Harpaz N, et al. Colonoscopic polypectomy in chronic colitis: conservative management after endoscopic resection of dysplastic polyps. Gastroenterology. 1999;117(6):1295–1300. doi:10.1016/S0016-5085(99)70279-9
7. Kaluzna A, Olczyk P, Komosinska-Vassev K. The role of innate and adaptive immune cells in the pathogenesis and development of the inflammatory response in ulcerative colitis. J Clin Med. 2022;11:2. doi:10.3390/jcm11020400
8. Pan XH, Zhu Q, Pan LL, Sun J. Macrophage immunometabolism in inflammatory bowel diseases: from pathogenesis to therapy. Pharmacol Ther. 2022;2022:238.
9. Kuhl AA, Erben U, Kredel LI, Siegmund B. Diversity of intestinal Macrophages in inflammatory Bowel Diseases. Front Immunol. 2015;6. doi:10.3389/fimmu.2015.00006
10. Ma SJ, Zhang JX, Liu HS, Li S, Wang Q. The role of tissue-resident macrophages in the development and treatment of inflammatory bowel disease. Front Cell Dev Biol. 2022;2022:10.
11. Tugal D, Liao XD, Jain MK. Transcriptional control of macrophage polarization. Arteriosclerosis Thrombosis Vasc Biol. 2013;33(6):1135–1144. doi:10.1161/ATVBAHA.113.301453
12. Lissner D, Schumann M, Batra A, et al. Monocyte and M1 macrophage-induced barrier defect contributes to chronic intestinal inflammation in IBD. Inflammat Bowel Dis. 2015;21(6):1297–1305. doi:10.1097/MIB.0000000000000384
13. Ning LQ, Ye NY, Ye B, et al. Qingre Xingyu recipe exerts inhibiting effects on ulcerative colitis development by inhibiting TNF alpha/NLRP3/Caspase-1/IL-1 beta pathway and macrophage M1 polarization. Cell Death Discovery. 2023;9:1. doi:10.1038/s41420-023-01361-w
14. Monajemi M, Pang YCF, Bjornson S, Menzies SC, van Rooijen N, Sly LM. Malt1 blocks IL-1 beta production by macrophages in vitro and limits dextran sodium sulfate-induced intestinal inflammation in vivo. J Leukocy Biol. 2018;104(3):557–572. doi:10.1002/JLB.3VMA0118-019R
15. Nicaise P, Gleizes A, Sandre C, et al. The intestinal microflora regulates cytokine production positively in spleen-derived macrophages but negatively in bone marrow-derived macrophages. European Cytokine Network. 1999;10(3):365–372.
16. Sommer K, Wiendl M, Muller TM, et al. Intestinal mucosal wound healing and barrier integrity in IBD-crosstalk and trafficking of cellular players. Front Med. 2021;2021:8.
17. Pan F, Tang W, Zhou Z, Gilkeson G, Lang R, Jiang W. Intestinal macrophages in mucosal immunity and their role in systemic lupus erythematosus disease. Lupus. 2018;27(12):1898–1902. doi:10.1177/0961203318797417
18. Strober W, Fuss IJ. Proinflammatory cytokines in the pathogenesis of inflammatory bowel diseases. Gastroenterology. 2011;140(6):1756–U1782. doi:10.1053/j.gastro.2011.02.016
19. Zhu W, Yu JB, Nie Y, et al. Disequilibrium of M1 and M2 macrophages correlates with the development of experimental inflammatory bowel diseases. Immunol Invest. 2014;43(7):638–652. doi:10.3109/08820139.2014.909456
20. Lai WM, Xian CX, Chen MX, et al. Single-cell and bulk transcriptomics reveals M2d macrophages as a potential therapeutic strategy for mucosal healing in ulcerative colitis. Int Immunopharmacol. 2023;2023:121.
21. Wang K, Mao TY, Lu XY, et al. A potential therapeutic approach for ulcerative colitis: targeted regulation of macrophage polarization through phytochemicals. Front Immunol. 2023;2023:14.
22. Greifer MK, Markowitz JF. Update in the treatment of paediatric ulcerative colitis. Expert Opinion Pharmacoth. 2006;7(14):1907–1918. doi:10.1517/14656566.7.14.1907
23. Farrell RJ, Kelleher D. Glucocorticoid resistance in inflammatory bowel disease. J Endocrinol. 2003;178(3):339–346. doi:10.1677/joe.0.1780339
24. Sutherland L, MacDonald JK. Oral 5-aminosalicylic acid for maintenance of remission in ulcerative colitis. Cochrane Database Syst Rev. 2006;2006:2.
25. Mao EJ, Hazlewood GS, Kaplan GG, Peyrin-Biroulet L, Ananthakrishnan AN. Systematic review with meta-analysis: comparative efficacy of immunosuppressants and biologics for reducing hospitalisation and surgery in Crohn’s disease and ulcerative colitis. Aliment Pharmacol Ther. 2017;45(1):3–13. doi:10.1111/apt.13847
26. George LA, Cross RK. Treatment of ulcerative colitis with steroids (in Whom, How Long, What Dose, What Form). Gastroenterol Clin North Am. 2020;49(4):705–716. doi:10.1016/j.gtc.2020.08.001
27. Bitton A. Medical management of ulcerative proctitis, proctosigmoiditis, and left-sided colitis. Semin Gastrointl Dis. 2001;12(4):263–274.
28. Meduri GU, Muthiah MP, Carratu P, Eltorky M, Chrousos GP. Nuclear factor-kappa B- and glucocorticoid receptor alpha-mediated mechanisms in the regulation of systemic and pulmonary inflammation during sepsis and acute respiratory distress syndrome - Evidence for inflammation-induced target tissue resistance to glucocorticoids. Neuroimmunomodulation. 2005;12(6):321–338. doi:10.1159/000091126
29. Hermoso M, Cidlowski J. Putting the brake on inflammatory responses: the role of glucocorticoids. Iubmb Life. 2003;55(9):497–504. doi:10.1080/15216540310001642072
30. Liu W, Fan Z, Han Y, et al. Activation Of Nf-Kappa B signaling pathway in Hsv-1-induced mouse facial palsy: possible relation to therapeutic effect of glucocorticoids. Neuroscience. 2015;289:251–261. doi:10.1016/j.neuroscience.2014.12.062
31. Choi JH, Brummer E, Kang YJ, Jones PP, Stevens DA. Inhibitor kappa B and nuclear factor kappa B in granulocyte-macrophage colony-stimulating factor antagonism of dexamethasone suppression of the macrophage response to Aspergillus fumigatus conidia. J Infect Dis. 2006;193(7):1023–1028. doi:10.1086/500948
32. Jiang KY, Weaver JD, Li YJY, Chen XJ, Liang JP, Stabler CL. Local release of dexamethasone from macroporous scaffolds accelerates islet transplant engraftment by promotion of anti-inflammatory M2 macrophages. Biomaterials. 2017;114:71–81. doi:10.1016/j.biomaterials.2016.11.004
33. Martinez FO, Sica A, Mantovani A, Locati M. Macrophage activation and polarization. Front Biosci Landm. 2008;13:453–461. doi:10.2741/2692
34. Tu GW, Shi Y, Zheng YJ, et al. Glucocorticoid attenuates acute lung injury through induction of type 2 macrophage. J Transl Med;2017. 15. doi:10.1186/s12967-016-1116-1
35. Urbanska J, Karewicz A, Nowakowska M. Polymeric delivery systems for dexamethasone. Life Sci. 2014;96(1–2):1–6. doi:10.1016/j.lfs.2013.12.020
36. Qu Z, Wong KY, Moniruzzaman M, et al. One-Pot Synthesis of pH-responsive eudragit-mesoporous silica nanocomposites enable colonic delivery of glucocorticoids for the treatment of inflammatory bowel disease. Adv Therap. 2021;4:2. doi:10.1002/adtp.202000165
37. Wang N, Shao LY, Lu WJ, et al. 5-aminosalicylic acid pH sensitive core-shell nanoparticles targeting ulcerative colitis. J Drug Delivery Sci Technol. 2022;2022:74.
38. Qiu C, Wu YY, Guo QY, et al. Preparation and application of calcium phosphate nanocarriers in drug delivery. Mater Today Bio. 2022;2022:17.
39. Khalifehzadeh R, Arami H. Biodegradable calcium phosphate nanoparticles for cancer therapy. Adv Colloid Interface Sci. 2020;2020:279.
40. Jeong J, Kim JH, Shim JH, Hwang NS, Heo CY. Bioactive calcium phosphate materials and applications in bone regeneration. Biomater Res. 2019;23:1. doi:10.1186/s40824-018-0149-3
41. Al-Sanabani JS, Madfa AA, Al-Sanabani FA. Application of calcium phosphate materials in dentistry. Int J Biomater. 2013;2013:876132. doi:10.1155/2013/876132
42. Xu XC, Li ZH, Zhao XQ, Keen L, Kong XD. Calcium phosphate nanoparticles-based systems for siRNA delivery. Regenerat Biomat. 2016;3(3):187–195. doi:10.1093/rb/rbw010
43. Maitra A. Calcium phosphate nanoparticles: second-generation nonviral vectors in gene therapy. Expert Rev Molecul Diagnost. 2005;5(6):893–905. doi:10.1586/14737159.5.6.893
44. Sokolova V, Epple M. Biological and medical applications of calcium phosphate nanoparticles. Chemistry. 2021;27(27):7471–7488. doi:10.1002/chem.202005257
45. Ridi F, Meazzini I, Castroflorio B, Bonini M, Berti D, Baglioni P. Functional calcium phosphate composites in nanomedicine. Adv Colloid Interface Sci. 2017;244:281–295. doi:10.1016/j.cis.2016.03.006
46. An JL, Zhang YX, Ying ZW, et al. The formation, structural characteristics, absorption pathways and bioavailability of calcium-peptide chelates. Foods. 2022;11:18. doi:10.3390/foods11182762
47. Huang JL, Chen HZ, Gao XL. Lipid-coated calcium phosphate nanoparticle and beyond: a versatile platform for drug delivery. J Drug Target. 2018;26(5–6):398–406. doi:10.1080/1061186X.2017.1419360
48. Shi XP, Yan Y, Wang PC, et al. In vitro and in vivo study of pH-sensitive and colon-targeting P(LE-IA-MEG) hydrogel microspheres used for ulcerative colitis therapy. Eur. J. Pharm. Biopharm. 2018;122:70–77. doi:10.1016/j.ejpb.2017.10.003
49. Zeng AG, Dong K, Wang ML, et al. Investigation of the colon-targeting, improvement on the side-effects and therapy on the experimental colitis in mouse of a resin microcapsule loading dexamethasone sodium phosphate. Drug Delivery. 2016;23(6):1.
50. You YC, Dong LY, Dong K, et al. In vitro and in vivo application of pH-sensitive colon-targeting polysaccharide hydrogel used for ulcerative colitis therapy. Carbohydr. Polym. 2015;130:243–253. doi:10.1016/j.carbpol.2015.03.075
51. Dorozhkin SV. Amorphous calcium (ortho)phosphates. Acta Biomater. 2010;6(12):4457–4475. doi:10.1016/j.actbio.2010.06.031
52. Wang S, Zhang J, Zhou H, et al. The role of protein Corona on nanodrugs for organ-targeting and its prospects of application. J Controll Rele. 2023;360:15–43. doi:10.1016/j.jconrel.2023.06.014
53. Waggoner LE, Miyasaki KF, Kwon EJ. Analysis of PEG-lipid anchor length on lipid nanoparticle pharmacokinetics and activity in a mouse model of traumatic brain injury. Biomater Sci. 2023;11(12):4238–4253. doi:10.1039/D2BM01846B
54. Lunov O, Syrovets T, Rocker C, et al. Lysosomal degradation of the carboxydextran shell of coated superparamagnetic iron oxide nanoparticles and the fate of professional phagocytes. Biomaterials. 2010;31(34):9015–9022. doi:10.1016/j.biomaterials.2010.08.003
55. Li X, Naguib YW, Valdes S, Hufnagel S, Cui ZR. Reverse microemulsion-based synthesis of (Bis)phosphonate-metal materials with controllable physical properties: an example using zoledronic acid-calcium complexes. ACS Appl. Mater. Interfaces. 2017;9(16):14478–14489. doi:10.1021/acsami.6b15006
56. Van den Bossche J, Baardman J, de Winther MPJ. Metabolic characterization of polarized M1 and M2 bone marrow-derived macrophages using real-time extracellular flux analysis. J Visual Experim. 2015;2015:105.
57. Caer C, Wick MJ, Hu L, Qiu L, Zhu L. Human intestinal mononuclear phagocytes in health and inflammatory bowel disease. Front Immunol. 2020;11:11. doi:10.3389/fimmu.2020.00011
58. Polinska B, Matowicka-Karna J, Kemona H. The cytokines in inflammatory bowel disease. Postepy Hig Med Dosw (Online). 2009;63:389–394.
59. Yang ZH, Lin SS, Feng WY, et al. A potential therapeutic target in traditional Chinese medicine for ulcerative colitis: macrophage polarization. Front Pharmacol. 2022;2022:13.
60. Zguris J, Pishko MV. pH sensitive fluorescent poly(ethylene) glycol hydrogel microstructures for monitoring in cell culture systems. Sens Lett. 2005;3(3):206–210. doi:10.1166/sl.2005.027
61. Kim YJ, Lee S, Jin J, Woo H, Choi YK, Park KG. Cassiaside C Inhibits M1 polarization of macrophages by downregulating glycolysis. Int J Mol Sci. 2022;23:3.
62. Zhou HC, Yan XY, Yu WW, et al. Lactic acid in macrophage polarization: the significant role in inflammation and cancer. Internat Rev Immunol. 2022;41(1):4–18. doi:10.1080/08830185.2021.1955876
63. Park SY, Kim IS. Identification of macrophage genes responsive to extracellular acidification. Inflamm Res. 2013;62(4):399–406. doi:10.1007/s00011-013-0591-6
64. Tedesco S, Bolego C, Toniolo A, et al. Phenotypic activation and pharmacological outcomes of spontaneously differentiated human monocyte-derived macrophages. Immunobiology. 2015;220(5):545–554. doi:10.1016/j.imbio.2014.12.008
65. Tuckermann JP, Kleiman A, McPherson KG, Reichardt HM. Molecular mechanisms of glucocorticoids in the control of inflammation and lymphocyte apoptosis. Crit Rev Clin Laborat Sci. 2005;42(1):71–104. doi:10.1080/10408360590888983
66. Fretwurst T, Garaicoa-Pazmino C, Nelson K, et al. Characterization of macrophages infiltrating peri-implantitis lesions. Clin Oral Implants Res. 2020;31(3):274–281. doi:10.1111/clr.13568
67. Guha M, Mackman N. LPS induction of gene expression in human monocytes. Cell. Signalling. 2001;13(2):85–94. doi:10.1016/S0898-6568(00)00149-2
68. Atreya I, Atreya R, Neurath MF. NF-kappa B in inflammatory bowel disease. J Internal Med. 2008;263(6):591–596. doi:10.1111/j.1365-2796.2008.01953.x
69. Saklatvala J. Glucocorticoids: do we know how they work? Arthritis Res. 2002;4(3):146–150. doi:10.1186/ar398
70. Scheinman RI, Cogswell PC, Lofquist AK, Baldwin AS. Role of transcriptional activation of I-Kappa-B-alpha in mediation of immunosuppression by glucocorticoids. Science. 1995;270(5234):283–286. doi:10.1126/science.270.5234.283
71. De Vera ME, Taylor BS, Wang Q, Shapiro RA, Billiar TR, Geller DA. Dexamethasone suppresses iNOS gene expression by upregulating I-kappa B alpha and inhibiting NF-kappa B. Am J Physiol Gastrointest Liver Physiol. 1997;273(6):G1290–G1296. doi:10.1152/ajpgi.1997.273.6.G1290
72. Dong K, Deng SJ, He BY, et al. Mucoadhesive nanoparticles enhance the therapeutic effect of dexamethasone on experimental ulcerative colitis by the local administration as an enema. Drug Des Devel Ther. 2023;17:191–207. doi:10.2147/DDDT.S390274
73. Carlson M, Raab Y, Seveus L, Xu S, Hallgren R, Venge P. Human neutrophil lipocalin is a unique marker of neutrophil inflammation in ulcerative colitis and proctitis. Gut. 2002;50(4):501–506. doi:10.1136/gut.50.4.501
74. Li QZ, Hu XL, Bai YP, et al. The oxidative damage and inflammatory response induced by lead sulfide nanoparticles in rat lung. Food Chem Toxicol. 2013;60:213–217. doi:10.1016/j.fct.2013.07.046
75. Szandruk M, Merwid-Lad A, Szelag A. The impact of mangiferin from Belamcanda chinensis on experimental colitis in rats. Inflammopharmacology. 2018;26(2):571–581. doi:10.1007/s10787-017-0337-0
76. Moret-Tatay I, Iborra M, Cerrillo E, Tortosa L, Nos P, Beltran B. Possible biomarkers in blood for crohn’s disease: oxidative stress and MicroRNAs-current evidences and further aspects to unravel. Oxid Med Cell Longev. 2016;2016:1.
77. Liu YX, Liu X, Hua WW, et al. Berberine inhibits macrophage M1 polarization via AKT1/SOCS1/NF-kappa B signaling pathway to protect against DSS-induced colitis. Int Immunopharmacol. 2018;57:121–131. doi:10.1016/j.intimp.2018.01.049
78. Gren ST, Grip O. Role of monocytes and intestinal macrophages in crohn’s disease and ulcerative colitis. Inflammat Bowel Dis. 2016;22(8). doi:10.1097/MIB.0000000000000824
79. Randhawa PK, Singh K, Singh N, Jaggi AS. A review on chemical-induced inflammatory bowel disease models in rodents. Korean J Physiol Pharmacol. 2014;18(4):279–288. doi:10.4196/kjpp.2014.18.4.279
80. Katsandegwaza B, Horsnell W, Smith K. Inflammatory bowel disease: a review of pre-clinical murine models of human disease. Int J Mol Sci. 2022;23:16. doi:10.3390/ijms23169344
81. Li CP, Luo XY, Li LF, Cai Y, Kang XH, Li PW. Carboxymethyl chitosan-based electrospun nanofibers with high citral-loading for potential anti-infection wound dressings. Int J Biol Macromol. 2022;209:344–355. doi:10.1016/j.ijbiomac.2022.04.025
 © 2024 The Author(s). This work is published and licensed by Dove Medical Press Limited. The
full terms of this license are available at https://www.dovepress.com/terms
and incorporate the Creative Commons Attribution
- Non Commercial (unported, 3.0) License.
By accessing the work you hereby accept the Terms. Non-commercial uses of the work are permitted
without any further permission from Dove Medical Press Limited, provided the work is properly
attributed. For permission for commercial use of this work, please see paragraphs 4.2 and 5 of our Terms.
© 2024 The Author(s). This work is published and licensed by Dove Medical Press Limited. The
full terms of this license are available at https://www.dovepress.com/terms
and incorporate the Creative Commons Attribution
- Non Commercial (unported, 3.0) License.
By accessing the work you hereby accept the Terms. Non-commercial uses of the work are permitted
without any further permission from Dove Medical Press Limited, provided the work is properly
attributed. For permission for commercial use of this work, please see paragraphs 4.2 and 5 of our Terms.