Back to Journals » International Journal of Nanomedicine » Volume 18
Development of High-Loading Trastuzumab PLGA Nanoparticles: A Powerful Tool Against HER2 Positive Breast Cancer Cells
Authors Caputo TM ![]() , Barisciano G
, Barisciano G ![]() , Mulè C, Cusano AM
, Mulè C, Cusano AM ![]() , Aliberti A
, Aliberti A ![]() , Muccillo L, Colantuoni V, Sabatino L, Cusano A
, Muccillo L, Colantuoni V, Sabatino L, Cusano A
Received 10 July 2023
Accepted for publication 12 October 2023
Published 24 November 2023 Volume 2023:18 Pages 6999—7020
DOI https://doi.org/10.2147/IJN.S429898
Checked for plagiarism Yes
Review by Single anonymous peer review
Peer reviewer comments 2
Editor who approved publication: Prof. Dr. Anderson Oliveira Lobo
Tania Mariastella Caputo,1,* Giovannina Barisciano,2,* Chiara Mulè,1 Angela Maria Cusano,3 Anna Aliberti,1 Livio Muccillo,2 Vittorio Colantuoni,2 Lina Sabatino,2 Andrea Cusano1,3
1Optoelectronics Group, Department of Engineering, University of Sannio, Benevento, Italy; 2Department of Sciences and Technologies, University of Sannio, Benevento, Italy; 3CeRICTscrl Regional Center Information Communication Technology, Benevento, Italy
*These authors contributed equally to this work
Correspondence: Anna Aliberti; Lina Sabatino, Email [email protected]; [email protected]
Background: Trastuzumab, a therapeutic monoclonal antibody directed against HER2, is routinely used to treat HER2-positive breast cancer with a good response rate. However, concerns have arisen in the clinical practice due to adverse side effects. One way to overcome these limitations is to encapsulate trastuzumab in nanoparticles to improve cytotoxic activity, increase intracellular drug concentrations, escape the immune system and avoid systemic degradation of the drug in vivo.
Methods: A double emulsion method was used to encapsulate trastuzumab into poly(lactic-co-glycolic) nanoparticles, effective for their biocompatibility and biodegradability. These nanocarriers, hereafter referred to as TZPs, were characterised in terms of size, homogeneity, zeta potential and tested for their stability and drug release kinetics. Finally, the TZPs cytotoxicity was assessed in vitro on the HER2 positive SKBR3 breast cancer cell line and compared to free trastuzumab.
Results: The TZPs were stable, homogeneous in size, with a reduced zeta potential. They showed higher encapsulation efficiency and drug loading, a prolonged trastuzumab release kinetics that retained its physicochemical properties and functionality. TZPs showed a stronger cytotoxicity and increased apoptosis than similar doses of free trastuzumab in the cell line analysed. Confocal microscopy and flow cytometry assessed TZPs and trastuzumab cellular uptake while Western blot evaluated downstream signalling, overall HER2 content and shedding.
Conclusion: TZPs exert more robust effects than free trastuzumab via a dual mode of action: TZPs are taken up by cells through an endocytosis mechanism and release the drug intracellularly for longer time. Additionally, the TZPs that remain in the extracellular space release trastuzumab which binds to the cognate receptor and impairs downstream signalling. This is the sole modality used by free trastuzumab. Remarkably, half dose of TZPs is as efficacious as the highest dose of free drug supporting their possible use for drug delivery in vivo.
Keywords: PLGA nanoparticles, double-emulsion method, trastuzumab, breast cancer, signaling transduction
Graphical Abstract:

Introduction
Breast cancer (BC) is the most commonly diagnosed cancer worldwide, accounting for 11.7% of total cases in both sexes.1 HER2-positive BC is characterised by overexpression of the HER2 or ERBB2 protein, a tyrosine kinase receptor belonging to the epidermal growth factor (EGF) tyrosine kinase family. This subgroup accounts for approximately 20–30% of all BC, and overexpression of HER2 is mainly due to amplification of the genomic locus, leading to a remarkable increase in the receptor at the cell surface.1 This facilitates ligand-independent homodimerization and heterodimerization with other members of the same family to activate multiple downstream signalling pathways involved in cell proliferation and, ultimately, in the malignant transformation of the cell (Figure 1A–C). Because upregulation of HER2 correlates with poor prognosis, targeting HER2 is an attractive therapeutic approach that has led to the development of Trastuzumab (TZ), a recombinant humanized monoclonal antibody that targets the IV extracellular subdomain of the receptor.2,3 TZ was the first biological drug approved by the Food and Drug Administration (FDA) in 1998 for the treatment of this specific BC subgroup. The binding of TZ inhibits dimerization of the receptor and suppresses HER2-mediated signalling, thereby inhibiting cell growth. Dimerization of HER2 implicates its own phosphorylation, which provides docking sites for several downstream effectors, particularly those involved in the phosphatidylinositol 3-kinase (PI3K)/protein kinase B (PKB/AKT) pathway. Activation of this pathway occurs through phosphorylation of AKT (p-AKT) and is a molecular hallmark of many human malignancies as it regulates cell growth, survival and motility.4 AKT phosphorylation at Ser473 has also been reported to promote BC metastasis.5 The binding to TZ not only inhibits HER2 dimerization and coupled signalling, but also stimulates degradation of the receptor (Figure 1D).6 In addition, TZ binding inhibits cleavage of the HER2 extracellular domain (ECD) by metalloproteinases, leading to its release as sHER2, the so-called soluble form, and the formation of a membrane-bound phosphorylated p95 that can still activate signal transduction pathways, as illustrated in Figure 1C.7
 |
Figure 1 Structure and function of the HER2 receptor and its inhibition by trastuzumab. (A–C) show the structure of the receptor, its activation, internalization, recycling and shedding; (D) illustrates how the monoclonal antibody trastuzumab (TZ) interacts with HER2 at a site in the IV extracellular domain of the receptor, impairing its function. |
Another biological activity of TZ in vivo is to promote the antibody-dependent cell-mediated cytotoxicity (ADCC). In this case, the constant fraction (Fc) of the antibody (TZ), already bound to its cognate receptor on cancer cells, is recognized by natural killer cells through the CD16 receptor so to activate innate immune cells to release lytic granules including perforins and granzyme B leading to cancer cell death. This activity indicates that, in in vivo models, TZ stimulates the immune system with a crucial anti-tumor effect, contributing to the overall therapeutic effects of TZ. A complete understanding of the role of ADCC in the immune response to TZ will allow to rationally combine these types of treatments in the context of HER2+ BC.
Although other anti-HER2 monoclonal antibodies (mAbs) (eg, pertuzumab) are currently available, TZ remains the gold standard for the treatment of this disease subtype. However, several issues have arisen with intravenous administration of TZ, including potential cardiotoxicity, treatment resistance, poor tumour retention, and weekly administration. Moreover, TZ-based therapy is subject to additional limitations due to its poor pharmacokinetics and low tumour penetration based on mAb size, tumour pressure gradient, and the “binding site barrier effect”.8 One potential approach to overcome these limitations and improve efficacy, bioavailability, and accumulation at the tumour site is to develop derivatization or encapsulation strategies of TZ into biodegradable and/or biocompatible carriers.9–13 In particular, nanoencapsulation acts like a ‘Trojan horse’ by protecting and masking the antibody from external agents and interaction with the immune system, thereby increasing its bioavailability and reducing adverse reactions. To this end, poly (lactic-co-glycolic acid) (PLGA), approved by US FDA and the European Medicine Agency (EMA) for polymeric nanoparticles is an excellent solution for carrier formulation. Due to their harmless properties, controlled release, biocompatibility, and biodegradability, PLGA-based carriers have been already used to reduce toxicity and improve mAbs therapy.12,14–18 In addition, PLGA carriers have several advantages over direct systemic injection of TZ, including longer residence time in the bloodstream and lower immunogenicity.15 Nanoencapsulation also allows for longer formulation shelf life and slows in vivo degradation with prolonged release of the entrapped mAb, which could lead to fewer administrations and improved patient compliance.14 However, the methods used to prepare carrier formulations are usually associated with harsh conditions that may lead to structural instability of the encapsulated mAb, affecting its bioactivity and increasing immunogenicity. Therefore, it is crucial to determine how the nanoencapsulation influences the stability of mAbs during the assembly of mAb-loaded PLGA nanoparticles.19 Only two previous studies have reported the development of mAb-loaded PLGA nanoparticles in which the native-like structure is not compromised and bioactivity is fully preserved; however, the low encapsulation efficiency (EE) remains as a major drawback.15,20 With this in mind, we report here the development of TZ-loaded PLGA nanoparticles designed to enhance cytotoxic activity by increasing intracellular mAb concentrations. The PLGA-TZ-loaded particles (TZPs) have a higher EE (57.7%) than previous preparations; the encapsulation protocol does not affect the structural integrity of the TZ or its functionality compared to free TZ. We provide evidence that TZPs enhance drug uptake and exert a remarkable cytotoxic effect on HER2+ BC cells in vitro, evaluated through multiple investigations. Remarkably, all biological effects are obtained with a TZPs dose equivalent to half of free TZ.
Materials and Methods
Materials
PLGA (Resomer® 504 H, 50:50 lactide: glycolide, acid terminated, MW 53200 Da), poloxamer (Pluronic F-127), Fluorescein isothiocyanate (FITC), Coumarin6 (C6), Ethyl acetate (EtOAc), trehalose, Polyvinyl alcohol (PVA), phosphate buffer saline (PBS) tablets and Paraformaldehyde (PFA) were purchased from Sigma Aldrich Co. (Merck KGaA, St. Louis, MO, USA). Water, acetonitrile and trifluoroacetic acid (TFA) LC-MS grade were from (ROMIL Ltd, Cambridge, UK). Deionized water (18.2MΩcm) was obtained from a Milli-Q Plus system (Merck Millipore, St. Louis MO, USA) with a total organic content (TOC) < 3 ppb. Trastuzumab (TZ-Herceptin®, Roche, Basel, Switzerland) was kindly provided by Prof. Colantuoni. All other solvents and reagents were obtained from Sigma-Aldrich Co (Merck KGaA, St. Louis, MO, USA).
Particle Synthesis
TZPs were synthesised by the double emulsion method. A total of 1 mL of PLGA solution (1.31 µmol) dissolved in ethyl acetate was emulsified with 800 µL of an aqueous solution of TZ (13.3 nmol) and poloxamer (0.8 µmol). The first emulsion was prepared by sonication with a microtip (Sonifier™ SFX150, Branson Ultrasonics, Emerson Electric Co, St. Louis, MO, USA) in two rounds for 60 seconds at an intensity of 38% on ice. Subsequently, the first emulsion was poured into 4 mL of a PVA water solution 2% w/v and sonicated as described above, resulting in a double water/oil/water emulsion. Finally, 8 mL of PVA 2% w/v was added and the solution was stirred overnight (16 h) at room temperature (RT) to facilitate evaporation of the organic solvent. After overnight stirring, free TZ was removed from the nanoparticles by centrifugation at 15,000 RPM, 4°C (Heraeus Fresco 21; Thermo Fisher Scientific, Waltham, MA, USA) for 30 min and the pellet washed 3 times with milliQ water.
For TZ labelling, the antibody (2 mg/mL) was dissolved in 0.1 M sodium carbonate buffer (pH 9) and mixed with 0.1 mL FITC (1 mg/mL) previously dissolved in dimethyl sulfoxide (DMSO). The solution was incubated overnight at 4°C, then the unbound FITC was removed by a centrifugal filter device (Amicon Ultra-0.5 centrifugal filter unit, 3 kDa MWCO - Merck Millipore, St. Louis MO, USA). The solution was washed several times with MilliQ water until no free dye was found in the wash solution. Finally, the antibody was recovered and the fluorescein/antibody molar ratio (F/P) and fluorescence bound TZ (F-TZ) concentration were calculated by absorbance measurement according to the manufacturer’s instructions. F-TZPs were prepared according to the procedure described above, replacing the TZ with the F-TZ.
The same procedure was used to obtain PLGA particles loaded with coumarin6 (C6). C6 was previously dissolved in DMSO (2 mg/mL), then diluted in MilliQ water and added to the aqueous phase (final concentration 100 µg/mL). At the end of incubation, nanoparticles were collected by centrifugation at 15,000 RPM, 4°C for 30 min, washed with bi-distilled water to remove the not encapsulated C6. All the particles (C6P) were freeze-dried by Alpha 1–2 LD (Martin Christ, Gefriertrocknungsanlagen GmbH, Osterode am Harz, Germany) with the addition of 1.25% w/v trehalose as cryoprotectant. The process yield was calculated after freeze-drying as the ratio of nanoparticles collected to the starting raw materials (TZ and polymers, cryoprotectant).
PLGA Nanoparticle Characterization by Dynamic Light Scattering (DLS)
Particle size and surface charge were determined using the DLS technique (Malvern Zetasizer Nano ZS instrument, 633 nm laser, dispersion angle of 173° - Malvern, UK) at controlled temperature (25°C). The lyophilized PLGA nanoparticles were dispersed in MilliQ water (1 mg/mL) and incubated at room temperature for 24 h. The solution was then diluted (0.05 mg/mL) and particle sample (700 µL) measurements were repeated five times. The solution was also used to measure the zeta potential using the same instrument and an appropriate cuvette.
Morphological Analysis by Atomic Force Microscopy (AFM)
Morphological characterization of PLGA nanoparticles was performed directly on a slide previously coated with a uniform Au layer using an atomic force microscope (Agilent Technologies 5420, Agilent Technologies, Santa Clara, CA, USA). AFM images were acquired by scanning the NPs film in tapping mode to avoid damage to the particles. All measurements were performed in the dry state. The raw data acquired by AFM were then processed using Pico Image software (Keysight Technologies, Santa Rosa, CA, USA).
Analysis by Fourier Transform Infrared Spectroscopy (FTIR)
NPs, TZPs and TZ were analysed by Fourier Transform Infrared Spectroscopy (FTIR). Spectral analysis was performed using a Spectrum 3 spectrometer (Perkin-Elmer Inc., Waltham, MA, USA) equipped with a total attenuated reflectance accessory (UATR). Spectra were acquired by ten scans with a resolution of 4 cm−1 in the spectral range of 650–4000 cm−1, and a series of three replicates of each formulation was performed.
Encapsulation Efficiency and Drug Loading Rate
To calculate the EE, PLGA nanoparticles were dissolved in DMSO at a final concentration of 10 mg/mL. The solution was centrifuged at 16,000 RCF for 20 min and the supernatant was analysed by Reversed-Phase High Liquid Chromatography (RP-HPLC).

where Ce is the free drug concentration recovered in the supernatant after centrifugation, and Ct is the theoretical concentration of TZ used for the particle preparation.
The percentage of Drug Loading (DL %) was calculated as follows:

where We is the weight of the encapsulated TZ and Wp is the weight of the particles used.
In vitro Drug Release Studies
For drug release analysis, TZPs (1 mg) were immersed in PBS (1 mL) in triplicate. The solutions were continuously shaken at 37 °C (ES-20, Orbital Shaker Incubator, Grant Instrumentations Ltd, Cambridge, UK). At specific time points, the solutions were centrifuged at 16,000 RPM for 20 min, and the supernatant was completely collected and replaced with 1 mL of fresh PBS. The release tests were performed for 36 days (864 h). Finally, the supernatant was completely removed, and the pellets dissolved in DMSO. The amount of drug recovered in the pellet was measured by HPLC as described above and used to calculate the total amount of encapsulated TZ. Release data are expressed as the cumulative percentage of drug analysed at each time point compared with the total amount (sum of all TZ measured at each time point plus the amount recovered in DMSO after particle dissolution). All experiments were performed in triplicate.
Trastuzumab Quantification by RP-HPLC
RP-HPLC analysis of TZ was performed on an UltiMate 3000 DIonex chromatographic instrument (Thermo-Fisher Scientific, Inc., Waltham, MA, USA) using a C4 column (2.1 x 100 mm, nanoparticles dimension 2.6 μm - BioZen Phenomenex Widepore C4, Phenomenex Inc. Torrance, CA, USA) at 80 °C, and TZ was detected with UV λ=280 nm. Elution was performed at 0.3 mL/min using mobile phases A (trifluoroacetic acid 0.08% v/v in water) and B (trifluoroacetic acid 0.08% in acetonitrile) with the following gradient: 15% B phase for 1 min; 15–90% B phase from 1 to 7 min; 90% B phase from 7 to 12 min; 90–15% B phase from 12 to 14 min; the column was finally conditioned with 15% B phase for 6 min. Under these conditions, the TZ retention time was approximately 6.5 min. For all release analyses, a volume of 80 µL was injected in duplicate. TZ concentrations were calculated from the calibration curve generated by analysing solutions between 50–1000 ng/mL of antibody.
Cell Culture and Treatments
The human breast cancer-derived cell lines MDA-MB-231, MDA-MB-468, (triple negative cell lines), MCF7, T47D, ZR-75-1 (luminal like or receptor positive cell lines), BT-474 (luminal like cell line) and SKBR3 (HER2+) was purchased from the American Type Culture Collection (ATCC, Rockville, MD, USA) and cultured at 37°C under 5% CO2 in DMEM or RPMI (Life Technologies-Thermo Fisher Scientific, Waltham, MA, USA) supplemented with 10% v/v fetal bovine serum (Life Technologies-Thermo Fisher Scientific, Waltham, MA, USA), 2 mM L-glutamine, and 100 U mL-1 penicillin/streptomycin (15140122 Gibco™ Thermo Fisher Scientific Waltham, MA, USA). BT-474 cells were grown in a medium containing 10% insulin. MCF-10A, a cell line derived from the normal breast epithelium, was purchased by ATCC and cultured in a DMEM/F12 medium supplemented with L-glutamine (standard concentration), Pen/Strept (standard concentrations), 5% horse serum, 0.5ug/mL hydrocortisone (stock solution prepared dissolving hydrocortisone in ethanol), 100ng/mL cholera toxin, 10ug/mL insulin, 20ng/mL EGF (human). Cells were checked regularly to exclude any contamination with mycoplasma. In all experiments, SKBR3 cells were treated with TZ at concentrations of 11 and 5.5 µg/mL or with the same amount of TZPs for the indicated periods. The concentration of naked particles (NPs), used as a negative control in addition to the untreated cells, was always calculated relative to the maximum concentration of TZPs used.
Evaluation of TZ Structural Integrity and Functionality Upon Nanoparticles Release
The integrity of the encapsulated monoclonal antibody was investigated using two different techniques. The molecular weight of the released antibody (TZ) was compared with that of Free-TZ by sodium dodecyl sulphate-polyacrylamide gel electrophoresis (SDS-PAGE). Specifically, TZ, released from TZPs during the first 72 h, was concentrated with AmiconUltra® (Merck Millipore, St. Louis, MO, USA) and equivalent volumes of the concentrated media were loaded onto a 10% (SDS-PAGE) under non-denaturing conditions, i.e without 2-mercaptoethanol and without boiling the samples. After gel run and transfer, the PVDF membrane was stained with the Ponceau S for calculating the amounts of proteins loaded in each lane or incubated with an anti-TZ human antibody (AP112P, Sigma-Aldrich Co. Merck KGaA, St. Louis, MO, USA), then washed and images acquired by chemiluminescence using ECL and a Chemidoc XRS apparatus (Bio-Rad, Hercules, CA, USA). To observe possible changes in TZ tertiary structure, we also performed fluorescence studies with the Fluoromax-Plus (Horiba Scientific, Kyoto, Japan) fluorescence spectrometer equipped with a 150-W Xenon arc lamp coupled to a monochromator and with low-volume (500 µL) 10 mm quartz cuvettes with a 10-mm optical path. Fluorescence excitation spectra were obtained in the range of 200 to 300 nm, with the emission wavelength fixed at 337 nm. Fluorescence emission spectra were recorded in the spectral range from 290 to 450 nm with an integration time of 0.1 s and a step size of 1 nm, and the excitation wavelength was fixed at 280 nm. All spectra were recorded with an excitation slit width of 0.24 mm and an emission slit width of 1.19 mm. The collected fluorescence intensity was subtracted from the buffer contribution and all values were normalized to the maximum intensity.
To test the binding selectivity of free or encapsulated F-TZ for the HER2 receptor, SKBR3 cells were plated at a density of 3*105 per channel using six-channel slides with a channel volume of 30 μL (IBIDI μ-Slide VI 0.4 ibiTreat - IBIDI GMBH Gräfelfing, Germany). After 48 h of incubation at 37 °C, cells were fixed with PFA 3% and incubated with 5.5 μg/mL F-TZ (free and encapsulated) for 1 h at room temperature (RT). Cells were then washed with PBS to remove unbound molecules and nuclei were stained with DAPI (4’-6-diamidino-2-phenylindole dihydrochloride, D9542 Sigma Aldrich Co., Merck KGaA, St. Louis, MO, USA), while cytosol was stained with α-tubulin, a representative protein of the cytoskeleton, (#T5168 Sigma Aldrich Co., Merck KGaA, St. Louis, MO, USA), using a PE-CY7-conjugated secondary antibody. Finally, the cells stored in PBS were analysed by Confocal Laser Scanning Microscopy (CLSM) (STELLARIS 8 - Leica Microsystems, Wetzlar, Germany). A white light laser tunable between 440 and 790 nm was used for excitation while a HC PL APO CS2 40x/1.10 water immersion objective was used for image acquisition. Emission signals were acquired with Power HyD detectors. The system was controlled using Leica Application Suite (LAS) X v4.3 software (Leica Microsystems, Wetzlar, Germany). The excitation wavelength and detection window for each dye were: DAPI (405 nm; 425–499 nm); FITC (492 nm; 504–529 nm); Cy7 (743 nm; 750–827 nm). For each sample, images were collected in triplicate.
Cellular Uptake by Flow Cytometry and CLSM
The uptake of coumarin 6-loaded PLGA nanoparticles (C6P) by SKBR3 cells was assessed by flow cytometry (BD FACS Verse - BD Biosciences, Franklin Lakes, NJ, USA). For this purpose, 3*105 cells were seeded in each well of a 6-well plate and incubated overnight. After medium replacement, cells were treated with 0.25–0.5 or 1 mg/mL C6P in time-course experiments (from 30 min to 24 h). At each time point, cells were washed twice with PBS, harvested, centrifuged, and resuspended in growth medium (2X). The final cell pellet was resuspended in 1 mL of PBS and used to assess cellular internalization.
For CLSM analysis, a total of 1*104 SKBR3 cells were seeded into each channel (IBIDI μ-Slide VI 0.4 ibiTreat- IBIDI GMBH Gräfelfing, Germany), and after overnight incubation, cells were washed and treated with 5.5 μg/mL free F-TZ and F-TZPs. At specific time points (30 min, 3, 6, and 24 h), cells were washed, fixed with 3% PFA, and stained with a cytoplasmic dye (α-tubulin #T5168 Sigma Aldrich Co., Merck KGaA, St. Louis, MO, USA), PE -CY7 secondary antibody, and DAPI. Cells were analysed by CLSM as described above.
Apoptosis and Cell Viability Assays
To test the ability of NPs, TZPs and free TZ to induce cytotoxicity, a cell viability assay (Presto blue Cell Proliferation Assay and cell counts - Invitrogen, Thermo Fisher Scientific Inc., Waltham, MA, USA) was performed by seeding 3*103 SKBR3 cells in each well of a 96-well plate in at least three replicates for each drug concentration. The cytotoxic effect was evaluated at 24 - 48 - 72 and 144 h from the beginning of the treatments and expressed as a percentage of dead cells in treated versus untreated control cells. For NPs, the concentrations ranged from 0 to 5.3 mg/mL; for free TZ, two concentrations (11 and 5.5 µg/mL) were used, based on the doses commonly used in the literature;21,22 the same two concentrations were used for TZPs.
Flow cytometry was used to detect apoptosis on treated cells, using the PE Annexin V Apoptosis Detection Kit I, according to the manufacturer’s instructions (559,763, BD Biosciences, Franklin Lakes, NJ, USA). In this case, 3*105 SKBR3 cells were seeded in each well of a 6-well plate and 20.000 events for each treatment were recorded and the results analysed using the FACSuite software v.1.0.5.3841 (BD Biosciences, Franklin Lakes, NJ, USA).
Flow Cytometry Analysis for HER2 Expression on the Plasma Membrane
SKBR3 cells (3*105) were plated in each well of a 6-well plate overnight under standard conditions; the next day, treatments started, and, at the indicated time points, cells were harvested, washed three times with PBS pH 7.4 containing Ca2+/Mg2+, and fixed with 3% PFA at RT for 10 min. After washing, cells were stained with a primary PE-CY7 conjugated anti-HER2 antibody (AMAB90628, Sigma-Aldrich Co., Merck KGaA, St. Louis, MO, USA). Finally, cells (20.000 events for each treatment) were evaluated by flow cytometry and the results analysed using FACSuite software v.1.0.5.3841 (BD Biosciences, Franklin Lakes, NJ, USA).
Western Blot Analysis
Protein extracts were analysed as previously reported.23 Briefly, cells were lysed in ice-cold lysis buffer containing 25 mM Tris-HCl, pH 7.5, 150 mM NaCl, 2 mM EDTA, 1% TritonX-100, 1% sodium deoxycholate, 0.1% SDS, and a cocktail of protease and phosphatase inhibitors (Roche, Basel, Switzerland). Protein concentration was determined by the Bradford method and equivalent amounts (30/50 µg) of each sample were heated to 95° C for 5 min and loaded onto 2-mercapto-ethanol-containing SDS-polyacrylamide gels, transferred to a PVDF membrane and then blocked with 5% non-fat dry milk. Antibodies to p-HER2 (Y1248 # 2247), HER2 N-term (#4290) HER2 (#3250), p-AKT (S473) (#9271), AKT (#9272) were from Cell Signaling Technology (Beverly, MA USA); β-Actin (F-3022) and α-Tubulin (T5168) were from Sigma-Aldrich Co. (Merck KGaA, St. Louis, MO, USA). Anti-mouse or anti-rabbit antibodies conjugated with horseradish peroxidase, were used as secondary antibodies. Bands were detected by the Clarity western ECL Substrate (#1705061, Bio-Rad, Hercules, CA, USA), using the ChemiDoc XRS Apparatus (Bio-Rad, Hercules, CA, USA). The intensity of the bands was evaluated by ImageLab software (Bio-Rad, Hercules, CA, USA) and normalized to that of a control protein (β-Actin or α-Tubulin). Some blots were cut and probed with different antibodies for different proteins including β-Actin or α-Tubulin. In some cases, to analyse proteins with similar molecular weight, PVDF membranes were subjected to a mild stripping protocol according to the recommendations of Abcam (Cambridge, UK). Culture medium samples were concentrated with AmiconUltra® (Merck Millipore, St. Louis MO, USA) to load for all samples the same amounts of proteins (50 μg/sample) to the polyacrylamide gel. For the detection of sHER2, an antibody against the N-terminal part of the receptor was used (#4290 Cell Signaling Technology, Inc., Beverly, MA USA). The amount of protein released into the medium was calculated by loading the same protein content for each sample and normalizing the values to those obtained by Ponceau S staining of the membrane.
Statistics
Statistical analyses were performed using GraphPad Prism 6 (GraphPad Software Inc, San Diego, CA, USA). Data are expressed as mean ± SEM of independent experiments performed at least in duplicate. The mean values from untreated or treated cells were compared by applying the t-test. The Tables under the figures illustrate the results obtained by comparing the single dose of each formulation to all others. Statistical significance (t-test) was considered when * p < 0.05, ** p < 0.01, *** p < 0.001. **** p < 0.0001, ns= not significant.
Results
Synthesis and Physio-Chemical Characterization of Naked and Trastuzumab-Loaded Nanoparticles
Particle Synthesis and Characterization
PLGA nanoparticles were synthesised according to the conventional double emulsion method (Figure 2A). The process parameters such as monomer concentration, excipient addition, homogenization parameters during preparation and reaction time were carefully investigated to obtain nanoparticles with maximum protein loading and minimum Poly Dispersion Index (PDI). The yield of the emulsion reaction after optimization was 48 ± 2%. All particles were characterised by Dynamic Light Scattering (DLS) in terms of size, surface charge, and morphology, as summarised in Table 1.
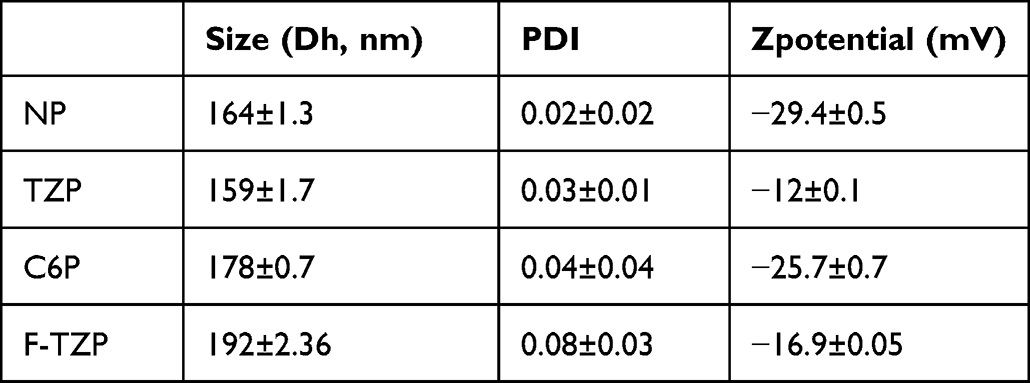 |
Table 1 DLS Measurements of PLGA Nanoparticles: Size and Surface Charge |
 |
Figure 2 Schematic representation of the double emulsion method used to prepare TZ-loaded PLGA nanoparticles. (A) The oil phase (polymer) and the water phase (TZ in water) were emulsified to obtain the primary emulsion. Then the emulsion was added to PVA solution and emulsified again to obtain the secondary emulsion. Finally, the particles were stirred overnight to evaporate the organic solvent and washed three times with water. The particle size was characterized by DLS. Specifically, the Z-size of PLGA nanoparticles loaded with TZ (B), Naked (C), coumarin 6-loaded (D), and FITC-labelled TZ (E) was performed five times with 50 μg/mL particles in water (forward scattering 173°). |
The DLS measurements showed that the nanoparticles from the different preparations have a diameter of less than 200 nm and a homogeneous distribution (PDI < 0.1) (Figure 2B–E). Specifically, the naked PLGA particles (NPs) have a diameter of 164 ± 1.3 nm and a surface charge of - 29.4 ± 0.5 mV, while the TZ-loaded particles (TZPs) have a diameter of 159 ± 1.7 nm and a surface charge of −12 ± 0.1 mV. The smaller particle size observed upon TZ encapsulation is due to the packing effect generated by the electrostatic interactions between the polyanionic charges of PLGA and the positive charges of the antibody. The effectiveness of TZ loading was confirmed by the remarkable change in the surface charge of the TZPs. The characteristic negative surface charge of the NPs is due to the deprotonated carboxyl end groups of the polymer constituents; however, in the presence of the positively charged antibody, the surface charge of the particles increases thanks to the strong electrostatic interaction with TZ (Δ= 17.4 mV). To study uptake by cells, PLGA particles were loaded with either coumarin 6 (C6P) or TZ previously labelled with FITC (F-TZPs). Coumarin 6 is a hydrophobic fluorescent marker that is encapsulated in the hydrophobic chains of the polymer,24 obtaining labelled nanoparticles (C6P) with high yield and low cost. In contrast, the method for labelling the monoclonal antibody (F-TZ) is time-consuming and expensive. Therefore, C6Ps were used to follow the path of polymeric nanoparticles by FACS analysis, which requires large amounts of samples, and F-TZPs were used for CLSM and zeta stack analysis, which need smaller amount of F-TZPs / F-TZ.
The C6Ps have a diameter of 178 ± 0.7 nm and a surface charge of −25 ± 0.7 mV. The TZ labelling procedure using FITC dye (F-TZ) was successfully performed with 78 ± 2% reaction yield and a fluorophore/protein (F/P) ratio of 2.5. This F/P ratio is comprised in the optimal range to retain the antibody functionality and at same time to achieve a good labelling efficiency.25
Compared to the TZPs, the F-TZPs have a larger diameter (192 ± 2.36 nm) and a more negative surface charge −16.9 ± 0.05 mV, due to the availability of fewer TZ amino groups after FITC labelling, which impair the aforementioned packing effect with the anionic charges of PLGA.
Morphological characterization of PLGA nanoparticles was also performed using Atomic Force Microscopy (AFM), Transmission electron microscopy (TEM) and and Fourier Transform Infrared Spectroscopy (FTIR-ATR). The AFM measurements showed that the nanoparticles were spherical, homogeneous in size with a diameter consistent with the DLS measurements (Figure 3A and B). The TEM images (Figure S1 A) showed that the TZPs were spherical, homogeneous in size with a diameter consistent with the DLS measurements. In addition, the TZ encapsulation process did not affect the surface morphology of the nanoparticles, which is free of defects and roughness. FTIR is a non-invasive technique commonly used to evaluate the secondary structure of proteins,26–29 even when they are encapsulated in particles.30 The FTIR spectra of NPs and TZPs (blue and magenta lines, respectively) are shown in Figure 3C. The blue and magenta lines share an intense peak at 1756 cm−1 due to the C=O stretching vibrations of the polymeric ester groups, and additional bands at 3348 cm−1 due to the OH stretching, at 3000 and 2944 cm−1 the C-H stretching bands. Compared to NPs, the TZPs spectra show an additional absorption band in the amide I bond region (1700–1600 cm−1, Figure 3D), corresponding to the C=O stretching vibrations of the amide group, the N-H bond bending, and the C-N stretching.31,32 This spectrum profile confirms the TZ encapsulation since these bands are exclusively present in the free TZ spectrum (black line). Several additional bands are attributed to the symmetric angular deformation of the carbonyl group CH3/CH2 (1500–1250 cm−1) and the asymmetric stretching vibrations of the ester C-O (1300–1000 cm−1).
 |
Figure 3 Morphological characterization of PLGA nanoparticles performed by AFM ((A): scale bar 2.5µm (B) is a magnification of a section of the picture in A, scale bar 1 µm) and FTIR-ATR (C and D). |
The amount of encapsulated and released TZ was quantified by Reverse-Phase High Liquid Chromatography (RP-HPLC). The optimised chromatographic method allows analysis of up to 50 ng of TZ with a single injection of 5 µL (Figure S1B). The EE and the % DL, calculated as described in the Methods section, correspond to 58.7 ± 3.5% and 1.4 ± 0.1%, respectively. To the best of our knowledge, there is only one study reporting the preparation of TZ-loaded PLGA nanoparticles using the double emulsion method. The optimised preparation presented here achieved a remarkable increase of EE by 21% and of DL by 0.5% compared to the previous formulation.
The in vitro TZ release profile from TZPs was validated in phosphate buffer at pH 7.4 and 37 °C. During the first 30 min, 30% of the encapsulated TZ is rapidly released from the particles (see the inset of Figure 4). The amount of released TZ increases during the following hours and reaches 49% after 24 h. The release proceeds evenly and slowly, reaching 54% after 36 days (864 h) (Figure 4).
 |
Figure 4 Cumulative release curve of trastuzumab from TZPs. The experiment was performed three times in PBS buffer at 37 °C. The inset shows the percentage of drug release during the first 24 h of incubation. The data are expressed as percentage of TZ released (amount of released over the total encapsulated TZ) vs time. |
The structural integrity and functionality of the TZ released from the nanoparticles was evaluated by several independent experimental studies, including Western blot, fluorescence, and CLSM. Western blot experiments show that the released TZ has the same molecular weight as the free TZ form (Figure 5A). Similarly, fluorescence was performed on the released TZ (as described in Materials Evaluation of TZ Structural Integrity and Functionality Upon Nanoparticles Release), and the emission and excitation spectra were compared to those of freshly prepared TZ at the same concentration. The fluorescence intensity spectra were subtracted from the buffer contribution and normalized to the maximum intensity collected. As shown in Figure 5B and C, the spectra overlapped, and no increase in emission maximum or change in bandwidth was observed between the released and fresh prepared free-TZ. These studies demonstrate that both released and free TZ have the same emission and excitation spectra (Figure 5B and C) thus confirming the stability of the mAB tertiary structure. This result is also possible thanks to the presence of a specific poloxamer (Pluronic) added to the TZ in the aqueous phase during emulsion to preserve its structural integrity. In particular, non-ionic surfactants, such as polyethylene oxide-polypropylene oxide-polyethylene oxide (PEO-PPO-PEO) triblock copolymers, have been shown to be safe, biocompatible and capable to improve the stability of biomolecules during chemical formulation.33 Of note, this specific poloxamer does not affect the stability and HER2-binding potential of the released TZ.
 |
Figure 5 Validation of TZ structural integrity and functionality after encapsulation in nanoparticles: (A) SDS-PAGE; (B) Emission and (C) Excitation spectra of released (black line) and free (red line) TZ; Confocal Laser Scanning Microscopy images of SKBR3 cells fixed and treated with (D) FITC-TZ, (E) FITC-TZPs or (F) Untreated cells. The nuclei are stained in blue, the tubulin in red and the FITC bound-TZ either encapsulated in PLGA particles (F-TZP) or in its free form (F-TZ) in green. |
Finally, the functional integrity of TZ was investigated by analysing its ability to bind to the HER2 receptor on the surface of SKBR3 cells using CLSM. These cells, representative of the HER2+ BC subtype, were grown, fixed, and treated with nanoparticles loaded with FITC-labelled TZ (F-TZPs) or free FITC-TZ (F-TZ) for 1 h. A fluorescent signal is detected on the cell surface due to the binding of F-TZ - released from F-TZPs - to HER2, similarly to free F-TZ. The signal is absent on the surface of untreated cells (Figure 5D–F). Overall, these data suggest that despite all synthetic procedures and freeze-drying, TZ retains its native structure and ability to bind to the HER2 receptor.
Characterization and Effects of Naked PLGA Nanoparticles (NPs)
We selected PLGA nanoparticles for carrier formulation because of their biocompatibility and biodegradability, as mentioned above. We further excluded any possible cytotoxic or morphological effect by exposing SKBR3 cells to increasing concentrations of NPs (from 0 to 5.3 mg/mL) and analysing cell viability and other parameters. No significant cytotoxic effects were detected even at the highest concentrations (Supplementary Information Figure S2A), as well as no differences in cell size, shape, and complexity by flow cytometry, as completely overlapping curves were obtained in treated vs untreated cells in the one-dimensional histogram (Figure S2B). Also, HER2 cell surface exposure did not change in SKBR3 cells exposed to NPs as above and tested with a PE-Cy7-labelled specific anti-HER2 antibody in flow cytometry. The position and height of the peak, marker of HER2, expressed as Mean Fluorescence Intensity (MFI), did not change in treated cells even with the highest NPs concentrations, as illustrated in the histograms in Figure S2C. Thus, the NPs do not exert any of the effects reported with TZPs.
Cellular Uptake of TZPs by SKBR3 Cells in vitro
To elucidate the uptake mechanism, we treated SKBR3 cells with free F-TZ or F-TZPs for 30 min, 3, 6 and 24 h and analysed them by CLSM. Cells treated with free F-TZ showed very low, if any, fluorescent signal after 30 min, which increased after 3 h, persisted at 6 h, and decreased after 24 h, being mostly confined to the inner cell surface (Figure 6A). This is likely due to the fact that TZ binds to HER2 and the resulting complex is subsequently degraded, as described in the following paragraph. In contrast, cells treated with F-TZPs showed intense fluorescence after 30 min, which increased at 3 and 6 h and decreased slightly at 24 h. Interestingly, the CLSM-derived Z-stack images (Figure 6B, C and Figure S3A–D) confirmed the striking fluorescence differences between the two conditions at 30 min and even more so at 3 h. These results suggest that free TZ acts exclusively by binding to the HER2 receptor, followed by endocytosis and degradation of the complex at the plasma membrane. TZPs, instead, are internalized more rapidly, distribute in the cytosol where persist ensuring a longer action (this ability is confirmed by the flow cytometry experiments with C6P as illustrated in Figure S4). Furthermore, the stronger fluorescent signal observed at 24 h on the surface of cells treated with TZPs can likely be ascribed to the TZ released from the nanoparticles still present in the extracellular space that can interact with the HER2 receptor.
 |
Figure 6 Confocal Laser Scanning Microscopy (CLSM) images of SKBR3 cells. (A) CLSM of SKBR3 cells untreated or treated with the same concentration of F-TZPs or free F-TZ for the indicated time points; (B); CLSM Z-stack images of SKBR3 treated with the same concentration of F-TZPs or free F-TZ after 30 min and (C) 3 h. The nuclei are stained in blue while the FITC bound-TZ either encapsulated in PLGA particles (F-TZP) or in its free form (F-TZ) are stained in green. |
Biological Effects of Free TZ versus TZ-Loaded PLGA Nanoparticles
We assessed the biological effects exerted by TZ on the SKBR3 cell line as a cell model system. These cells are representative of the HER2+ BC subtype and, in fact, together with BT-474, have been reported to express high levels of HER2 and respond to the treatments with TZ.15,34,35 In preliminary experiments (Figure S5), we tested a panel of different BC derived cell lines, representative of the most common tumor subtypes, for the expression of HER2. Total protein extracts from MDA-MB-231, MDA-MB-468 (triple negative cell lines), MCF7, T47D, ZR-75-1 (luminal like or receptor positive cell lines), BT-474 (luminal like, triple positive cell line) and SKBR3 (HER2+) were analysed by Western blot, along with extracts from MCF-10A, a cell line derived from the normal breast epithelium. As shown in Figure S5A, a band of about 185 kDa, corresponding to full length HER2, was detected at high levels only in SKBR3 and BT-474 cells; all the other cells exhibited low, if any, expression that was even lower in MCF-10A cells, the normal cell counterpart. An antibody to α-Tubulin was employed as a control that equivalent amounts of proteins were loaded in each lane.
The same cell lines were additionally tested for HER2 exposure on the cell surface by flow cytometry. As shown in the same Figure S5B, the analysis confirmed that SKBR3 and BT-474 expose HER2 on the membrane at high levels, while the others exhibit very low exposure. Based on the data from the literature and our preliminary results, we decided to test the in vitro effects of free TZ and PTZs only in SKBR3 cells, as it is a bona fide HER2+ cell line and one of the best responders to the treatment. BT-474 cells express high levels of HER2 but also the estrogen receptor (ER) and, thus, are classified as luminal like and for this reason not employed.
TZPs Enhance Y1248-Phosphorylation of HER2 Receptor and Impair Signalling Transduction
Autophosphorylation of tyrosine kinase receptors at selected residues in the intracellular kinase domain is closely associated with receptor dimerization and intracellular signalling. In the case of HER2, phosphorylation at the Y1248 residue by TZ is recognized by CSK-homologous kinase (CHK), a non-receptor tyrosine kinase also known as Megakaryocyte-Associated Tyrosine Kinase (MATK), that impairs the downstream signalling by degrading the receptor.36,37
We performed time-course experiments by exposing SKBR3 cells to the same concentrations of TZPs and free TZ and assessed HER2 Y1248 phosphorylation by immunoblot analysis using a specific antibody. TZPs stimulated a time-dependent and intense Y1248 phosphorylation, with a maximum at 6 h followed by a reduction at 24 h (Figure 7A and the histograms within). Both doses of free TZ induced a similar time-dependent but lower phosphorylation starting at 30 min, followed by a peak at 3 h and a gradual decrease at the subsequent time points. In both cases, the results refer to untreated cells. We then compared the phosphorylation level elicited by TZPs with that of the same doses of free TZ: with the exception of the 3 h time point, TZPs were more efficient in inducing Y1248-phosphorylation than the same free drug concentration (Figure 7A). In particular, the lowest concentration of TZPs was as effective as the highest dose of free TZ.
 |
Figure 7 Biological effects of encapsulated or free trastuzumab on SKBR3 cells. (A) Western blot assessment of HER2 Y1248 and AKT S473 phosphorylation on extracts from SKBR3 cells exposed to NP or two increasing concentrations of TZPs or free TZ for the indicated time points. The histograms report the quantification of the phosphorylation levels normalized to total HER2 or AKT, respectively; FC indicates Fold-Change. The tables below illustrate the results obtained by comparing the single dose of each formulation to all others using the same colour code as in the panel on the right side of the figure. (B) Viability of SKBR3 cells treated with NPs or two increasing concentrations of TZPs or free TZ for the indicated time points reported as percentage vs untreated CTR control cells. Data are reported as mean± SEM of two independent experiments performed at least in triplicate; the mean values from untreated or treated cells were compared by applying the t-test. Also, in this case, the tables below illustrate the results obtained by comparing the single dose of each formulation to all others using the same colour code as in the panel on the right side of the figure. Statistical significance was considered when * p <0.05, ** p < 0.01, ***p < 0.001. **** p < 0.0001, ns= not significant. |
To prove that the increased HER2 phosphorylation at Y1248 was associated with impairment of the AKT pathway, the major downstream signalling, we evaluated phosphorylation of the S473 residue, a marker of AKT activation (Figure 7A). TZPs caused a time-dependent reduction in S473 phosphorylation of about 43% at 30 min that increased at the following time points and persisted (- 75%) up to 24 h. The highest dose of free TZ reduced p-AKT by approximately 24% at 30 min and by about 50% at the following time points.
The histograms in the figure report the quantitation of the results vs untreated controls. Although TZPs tend to be more effective than free TZ at earlier times, both treatments at later time points reduce p-AKT to the same extent with no statistically significant differences between the two doses (Figure 7A). The empty particles showed no inhibition.
TZPs Inhibit Cell Proliferation and Induce Apoptosis
Impairment of the major transduction pathways downstream of HER2 is associated with reduced cell viability. We, thus, evaluated viability of SKBR3 cells treated as above (Figure 7B). TZPs at the lowest dose decreased viability from 31% to 39%, whereas at the highest dose from 41% to 47% at 24 and 144 h, respectively. Free TZ caused a similar dose- and time-dependent reduction in cell viability, ranging from 16% to 32% at the lowest dose and from 22% to 39% at the highest dose at 24 and 144 h, respectively. No significant changes were observed with NPs. These results indicate that TZPs exert a stronger and statistically significant cytotoxic effect than free TZ with respect to untreated cells (Figure 7B). Interestingly, TZPs loaded with the lowest dose (5.5 µg/mL) of TZ are as efficient as the highest dose (11 µg/mL) of free TZ (Figure 7B).
Subsequently, we investigated whether exposure to TZPs or free TZ could differentially influence cell death, particularly programmed cell death.38 To this end, SKBR3 cells, untreated or treated as above, were stained with PE-Annexin V and 7-Amino-Actinomycin (7-AAD) and assessed for the percentage of apoptotic cells by flow cytometry at different time points up to 144 h (Figure 8A and B). Both TZPs and free TZ triggered a dose- and time-dependent cell death that began at 24 h and lasted throughout the experiment. At 72 h time point, the two TZPs concentrations increased the percentages of apoptotic cells from 3.7 (untreated cells) to 17.1% and 11.2%, whereas the same doses of free TZ produced 11.7% and 8.6%, respectively. No significant changes in the percentage of apoptotic cells were observed upon treatment with NPs. Finally, by comparing the percentages of apoptotic cells exposed to the two formulations, TZPs exhibited a more robust and statistically significant effect than the corresponding concentrations of free TZ (Figure 8B). Remarkably, the lowest dose of TZPs displayed similar effects as the highest dose of free TZ (Figure 8B). Scatter plots of a representative apoptotic assay are shown in Figure 8A, while the histograms within Figure 8B report the mean percentages of apoptotic cells (early and late apoptotic cells) in treated vs untreated cells as from several independent experiments.
 |
Figure 8 TZPs and TZ induce programmed cell death in SKBR3 cells. (A) Flow cytometry analysis of SKBR3 cells treated with NPs or two increasing concentrations of TZPs or free TZ for the indicated time points and stained with PE-Annexin V and 7-Amino-Actinomycin (7-AAD). The scatter plots report the percentages of viable cells (lower left quadrant), necrotic cells (upper left quadrant), early and late apoptotic cells (lower and upper right quadrants) at 72 h in a representative experiment. (B) The histograms report the quantification of early and late apoptotic cells expressed as percentage vs untreated control cells at the indicated time points. The tables below illustrate the results obtained by comparing the single dose of each formulation to all others, using the same colour code as in the panel on the right side of the figure. Data are reported as mean± SEM of two independent experiments performed in triplicate; the mean values from untreated or treated cells were compared by applying the t-test. Statistical significance was considered when * p < 0.05, ** p < 0.01, *** p < 0.001. **** p < 0.0001, ns= not significant. |
TZPs Enhance HER2 Endocytosis and Degradation
Tyrosine kinase receptors, including HER2, upon ligand binding, dimerization and autophosphorylation, undergo internalization and recycling. TZ binds to HER2 and, as mentioned above, induces Y1248 phosphorylation and degradation without recycling, impairing the downstream signalling.2,6,39,40 We confirmed these events by performing flow cytometry analysis of SKBR3 cells treated with TZPs or free TZ as above, fixed and exposed to a specific anti-HER2 antibody (Figure 9A and B). TZPs reduced the membrane-exposed receptor, expressed as MFI, in a dose-dependent manner; the diminution with the highest dose was more than 50% at 24 h, reaching 60% at 72 h (Figure 9A, central panels, heavy and light green lines and Figure 9B). In contrast, free TZ did not show a similar dose-dependency; the highest concentration reduced HER2 by 50% at all-time points (Figure 9A, right panels, heavy and light orange lines, Figure 9B). The naked particles displayed a fluorescence similar to untreated labelled cells (CTRL - black line) and higher than the isotype of the same cells (Figure 9A, left panel, grey line).
 |
Figure 9 TZPs and TZ promote HER2 endocytosis and reduce shedding. (A) Flow cytometry analysis of cell surface HER2 in SKBR3 cells untreated (black line) or treated with NPs (grey line) or two increasing concentrations of TZPs (heavy and light green line) or free TZ (heavy and light orange line) for 24 h. The percentage of cell counts are reported on the y axis, while the Fluorescence Intensity on the x axis. The right-most panel is the merge of the single panels. (B) The histograms report the quantification of HER2 levels, expressed as percentage vs untreated controls, after treatment with NPs (grey), TZPs (heavy and light green) or free TZ (heavy and light orange). The tables below illustrate the results obtained by comparing the single dose of each formulation to all others, using the same colour code as in the panel on the right side of the figure. Statistical significance was considered when * p < 0.05, ** p < 0.01, *** p < 0.001. **** p < 0.0001, ns= not significant. (C) Western blot analysis of total HER2 protein in SKBR3 cells untreated or treated as above for the indicated time points. The histograms report the quantification after normalization to α-Tubulin used as protein loading control. The tables below illustrate the results obtained by comparing the single dose of each formulation to all others, using the same colour code as in the panel on the right side of the figure. Statistical significance was considered when * p < 0.05, ** p < 0.01, *** p < 0.001. **** p < 0.0001, ns= not significant. (D) Western blot analysis of the soluble form of HER2 (sHER2) present in the concentrated conditioned media of SKBR3 cells treated with NPs or TZPs as above for the indicated time points. The histograms show the relative quantification after normalization to protein loading through Ponceau S staining of the filter. The tables below illustrate the results obtained by comparing the single dose of each formulation to all others, using the same colour code as in the panel on the right side of the figure. Statistical significance was considered when * p < 0.05, ** p < 0.01, *** p < 0.001. **** p < 0.0001, ns= not significant. |
We, then, analysed the total amount of HER2 in extracts from cells treated as above. TZPs produced a diminution of about 35% at 24 and 48 h, reaching 55% at 72 h (Figure 9C). Free TZ reduced HER2 by 25% at 24 and by 55% at 72 h. By comparing the effects elicited by the single doses of each formulation, the highest dose of TZPs was more efficient than the corresponding dose of free TZ at 48 and 72 h (55% vs 45%) in a statistically significant manner (Figure 9C).
Overall, TZPs induce a greater reduction of HER2 both at the cell surface and as total protein, likely through a more pronounced degradation process; in particular, the effects of the lowest dose of TZPs are similar to those obtained with the highest dose of free TZ (Figure 9C).
TZPs Reduce HER2 Shedding
HER2 undergoes a shedding event, i e, a proteolytic cleavage of the extracellular domain (ECD), resulting in a truncated, soluble form defined sHER2. This isoform is released into the extracellular milieu and from there enters the bloodstream where it can be detected and quantified.41 Several studies have shown a direct correlation between sHER2 levels and tumour severity, such that a reduction in sHER2 levels in patients during treatment with TZ correlates with a better clinical outcome, suggesting a contribution to tumor aggressiveness, metastasis, and morbidity.42 In line, TZ impairs sHER2 production in SKBR3 and BT474 cell lines by inhibiting the activity of metalloproteinases.43 We, thus, investigated if TZPs affect sHER2 formation differently from free TZ on SKBR3 cells in time-course experiments. Western blot analysis of concentrated conditioned media showed that TZPs reduced HER2 shedding more robustly than free TZ at both doses in a time-dependent manner (40% to 50% versus 25% to 35% at 24 and 72 h, respectively), as shown by the representative histograms and blots in Figure 9D. Of note, the more pronounced effect obtained by TZPs is likely due to the different mode of action of the two formulations (see Figure 9D).
Discussion
The introduction of monoclonal antibodies, such as TZ, into the therapeutic armamentarium to fight cancer represented a breakthrough and raised many expectations of better control with improved clinical efficacy combined with reduced systemic toxicity of conventional chemotherapeutics.44,45 TZ remains the gold standard for the treatment of HER2+ BC subtype with great benefits and higher success rate; however, there are some drawbacks in the clinical practice, mainly related to safety issues and resistance. To minimise these limitations and increase the bioavailability of the antibody, nanocarriers loaded with TZ are a reasonable alternative because they are biodegradable and biocompatible and improve cellular uptake so that the antibodies can enter the cell and be protected from lysosomal degradation. Among the available methods for encapsulating antibodies, the water-oil-water (w/o/w) double emulsion is the most robust and is obtained by homogenising/sonification the primary emulsion containing the monoclonal antibody with an aqueous surfactant solution. This method was applied and optimised in this study to obtain PLGA nanoparticles loaded with the monoclonal antibody TZ. For the oil phase, PLGA polymer in a 50:50 monomer composition was used because it represents an excellent polymer for in vivo application, due to its low systemic toxicity and slow degradation rate.46 Nanocarriers are usually synthesised under harsh conditions that can lead to structural instability, compromise bioactivity, and increase the immunogenicity of the encapsulated monoclonal antibodies. The double emulsion procedure used here does not require extreme chemical conditions; moreover, the water phase was enriched with a poloxamer to stabilize TZ and prevent its migration at the interface. Finally, the molar ratio between the polymer and the TZ was optimised and fixed at 100:1 to obtain reproducible and monodisperse nanoparticles. The resulting TZ-loaded nanoparticles exhibit a significant decrease in size and surface charge, which strongly affect the carrier-cell interaction and uptake. Indeed, since the cell membrane usually has a negative charged surface area, carriers with weakly negative or positive surface charge are preferred to maximise carrier-cell interaction.47
Using this synthetic method, we achieved an EE of about 57.7% and a DL of 1.4%, which are significantly higher than those previously reported.15 Noticeably, the present synthetic procedure does not use harsh conditions and does not affect the physicochemical properties of the encapsulated antibody that fully retains its biological activities.
These results are in line with a previous publication reporting the development of a bevacizumab-loaded PLGA nanoparticles formulation in which the effects on drug release, native-like structure, and bioactivity of the released drug were evaluated and retained.20
Collectively, the TZ-loaded PLGA nanoparticles used in this study exhibit nanometric size, spherical shape, narrow distribution, and homogeneous surface morphology and charge, which strongly support their biological effects in vitro and potential use for drug delivery in vivo. The encapsulated TZ is released in vitro at a rate of about 30% after only 30 minutes, reaches a plateau of about 50% in the first 24 h, and remains stable for more than 36 days. Sustained release, up to 78% after 30 days, has been reported previously.15 The difference in the kinetics could be explained by the higher amount of TZ encapsulated in our nanoparticles which interacts more strongly with the carboxylic acid end groups of the polymers, thus delaying the release profile.
Finally, we investigated the cytotoxic effects of TZ on SKBR3, a HER2+ BC derived cell line, and report that TZPs exert more robust effects than the free TZ, likely through a dual mechanism of action. On the one hand, the TZPs present in the extracellular space release the encapsulated TZ that interacts exclusively with the HER2 receptor on the cell surface. This binding reduces the amount of the exposed receptor, increases the inactivating phosphorylation at Y1248, lowers the p-AKT at S473, ultimately impairing intracellular signalling. This is the unique mode of action of the free TZ and, in fact, the increase of the p-Y1248 and reduction of p-AKT S437 by TZPs are similar to those produced by free TZ. The only difference is that the TZPs exert a longer effect likely due to the prolonged release of the drug from the particles still present in the extracellular milieu.
On the other hand, TZPs are taken up by the cells through an endocytic mechanism as already reported15 and documented here by the confocal microscopy images. This modality ensures a higher amount of the drug delivered into the cell and persisting effects. It is, thus, conceivable that the effects of the TZ released from the internalized TZPs add to those of the drug released from the nanoparticles still present in the extracellular space. This hypothesis is corroborated by the more pronounced and statistically significant TZPs effects on cell viability, apoptosis, HER2 total protein level and shedding than free TZ. No toxic effects occurred with the naked nanoparticles even at the highest concentrations, confirming the safety of the chosen nanocarriers and demonstrating that the effects are solely due to the encapsulated TZ.
In our work, the cytotoxic effect is remarkably improved thanks to the optimization of the synthesis, enabling higher TZ encapsulation in the nanoparticles (EE 57.7%). Indeed, TZ-loaded PLGA nanoparticles have previously been reported achieving an EE of 37.5% and sustained release of 78% in 30 days.15 The same study reported that TZ-loaded PLGA nanoparticles are more cytotoxic than free TZ at the same antibody concentration (11.8 µg/mL) on HER2+ BC cells. In line, our TZPs (5.5 µg/mL) are as efficient in cytotoxicity as the double the dose of previously reported PLGA-TZ particles (11.8 µg/mL) and free TZ (11 µg/mL). Thus, the enhanced encapsulation efficiency synergizes with the dual mechanism of action of TZ-loaded nanoparticles to achieve this remarkable and statistically significant result.
The relevance of our observation that TZPs configuration produces the same positive results as free TZ at a lower concentration will be strengthened by in vivo animal studies. In fact, should they confirm the reduced adverse side effects and toxicity reported for in vivo applications of free TZ, the potential translation of these results into the clinical practice would be more feasible. To our knowledge, this is the first study that reports the generation of PLGA nanoparticles with some new implementations that assure a higher TZ loading, prolonged release kinetics and marked cytotoxic effects.
Conclusions
In this study, we report the efficient encapsulation of TZ in PLGA nanoparticles using a reliable and simple double emulsion method. We show that the TZPs are capable of loading a higher drug amount and releasing a biologically active molecule with a fast and prolonged kinetics. We also provide evidence that TZPs operate in vitro with a dual mechanism: on the one hand, they remain in the extracellular space for longer times and release TZ that can bind to HER2 and interfere with the receptor-mediated downstream signalling. On the other hand, the TZPs are endocytosed by target cells and release the drug intracellularly over long periods of time. Remarkably, the strongest cytotoxic effects exerted by TZPs are achieved with half the dose of free TZ. Our study represents a new paradigm for BC therapy, as TZPs protect and release the drug in a controlled manner, increase cytotoxic activity, reduce the amount of mAb administered, and could limit the adverse side effects in vivo. Such experiments are required to validate the activities reported here and to evaluate pharmacokinetics, systemic toxicity, and tissue distribution. The efficacy of the nanodelivery can be further enhanced by encapsulating other cytotoxic drugs or chemotherapeutics in combination. In addition, the specificity of action can be further enhanced by decorating the PLGA surface with oriented TZ or other molecules that can be recognized by cognate receptors on the target cells or tissues. These results may pave the way for the efficient use of TZPs in the clinical practice.
Data Sharing Statement
The data, analytical methods and study materials that support the findings of this study can be made available on request to the corresponding authors who manage the information.
Acknowledgments
The support from projects “NANOFOTONICA PER LA LOTTA AL CANCRO- NANOCAN” POR CAMPANIA FESR 2014-2020 and “PIATTAFORME INNOVATIVE PER LA TERANOSTICA IN PATOLOGIE TUMORALI (OVERALL)” POR CAMPANIA FESR 2014-2020 is gratefully acknowledged.
Disclosure
The authors declare no conflicts of interest.
References
1. Sung H, Ferlay J, Siegel RL, et al. Global cancer statistics 2020: GLOBOCAN estimates of incidence and mortality worldwide for 36 cancers in 185 countries. CA Cancer J Clin. 2021;71(3):2009–2249. doi:10.3322/caac.21660
2. Vu T, Claret FX. Trastuzumab: updated mechanisms of action and resistance in breast cancer. Front Oncol. 2012;2:62. doi:10.3389/fonc.2012.00062
3. Carter P, Presta L, Gorman CM, et al. Humanization of an anti-p185HER2 antibody for human cancer therapy. Proc Natl Acad Sci USA. 1992;89(10):4285–4289. doi:10.1073/pnas.89.10.4285
4. Ruiz-Saenz A, Dreyer C, Campbell MR, et al. HER2 amplification in tumors activates PI3K/Akt signaling independent of HER3. Cancer Res. 2018;78(13):3645–3658. doi:10.1158/0008-5472.CAN-18-0430
5. Shaw RJ, Cantley LC. Ras, PI(3)K and mTOR signalling controls tumour cell growth. Nature. 2006;441(7092):424–430. doi:10.1038/nature04869
6. Cheng J, Liang M, Carvalho MF, et al. Molecular mechanism of HER2 rapid internalization and redirected trafficking induced by anti-HER2 biparatopic antibody. Antibodies. 2020;9(3):1–21. doi:10.3390/antib9030049
7. Austin CD, De Mazière AM, Pisacane PI, et al. Endocytosis and sorting of ErbB2 and the site of action of cancer therapeutics trastuzumab and geldanamycin. Mol Biol Cell. 2004;15(12):5268–5282. doi:10.1091/mbc.e04-07-0591
8. Fujimori K, Covell DG, Fletcher JE, et al. A modeling analysis of monoclonal antibody percolation through tumors: a binding-site barrier. J Nucl Med. 1990;31(7):1191–1198.
9. Jafarzadeh N, Nadafan M, Malekfar R, et al. Structural, optical and dielectric studies of Ag nanoparticles decorated by herceptin. Phys E Low-Dimensional Syst Nanostructures. 2019;114:113562.
10. Guo L, Zhang H, Liu P, et al. Preclinical assessment of paclitaxel- and trastuzumab-delivering magnetic nanoparticles Fe3O4 for treatment and imaging of HER2-positive breast cancer. Front Med. 2021;8:738775. doi:10.3389/fmed.2021.738775
11. Catala A, Dzieciatkowska M, Wang G, et al. Targeted intracellular delivery of trastuzumab using designer phage lambda nanoparticles alters cellular programs in human breast cancer cells. ACS Nano. 2021;15(7):11789–11805. doi:10.1021/acsnano.1c02864
12. Dhritlahre RK, Saneja A. Recent advances in HER2-targeted delivery for cancer therapy. Drug Discov Today. 2021;26(5):1319–1329. doi:10.1016/j.drudis.2020.12.014
13. Kumar Mehata A, Bharti S, Singh P, et al. Trastuzumab decorated TPGS-g-chitosan nanoparticles for targeted breast cancer therapy. Colloids Surf B Biointerfaces. 2019;173:366–377. doi:10.1016/j.colsurfb.2018.10.007
14. Shao L, Shen S, Liu H. Recent advances in PLGA micro/nanoparticle delivery systems as novel therapeutic approach for drug-resistant tuberculosis. Front Bioeng Biotechnol. 2022;10:941077. doi:10.3389/fbioe.2022.941077
15. Colzani B, Pandolfi L, Hoti A, et al. Investigation of antitumor activities of trastuzumab delivered by PLGA nanoparticles. Int J Nanomedicine. 2018;13:957–973. doi:10.2147/IJN.S152742
16. Zhou Z, Badkas A, Stevenson M, et al. Herceptin conjugated PLGA-PHis-PEG pH sensitive nanoparticles for targeted and controlled drug delivery. Int J Pharm. 2015;487(1–2):81–90. doi:10.1016/j.ijpharm.2015.03.081
17. Badkas A, Frank E, Zhou Z, et al. Modulation of in vitro phagocytic uptake and immunogenicity potential of modified Herceptin®-conjugated PLGA-PEG nanoparticles for drug delivery. Colloids Surf B Biointerfaces. 2018;162:271–278. doi:10.1016/j.colsurfb.2017.12.001
18. Spreen H, Barth C, Keuter L, et al. Tuning the protein Corona of PLGA nanoparticles: characterization of trastuzumab adsorption behavior and its cellular interaction with breast cancer cell lines. J Drug Deliv Sci Technol. 2022;74:103543. doi:10.1016/j.jddst.2022.103543
19. Determan AS, Wilson JH, Kipper MJ, et al. Protein stability in the presence of polymer degradation products: consequences for controlled release formulations. Biomaterials. 2006;27(17):3312–3320. doi:10.1016/j.biomaterials.2006.01.054
20. Sousa F, Cruz A, Fonte P, et al. A new paradigm for antiangiogenic therapy through controlled release of bevacizumab from PLGA nanoparticles. Sci Rep. 2017;7(1):3736. doi:10.1038/s41598-017-03959-4
21. Slamon D, Fendly B, Maneval D. Radiolabeled antibody targeting of the HER-2/neif oncoprotein. Cancer Res. 1992;52(7):1916–1923.
22. Pegram M, Hsu S, Lewis G, et al. Inhibitory effects of combinations of HER-2/neu antibody and chemotherapeutic agents used for treatment of human breast cancers. Oncogene. 1999;18(13):2241–2251. doi:10.1038/sj.onc.1202526
23. Barisciano G, Colangelo T, Rosato V, et al. miR-27a is a master regulator of metabolic reprogramming and chemoresistance in colorectal cancer. Br J Cancer. 2020;122(9):1354–1366. doi:10.1038/s41416-020-0773-2
24. Pamujula S, Hazari S, Bolden G, et al. Cellular delivery of PEGylated PLGA nanoparticles. J Pharm Pharmacol. 2012;64(1):61–67. doi:10.1111/j.2042-7158.2011.01376.x
25. Shaleen V, Mekhedov E, Humphrey G, et al. Fluorescent-labeled antibodies: balancing functionality and degree of labeling. Anal Biochem. 2010;402(2):146–150. doi:10.1016/j.ab.2010.03.036
26. Jiang Y, Li C, Nguyen X, et al. Qualification of FTIR spectroscopic method for protein secondary structural analysis. J Pharm Sci. 2011;100(11):4631–4641. doi:10.1002/jps.22686
27. Yang S, Zhang Q, Yang H, et al. Progress in infrared spectroscopy as an efficient tool for predicting protein secondary structure. Int J Biol Macromol. 2022;206:175–187. doi:10.1016/j.ijbiomac.2022.02.104
28. Hering JA, Haris PI. FTIR spectroscopy for analysis of protein secondary structure. Adv Biomed Spectrosc. 2009;2:129–167.
29. Derenne A, Derfoufi KM, Cowper B, et al. FTIR spectroscopy as an analytical tool to compare glycosylation in therapeutic monoclonal antibodies. Anal Chim Acta. 2020;1112:62–71. doi:10.1016/j.aca.2020.03.038
30. Mihály J, Deák R, Szigyártó IC, et al. Characterization of extracellular vesicles by IR spectroscopy: fast and simple classification based on amide and C-H stretching vibrations. Biochim Biophys Acta - Biomembr. 2017;1859(3):459–466. doi:10.1016/j.bbamem.2016.12.005
31. Kong J, Yu S. Fourier transform infrared spectroscopic analysis of protein secondary structures protein FTIR data analysis and band assignment. Acta Biochim Biophys Sin. 2007;39(8):549–559. doi:10.1111/j.1745-7270.2007.00320.x
32. Sukumaran S. Protein secondary structure elucidation using FTIR spectroscopy Application note. Thermo Fischer; 2022.
33. Rey-Rico A, Cucchiarini M. PEO-PPO-PEO tri-block copolymers for gene delivery applications in human regenerative medicine—an overview. Int J Mol Sci. 2018;19(3):775. doi:10.3390/ijms19030775
34. Yakes FM, Chinratanalab W, Ritter CA, et al. Herceptin-induced inhibition of phosphatidylinositol-3 kinase and Akt is required for antibody-mediated effects on p27, cyclin D1, and antitumor action. Cancer Res. 2002;62(14):4132–4141.
35. Magnifico A, Albano L, Campaner S, et al. Tumor-initiating cells of HER2-positive carcinoma cell lines express the highest oncoprotein levels and are sensitive to trastuzumab. Clin Cancer Res. 2009;15(6):2010–2021. doi:10.1158/1078-0432.CCR-08-1327
36. Diermeier S, Horváth G, Knuechel-Clarke R, et al. Epidermal growth factor receptor coexpression modulates susceptibility to Herceptin in HER2/neu overexpressing breast cancer cells via specific erbB-receptor interaction and activation. Exp Cell Res. 2005;304(2):604–619. doi:10.1016/j.yexcr.2004.12.008
37. Dokmanovic M, Wu Y, Shen Y, et al. Trastuzumab-induced recruitment of Csk-homologous kinase (CHK) to ErbB2 receptor is associated with ErbB2-Y1248 phosphorylation and ErbB2 degradation to mediate cell growth inhibition. Cancer Biol Ther. 2014;15(8):1029–1041. doi:10.4161/cbt.29171
38. Carpenter RL, Lo HW, Regulation of Apoptosis by HER2 in breast cancer. J Carcinog Mutagen. 2013;Suppl 7:003. doi:10.4172/2157-2518.S7-003
39. Klapper LN, Waterman H, Sela M, et al. Tumor-inhibitory antibodies to HER-2/ErbB-2 may act by recruiting c-Cbl and enhancing ubiquitination of HER-2. Cancer Res. 2000;60(13):3384–3388.
40. Clynes RA, Towers TL, Presta LG, et al. Inhibitory Fc receptors modulate in vivo cytoxicity against tumor targets. Nat Med. 2000;6(4):443–446. doi:10.1038/74704
41. Tsé C, Gauchez AS, Jacot W, et al. HER2 shedding and serum HER2 extracellular domain: biology and clinical utility in breast cancer. Cancer Treat Rev. 2012;38(2):133–142.
42. Christianson TA, Doherty JK, Lin YJ, et al. NH2-terminally truncated HER-2/neu protein: relationship with shedding of the extracellular domain and with prognostic factors in breast cancer. Cancer Res. 1998;58(22):5123–5129.
43. Molina MA, Codony-Servat J, Albanell J, et al. Trastuzumab (Herceptin), a humanized anti-HER2 receptor monoclonal antibody, inhibits basal and activated HER2 ectodomain cleavage in breast cancer cells. Cancer Res. 2001;61(12):4744–4749.
44. Hudis CA. Trastuzumab — mechanism of Action and Use in Clinical Practice. N Engl J Med. 2007;357(1):39–51. doi:10.1056/NEJMra043186
45. Hansel TT, Kropshofer H, Singer T, et al. The safety and side effects of monoclonal antibodies. Nat Rev Drug Discov. 2010;9(4):325–338. doi:10.1038/nrd3003
46. Danhier F, Ansorena E, Silva JM, et al. PLGA-based nanoparticles: an overview of biomedical applications. J Control Release. 2012;161(2):505–522. doi:10.1016/j.jconrel.2012.01.043
47. Behzadi S, Serpooshan V, Tao W, et al. Cellular uptake of nanoparticles: journey inside the cell. Chem Soc Rev. 2017;46(14):4218–4244. doi:10.1039/c6cs00636a
 © 2023 The Author(s). This work is published and licensed by Dove Medical Press Limited. The
full terms of this license are available at https://www.dovepress.com/terms
and incorporate the Creative Commons Attribution
- Non Commercial (unported, 3.0) License.
By accessing the work you hereby accept the Terms. Non-commercial uses of the work are permitted
without any further permission from Dove Medical Press Limited, provided the work is properly
attributed. For permission for commercial use of this work, please see paragraphs 4.2 and 5 of our Terms.
© 2023 The Author(s). This work is published and licensed by Dove Medical Press Limited. The
full terms of this license are available at https://www.dovepress.com/terms
and incorporate the Creative Commons Attribution
- Non Commercial (unported, 3.0) License.
By accessing the work you hereby accept the Terms. Non-commercial uses of the work are permitted
without any further permission from Dove Medical Press Limited, provided the work is properly
attributed. For permission for commercial use of this work, please see paragraphs 4.2 and 5 of our Terms.