Back to Journals » Journal of Inflammation Research » Volume 14
Development of an Interferon Gamma Response-Related Signature for Prediction of Survival in Clear Cell Renal Cell Carcinoma
Authors Liu L, Du X, Fang J ![]() , Zhao J, Guo Y, Zhao Y, Zou C
, Zhao J, Guo Y, Zhao Y, Zou C ![]() , Yan X, Li W
, Yan X, Li W
Received 12 August 2021
Accepted for publication 23 September 2021
Published 27 September 2021 Volume 2021:14 Pages 4969—4985
DOI https://doi.org/10.2147/JIR.S334041
Checked for plagiarism Yes
Review by Single anonymous peer review
Peer reviewer comments 3
Editor who approved publication: Professor Ning Quan
Lixiao Liu,1,* Xuedan Du,2,* Jintao Fang,3,* Jinduo Zhao,1 Yong Guo,3 Ye Zhao,1 Chengyang Zou,1 Xiaojian Yan,1 Wenfeng Li2
1Department of Obstetrics and Gynecology, The First Affiliated Hospital of Wenzhou Medical University, Wenzhou, Zhejiang, People’s Republic of China; 2Department of Chemoradiation Oncology, The First Affiliated Hospital of Wenzhou Medical University, Wenzhou, Zhejiang, People’s Republic of China; 3Department of Urinary Surgery, The First Affiliated Hospital of Wenzhou Medical University, Wenzhou, Zhejiang, People’s Republic of China
*These authors contributed equally to this work
Correspondence: Wenfeng Li; Xiaojian Yan Email [email protected]; [email protected]
Background: Interferon plays a crucial role in the pathogenesis and progression of tumors. Clear cell renal cell carcinoma (ccRCC) represents a prevalent malignant urinary system tumor. An effective predictive model is required to evaluate the prognosis of patients to optimize treatment.
Materials and Methods: RNA-sequencing data and clinicopathological data from TCGA were involved in this retrospective study. The IFN-γ response genes with significantly different gene expression were screened out. Univariate Cox regression, LASSO regression and multivariate Cox regression were used to establish a new prognostic scoring model for the training group. Survival curves and ROC curves were drawn, and nomogram was constructed. At the same time, we conducted subgroup analysis and experimental verification using our own samples. Finally, we evaluated the relatedness between the prognostic signature and immune infiltration landscapes. In addition, the sensitivity of different risk groups to six drugs and immune checkpoint inhibitors was calculated.
Results: The IFN-γ response-related signature included 7 genes: C1S, IFI44, ST3GAL5, NUP93, TDRD7, DDX60, and ST8SIA4. The survival curves of the training and testing groups showed the model’s effectiveness (P = 4.372e-11 and P = 1.08e-08, respectively), the ROC curves showed that the signature was stable, and subgroup analyses showed the wide applicability of the model (P< 0.001). Multivariate Cox regression analysis showed that the risk model was an independent prognostic factor of ccRCC. A high-risk score may represent an immunosuppressive microenvironment, while the high-risk group exhibited poor sensitivity to drugs.
Conclusion: Our findings strongly indicate that the IFN-γ response-related signature can be used as an effective prognostic indicator of ccRCC.
Keywords: interferon gamma, nomogram, prognostic signature, drug sensitivity, qPCR
Introduction
There were more than 430,000 new cases of renal cell carcinoma (RCC) worldwide in 2020, with more than 170,000 deaths according to global cancer statistics.1 Clear cell renal cell carcinoma (ccRCC), the major subtype of renal carcinoma, is one of the most malignant urinary tumors.2,3 Tumorigenesis is characterized by complex pathogenesis, including gene expression, activation or mutation,4–6 microenvironmental alterations,7,8 immune surveillance and escape,9–11 invasion and metastasis,12 and angiogenesis.13,14 Emerging evidence supports a correlation between the tumor immune microenvironment and the prognosis of ccRCC.15 Cytokine therapy has been shown to promote an active immune response in translocation RCC, showing some response.16
Interferon gamma (IFN-γ) is the most important cytokine related to antitumor immunity and primarily serves the role of host defense and immune surveillance. IFN-γ inhibits cell growth, promotes apoptosis and activates immunity, playing a central role in the process of recognition and elimination of transformed cells.17,18 Specifically, IFN-γ is a primary production of the Th1-type immune response and further activates innate immune responses, including macrophages and NK cells, through a positive feedback loop. At the same time, IFN-γ promotes the differentiation of CD4 into Th1 effector cells and acts as a direct signal for cytotoxic CD8+ T cell differentiation, which induces the proliferation of cytotoxic T cell precursors.19,20 In addition, Th1-derived IFN-γ induces macrophages to directly induce cytotoxicity to cancer cells, enhancing their phagocytic ability and killing activity against microorganisms and inducing macrophages to secrete the vascular inhibitory chemokines CXCL9/MIG and CXCL10/IP-10.21,22 IFN-γ also upregulates class II MHC on the APC cell surface, promoting the recognition ability of CD4+ T cells.21,23–25
IFN-γ primarily transmits signals through the Jak-Stat pathway, which exerts gene regulation that affects more than 50 cytokines, growth factors, and hormones.26 The function of IFN-γ is regulated by hundreds of IFN-γ-related genes, which are involved in the process of inflammatory signal transmission, apoptosis, cell cycle regulation, and transcriptional activation.27 Nevertheless, there has been no comprehensive analysis or screening of IFN-γ-related genes as risk signatures for predicting the prognosis of ccRCC.
In this research, we integrally analyzed the correlation between IFN-γ response genes in ccRCC and patient prognosis using RNA-seq from The Cancer Genome Atlas (TCGA) database and constructed a risk scoring model containing seven IFN-γ response genes to predict survival in patients with ccRCC. After external validation, we validated these findings with our own clinical samples. At the same time, we drew survival and the ROC curves and applied the risk signature in various clinical subgroups to demonstrate the stability of the model. In addition, we used the risk score and clinical characteristics to construct a clinical nomogram as a more convenient clinical tool. Moreover, we analyzed patient immune cell infiltration and sensitivity to drugs and immune checkpoint inhibitors (ICIs). Overall, our findings may be valuable for predicting clinical outcomes in ccRCC and guiding treatment.
Materials and Methods
Data Collection and Processing
Whole-transcriptome profiling data and related clinical data for patients with ccRCC were downloaded from the TCGA database, and the downloaded data were standardized by the contributors. A total of 611 samples from ccRCC patients (539 tumors and 72 nontumor samples) were used to identify differentially expressed IFN-γ response genes.
Acquisition of IFN-γ Response Genes
According to previous articles, IFN-γ response genes were selected from the gene set “HALLMARK_INTERFERON_GAMMA_RESPONSE”, which includes 200 upregulated IFN-γ response genes from the molecular signature database (GSEA, https://www.gsea-msigdb.org/).28 We intersected the transcriptome profiling data of ccRCC patients with the IFN-γ response genes and extracted the expression levels of patient IFN-γ response genes.
Screening of Differentially Expressed IFN-γ Response Genes
The differentially expressed IFN-γ response genes in TCGA were calculated using the “LIMMA” package and visualized using a heat map and a volcanic map (FDR value<0.05, P value<0.05 and |logFC|>0). To verify that candidate genes were indeed associated with IFN-γ, Gene Ontology (GO) analysis and Kyoto Encyclopedia of Genes and Genomes (KEGG) analysis were adopted to explore the potential biological functions of candidate genes.
Random Grouping and the Construction of Personalized Prognostic Signatures Based on IFN-γ Response Genes
After merging the clinical survival information, we randomly divided the samples with complete clinical information whose survival time was 90 days or greater into a training group or a testing group. Next, we performed univariate Cox regression analysis on the candidate genes in the training group to determine the IFN-γ response genes related to prognosis using a filtering criterion of p<0.05. Subsequently, to avoid gene abundance fitting, we used the “glmnet” package to perform LASSO regression to screen for genes with higher correlation. Finally, the survival prediction signature was constructed through multivariate Cox regression. Finally, we obtained the IFN-γ response genes most relevant to prognosis and used it to construct a risk score formula: 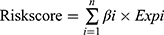 . where “n” represents the number of candidate prognostic genes, “i” indicates the ith candidate gene, “β” is the regression coefficient of each gene derived from multivariate Cox regression model, and “Expi” is the expression level of the ith candidate gene. Samples from both the training and testing groups received a risk score computed by the risk score expression. The optimal cutoff value was defined as the median value of the risk scores in the training group, which divided patients in the training and test groups into two subgroups: high-risk and low-risk. Patients with risk scores higher than the cutoff value were classified into the high-risk group, and vice versa for the low-risk group.
Validation of the Survival-Predicting Signature
According to the scoring level derived from the risk scores, Kaplan–Meier (K-M) survival analysis was carried out using the “tidyverse” package and the “survminer” package, and survival curves for the training and testing groups were created to verify the survival prediction validity of the model. The ROC curves at 1, 2 and 3 years were plotted to evaluate the accuracy of the prediction model. In addition, after integrating the clinical data of the patient’s age, sex, grade, and stage of the training group with the patient’s risk score and rechecking and deleting samples that lack accurate clinical data, we performed univariate Cox analysis and multivariate Cox analysis to assess the independent predictive power of the risk score and other clinicopathological data for overall survival (OS).
Construction of the Nomogram
To afford clinicians with a more convenient and visualize model for estimating the OS of ccRCC patients, we used the “rms” package and “survival” package to establish a nomogram based on the factors that were determined to have independent predictive ability by the training group after multivariate Cox analysis, and calibration curves were plotted for 1, 3, and 5 years to judge the precision of the nomogram.
Subgroup Analysis
To measure the independence and clinical applicability of this signature in depth, we regrouped patients according to different clinicopathological features, all samples in the training group were stratified into two groups according to age, sex, grade and stage. We then compared survival curves based on risk scores between different groups to verify the validity of our predictive signature in different subgroups.
Analysis of the Immune Microenvironment
Immune cell infiltration levels were determined by single sample gene set enrichment analysis (ssGSEA); specifically, the “GSVA” package in R software was adopted to quantify the infiltration levels of 23 types of immune cells. Then, a t-test was used to compare differences in the level of immune cell infiltration between the high- and low-risk groups.
Drug Sensitivity Analysis
We used the R package pRRophetic, which is based on statistical models building from a very large panel of cancer cell lines’ gene expression and drug sensitivity data, and to predict the drugs sensitivity of high- and low-risk groups by comparing half maximal inhibitory concentrations (IC50) of six drugs (sorafenib, sunitinib, axitinib, pazopanib, cisplatin, docetaxel) based on the IC50 and drew box plots.29,30
Prediction of Patient Response to ICI
The Cancer Immunome Atlas (https://tcia.at/) analyzed the immune landscapes and antigenomes of 20 solid tumors. Tumor immunogenicity was quantitatively scored from 0 to 10 to establish immunophenotypic score (IPS).31 IPS values were positively correlated with tumor immunogenicity, which could be used to predict patients’ response to ICIs treatment.31 47 common ICIs related genes were selected (Supplementary Table S1), and P<0.05 was selected as the filter condition to screen out the differentially expressed mRNA levels of immune checkpoint and its ligand in the high- and low-risk groups, and a boxplot was drawn.
The Expression of Genes Was Verified by qPCR
Total RNA was extracted from ccRCC samples and normal renal tissue samples using TRIzol reagent (Thermo Fisher Scientific, Waltham, MA, USA). Single-stranded cDNA was synthesized from 1 µg of total RNA using the PrimeScript RT Reagent Kit with gDNA Eraser (Takara Biotechnology Co. Ltd., Dalian, China). Reverse transcription quantitative PCR was applied to explore the mRNA expression of the hub genes using a 7500 PCR system (Thermo Fisher Scientific). β-ACTIN was used as the reference gene, and the following primer sequence of β-ACTIN was used: β-actin forward primer 5ʹ-CATGTACGTTGCTATCCAGGC-3ʹ; β-actin reverse primer 5ʹ-CTCCTTAATGTCACGCACGAT-3ʹ. The following cycling conditions were adopted: 95°C for five minutes, followed by 40 cycles of 95°C for 10 seconds and 60°C for 30 seconds. The qPCR assays were performed for each sample in a reaction volume of 10 uL. The relative expression of genes in our signature was calculated using the 2-Ct method.
Statistical Analysis
All analyses were performed using R version 4.0.5. All data tests were compared using two-tailed t-tests; P < 0.05 was deemed to be significant unless indicated otherwise.
Results
Patients and Samples
Figure 1 shows the flow chart of the present study design. The total number of 611 samples from patients with ccRCC (539 tumors and 72 nontumor samples) were used in this study. For patients with multiple mRNA expression data, we averaged them. After removing patients who did not meet the enrollment conditions, we randomly divided all samples into the training group (n=246) and the testing group (n=245) at a ratio of 1:1. The characteristics of the samples in the training and testing group samples are shown in Table 1. Comparisons between the groups were made using independent t-test, and the results showed a non-significant difference between the two groups, suggesting their appropriateness as the training set and the external testing data set.
 |
Table 1 Clinicopathological Characteristics of the Patients Included in the Training Group and Validating Groups |
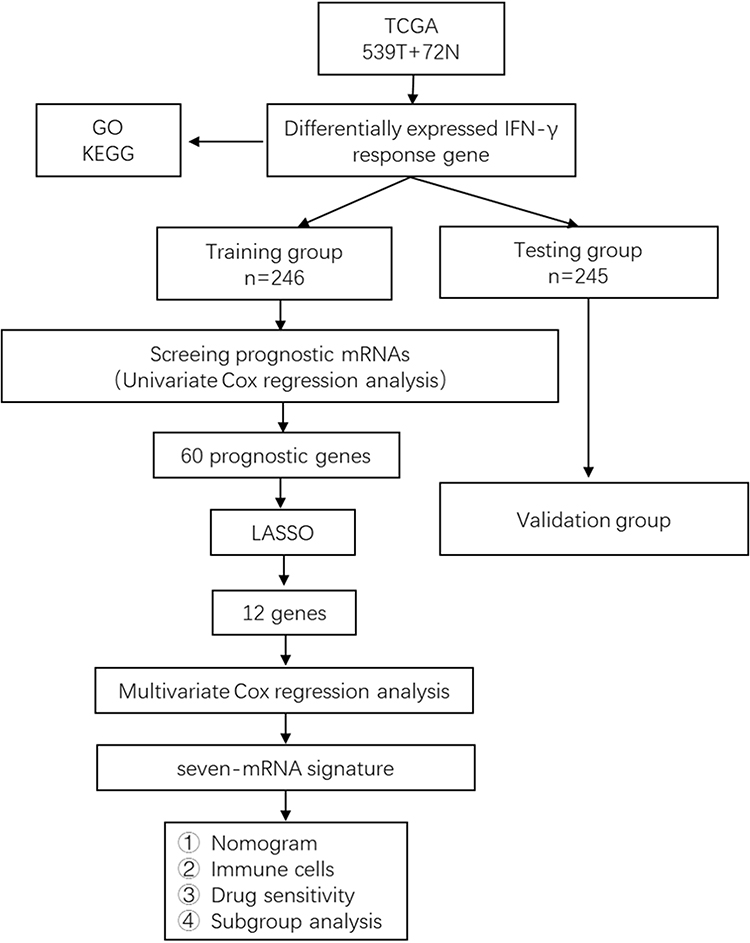 |
Figure 1 The flow chart for constructing and verifying the 8-mRNA signature. Differentially expressed IFN-γresponse genes were screened from ccRCC samples and normal renal tissue samples from TCGA database. The samples included in the following study were randomly divided into training group and testing group at a ratio of 1:1. Univariate Cox regression, LASSO and multivariate Cox regression were used for the training group to construct the 8-mRNA signature for the training group. And the testing group was used to test the stability of the model. |
Differentially Expressed IFN-γ Response Genes
We intersected mRNA expression levels of the overall ccRCC patient samples with 200 IFN-γ response genes, and expression levels of 198 IFN-γ response genes in the ccRCC patient samples were identified. We next examined whether IFN-γ response genes were different between tumor and nontumor samples. As shown in Figure 2, we obtained 178 differentially expressed IFN-γ response genes, and a heat map (Figure 2A) and a volcano map (Figure 2B) were created. To demonstrate that the genes we obtained were indeed related to IFN-γ, we performed GO analysis (Figure 2C) and KEGG analysis (Figure 2D). GO analysis results showed that response to virus, response to interferon−gamma and defense response to virus were the most functional regions. KEGG analysis showed that Epstein-Barr virus infection and the enrichment of influenza A and herpes simplex virus 1 infection were the highest, indicating that these genes were indeed related to IFN-γ and the antiviral response.
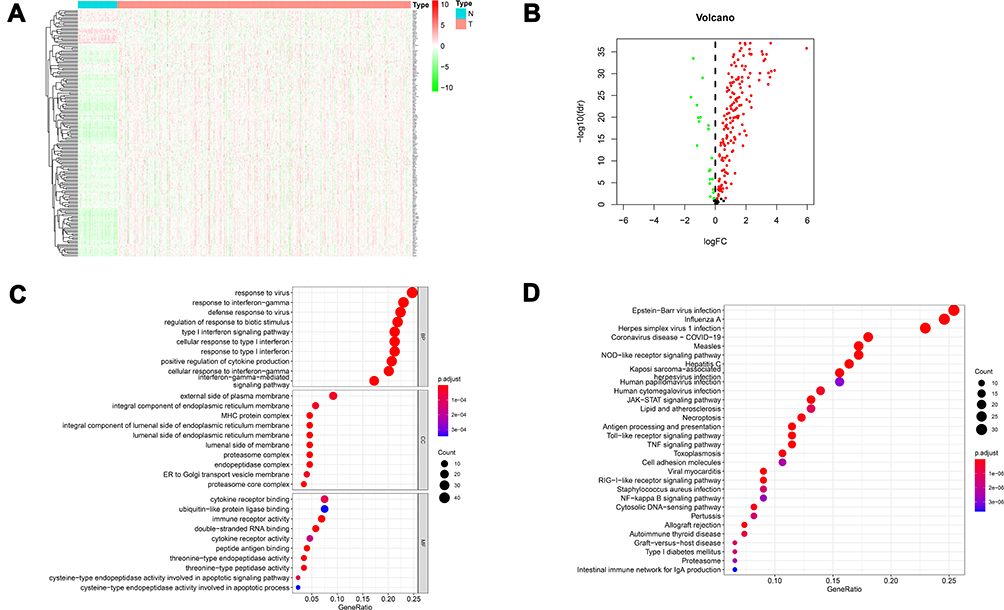 |
Figure 2 Heatmaps, volcano maps and functional enrichment analysis of differentially expressed IFN-γ response genes between normal tissue and ccRCC. (A) Heatmap demonstrating the 178 differentially expressed IFN-γ response genes. (B) volcano map demonstrating the 178 differentially expressed IFN-γ response genes. The green dots on the left represent the down-regulated genes, and the red dots on the right represent the up-regulated genes. (C) Gene Ontology (GO) analysis; BP, CC and MF represent biological process, cellular component and molecular function, respectively. (D) The most significant Kyoto Encyclopedia of Genes and Genomes (KEGG) pathway analyses. |
Construction of the IFN-γ Response mRNA Survival-Predicting Signature
After poaching clinical survival data and excluding samples that did not meet the inclusion requirements, we randomly assigned patients 1:1 into a training group (n=246) and a testing group (n=245). Univariate Cox analysis was performed on the training group, and 60 differentially expressed IFN-γ response genes with prognostic significance were identified (filtering criterion of p<0.05, Table S2). Then, LASSO regression was utilized to avoid overfitting, and 12 suitable genes were selected as variables for the next step (Figure 3A and B). Multivariate Cox regression was then implemented. Finally, after multivariate Cox analysis, we established an mRNA survival-predicting signature containing 7 IFN-γ response genes. Their details are demonstrated as Table 2. Next, each sample’s risk score was computed according to the expression levels of these 7 IFN-γ response mRNAs: Risk score = NUP93 * 0.249933 + DDX60 * (−0.09398) + ST8SIA4 * (−0.05168) + IFI44 * 0.049088 + ST3GAL5 * 0.1214 + TDRD7 * (−0.15864) + C1S*0.003466.
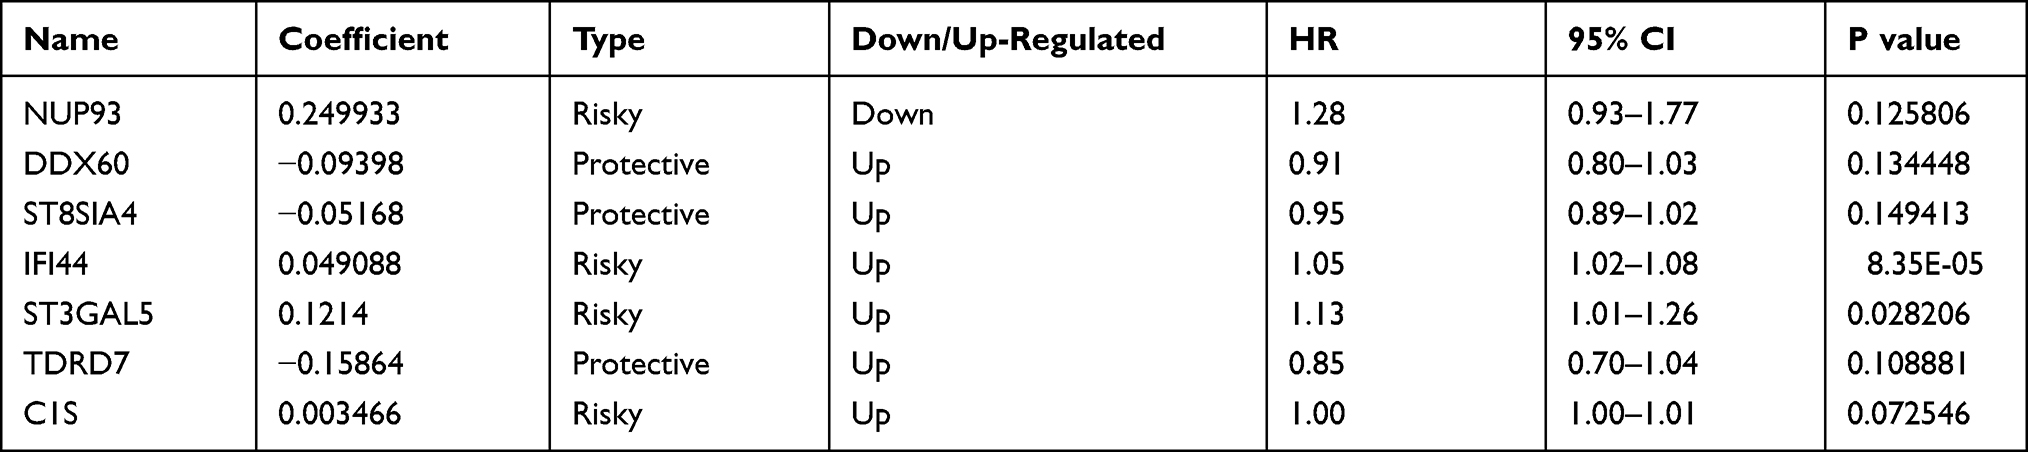 |
Table 2 7-Gene Signature Selected by Multivariate Cox Regression |
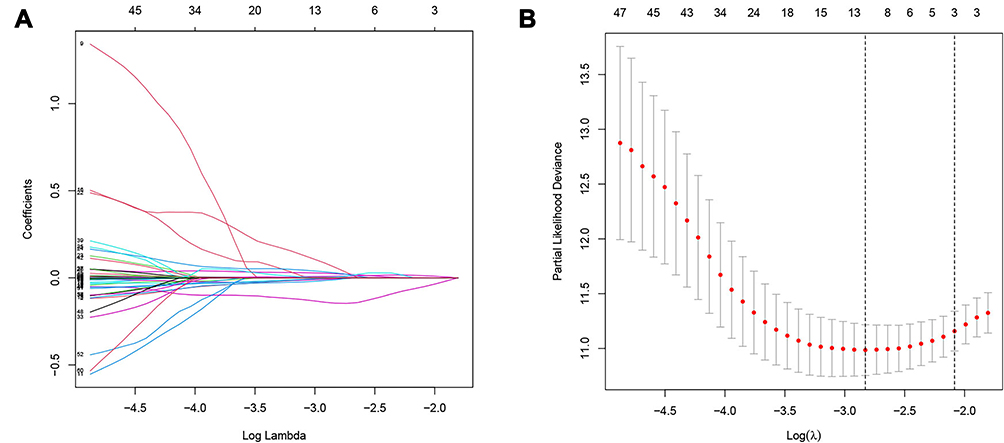 |
Figure 3 LASSO regression. (A) The variation trajectory of each independent variable. The logarithm of the independent variable lambda was taken as the horizontal axis, and the coefficient of the independent variable was taken as the vertical axis. (B) Confidence intervals for each phase for each lambda, the vertical black dotted lines defined the optimal values of lambda, which provides the best fit. |
Validation of the Survival-Predicting Signature
After developing the IFN-γ response mRNA signature, we computed the risk scores of all samples in the training and testing groups, which divided patients in the training and trial groups into high-risk and low-risk groups. Then, we evaluated the distribution of risk scores, survival time, and survival status in the two groups. As showcased in Figure 4A and D, with the gradual increase of the risk scores, the survival time of patients gradually decreased, while the mortality rate gradually increased. Next, we drew Kaplan–Meier curves and ROC curves to judge the reliability of the survival-predicting signature. Survival analysis showed that the IFN-γ response mRNA survival-predicting signature significantly differentiated between high- and low-risk patients, and the survival probability of the high-risk group was significantly worse than that of the low-risk group (Figure 4B and E, P<0.05). In the training group, the mean survival time of patients in the high-risk group was 3.245 ± 2.078 (years), and the mean survival time of patients in the low-risk group was 3.819 ± 2.343 (years). Similarly, In the testing group, the mean survival time of patients in the high-risk group was 2.419± 1.632 (years), and the mean survival time of patients in the low-risk group was 3.370± 2.101 (years). The areas under the ROC curve (AUCs) in the training group at 1, 3 and 5 years were 0.842, 0.829 and 0.78 (Figure 4C), and the AUCs in the testing group at 1, 3 and 5 years were 0.698, 0.704 and 0.745 (Figure 4F), respectively, demonstrating that the signature has very satisfactory specificity and sensitivity for predicting patient survival. In addition, we examined the applicability of this signature in different clinical characteristic groups (age (≥65, <65), sex (male, female), grade (G1-2, G3-4) and stage (Stage I–II, Stage III–IV)). The results showed that our prediction model was applicable to different subgroups (Figure 5A–H, P<0.05).
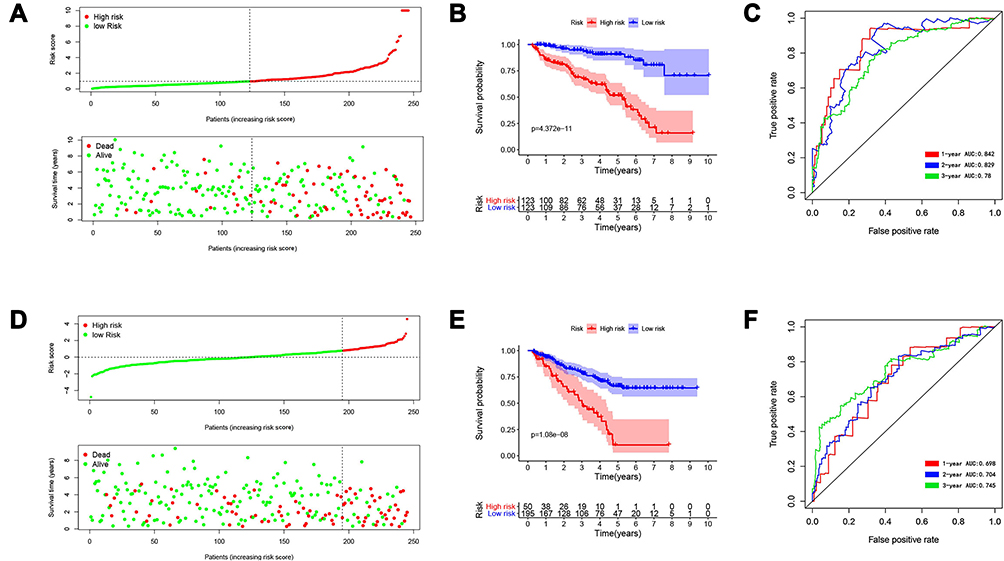 |
Figure 4 Identification and verification of survival-predicting signature. (A) The distribution of risk score, survival time and survival status of ccRCC patients in the training group. (B) Kaplan–Meier curves in the high- and low-risk groups of ccRCC patients in the training group. (C) The ROC curve over time in the training group. (D) The distribution of risk score, survival time and survival status of ccRCC patients in the testing group; (E) Kaplan–Meier curves in the high- and low-risk groups of ccRCC patients in the testing group; (F) The ROC curve over time in the testing group. P < 0.05 was considered as statistically significant. |
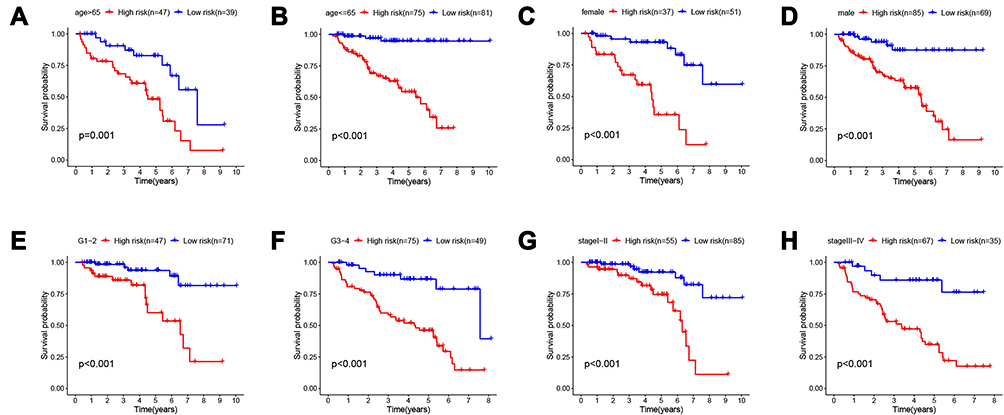 |
Figure 5 Subgroup analysis. The applicability of survival-predicting signature in different clinical characteristic groups (A) age ≥ 65; (B) age <65; (C) female; (D) male; (E) G1-2; (F) G3-4; (G) stage I–II and (H) stage III–IV). P < 0.05 was considered as statistically significant. |
IFN-γ Response mRNA Signature is an Independent Prognostic Factor in Patients with ccRCC
To assess whether the IFN-γ response mRNA signature can be used as an independent predictor of OS in patients with ccRCC, Cox regression analysis was performed on patients in the training group to further evaluate its independent prognostic effect. As shown in Table 3, univariate Cox regression analysis indicated that IFN-γ response mRNA signature (HR=1.126, 95% CI 1.089–1.164, P<0.001), age (HR=1.032, 95% CI 1.011–1.054, P=0.003) grade (HR=2.223, 95% CI 1.623–3.044, P<0.001) and stage (HR=1.762, 95% CI 1.440–2.156, P<0.001) were significantly associated with survival in patients with ccRCC. After adjusting for other clinical parameters, the risk score (HR=1.123, 95% CI 1.083–1.164, P<0.001), stage (HR=1.639, 95% CI 1.298–2.070, P<0.001) and age (HR=1.046, 95% CI 1.020–1.073, P=0.001) remained independent prognostic factors in multivariate Cox regression analysis, suggesting that the risk score is significantly associated with OS in patients with ccRCC and is an independent prognostic factor.
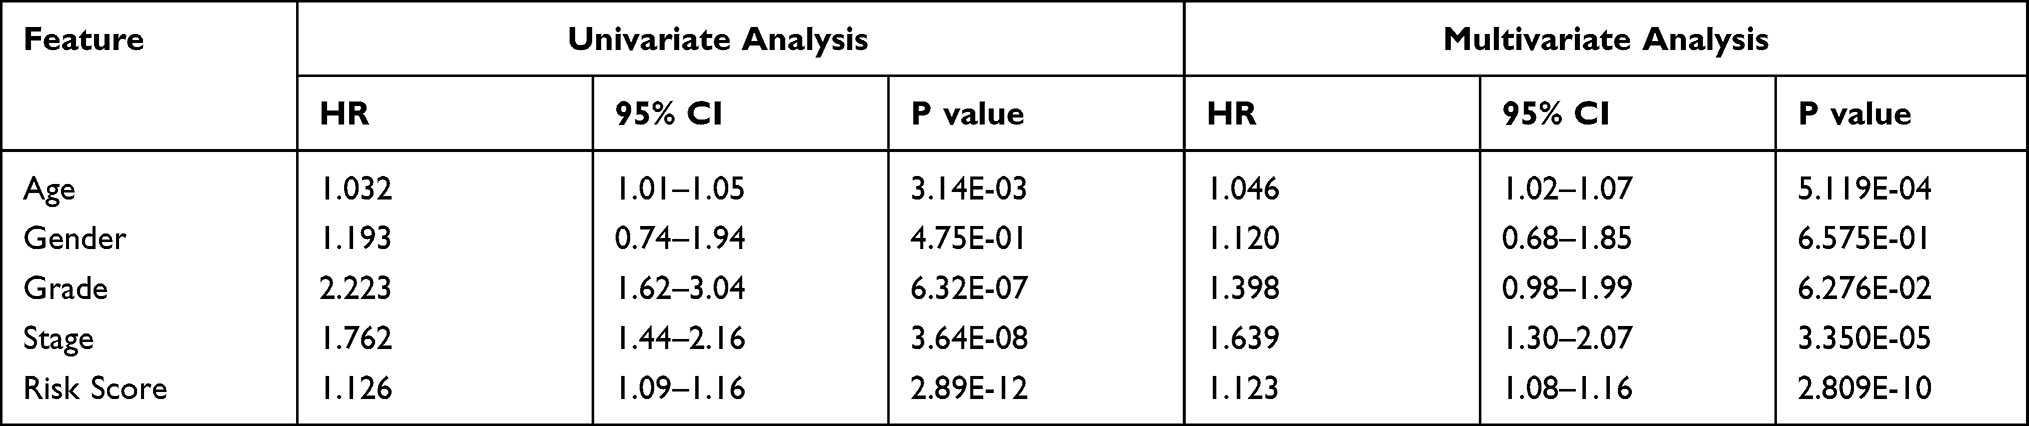 |
Table 3 Univariance and Multivariance Cox Regression Analysis of the Gene Signature |
Establishment of a Nomogram Based on Risk Score and Clinical Factors
To develop a more convenient and qualitative predictive tool for clinicians, we assembled a nomogram to predict the 1-, 3-, and 5-year OS of the training group samples in light of factors from the Cox regression analysis, such as the risk score, age, and stage (Figure 6A). In addition, the 1-, 3- and 5-year calibration curves were plotted, respectively (Figure 6B–D), which showed a good correlation between the predicted and actual survival rates of patients with ccRCC.
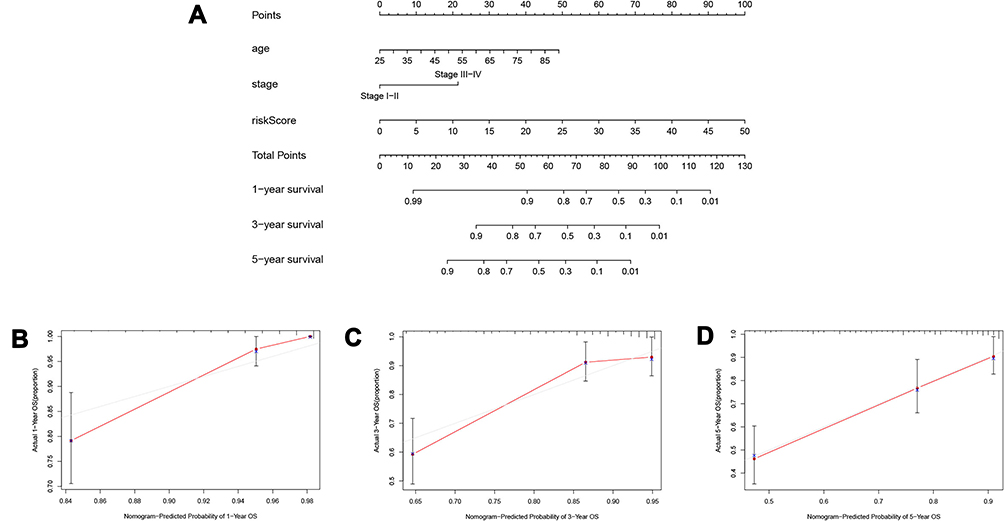 |
Figure 6 Establishment of the prognostic nomogram. (A) nomogram for predicting 1-year, 3-year and 5-year overall survival of ccRCC patients; (B) 1-year nomogram calibration curves of the prognostic nomogram; (C) 3-year nomogram calibration curves of the prognostic nomogram; (D) 5-year nomogram calibration curves of the prognostic nomogram. |
Assessment of Immune Infiltration Landscapes in ccRCC
The ssGSEA algorithm was used to evaluate the degree of tumor immune infiltration, and the results revealed markedly different immune infiltration landscapes between the two subgroups of patients (Figure 7). High-risk patients exhibited significantly higher percentages of activated B cells, activated CD4 T cells, activated CD8 T cells, activated dendritic cells, CD56dim natural killer cells, MDSCs, macrophages, natural killer T cells, regulatory T cells and type 1 T helper cells. In contrast, a higher proportion of immature dendritic cells and neutrophils were present in the low-risk group of patients.
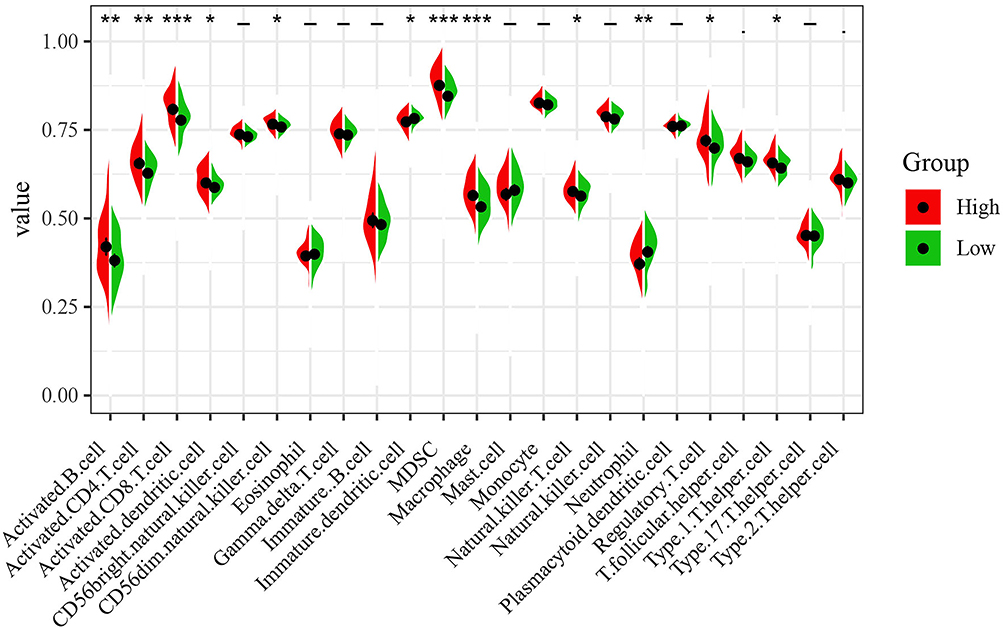 |
Figure 7 Immune infiltration landscapes in ccRCC. The left side red represents the expression in the high-risk group, the right side green represents the expression in the low-risk group. *P < 0.05; **P < 0.01; ***P < 0.001; -, not statistically significant. |
Drug Sensitivity Analysis
Sorafenib and sunitinib were approved for treating metastatic renal cell carcinoma in 2005 and 2006, respectively.32,33 Currently recommended first-line targeted therapy options in the NCCN Guidelines are single-agent TKIs or VEGF inhibitors, including pazopanib,34 sunitinib,35 and axitinib,36 etc. Therefore, we evaluated the sensitivity of ccRCC to six drugs including sorafenib and sunitinib (Figure 8A–F). We determined the half maximum inhibitory concentration (IC50) for each pattern in the TCGA dataset in accordance with the prediction signature. The results showed that for these six drugs (sorafenib, sunitinib, axitinib, pazopanib, cisplatin, docetaxel), low-risk patients were more sensitive than high-risk patients. Therefore, these findings may partly explain why low-risk ccRCC patients have a preferable prognosis. At the same time, this suggested that patients in the low-risk group may be more suitable for treatment with targeted agents.
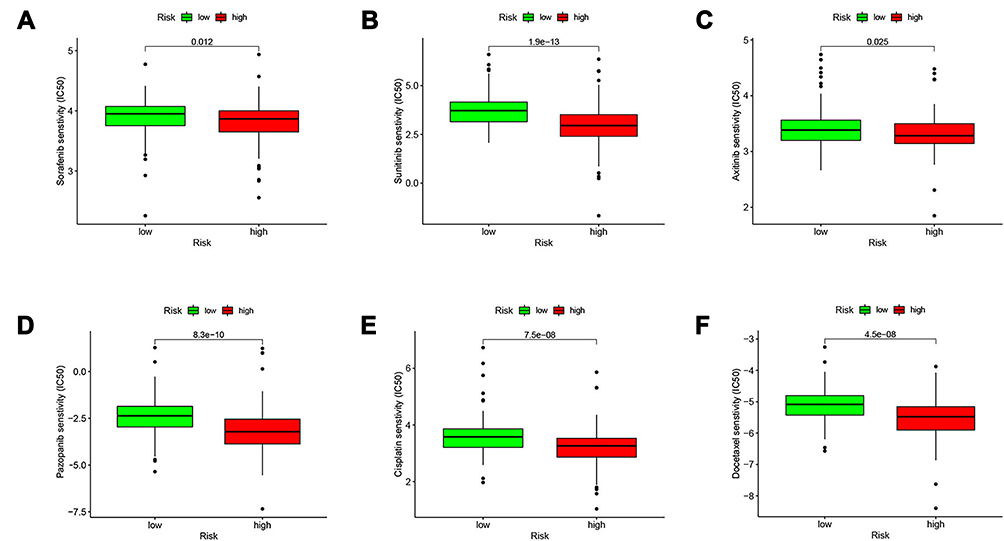 |
Figure 8 Comparing the efficiency of the selected drugs in high-risk group and low-risk group. Differences in the IC50 of six drugs in the high- and low-risk groups. (A) sorafenib; (B) sunitinib; (C) axitinib; (D) pazopanib; (E) cisplatin; (F) docetaxel. P < 0.05 was considered as statistically significant. |
Prediction of Patients’ Responsiveness to ICIs
Recently, the application of ICIs has further improved the prognosis of patients, which has greatly changed the treatment paradigm of metastatic RCC. The treatment model of ICIs combined with anti-VEGF targeted drugs is increasingly used as the first-line treatment of metastatic ccRCC. Combination therapy has become a kind of promising treatment for advanced ccRCC.37–39 Therefore, we wanted to predict the response to ICIs treatment by analyzing the differential expression of immune checkpoint genes in the high- and low-risk groups. As shown in Figure 9, we obtained 26 differentially expressed genes of immune checkpoint and its ligand in the high- and low-risk groups. Among these genes, A few genes (TNFSF15, CD274, CD200, TNFSF18, HAVCR2, HHLA2, NRP1) were more highly expressed in low-risk populations, while the majority of genes (LGALS9, TNFSF14, TNFRSF25, CD44, BTLA, TNFSF9, TNFRSF18, CD28, CD40LG, CD27, CTLA4, CD70, TIGIT, CD276, LAIR1, TMIGD2, LAG3, TNFRSF8, PDCD1) were higher expressed in high-risk groups. These results indicated that patients in the high-risk group are more likely to benefit from immunotherapy. On the basis of anti-VEGF targeted drugs, earlier treatment combined with ICIs may improve the prognosis of patients in the high-risk group.
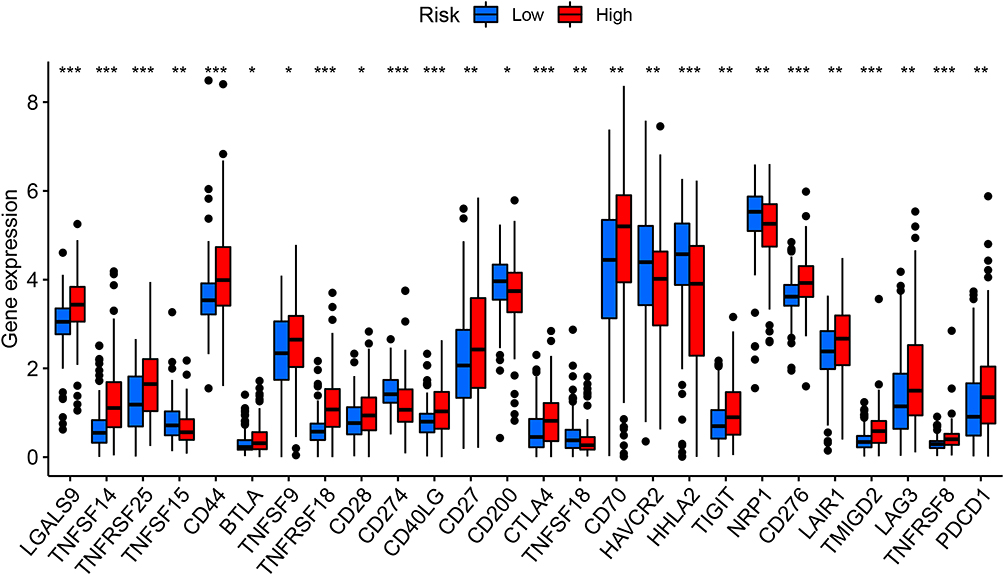 |
Figure 9 The powerful role of survival-predicting signature in immunotherapy. Differential expression of immune checkpoint genes in the high- and low-risk groups of the TCGA training group (Wilcox test, *P < 0.05; **P < 0.01; ***P < 0.001), The blue box on the left represents the low-risk group, and the red box on the right represents the high-risk group. |
Validation of Candidate Genes by qPCR
We further examined the differential expression of NUP93, DDX60, ST8SIA4, IFI44, ST3GAL5, TDRD7, and C1S genes between ccRCC and normal renal tissue samples. The primers used are shown in Table 4. The RT-qPCR results showed that compared to normal renal tissue samples, trends in the expression levels of these genes were consistent with our previous findings, except for NUP93 (DDX60, p=0.0037; ST8SIA, p=0.0107; IFI44, p=0.0058; ST3GAL5, p=0.0005; TDRD7, p<0.0001; C1S, p=0.0009; NUP93, p=0.4836), which might be attributed to the tumor heterogeneity or the little scale of sample size analyzed (Figure 10).
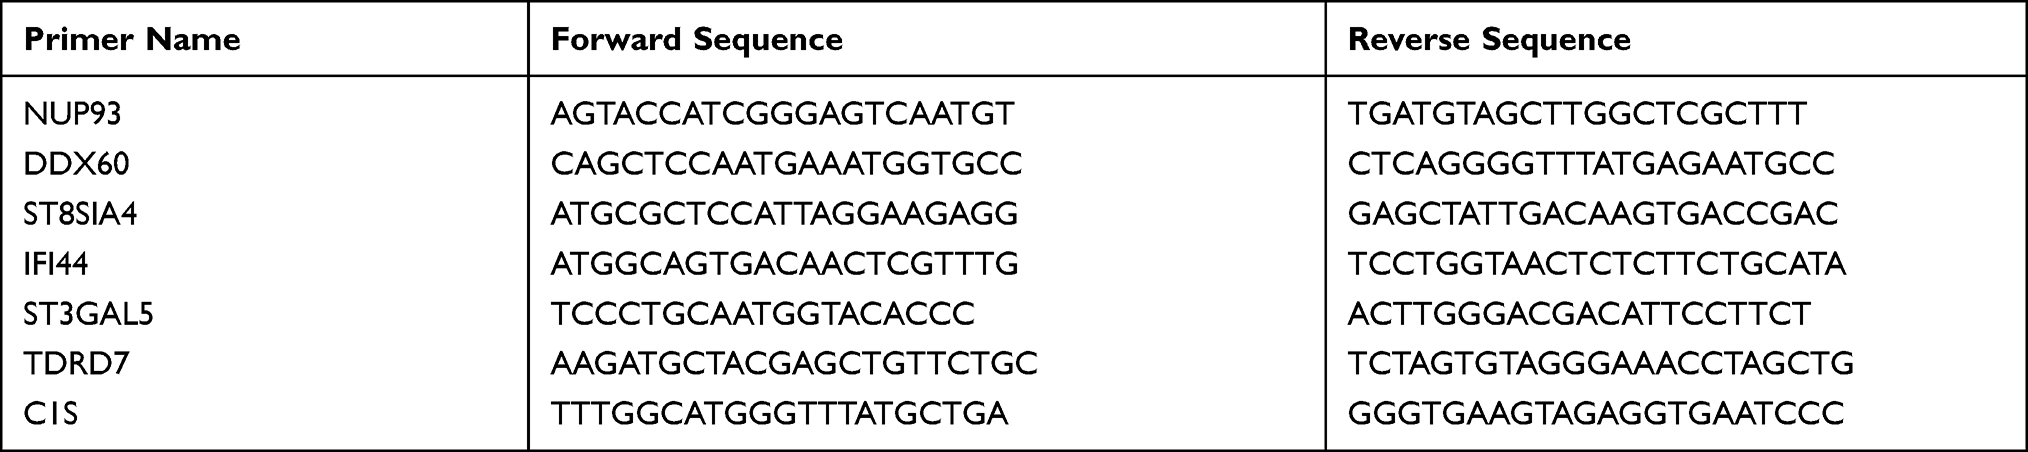 |
Table 4 The Primer of Seven Genes |
 |
Figure 10 Validation of candidate genes by qPCR. (A) DDX60, normal: 1.000±0.2391, tumor:1.490±0.2112; (B) ST8SIA4, normal:1.000± 0.1394, tumor: 5.148± 3.243; (C) TDRD7, normal: 1.000± 0.2638, tumor: 2.951± 0.6358; (D) C1S, normal: 1.000± 0.1457, tumor: 4.801 ± 1.994; (E) IFI44, normal: 1.000± 0.3412, tumor: 2.529± 1.017; (F) ST3GAL5, normal: 1.000± 0.2768, tumor: 3.148± 0.9999; (G) NUP93, normal: 1.000± 0.2391, tumor: 1.490± 0.2112. The left side represents the expression in the normal tissue, the right side represents the expression in the cancer tissue. *P < 0.05; **P < 0.01; ***P < 0.001; ns, not statistically significant. |
Discussion
ccRCC is the major subtype of RCC, with poor outcomes and lacks validated markers. In our research, we determined expression levels of IFN-γ response genes and matched clinical data from TCGA and GSEA databases. By executing a suite of bioinformatics analyses, an IFN-γ response mRNA survival-predicting signature was established and validated using our own ccRCC samples.
Through further analysis, our signature effectively stratified the OS of patients with different risks in the training and test sets of the TCGA database, indicating the stability and reliability of the signature. Results of the ROC curve and subgroup analysis further demonstrated the robustness of our signature, indicating the generality of this prognostic feature. Through further analysis, our signature was demonstrated to be effective in stratifying the OS of patients with different risks in the training and testing groups of the TCGA database, indicating the stability and reliability of the signature. The results of the ROC curve and subgroup analysis further demonstrated the robustness of our model and suggested the generalizability of this prognostic feature. Both univariate and multivariate Cox analyses demonstrated that the risk score derived from this signature is an independent prognostic marker for survival in patients with ccRCC. Furthermore, we established a nomogram grounded on the risk score and independent clinical markers, and calibrated charts showed good agreement between predicted and actual survival rates at 1, 3, and 5 years in the TCGA test group. In addition, we analyzed immune infiltration landscapes in different risk patient subgroups and evaluated the sensitivity of patients to six different drugs. Taken together, these results provide potential directions for the treatment of ccRCC in the clinic.
Among the 7 genes, C1S, IFI44, ST3GAL5 and NUP93 were risk factors, while TDRD7, DDX60 and ST8SIA4 were protective factors. In ccRCC, C1S is an independent prognostic marker, and overexpression of C1S may be a novel escape mechanism that promotes tumor progression.40 In the IFI44 family, the interferon-induced protein 44-like (IFI44L), a momentous paralog of IFI44, is a type I interferon-stimulated gene (ISG). It has been reported that the depletion of IFI44L enhances the migration, invasion and lung metastasis of hepatocellular carcinoma by activating the Met/Src signaling pathway,41 while in ccRCC, patients with high IFI44 expression exhibit reduced survival,42 consistent with our findings. In addition, higher levels of M1 macrophages and M2 macrophages43 were observed in tumor sections with high IFI44 expression. At the same time, the group with high IFI44 expression exhibited increased neutrophilic infiltrates, which were associated with poorer cancer therapeutic efficacy.44 Another gene, ST3GAL5, has been reported to be positively associated with a higher risk of childhood acute leukemia45,46 and relevant to multidrug resistance in human acute myeloid leukemia, revealing a role of ST3GAL5 in carcinogenesis and its development. Studies have shown that NUP93 is correlated with the proliferation, migration and invasion of cervical cancer cells47 and is negatively correlated with the survival rate of patients with triple-negative breast cancer.48 In our study, although NUP93 was a risk factor, it was generally downregulated, which may be due to the type of tumor and deserves further study. As a protective factor, DDX60 is an IFN-inducible cytoplasmic helicase.49 Studies have shown that breast cancer patients with low expression of DDX60 exhibit higher radiosensitivity.50 How it functions in CCRCC requires further research. ST8SIA4 is overexpressed in RCC tissues and RCC cell lines, and ectopic expression of ST8SIA4 regulates the proliferation, migration and invasion of RCC cells.51 In follicular thyroid cancer, ST8SIA4 has been shown to inhibit tumor proliferation, migration and invasion both in vivo and in vitro.52 Therefore, we can conclude that the overall high expression of ST8SIA4 in ccRCC is beyond doubt, while the relatively high expression of ST8SIA4 is good news for the prognosis of patients with ccRCC, consistent with our view. TDRD7 has been poorly studied in tumors and may play a role in tumor cell migration,53 but in another bioinformatics analysis of colorectal cancer, TDRD7 was reported to be a protective factor.54
Immune cell infiltration in the tumor microenvironment is a pivotal regulator of tumor progression. Our analysis found significant differences in immune cell infiltration between the high- and low-risk patients with ccRCC. High concentrations of immune cells were observed in high-risk group, including activated B cell, activated CD4 T cell, activated CD8 T cell, activated dendritic cell, CD56dim natural killer cell, MDSC, macrophage, natural killer T cell, regulatory T cell and type 1 T helper cell. The lower-risk group exhibited higher immature dendritic cell and neutrophil contents. Previous studies have shown that macrophages can activate the PI3Kγ signaling pathway, restrain the activation of T cells and promote the immunosuppressive effect of tumors.55 On the one hand, MDSCs can upregulate expression of the immunosuppressive factor ARG1 in the tumor microenvironment, which suppresses the activation of CD4+ and CD8+ effector T cells; on the other hand, MDSCs can inhibit the activation of T cells by downregulating the TCR-related ζ chain.56,57 In addition, MDSCs secrete a variety of chemokines, such as CCL3, CCL4, CCL5, as well as the inflammatory factor IL-17, to recruit Tregs and to promote tumor immune escape.58 At the same time, type II natural killer T cells can produce IL-13 and promote the polarization of MDSCs and M2 macrophages, downregulating tumor immune surveillance.59 For regulatory T cells, increasing evidence points out that Tregs play a key role in suppressing the immune response of NK cells.60 Tregs also inhibit the function of B cells, CD8+T cells and other immune cells, besides, Tregs are involved in the process of sustaining immunological tolerance.61–63 These analyses suggest that patients with high-risk scores may exhibit an immunosuppressive microenvironment.
Since the FDA approved the VEGF receptor targeting agent sorafenib in 2005, three other VEGF pathway inhibitors have been ratified for treating the metastatic RCC in the United States: sunitinib, pazopanib, and axitinib. The NCCN Guidelines (Version 2.2010) recommend that for stage IV metastatic disease, sunitinib, pazopanib, and sorafenib are first-line therapies and have shown undoubted efficacy.64–68 Second-line axitinib also exhibits a favorable survival benefit after first-line sunitinib treatment in metastatic RCC.69 In our study, we also evaluated the sensitivity of patients with ccRCC to cisplatin and docetaxel and confirmed that the low-risk group displayed higher sensitivity to all six drugs. In this sense, the low-risk population may receive more benefits from these drugs. Interestingly, although we found that the high-risk group showed a worse prognosis, it responded better to treatment with ICIs. Interestingly, although we found that the high-risk group showed a worse prognosis, it had a better response to ICIs treatment. This feature showed good predictive ability. These findings suggested that this feature may play a role in the ICIs treatment of ccRCC. In addition, most of the genes of immune checkpoint and its ligand (especially PD1, CTKA4 and TIGIT) were expressed at higher levels in the high-risk group, indicating the high-risk group exhibit stronger immunogenicity. Therefore, the high-risk group may respond better to ICIs therapy. According to NCCN Guidelines Insights: Kidney Cancer, Version 2.2020, the introduction of immunotherapy and immunotherapy/TKI combination may be the future hope of ccRCC patients.70 From this, we can draw the inference that according to the risk level derived from our signature, the low-risk group has a better prognosis and can give priority to targeted therapy. The high-risk group may be better suited for early combination of ICIs with targeted agents. Medical staff can more accurately select the appropriate therapy for the patient according to the patient’s tumor microenvironment.
In short, we wanted to more systematically comprehend the connection between IFN-γ response genes and ccRCC. Therefore, we constructed a gene signature and clinical nomogram that was significant for predicting the prognosis of ccRCC patients and performed a series of validations and analyses. However, our research has some limitations. First, both the training and testing groups were acquired from TCGA, and it is preferable to have an independent queue as an external verification group. Second, we conducted a retrospective analysis, which inevitably led to some inclusion bias. Finally, due to the lack of ccRCC’s cohort study database for ICIs, there is no way to further validate the signature.
Despite these limitations, this is the first survival prediction signature in ccRCC based on IFN-γ response genes. This signature represents an independent prognostic factor and may help to understand the underlying molecular mechanism of ccRCC. Our nomogram offers clinicians with a more convenient method for predicting survival and facilitates more individualized therapeutic scheme to match the patient’s individual needs, which will enable to save public health resources.
Data Sharing Statement
The datasets for this study can be found in The Cancer Genome Atlas (TCGA) database [https://portal.gdc.cancer.gov/].
Ethical Approval Statement
Ethical approval for this study was obtained from the Ethics Committee of the Wenzhou Medical University. Clinical research ethics review (2016) No. (182). And written informed consent was obtained from all patients. This study was conducted in accordance with the Declaration of Helsinki.
Acknowledgments
The authors thank the contributors of the TCGA database.
Funding
This work was supported by the National Natural Science Foundation of China (No. 80218103) and the Natural Science Foundation of Zhejiang Province No. Y21H160267(XY).
Disclosure
The authors declare that the research was conducted in the absence of any commercial or financial relationships that could be construed as a potential conflict of interest.
References
1. Sung H, Ferlay J, Siegel RL, et al. Global cancer statistics 2020: GLOBOCAN estimates of incidence and mortality worldwide for 36 cancers in 185 countries. CA Cancer J Clin. 2021;71(3):209–249.
2. Baldewijns MM, van Vlodrop IJ, Schouten LJ, Soetekouw PM, de Bruine AP, van Engeland M. Genetics and epigenetics of renal cell cancer. Biochim Biophys Acta. 2008;1785:133–155.
3. Moch H, Cubilla AL, Humphrey PA, Reuter VE, Ulbright TM, The 2016 WHO classification of tumours of the urinary system and male genital organs-part A: renal, penile, and testicular tumours. Eur Urol. 2016;70(1):93–105. doi:10.1016/j.eururo.2016.02.029
4. Sondka Z, Bamford S, Cole CG, Ward SA, Dunham I, Forbes SA, The COSMIC cancer gene census: describing genetic dysfunction across all human cancers. Nat Rev Cancer. 2018;18(11):696–705. doi:10.1038/s41568-018-0060-1
5. Abril E, Mendez RE, Garcia A, et al. Characterization of a gastric tumor cell line defective in MHC class I inducibility by both alpha- and gamma-interferon. Tissue Antigens. 1996;47(5):391–398.
6. Hanahan D, Weinberg RA, Hallmarks of cancer: the next generation. Cell. 2011;144(5):646–674. doi:10.1016/j.cell.2011.02.013
7. Allavena P, Sica A, Solinas G, Porta C, Mantovani A, The inflammatory micro-environment in tumor progression: the role of tumor-associated macrophages. Crit Rev Oncol Hematol. 2008;66(1):1–9. doi:10.1016/j.critrevonc.2007.07.004
8. Chan G, Kalaitzidis D, Neel BG, The tyrosine phosphatase Shp2 (PTPN11) in cancer. Cancer Metastasis Rev. 2008;27(2):179–192. doi:10.1007/s10555-008-9126-y
9. Dunn GP, Bruce AT, Ikeda H, Old LJ, Schreiber RD, Cancer immunoediting: from immunosurveillance to tumor escape. Nat Immunol. 2002;3(11):991–998. doi:10.1038/ni1102-991
10. Beatty GL, Gladney WL, Immune escape mechanisms as a guide for cancer immunotherapy. Clin Cancer Res. 2015;21(4):687–692. doi:10.1158/1078-0432.CCR-14-1860
11. Drake CG, Jaffee E, Pardoll DM. Mechanisms of immune evasion by tumors. Adv Immunol. 2006;90:51–81.
12. Lambert AW, Pattabiraman DR, Weinberg RA, Emerging biological principles of metastasis. Cell. 2017;168(4):670–691. doi:10.1016/j.cell.2016.11.037
13. Folkman J, Merler E, Abernathy C, Williams G, Isolation of a tumor factor responsible for angiogenesis. J Exp Med. 1971;133(2):275–288. doi:10.1084/jem.133.2.275
14. Hanahan D, Folkman J, Patterns and emerging mechanisms of the angiogenic switch during tumorigenesis. Cell. 1996;86(3):353–364. doi:10.1016/S0092-8674(00)80108-7
15. Xu WH, Xu Y, Wang J, et al. Prognostic value and immune infiltration of novel signatures in clear cell renal cell carcinoma microenvironment. Aging (Albany NY). 2019;11(17):6999–7020.
16. Linehan WM, Schmidt LS, Crooks DR, et al. The metabolic basis of kidney cancer. Cancer Discov. 2019;9(8):1006–1021.
17. Kursunel MA, Esendagli G. The untold story of IFN-gamma in cancer biology. Cytokine Growth Factor Rev. 2016;31:73–81. doi:10.1016/j.cytogfr.2016.07.005
18. Castro F, Cardoso AP, Goncalves RM, Serre K, Oliveira MJ. Interferon-gamma at the crossroads of tumor immune surveillance or evasion. Front Immunol. 2018;9:847.
19. Maraskovsky E, Chen WF, Shortman K. IL-2 and IFN-gamma are two necessary lymphokines in the development of cytolytic T cells. J Immunol. 1989;143:1210–1214.
20. Curtsinger JM, Agarwal P, Lins DC, Mescher MF, Autocrine IFN-gamma promotes naive CD8 T cell differentiation and synergizes with IFN-alpha to stimulate strong function. J Immunol. 2012;189(2):659–668. doi:10.4049/jimmunol.1102727
21. Haabeth OA, Lorvik KB, Hammarstrom C, et al. Inflammation driven by tumour-specific Th1 cells protects against B-cell cancer. Nat Commun. 2011;2(1):240.
22. Nathan CF, Murray HW, Wiebe ME, Rubin BY, Identification of interferon-gamma as the lymphokine that activates human macrophage oxidative metabolism and antimicrobial activity. J Exp Med. 1983;158(3):670–689. doi:10.1084/jem.158.3.670
23. Corthay A, Skovseth DK, Lundin KU, et al. Primary antitumor immune response mediated by CD4+ T cells. Immunity. 2005;22(3):371–383.
24. Akbar SM, Inaba K, Onji M, Upregulation of MHC class II antigen on dendritic cells from hepatitis B virus transgenic mice by interferon-gamma: abrogation of immune response defect to a T-cell-dependent antigen. Immunology. 1996;87(4):519–527. doi:10.1046/j.1365-2567.1996.516576.x
25. Walter W, Lingnau K, Schmitt E, Loos M, Maeurer MJ, MHC class II antigen presentation pathway in murine tumours: tumour evasion from immunosurveillance? Br J Cancer. 2000;83(9):1192–1201. doi:10.1054/bjoc.2000.1415
26. Subramaniam PS, Torres BA, Johnson HM, So many ligands, so few transcription factors: a new paradigm for signaling through the STAT transcription factors. Cytokine. 2001;15(4):175–187. doi:10.1006/cyto.2001.0905
27. de Veer MJ, Holko M, Frevel M, et al., Functional classification of interferon-stimulated genes identified using microarrays. J Leukoc Biol. 2001;69:912–920.
28. Yao B, Wang L, Wang H, et al. Seven interferon gamma response genes serve as a prognostic risk signature that correlates with immune infiltration in lung adenocarcinoma. Aging (Albany NY). 2021;13(8):11381–11410.
29. Ma J, Cai X, Kang L, Chen S, Liu H, Identification of novel biomarkers and candidate small-molecule drugs in cutaneous melanoma by comprehensive gene microarrays analysis. J Cancer. 2021;12(5):1307–1317. doi:10.7150/jca.49702
30. Geeleher P, Cox N, Huang RS, Barbour JD, pRRophetic: an R package for prediction of clinical chemotherapeutic response from tumor gene expression levels. PLoS One. 2014;9(9):e107468. doi:10.1371/journal.pone.0107468
31. Charoentong P, Finotello F, Angelova M, et al. Pan-cancer immunogenomic analyses reveal genotype-immunophenotype relationships and predictors of response to checkpoint blockade. Cell Rep. 2017;18(1):248–262.
32. Reddy GK, Bukowski RM, Sorafenib: recent update on activity as a single agent and in combination with interferon-alpha2 in patients with advanced-stage renal cell carcinoma. Clin Genitourin Cancer. 2006;4(4):246–248. doi:10.3816/CGC.2006.n.002
33. Schmid TA, Gore ME, Sunitinib in the treatment of metastatic renal cell carcinoma. Ther Adv Urol. 2016;8(6):348–371. doi:10.1177/1756287216663979
34. Sternberg CN, Hawkins RE, Wagstaff J, et al. A randomised, double-blind Phase III study of pazopanib in patients with advanced and/or metastatic renal cell carcinoma: final overall survival results and safety update. Eur J Cancer. 2013;49(6):1287–1296.
35. Motzer RJ, Hutson TE, Tomczak P, et al. Sunitinib versus interferon alfa in metastatic renal-cell carcinoma. N Engl J Med. 2007;356(2):115–124.
36. Hutson TE, Lesovoy V, Al-Shukri S, et al. Axitinib versus sorafenib as first-line therapy in patients with metastatic renal-cell carcinoma: a randomised open-label Phase 3 trial. Lancet Oncol. 2013;14(13):1287–1294.
37. Tung I, Sahu A. Immune checkpoint inhibitor in first-line treatment of metastatic renal cell carcinoma: a review of current evidence and future directions. Front Oncol. 2021;11:707214. doi:10.3389/fonc.2021.707214
38. Motzer RJ, Penkov K, Haanen J, et al. Avelumab plus axitinib versus sunitinib for advanced renal-cell carcinoma. N Engl J Med. 2019;380(12):1103–1115.
39. Rini BI, Plimack ER, Stus V, et al. Pembrolizumab plus axitinib versus sunitinib for advanced renal-cell carcinoma. N Engl J Med. 2019;380(12):1116–1127.
40. Daugan MV, Revel M, Russick J, et al. Complement C1s and C4d as prognostic biomarkers in renal cancer: emergence of noncanonical functions of C1s. Cancer Immunol Res. 2021;9(8):891–908.
41. Huang WC, Tung SL, Chen YL, Chen PM, Chu PY, IFI44L is a novel tumor suppressor in human hepatocellular carcinoma affecting cancer stemness, metastasis, and drug resistance via regulating met/Src signaling pathway. BMC Cancer. 2018;18(1):609. doi:10.1186/s12885-018-4529-9
42. Wang Y, Chen Y, Zhu B, Ma L, Xing Q. A novel nine apoptosis-related genes signature predicting overall survival for kidney renal clear cell carcinoma and its associations with immune infiltration. Front Mol Biosci. 2021;8:567730. doi:10.3389/fmolb.2021.567730
43. Pan H, Wang X, Huang W, et al. Interferon-induced protein 44 correlated with immune infiltration serves as a potential prognostic indicator in head and neck squamous cell carcinoma. Front Oncol. 2020;10:557157. doi:10.3389/fonc.2020.557157
44. Wisdom AJ, Hong CS, Lin AJ, et al. Neutrophils promote tumor resistance to radiation therapy. Proc Natl Acad Sci U S A. 2019;116(37):18584–18589.
45. Ma H, Zhou H, Song X, Shi S, Zhang J, Jia L, Modification of sialylation is associated with multidrug resistance in human acute myeloid leukemia. Oncogene. 2015;34(6):726–740. doi:10.1038/onc.2014.7
46. Mondal S, Chandra S, Mandal C, Elevated mRNA level of hST6Gal I and hST3Gal V positively correlates with the high risk of pediatric acute leukemia. Leuk Res. 2010;34(4):463–470. doi:10.1016/j.leukres.2009.07.042
47. Ouyang X, Hao X, Liu S, Hu J, Hu L, Expression of Nup93 is associated with the proliferation, migration and invasion capacity of cervical cancer cells. Acta Biochim Biophys Sin. 2019;51(12):1276–1285. doi:10.1093/abbs/gmz131
48. Bersini S, Lytle NK, Schulte R, Huang L, Wahl GM, Hetzer MW, Nup93 regulates breast tumor growth by modulating cell proliferation and actin cytoskeleton remodeling. Life Sci Alliance. 2020;3(1):e201900623. doi:10.26508/lsa.201900623
49. Oshiumi H, Miyashita M, Okamoto M, et al. DDX60 is involved in RIG-I-dependent and independent antiviral responses, and its function is attenuated by virus-induced EGFR activation. Cell Rep. 2015;11(8):1193–1207.
50. Xin D, Liu J, Gu J, et al. Low expression of DDX60 gene might associate with the radiosensitivity for patients with breast cancer. J Oncol. 2020;2020:8309492. doi:10.1155/2020/8309492
51. Pan Y, Wu Y, Hu J, et al. Long noncoding RNA HOTAIR promotes renal cell carcinoma malignancy through alpha-2, 8-sialyltransferase 4 by sponging microRNA-124. Cell Prolif. 2018;51(6):e12507.
52. Ma W, Zhao X, Liang L, et al. miR-146a and miR-146b promote proliferation, migration and invasion of follicular thyroid carcinoma via inhibition of ST8SIA4. Oncotarget. 2017;8(17):28028–28041.
53. Ito A, Mimae T, Yamamoto YS, et al. Novel application for pseudopodia proteomics using excimer laser ablation and two-dimensional difference gel electrophoresis. Lab Invest. 2012;92(9):1374–1385.
54. Fan X, Liu L, Shi Y, et al. Integrated analysis of RNA-binding proteins in human colorectal cancer. World J Surg Oncol. 2020;18(1):222.
55. Kaneda MM, Messer KS, Ralainirina N, et al. PI3Kgamma is a molecular switch that controls immune suppression. Nature. 2016;539(7629):437–442.
56. Rodriguez PC, Quiceno DG, Ochoa AC, L-arginine availability regulates T-lymphocyte cell-cycle progression. Blood. 2007;109(4):1568–1573. doi:10.1182/blood-2006-06-031856
57. Ostrand-Rosenberg S, Myeloid-derived suppressor cells: more mechanisms for inhibiting antitumor immunity. Cancer Immunol Immunother. 2010;59(10):1593–1600. doi:10.1007/s00262-010-0855-8
58. Schlecker E, Stojanovic A, Eisen C, et al. Tumor-infiltrating monocytic myeloid-derived suppressor cells mediate CCR5-dependent recruitment of regulatory T cells favoring tumor growth. J Immunol. 2012;189(12):5602–5611.
59. Terabe M, Swann J, Ambrosino E, et al. A nonclassical non-Valpha14Jalpha18 CD1d-restricted (type II) NKT cell is sufficient for down-regulation of tumor immunosurveillance. J Exp Med. 2005;202(12):1627–1633.
60. Ghiringhelli F, Menard C, Martin F, Zitvogel L, The role of regulatory T cells in the control of natural killer cells: relevance during tumor progression. Immunol Rev. 2006;214(1):229–238. doi:10.1111/j.1600-065X.2006.00445.x
61. Ryba M, Mysliwska J. CD4+CD25+Foxp3+ T lymphocytes: naturally occurring regulatory T cells. Pediatr Endocrinol Diabetes Metab. 2010;16:289–294.
62. Zhdanov DD, Gladilina YA, Pokrovsky VS, et al. Murine regulatory T cells induce death of effector T, B, and NK lymphocytes through a contact-independent mechanism involving telomerase suppression and telomere-associated senescence. Cell Immunol. 2018;331:146–160. doi:10.1016/j.cellimm.2018.06.008
63. Zhdanov DD, Gladilina YA, Grishin DV, et al. Contact-independent suppressive activity of regulatory T cells is associated with telomerase inhibition, telomere shortening and target lymphocyte apoptosis. Mol Immunol. 2018;101:229–244. doi:10.1016/j.molimm.2018.07.017
64. Molina AM, Motzer RJ, Clinical practice guidelines for the treatment of metastatic renal cell carcinoma: today and tomorrow. Oncologist. 2011;16(Suppl S2):45–50. doi:10.1634/theoncologist.2011-S2-45
65. Escudier B, Eisen T, Stadler WM, et al. Sorafenib for treatment of renal cell carcinoma: final efficacy and safety results of the phase III treatment approaches in renal cancer global evaluation trial. J Clin Oncol. 2009;27(20):3312–3318.
66. Escudier B, Eisen T, Stadler WM, et al. Sorafenib in advanced clear-cell renal-cell carcinoma. N Engl J Med. 2007;356(2):125–134.
67. Pena C, Lathia C, Shan M, Escudier B, Bukowski RM, Biomarkers predicting outcome in patients with advanced renal cell carcinoma: results from sorafenib phase III treatment approaches in renal cancer global evaluation trial. Clin Cancer Res. 2010;16(19):4853–4863. doi:10.1158/1078-0432.CCR-09-3343
68. Sternberg CN, Davis ID, Mardiak J, et al. Pazopanib in locally advanced or metastatic renal cell carcinoma: results of a randomized phase III trial. J Clin Oncol. 2010;28(6):1061–1068.
69. Geczi L, Bodoky G, Rokszin G, Fabian I, Torday L, Survival benefits of second-line axitinib versus everolimus after first line sunitinib treatment in metastatic renal cell carcinoma. Pathol Oncol Res. 2020;26(4):2201–2207. doi:10.1007/s12253-020-00809-z
70. Motzer RJ, Jonasch E, Michaelson MD, et al. NCCN guidelines insights: kidney cancer, version 2.2020. J Natl Compr Canc Netw. 2019;17(11):1278–1285.
 © 2021 The Author(s). This work is published and licensed by Dove Medical Press Limited. The
full terms of this license are available at https://www.dovepress.com/terms
and incorporate the Creative Commons Attribution
- Non Commercial (unported, 3.0) License.
By accessing the work you hereby accept the Terms. Non-commercial uses of the work are permitted
without any further permission from Dove Medical Press Limited, provided the work is properly
attributed. For permission for commercial use of this work, please see paragraphs 4.2 and 5 of our Terms.
© 2021 The Author(s). This work is published and licensed by Dove Medical Press Limited. The
full terms of this license are available at https://www.dovepress.com/terms
and incorporate the Creative Commons Attribution
- Non Commercial (unported, 3.0) License.
By accessing the work you hereby accept the Terms. Non-commercial uses of the work are permitted
without any further permission from Dove Medical Press Limited, provided the work is properly
attributed. For permission for commercial use of this work, please see paragraphs 4.2 and 5 of our Terms.