Back to Journals » International Journal of Nanomedicine » Volume 18
Development of an Effective Neutralizing Antibody Assay for SARS-CoV-2 Diagnosis
Authors Liu Z, Liang J ![]() , Hu H, Wu M, Ma J, Ma Z
, Hu H, Wu M, Ma J, Ma Z ![]() , Ji J, Chen H, Li X, Wang Z
, Ji J, Chen H, Li X, Wang Z ![]() , Luo Y
, Luo Y
Received 23 February 2023
Accepted for publication 8 June 2023
Published 12 June 2023 Volume 2023:18 Pages 3125—3139
DOI https://doi.org/10.2147/IJN.S408921
Checked for plagiarism Yes
Review by Single anonymous peer review
Peer reviewer comments 2
Editor who approved publication: Professor Farooq A. Shiekh
Zhigang Liu,1,* Jiahui Liang,1,* Hangzhan Hu,1,* Mengli Wu,1,* Jingjing Ma,1 Ziwei Ma,1 Jianing Ji,1 Hengyi Chen,2 Xiaoquan Li,1 Zhizeng Wang,1,2 Yang Luo2,3
1Joint National Laboratory for Antibody Drug Engineering, Clinical Laboratory of the First Affiliated Hospital, School of Medicine, Henan University, Kaifeng, 475004, People’s Republic of China; 2Center of Smart Laboratory and Molecular Medicine, Jiangjin Hospital, School of Medicine, Chongqing University, Chongqing, 400044, People’s Republic of China; 3College of Life Science and Laboratory Medicine, Kunming Medical University, Kunming, 650500, People’s Republic of China
*These authors contributed equally to this work
Correspondence: Zhizeng Wang, Joint National Laboratory for Antibody Drug Engineering, Clinical Laboratory of the First Affiliated Hospital, School of Medicine, Henan University, Kaifeng, 475004, People’s Republic of China, Tel +86 15093628687, Email [email protected] Yang Luo, Center of Smart Laboratory and Molecular Medicine, Jiangjin Hospital, School of Medicine, Chongqing University, Chongqing, 400044, People’s Republic of China, Tel +86 13594088001, Email [email protected]
Introduction: Neutralizing antibodies (NAbs) are essential for preventing reinfection with SARS-CoV-2 and the recurrence of COVID-19; nonetheless, the formation of NAbs following vaccination and infection remains enigmatic due to the lack of a practical and effective NAb assay in routine laboratory settings. In this study, we developed a convenient lateral flow assay for the rapid and precise measurement of serum NAb levels within 20 minutes.
Methods: Receptor-binding domain-fragment crystallizable (RBD-Fc) and angiotensin-converting enzyme 2-histidine tag (ACE2-His) were expressed by the eukaryotic expression systems of Spodoptera frugiperda clone 9 and human embryonic kidney 293T, respectively. Then, colloidal gold was synthesized and conjugated with ACE2. After optimizing various operating parameters, an NAb lateral flow assay was constructed. Subsequently, its detection limit, specificity, and stability were systematically evaluated, and clinical samples were analyzed to validate its clinical feasibility.
Results: RBD-Fc and ACE2-His were obtained with 94.01% and 90.05% purity, respectively. The synthesized colloidal gold had a uniform distribution with an average diameter of 24.15 ± 2.56 nm. With a detection limit of 2 μg/mL, the proposed assay demonstrated a sensitivity of 97.80% and a specificity of 100% in 684 uninfected clinical samples. By evaluating 356 specimens from infected individuals, we observed that the overall concordance rate between the proposed assay and conventional enzyme-linked immunosorbent assay was 95.22%, and we noticed that 16.57% (59/356) of individuals still did not produce NAbs after infection (both by ELISA and the proposed assay). All the above tests by this assay can obtain results within 20 minutes by the naked eye without any additional instruments or equipment.
Conclusion: The proposed assay can expediently and reliably detect anti-SARS-CoV-2 NAbs after infection, and the results provide valuable data to facilitate effective prevention and control of SARS-CoV-2.
Clinical trial registration: Serum and blood samples were used under approval from the Biomedical Research Ethics Subcommittee of Henan University, and the clinical trial registration number was HUSOM-2022-052. We confirm that this study complies with the Declaration of Helsinki.
Keywords: clinical detection, colloidal gold, neutralizing antibody, point-of-care test, SARS-CoV-2
Introduction
Severe acute respiratory syndrome coronavirus 2 (SARS-CoV-2) has spread worldwide because of its high infectiousness and worrying mutagenicity.1,2 Therefore, NAbs are key to preventing reinfection and the recurrence of infection by diverse microorganisms, and more than 13 billion SARS-CoV-2 vaccine doses have been injected worldwide to effectively combat the virus as of February 17, 2023.3 In most cases, plasma cells produce NAbs as a result of vaccine-induced humoral immunity, and individuals can be protected from reinfection when NAb levels reach the needed concentration.4,5 According to a recent study, the level of anti-SARS-CoV-2 NAbs varies widely and declines precipitously within a few months;4 as a result, booster vaccine doses have been administered in most nations to increase the level of anti-SARS-CoV-2 NAbs.6 Many teams exploit virus,7 fluorescence,8,9 enzymology,10 colloidal gold spectroscopy11 and other methods12,13 to carry out NAb detection, but these reports are not completely consistent; these studies mainly focus on whether the vaccine induces the body to produce NAbs14 and generally do not address the NAb concentration, mainly due to the limitation of measurement methods. In an effort to quickly prevent and control SARS-CoV-2, emergent implementation of herd immunity-building measures has occurred.15 In this context, a rapid and exhaustive measurement of NAb levels for large population screening is particularly crucial.
Although several NAb detection methods, including pseudovirus,16 plaque reduction neutralization test (PRNT),17 enzyme-linked immunosorbent assay (ELISA),18 chemiluminescence,19 and lateral flow immunoassay (LFIA) approaches,20–23 have been proposed for NAb testing, there are currently no systematic reports on the regularity of NAb production. Among the applied techniques, the gold standard assay is conventional PRNT, which requires extensive labor, live viruses, and BSL-3 facilities.24,25 Moreover, ELISA is labor intensive, and chemiluminescence requires the use of unique instruments and equipment.26–29 In addition, large-scale screening of NAb levels on a population scale is particularly time-consuming and costly. LFIAs with colloidal gold labeling have been proposed as candidates for large-scale detection due to their simplicity and portability,30–34 but their accuracy has been widely criticized.35,36 A series of NAb detection methods based on colloidal gold have been developed,12–14,21,37 but the focus has thus far been on pursuing high sensitivity and ignoring the concentration dependence of the effect of NAbs against SARS-CoV-2 invasion; therefore, these methods do not meet the practical need to prevent reinfection and recurrence. In addition, a dominant factor limiting accuracy is the unstable conjugation between immobilized protein molecules and the colloidal gold stain; the accuracy of the lateral flow kit is affected by the binding efficiency of the conjugates.
In this work, we focus on the problem of determining whether the concentration of NAb in the body can effectively block the invasion of SARS-CoV-2 and develop a competitive method for NAb detection based on a lateral flow assay, which can rapidly and conveniently evaluate the NAb level in human serum within 15 minutes. This research not only explored the regularity of NAb production in the population before and after vaccination but also examined the need for NAbs in the population after infection. Therefore, these results provide valuable data supporting the accurate prevention and control of SARS-CoV-2.
Materials and Methods
Preparation of the Target Proteins (RBD and ACE2) Using Recombinant Plasmids
Invitrogen’s Bac-to-Bac baculovirus insect cell expression system was used to express the SARS-CoV-2 receptor-binding domain (RBD) protein. First, the target gene was inserted into the modified pFastBac1-His vector through molecular cloning, and the correctly sequenced recombinant plasmid was inserted into DH10Bac via transformation. After a blue‒white screening experiment, endotoxin-depleted recombinant baculovirus plasmid DNA was extracted and inserted into a eukaryotic expression system in Spodoptera frugiperda clone 9 (sf9) cells in the logarithmic growth phase via transfection, and after three passages, suitable virus titers were detected.38,39 Hi5 cells (High Five insect cells) were infected for suspension expansion culture. The target protein was purified in two steps: affinity purification (HisTrap HP 5 mL column, GE Healthcare) and molecular sieve chromatography (Superdex 200 increase 10/300 GL column, GE Healthcare). According to a similar method, angiotensin-converting enzyme 2 (ACE2) recombinant protein was expressed by a eukaryotic expression system in human embryonic kidney 293T (293T) cells using 6xHis as a label and purified by a Ni2+ column (HisTrap HP 5 mL column, GE Healthcare) and molecular sieve by affinity chromatography, and its purity was checked by SDS‒PAGE and analysis.40
Preparation of an NAb Detection Kit for SARS-CoV-2 Based on Colloidal Gold
The kit consisted of an outer casing and an inner test strip. The bottom of the test strip was supported by a PVC base plate, and the reaction pad (nitrocellulose membrane, Millipore, HF13502S25), absorbent pad, conjugating pad, and sample pad were layered in sequence (Figure 1).
 |
Figure 1 Diagram and components of the SARS-CoV-2 neutralizing antibody immunoassay test strip and visual assessment guidelines for interpreting the test strip results. Abbreviations: Au-NPs, colloidal gold nanoparticles; SARS-CoV-2, severe acute respiratory syndrome coronavirus 2; NAb, neutralizing antibody; ACE2, angiotensin-converting enzyme 2; RBD, receptor binding domain; M, mouse; IgG, immunoglobulin G; C, control line; T, test line. |
The conjugating pad was fabricated with colloidal gold bound to recombinant ACE2 protein and solidified on the glass fiber. Colloidal gold nanoparticles (Au-NPs) were synthesized by reducing chloroauric acid (Sigma, G4022) with sodium citrate (Sigma, C3674).41 Ultrapure water (750 mL) was placed in a 2 L conical flask, and the flask was sealed and heated on an electric stove until oil beads rose. Then, 10 mL of 4% chloroauric acid was added, and the flask was heated until the solution boiled completely. Next, 10 mL of 6% sodium citrate was added, and the solution was boiled for 5 min. After the solution turned wine red and allowed to naturally cool, a volumetric flask was used to dilute the solution to 1000 mL to obtain colloidal gold. When irradiated by a red laser, a good Tyndall effect was observed, confirming good colloid properties. Finally, the stability, uniformity, particle size and other parameters of individual colloidal gold nanoparticles (Au-NPs) were observed by full-wavelength scanning (Thermo, Varioskan Flash), dynamic light scattering (DLS) (Malvern, ZETASIZER Nano ZS) and transmission electron microscopy (TEM) (Japan Electronics Corporation, JEM-F200),42 and the particles were stored at 4°C.
The pH and concentration of Au-NPs binding with ACE2 are determined by a color reaction. Each Au-NP has an electric double-layer structure, which maintains a stable colloidal state through mutual repulsion between the same electrons.43 When strong electrolytes (such as NaCl) are added to colloidal gold, the negative ion layer on the surface of Au-NPs is collapsed, and the precipitating gold sol that emerges turns the solution blue; however, if all active sites are blocked completely with protein, a protective layer is formed on the surface of Au-NPs. Thus, no aggregation occurs when strong ions are added. If the active site is not completely blocked, Au NPs will aggregate to produce a color change visible to the naked eye, from the original wine-red to purple and then to blue‒gray. The absorbance of colloidal gold at different pH and conjugating concentrations can be determined by full-wavelength scanning. The pH + 0.5 at which the Au-NPs first changed color was identified as the optimum pH of the label. The optimal binding concentration of ACE2 was increased by 20% from the value at which the Au-NPs first changed color.34
The pH of Au-NPs was adjusted by 0.2 M potassium carbonate (Sinopharm Chemical Reagent Co., Ltd, 584-08-7) solution, the solution was mixed quickly, ACE2 recombinant protein and mouse IgG (Luoyang Baiaotong Experimental Materials Center, C040306) were added according to the conditions determined above, and the solution was mixed at room temperature for 30 minutes.
Next, 10% (w/v) bovine serum albumin (BSA, Sigma, A3912) was added and adjusted to 1% of the final concentration in the colloidal gold solution, and the solution was gently mixed for 30 min at room temperature to block the unbound sites.44 The blocked colloidal gold was centrifuged at 10,000 rpm/min for 10 min, the supernatant was discarded, and the precipitate was resuspended and dissolved in 240 μL of working solution (0.01 M PBS (pH 7.6), 1.0% BSA, 5% sucrose and 0.3% Tween-20),39 spread evenly on the conjugating pad, dried in a blast drying oven at 40°C for 6 h and stored for use with 30% humidity. The control line (C line) and test line (T line) were fixed on the NC membrane; the C line was coated with goat anti-mouse IgG diluted to 200 μg/mL by 0.01 M phosphate buffer, and the T line was coated with the RBD region of the S protein of SARS-CoV-2 with 0.01 M phosphate buffer. After scribing the NC membrane with a gold-spraying machine (JN BIO, CM3010), the NC membrane was placed in a blast drying oven at a temperature of 40°C and a humidity of 30% to dry.
The preparation of sample pad: First, the treatment solution (1 L) of sample pad was prepared by mixing 996 mL of 0.05 M Tris HCl (Solarbio, 77-86-1) solution, 4 mL Tween-20 (Promega, 0000303178) and 0.5 mL Nonidet P40 (Sigma, 74,385). Then, 20 g of trehalose (Sigma, SLCC3489) and 5 g of BSA were added to the above solution, and mixing completely. After sterilization and filtration, the solution was used immediately. The glass fiber was cut to 200 mm according to the position of the PVC base plate sample pad × 22 mm, then soak in sample pad treatment solution for 30 minutes. After excess liquid was discarded, the sample pad was dried overnight in a 40 °C drying oven, and stored at room temperature for use.
Detection and Interpretation of Results
This kit was prepared based on the immunocompetition method. ACE2 and mouse IgG were immobilized at the conjugate pad, and the RBD and anti-mouse IgG were coated in the T line and C line of the reaction pad, respectively.35 When the sample without NAbs was added, the AuNP-ACE2-mouse IgG complex was redissolved and flowed to the reaction pad. ACE2 was specifically intercepted by the RBD protein, and the AuNP-ACE2-RBD complex was aggregated and colored on the T line (Figure 1). The abundant AuNP-mouse IgG continued to flow and was specifically captured by goat anti-mouse IgG on the C line, and the AuNP-mouse IgG-goat anti-mouse IgG complex aggregated and developed color on the line. Therefore, the C line and the T line developed at the same time, and the result was negative. When a sample with sufficient NAbs was added, it could be captured by the RBD coating on the T line; therefore, the ACE2 complex could not be captured by the RBD, so the color of the T line did not develop since it did not contain AuNPs, and the remaining AuNPs-ACE2-mouse IgG complex continued to flow and was specifically intercepted by goat anti-mouse IgG. The C line showed the wine red color. Therefore, only the C line developed color, which is a positive result and means that the tested sample contained anti-SARS-CoV-2 NAbs. When the C-line did not color, the detection result was determined to be invalid.
Verification of the Limit of Detection, Specificity, and Stability of the Lateral Flow Kit
To verify the limit of detection (LOD) of this assay, which is the minimum concentration of NAbs that can be detected from the samples, NAbs were isolated from the serum of convalescent patients and then obtained through recombinant expression using molecular biology methods. The NAb standard was diluted to different concentrations (0.001 μg/mL, 0.01 μg/mL, 0.1 μg/mL, 0.4 μg/mL, 0.8 μg/mL, 1 μg/mL, 2 μg/mL, 4 μg/mL, 8 μg/mL and 10 μg/mL) by control diluent (10 mM pH 7.4 PB, 0.1% Tween-20, 0.2% BSA). An 80 μL diluted NAb sample was added at once, and the detection result was read within 20 min. The standard curve of NAb detection conditions was drawn by GraphPad Prism. There are currently no NAb standards for SARS-CoV-2, so we selected two convalescent patients for the examination of serum NAbs in this research. To ensure the accuracy of the interpretation of test results, each result was interpreted by at least 3 persons, and ImageJ software was used to assist in interpretation.45
After SARS-CoV-2 infection, the body will produce antibodies against the spike protein and nucleoprotein. To determine whether this assay had cross reactivity with other relevant antibodies, anti-SARS-CoV-2 nucleoprotein IgG (10 μg/mL), anti-SARS-CoV-2 nucleoprotein IgM and human IgG standards (10 μg/mL), anti-influenza-positive samples, anti-RF-positive samples, and anti-H1N1-positive samples were selected for specificity validation, and diluent and NAb-containing samples were detected at the same time as the negative and positive controls, respectively. Each sample was tested three times.
The NAb detection kit was stored in a desiccator at 40°C for 30 days, and then the NAb standard and diluent were detected in triplicate for stability validation.
To verify the test results, we used a commercially available total antibody detection kit (Vazyme Biotech Co. Ltd., V5020120152B), which yielded a weakly positive result. In addition, we used a commercially available ELISA NAb detection kit (Vazyme Biotech Co. Ltd., DD3101) to detect the different concentrations of the NAb standard and obtained the standard curve by analyzing the data.
Clinical Sample Validation
Clinical samples were provided by volunteers from Henan University. We collected serum samples from volunteers before immunization (N=311), 21 days after the first immunization (N=170), 21 days after the second immunization (N=182), 30 days after infection with SARS-CoV-2 (N=348) and uninfected samples (N=8). All samples were detected by ELISA kits for anti-SARS-CoV-2 NAb or clinical decisions. If the percent suppression of NAb by ELISA is greater than or equal to 20%, as the result will be considered positive; if less than 20%, it will be considered negative according to the instructions for the ELISA kit (Vazyme Biotech Co. Ltd., DD3101). The sensitivity, specificity, positive predictive value, and negative predictive value of the kit were calculated according to the following formulas:46
Sensitivity = [true positive/(true positive + false negative)] × 100%
Specificity = [true negative/(true negative + false positive)] × 100%
Positive predictive value = [true positive/(true positive + false positive)] × 100%
Negative predictive value = [true negative/(false negative + true negative)] × 100%
Samples from volunteers for testing were collected by clinical staff. This study was approved by the Biomedical Research Ethics Committee of Henan University. All experiments were performed following relevant laws and institutional guidelines, and clinical sample contributors were informed and consented to the study.
Results and Discussion
Characterization of SARS-CoV-2 RBD and ACE2 Recombinant Proteins
Several studies have shown that SARS-CoV-2 binds to the human cell surface receptor ACE2 mainly through the RBD region of the viral S protein47,48; therefore, antibodies that can bind to the RBD of the S protein can prevent the S protein from attaching to host cells and can neutralize the virus.49 Most vaccine development has focused on the S protein as the antigenic target of the SARS-CoV-2 vaccine.50–53 In this study, the RBD was expressed from the insect baculovirus expression system based on sf9 cells using an Fc tag and purified by affinity chromatography with Staphylococcus protein A; ACE2 was expressed in the eukaryotic expression system based on HEK 293T cells, 6xHis was used as a tag, and a nickel column was used for affinity purification. RBD-Fc is an approximately 40 kDa protein, and there was only a trace amount of RBD-Fc in the flow-through. Upon affinity purification, RBD-Fc was mainly in the eluate, and the calculated purity was 94.01%. For the purification of ACE2-His, the target protein was expressed at approximately 85 kDa. Upon elution and calculation, the purity was found to be 90.05% (Figure 2A). We also attempted to use Escherichia coli for the expression of RBD and ACE2 recombinant proteins, but there were problems regarding precipitation and insufficient protein activity, so the eukaryotic system was selected for protein expression. When the CHO (Chinese hamster ovary cells) system was selected for expression, the problem of insufficient activity also occurred, so finally, we chose HEK 293T cells to express ACE2 protein and the sf9 system to express RBD protein.
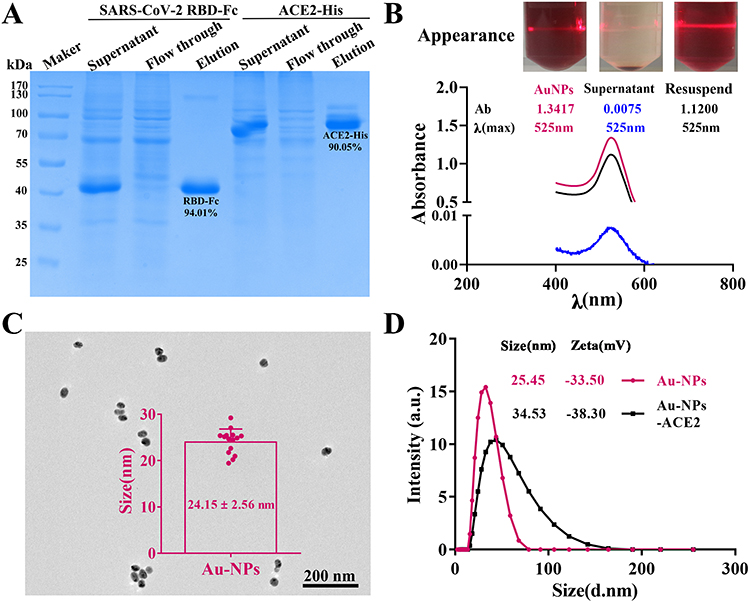 |
Figure 2 Proteins purification (A), preparation (B), characterization (C) of colloidal gold nanoparticle, and conjugating effect (D). Abbreviations: SARS-CoV-2, severe acute respiratory syndrome coronavirus 2; ACE2, angiotensin-converting enzyme 2; RBD, receptor binding domain; Au-NPs, colloidal gold nanoparticles. |
Au-NPs were prepared by the reduction of chloroauric acid with sodium citrate. The Au-NPs solution was clear and translucent, and a beam of light passed through the solution, which had a favorable Tyndall effect. The λmax of the Au-NPs solution was 525 nm by full wavelength scanning; moreover, the suspension of colloidal gold presented both good separation and resuspension performance according to visual observation (Figure 2B). The full image is shown in Supplemental Figure 1. In addition, the average diameter of AuNPs was 24.15 ± 2.56 nm, with an even distribution, as determined by TEM (Figure 2C), and a zeta potential of −33.5 mV (Figure 2D), as determined by DLS. The successful labeling of AuNPs and ACE2 protein can be seen by the increase in the particle size before and after hydration with colloidal gold from 25.45 nm to 34.53 nm (Figure 2D). These parameters indicate a stable characteristic of AuNPs and a conjugating effect. Initially, 0.25 mM colloidal gold was used for kit preparation, and although it successfully labeled ACE2 protein, the color development even for the C line was relatively weak (Supplemental Figure 2). We compared colloidal gold concentrations of 0.50 and 1.00 mM and finally selected 1.00 mM colloidal gold for the preparation of the kit according to color rendering of the T line and C line. Although proteins are conjugated to Au-NPs by noncovalent bonds, this process leads to weakened protein activity. During NAb detection, false-positive results caused by reduced protein activity interfere with the discovery of response regularity, so we maintained activity by controlling the concentration, time, and rate of protein at the time of labeling through repeated verification.
As presented in Figure 3A, the color of colloidal gold in the sample changes gradually from pH 3.0 to 8.0. As the pH gradually increased according to the volume of K2CO3 (0.2 M) was added, the solution in the pH 6.0 tube did not initially change color, and the color was similar to that of the solution in the untreated colloidal gold tube. Through full wavelength scanning, it was found that the absorbance values of pH 6.0 and 7.0 were higher and had narrower absorption peaks than those of other pH conditions, and there was no significant difference between the pH 6.0 and 7.0 conditions (Figure 3A and Supplemental Figure 3); the effect of a different pH on detection was verified by the self prepared NAb kit, and it was found that the color development utilization rate was high when the pH was 6.5, and that the color development of the C and T lines was relatively good. After repeated experiments, it was found that the color development result was more stable when the pH was 6.5 (Figure 3B); moreover, the naked-eye judgment results were consistent with auxiliary interpretation. Thus, the optimal pH for AuNP-ACE2 complex visualization was pH 6.5.
 |
Figure 3 Selection of optimal conjugating and coating conditions for the NAb kit. (A) Color reaction and full-wavelength scanning of different pH values of colloidal gold-labeled ACE2 protein; (B) Actual color effect of pH 6.0, 6.5, 7.0, 8.0 and analysis result (n=3) of detection by ImageJ and GraphPad Prism. The optimum labeling concentration of ACE2 protein selection; (C) Color reaction and full-wavelength scanning images of different labeling quantities; (D) Actual color effect of 6 µg/mL ACE2 protein-mouse IgG (n=3); (E) Actual color effect of 8 µg/mL ACE2 protein-mouse IgG (n=3); (F) DLS characterization of colloidal gold labeling and sealing effect; (G–J) The optimal coating concentration of receptor binding domain (RBD) protein in test line and analysis result (n=3) of detection by ImageJ and GraphPad Prism. The color and statistical results of RBD protein coating concentration of (G) 0.4 mg/mL; (H) 0.2 mg/mL; (I) 0.08 mg/mL and (J) 0.04 mg/mL. Abbreviations: AuNPs, colloidal gold; ACE2, angiotensin-converting enzyme 2; C, control line; T, test line; Con., concentration; N, negative; NAb, neutralizing antibody. |
As presented in Figure 3C, the color of colloidal gold in samples containing 0 to 8 µg/mL ACE2 changed from gray‒blue to rose-red. As the amount of added ACE2 increased, the solution in the tube containing 5 μg/mL did not initially change color. At first, the color was close to rose-red, and at this point, the labeling concentration of the tube was 5 µg/mL. Therefore, the optimal labeling concentration of ACE2 was 5×120% µg/mL, which is 6 µg/mL. The absorbance of the solution with 8 µg/mL ACE2 was the closest to that of Au-NPs; the effect of different concentrations on the detection result was verified by the NAb kit (Figure 3D and E, Supplemental Figure 4), and it was found that the sensitivity of the kit was better when the ACE2 concentration was 6 µg/mL (Figure 3D). Thus, the optimal concentration of AuNPs-ACE2 was 6 µg/mL.
Traditionally, anti-His antibodies are the best choice as C line-coated antibodies because ACE2 is labeled with a 6×His tag, but the His system did not work well in this study. The His system had the desired effect in our previous studies, but the hindrance may be due to methodological problems with lateral immunochromatography, which was based on a competition approach in this study and an indirect approach in previous studies; this discrepancy may also be because ACE2 has a large molecular weight, and the 6×His tag is not fully exposed on the surface of the ACE2 protein and cannot be fully captured by the anti-His antibody, so the color rendering effect at the final C line is affected. Thus, the mouse IgG and anti-mouse IgG antibody system was selected for the C line of the kit; that is, the colloidal gold surface was labeled with mouse IgG after ACE2, and anti-mouse IgG was coated at the C line.21,54 Because our team has a mature purification technology for His tags, we will continue to use this tag for ACE2 expression in the future. According to the above conditions, the average hydrated diameters of the AuNPs, AuNP-conjugated ACE2-anti-mouse IgG, and those blocked by BSA were 26.70 nm, 59.01 nm, and 70.86 nm, respectively, as determined by DLS (Figure 3F). These results suggest that the AuNPs and ACE2 were successfully conjugated, with stable performance according to increasing particle size before and after labeling. With 0.25 mM AuNPs, BSA at a final concentration of 1% was used to block the unbound active site of AuNPs. The effectiveness of BSA with a final concentration of 1% and 2% as a blocking reagent was compared, the results show that when the BSA concentration is 2%, the LOD of this kit and the effect is better than 1% BSA (Supplemental Figure 5A and B). Therefore, a 2% BSA concentration was selected in the following study.
The concentration coated on the T line is very important for the test results of the competition kit. When the coating concentration is too low, false-positive results will be observed; if the coating concentration is too high, nonspecific adsorption may occur, resulting in false-negative results. Different concentrations (400, 200, 80 and 40 µg/mL) of the RBD were chosen to compare the detection effect. When the concentration of NAb was 10 µg/mL, a positive result was unpresented under RBD coating concentrations of 400 µg/mL (Figure 3G and Supplemental Figure 6A) and 200 µg/mL (Figure 3H and Supplemental Figure 6B), and the sensitivity was poor. Regardless of the concentration of NAbs tested, the T line of the kit was less colored with an RBD coating concentration of 40 µg/mL (Figure 3I and Supplemental Figure 6C). When testing a negative sample, both the blocking effect and color development of the T line showed good performance when the coating concentration was 80 µg/mL (Figure 3J and Supplemental Figure 6D); therefore, the optimal coating concentration of the RBD on the T line was 80 µg/mL.
The sample pad is an important part of the kit, which generally needs to be processed in the sample pad treatment solution before use. Due to the difference in test samples and items, the composition of the sample pad treatment solution also affects color development. To avoid false-negative results, we added 0.05% Nonidet P 40 nonionic surfactant to the sample treatment solution, and the subsequent determination of the standard antibody detection sensitivity showed that the background of the test strip was cleaner, and it was less prone to false-negative results. Possibly because of nonionic surfactants, the liquid does not adsorb strongly on the solid surface.55
Quality Control of Colloidal Gold-Labeled Proteins
Limit of Detection, Stability and Specificity of the Lateral Flow Kit for Neutralizing Antibodies in Serum
LOD, stability and specificity are important performance parameters of the kit. These indicators need to be accurately detected and verified (Figure 4A). NAbs from convalescent patients were diluted to 0.001 μg/mL, 0.01 μg/mL, 0.1 μg/mL, 1 μg/mL, 2 μg/mL, 4 μg/mL, 8 μg/mL and 10 μg/mL in diluent, and 80 μL was added dropwise to each sample well. The results were interpreted within 20 minutes. The lowest concentration of NAbs for which the T line did not appear was considered the LOD of the kit. Considering that it is not easy to assign weak color development, the detection results were recorded by different persons and analyzed using ImageJ and GraphPad Prism software, and it was concluded that the LOD of this kit was 2 μg/mL (Figure 4B and Supplemental Figure 7A). The fitted curve was Y = 1799.7×2 – 3265.8 X + 1892.4 with R2 = 0.9778 according to the intensity of the T line, as determined by ImageJ. The LOD was still 2 μg/mL according to calculations based on NAbs from another patient (Supplemental Figure 7B and C). The intensity of the T line correlated inversely with the concentration of NAbs in samples from 0 µg/mL to 2 µg/mL. False-positive results were not obtained in any of the negative tests. No false-negative results appeared in samples with NAb concentrations above 2 µg/mL. There are currently no NAb standards for SARS-CoV-2, so we selected two convalescent patients for examination of serum NAbs in this research. To ensure the accuracy of the interpretation of test results, each result was interpreted by at least three persons, and ImageJ software was used to assist in interpretation. In routine disease detection, the higher the LOD is, the better, but the protective concentration of anti-SARS-CoV-2 NAb in the body is not yet clear, so we set the LOD threshold at 2 µg/mL, even if it can be at the ng/mL level according to our technical system.
 |
Figure 4 Characterization results of SARS-CoV-2 NAb kit. The kit of (A) LOD detection, (B) specificity (C), stability (D) detection results (n=3) and analysis by ImageJ and GraphPad Prism. Abbreviations: C, control line; T, test line; N, negative; LOD, limit of detection; NAb, neutralizing antibody; Anti-N IgG, anti-nucleoprotein of SARS-CoV-2 immunoglobulin G; Anti-N IgM, anti-nucleoprotein of SARS-CoV-2 immunoglobulin M; H1N1, hemagglutinin 1 neuraminidase 1; ANA, antinuclear antibody; RF, rheumatoid factor; +, positive. |
The kit specificity experiment was performed to prevent the cross-reaction of the kit with other proteins, generating false-positive results. Anti-SARS-CoV-2 nucleoprotein IgG, anti-SARS-CoV-2 nucleoprotein IgM, human IgG standards, anti-RF-positive serum, and anti-H1N1-positive serum yielded results indicating the specificity of the test, and there was no apparent cross-reactivity (Figure 4C and Supplemental Figure 8) of the negative and positive control tests, which was consistent with expectations. Therefore, there were no cross-reactions with anti-SARS-CoV-2 nucleoprotein IgG, anti-SARS-CoV-2 nucleoprotein IgM, human IgG standards, anti-RF-positive serum, or anti-H1N1-positive serum by this lateral flow kit. Kit stability is a prerequisite for the transformation of scientific research results. The sensitivity and specificity of the tests can thus be influenced by humidity. Humidity affects the test results in the following ways. Humidity causes the hydrolysis of the ACE2-His protein, which leads to the destruction of the conjugated complex. In addition, the sucrose in the working solution will form crystals, which will lead to the unsatisfactory release of markers due to excessive humidity.56 A batch of kits was prepared and stored in a dark environment at 40°C with humidity not exceeding 30% for 30 days for stability analysis. The LOD of the kit for NAbs in human serum was 2 μg/mL (Figure 4D, Supplemental Figure 9), and the fitted curve was Y = 2701.6×2 - 4034.8 X + 1501.3 with R2 = 0.9766, which was the same LOD as determined by the previous test. The samples stored for different times (1 week, 2 weeks, 3 weeks, and 4 weeks) were detected, and the LOD under different conditions was 2 μg/mL (Supplemental Figure 10). No false-positive results were found during the test.
LFIA has the advantages of rapidity, simplicity, accuracy, stability, and portability.28–30 At present, Au-NPs are the most widely used qualitative labeling probe in the field of in vitro diagnostics and are used in disease detection, food safety monitoring, environmental monitoring, customs and other fields.31–34 The problem of reduced protein activity during labeling with Au-NPs was surmounted, and a kit was developed to conveniently, quickly and accurately detect NAbs in samples and analyze the regularity of NAb production after vaccination and infection. To improve the utilization efficiency of the complex, the reaction time was controlled by adjusting the concentration of the Au-NPs and the concentration of ACE2 and mouse IgG, and finally, the detection result was more accurate.
Analysis of NAb Production Before and After Vaccination
To verify the clinical application of this kit, we collected and tested a total of 684 samples from volunteers, including 311 preimmunization samples, 170 samples 21 days after the first vaccination, 182 samples 21 days after the second vaccination for verification, and 21 samples 6 months after the second vaccination; the sample information is presented in Supplemental Table 1. Fifty-eight preimmunization samples, 20 samples from 21 days after the first vaccination, and 84 samples from 21 days after the second vaccination were randomly selected for qualitative testing of NAb production by a commercial ELISA kit.57 The average inhibition rates of preimmunization samples and samples from 21 days after the first vaccination were 10.92% and 13.51% (Figure 5A, Supplemental Tables 1 and 2), respectively; this result indicates that these samples are negative for NAbs. The average inhibition rate of samples from 21 days after the second vaccination was 75.25% (Figure 5A and Supplemental Table 3), which indicates that all samples were positive for NAbs. Therefore, we speculate that samples collected preimmunization and after the first vaccination were negative for NAbs, and samples collected after the second vaccination were positive for NAbs. When testing 311 prevaccination samples, both the C line and T line of the SARS-CoV-2 NAb kit developed a purple color, indicating the absence of NAbs in the samples (Figure 5B, Supplemental Table 1 and Supplemental Figures 11–15) In the test of 170 samples from individuals inoculated with the first injection, both the T line and the C line developed color, and the Nabs in the subject’s body could still not eliminate the T line (Figure 5C, Supplemental Table 2, Supplemental Figures 16 and 17). In total, 182 serum samples from individuals after complete immunization were tested, and 174 only had C-line coloration, indicating that the vaccine induced the production of NAbs in vivo (Figure 5D, Supplemental Table 3 and Supplemental Figures 18–21); however, the level of NAbs generally decreased after 6 months (Figure 5E and Supplemental Figure 22). Among the 182 serum samples from individuals after complete immunization, the T-line was not eliminated in 8 cases. These samples were tested with ELISA kits and showed 4 cases with inhibition rates below 20% that were negative for anti-SARS-CoV-2 NAbs (Figure 5F and Supplemental Table 3). Therefore, among 182 individuals, 178 produced NAbs. According to these data (Table 1), the sensitivity of the colloidal gold kit was determined to be 97.80% (178/182), the specificity was considered 100% (311/311), the positive predictive value was 100% (174/174), and the negative predictive value was 98.73% (311/315). No NAbs were produced at the 3-week time point after the first vaccination, and NAbs were produced at the 3-week time point after the second vaccination, according to the above results. However, NAbs could not be detected 6 months after the second vaccination; therefore, to better combat the virus, booster immunization is needed for individuals. This result is consistent with the fact that many countries have already implemented vaccine booster policies.
 |
Table 1 Distribution of Detection Results Before and After Vaccination |
 |
Figure 5 Detection results of clinical samples by ELISA and NAb kit. (A) Results of some clinical samples detected by ELISA; (B) Results (n=3) before vaccination and (C) after vaccination with one dose (n=3), and (D) two doses (n=3) of vaccine day 21; (E) two doses of vaccine 6 months (n=3); (F) Verification of negative results by ELISA. Abbreviations: C, control line; T, test line; N, negative; P, positive. |
The samples collected before and after vaccination were from people 20–30 years old, and although this group has strong immunity, it cannot be ruled out whether other groups have a stronger ability to produce NAbs and maintain them for a longer time. During the analysis of clinical samples, there were four false-negative results. We learned in the follow-up consultation that two volunteers were prone to allergies, and two volunteers were obese, with a BMI >30 kg/m2. There are current reports that obesity may reduce the effectiveness of vaccination58 because obesity causes chronic, mild inflammation, so immune stimulation in obese people results in impaired normal T-cell responses and an altered immune response to vaccines.59 In addition, when using the same batch of test strips for detection, the color rendering effect is inconsistent. This may be related to the different components in different serum samples. Although the color rendering effect is different, it does not affect the qualitative judgment of the test results.
Here, 21 samples were collected 6 months after immunization, but the test results were negative, indicating that there were not enough NAbs, which is consistent with existing reports that the humoral response is substantially decreased 6 months after immunization.60 The serum collected in this study was the serum of volunteers after immunization with an attenuated vaccine strain, and the serum of individuals who received a DNA vaccine, an RNA vaccine, or an adenovirus vaccine is lacking. Therefore, the pattern found thus far may apply only to attenuated vaccines, and there may be differences if other types of vaccines are injected. Subsequent research will investigate a variety of vaccination programs, determine the effect of vaccination, monitor the duration of NAbs in the human body, and dynamically describe the level of NAbs produced in response to SARS-CoV-2 in the body to provide a theoretical basis for evaluating the efficacy and duration of NAbs. For serum sample testing and storage, we found that the test results of serum after a long storage time were different from those of fresh samples, even under −20°C conditions, so we completed all the tests within 1 week of collection.
Detection and Analysis of Postinfection Clinical Samples
A total of 356 samples were collected and analyzed by ELISA and the developed research kit, including samples from 188 males (32 negatives and 156 positives by ELISA; 3 positives by clinical decision) and 168 females (31 negatives and 137 positives by ELISA), with an average inhibition rate of 93.41% for positive males and 8.75% for negative males; the average inhibition rate of the female positive population was 93.47%, and the inhibition rate of the negative population was 9.06% (Figure 6A, Supplemental Table 4); in addition, 279 samples were found to be positive using our kit among the 293 samples that tested positive by ELISA (Figure 6B, Supplemental Table 4 and Supplemental Figures 23–33); 60 cases were found to be negative by this kit among the 63 samples that were determined to be negative by ELISA; these results suggest that the response to the virus is not sex- and age-dependent. According to Table 2, the sensitivity of the kit was determined to be 95.22% (279/293), the specificity was 95.24% (60/63), and the overall coincidence rate was 97.83% (339/356) (Supplemental Figure 34). We followed up with negative samples and revealed that 59 volunteers were infected with SARS-CoV-2 but did not produce NAbs, as determined by ELISA or this kit, which suggests that 16.57% (59/356) of people cannot produce NAbs after infection; notably, it is also possible that the infection did not occur recently. This finding is also consistent with the claim that differences in population immunity lead to some people not producing NAbs.61
 |
Table 2 Distribution of Detection Results for Actual Samples |
 |
Figure 6 Distribution of sample detection results by ELISA (A) and this research kit (B). |
The protective effect of vaccines against mutated viruses has been confirmed,62 and vaccination can effectively reduce the rate of severe disease and mortality. There were three samples from infected individuals for which the ELISA test result was negative, and the result determined by this research kit was positive, indicating that this kit can detect some false-negative samples that cannot be detected by ELISA. We found that an 18-year-old patient with autoimmune disease did not produce NAbs after infection, which may be due to the influence of immunity on the production of NAbs. In addition, this study can also support prevention and control measures for unknown outbreaks.
Conclusions
In this study, our results suggest that the proposed approach can expediently and reliably detect anti-SARS-CoV-2 NAbs after infection and is suitable for home self-checking and large-scale screening. The regular behavior of anti-SARS-CoV-2 NAb production was revealed after vaccination and infection according to analysis of 1040 clinical samples. Our results from the analysis of clinical samples provide valuable data to support the effective prevention and control of SARS-CoV-2.
Abbreviations
SARS-CoV-2, severe acute respiratory syndrome coronavirus 2; NAb, neutralizing antibody; ACE2, angiotensin-converting enzyme 2; RBD, receptor binding domain; Au-NPs, colloidal gold nanoparticles; LFIA, lateral-flow immunoassay; ELISA, enzyme-linked immunosorbent assay; CIAs, chromatographic immunoassays; Ab, antibody; mAb, monoclonal antibody; TEM, transmission electron microscope; DLS, dynamic light scattering; PDI, polymer dispersity index; ZP, zeta potential; IgG, immunoglobulin G; H1N1, hemagglutinin 1 neuraminidase 1; ANA, antinuclear antibody; RF, rheumatoid factor; K2CO3, potassium carbonate; PBS, phosphate-buffered saline; BSA, bovine serum albumin; RH, relative humidity.
Acknowledgments
Hi 5 cells were kindly provided by Yanqun Zhao (Henan University, Joint National Laboratory for Antibody Drug Engineering). We thank AJE for its linguistic assistance during the preparation of this manuscript.
Author Contributions
All authors made a significant contribution to the work reported, whether that is in the conception, study design, execution, acquisition of data, analysis and interpretation, or in all these areas; took part in drafting, revising or critically reviewing the article; gave final approval of the version to be published; have agreed on the journal to which the article has been submitted; and agree to be accountable for all aspects of the work.
Funding
This research was funded by the Science and Technology Department of Henan Province (grant number 222102310079, 222102310175 and 232300420051) and the Key Scientific Research Projects of Colleges and Universities in Henan Province (grant number 22A320001), Provinces and Ministries Jointly Build Key Projects of Henan Provincial Health Commission (grant number SBGJ202102194).
Disclosure
The authors declare that they have no competing interests in this work.
References
1. Coronaviridae study group of the international committee on taxonomy of viruses. The species severe acute respiratory syndrome-related coronavirus: classifying 2019-nCoV and naming it SARS-CoV-2. Nat Microbiol. 2020;5(4):536–544. doi:10.1038/s41564-020-0695-z
2. Gao Z, Xu Y, Sun C, et al. A systematic review of asymptomatic infections with COVID-19. Microbiol Immunol. 2021;54(1):12–16.
3. COVID-19 status report 2023; 2023. Available from: https://covid19.who.int/.
4. Chen C, Liang J, Hu H, et al. Research progress in methods for detecting neutralizing antibodies against SARS-CoV-2. Anal Biochem. 2023;673:115199. doi:10.1016/j.ab.2023.115199
5. Li H, Huang QZ, Zhang H, et al. The land-scape of immune response to monkeypox virus. eBioMedicine. 2023;87:104424. doi:10.1016/j.ebiom.2022.104424
6. Shen H, Chen X, Zeng L, et al. Magnetofluid-integrated multicolor immunochip for visual analysis of neutralizing antibodies to SARS-CoV-2 variants. Anal Chem. 2022;94(23):8458–8465. doi:10.1021/acs.analchem.2c01260
7. Cruz-Cardenas JA, Gutierrez M, López-Arredondo A, et al. A pseudovirus-based platform to measure neutralizing antibodies in Mexico using SARS-CoV-2 as proof-of-concept. Sci Rep. 2022;12(1):17966. doi:10.1038/s41598-022-22921-7
8. Lupitha SS, Darvin P, Chandrasekharan A, et al. A rapid bead-based assay for screening of SARS-CoV-2 neutralizing antibodies. Antib Ther. 2022;5(2):100–110. doi:10.1093/abt/tbac007
9. Zou J, Xia H, Shi P, et al. A single-round infection fluorescent SARS-CoV-2 neutralization test for COVID-19 serological testing at a biosafety level-2 laboratory. Viruses. 2022;14(6):1211. doi:10.3390/v14061211
10. Mousa ZS, Abdulamir AS. Application and validation of SARS-CoV-2 RBD neutralizing ELISA assay. Arch Razi Inst. 2022;77(1):391–402. doi:10.22092/ARI.2021.356677.1890
11. Zhu Z, Ma X, Zhu L, et al. Equipment-free, gold nanoparticle based semiquantitative assay of SARS-CoV-2-S1RBD IgG from fingertip blood: a practical strategy for on-site measurement of COVID-19 antibodies. Talanta. 2022;246:123498. doi:10.1016/j.talanta.2022.123498
12. Huang L, Li Y, Luo C, et al. Novel nanostructure-coupled biosensor platform for one-step high-throughput quantification of serum neutralizing antibody after COVID-19 vaccination. Biosens Bioelectron. 2022;199:113868. doi:10.1016/j.bios.2021.113868
13. Ye L, Xu X, Song S, et al. Rapid colloidal gold immunochromatographic assay for the detection of SARS-CoV-2 total antibodies after vaccination. J Mater Chem B. 2022;10(11):1786–1794. doi:10.1039/D1TB02521J
14. Yu H, Liu H, Yang Y, et al. Development and evaluation of a rapid neutralizing antibody assay for COVID-19 vaccination. ACS Omega. 2022;7(41):36254–36262. doi:10.1021/acsomega.2c03677
15. Mallory ML, Lindesmith LC, Baric RS. Vaccination-induced herd immunity: successes and challenges. J Allergy Clin Immunol. 2018;142(1):64–66. doi:10.1016/j.jaci.2018.05.007
16. Nie J, Li Q, Wu J, et al. Quantification of SARS-CoV-2 neutralizing antibody by a pseudotyped virus-based assay. Nat Protoc. 2020;15:3699–3715. doi:10.1038/s41596-020-0394-5
17. Mansourabadi AH, Sadeghalvad M, Mohammadi-Motlagh HR, et al. Serological and molecular tests for COVID-19: a recent update. Iran J Immunol. 2021;18:13–33. doi:10.22034/iji.2021.88660.1894
18. Habli Z, Saleh S, Zaraket H, et al. COVID-19 in-vitro diagnostics: state-of-The-art and challenges for rapid, scalable, and high-accuracy screening. Front Bioeng Biotechnol. 2021;8:605702. doi:10.3389/fbioe.2020.605702
19. Grenache DG, Ye C, Bradfute SB. Correlation of SARS-CoV-2 neutralizing antibodies to an automated chemiluminescent serological immunoassay. J Appl Lab Med. 2021;6:491–495. doi:10.1093/jalm/jfaa195
20. Eftekhari A, Alipour M, Chodari L, et al. A comprehensive review of detection methods for SARS-CoV-2. Microorganisms. 2021;9(2):232. doi:10.3390/microorganisms9020232
21. Lake DF, Roeder AJ, Kaleta E, et al. Development of a rapid point-of-care test that measures neutralizing antibodies to SARS-CoV-2. J Clin Virol. 2021;145:105024. doi:10.1016/j.jcv.2021.105024
22. Zhou Y, Wu Y, Ding L, et al. Point-of-care COVID-19 diagnostics powered by lateral flow assay. Trends Analyt Chem. 2021;145:116452. doi:10.1016/j.trac.2021.116452
23. Heggestad JT, Britton RJ, Kinnamon DS, et al. Rapid test to assess the escape of SARS-CoV-2 variants of concern. Sci Adv. 2021;7:7682. doi:10.1126/sciadv.abl7682
24. Rashidzadeh H, Danafar H, Rahimi H, et al. Nanotechnology against the novel coronavirus (severe acute respiratory syndrome coronavirus 2): diagnosis, treatment, therapy and future perspectives. Nanomedicine. 2021;16(6):497–516.
25. Deshpande GR, Sapkal GN, Tilekar BN, et al. Neutralizing antibody responses to SARS-CoV-2 in COVID-19 patients. Indian J Med Res. 2020;152:82–87. doi:10.4103/ijmr.IJMR_2382_20
26. Li Q, Liu Q, Huang W, et al. Current status on the development of pseudoviruses for enveloped viruses. Rev Med Virol. 2018;28:1963. doi:10.1002/rmv.1963
27. Nie J, Li Q, Wu J, et al. Establishment and validation of a pseudovirus neutralization assay for SARS-CoV-2. Emerg Microbes Infec. 2020;9:680–686. doi:10.1080/22221751.2020.1743767
28. Xiong HL, Wu YT, Cao JL, et al. Robust neutralization assay based on SARS-CoV-2 S-protein-bearing vesicular stomatitis virus (VSV) pseudovirus and ACE2-overexpressing BHK21 cells. Emerg Microbes Infec. 2020;9:2105–2113. doi:10.1080/22221751.2020.1815589
29. Chen H, Chen X, Chen Y, et al. High-fidelity imaging of intracellular microRNA via a bioorthogonal nanoprobe. Analyst. 2023;148(8):1682–1693. doi:10.1039/D3AN00088E
30. Wang L, Wu M, Ma J, et al. Development of a point-of-care test based on selenium nanoparticles for heart-type fatty acid-binding proteins in human plasma and blood. Int J Nanomed. 2022;17:1273–1284. doi:10.2147/IJN.S359541
31. Wang C, Liu M, Wang Z, et al. Point-of-care diagnostics for infectious diseases: from methods to devices. Nano Today. 2021;37:101092. doi:10.1016/j.nantod.2021.101092
32. Wang Z, Zhou Q, Guo Y, et al. Rapid detection of ractopamine and salbutamol in swine urine by immunochromatography based on selenium nanoparticles. Int J Nanomed. 2021;16:2059–2070. doi:10.2147/IJN.S292648
33. Pohanka M. Current biomedical and diagnostic applications of gold micro and nanoparticles. Mini Rev Med Chem. 2021;21(9):1085–1095. doi:10.2174/1389557520666200730155616
34. Tan G, Zhao Y, Wang M, et al. Ultrasensitive quantitation of imidacloprid in vegetables by colloidal gold and time-resolved fluorescent nanobead traced lateral flow immunoassays. Food Chem. 2020;311:126055. doi:10.1016/j.foodchem.2019.126055
35. Bian L, Li Z, He A, et al. Ultrabright nanoparticle-labeled lateral flow immunoassay for detection of anti-SARS-CoV-2 neutralizing antibodies in human serum. Biomaterials. 2022;09(288):121694. doi:10.1016/j.biomaterials.2022.121694
36. Jia J, Ao L, Luo Y, et al. Quantum dots assembly enhanced and dual-antigen sandwich structured lateral flow immunoassay of SARS-CoV-2 antibody with simultaneously high sensitivity and specificity. Biosens Bioelectron. 2022;198:113810. doi:10.1016/j.bios.2021.113810
37. Li X, Yin Y, Pang L, et al. Colloidal gold immunochromatographic assay (GICA) is an effective screening method for identifying detectable anti-SARS-CoV-2 neutralizing antibodies. Int J Infect Dis. 2021;108:483–486. doi:10.1016/j.ijid.2021.05.080
38. Tan CW, Chia WN, Qin X, et al. A SARS-CoV-2 surrogate virus neutralization test based on antibody-mediated blockage of ACE2-spike protein-protein interaction. Nat Biotechnol. 2020;38(9):1073–1078. doi:10.1038/s41587-020-0631-z
39. Li X, Liu Y, Liu H. Express Arabidopsis cryptochrome in Sf9 insect cells using the baculovirus expression system. Methods Mol Biol. 2021;2297:155–160.
40. Wang Z, Zheng Z, Hu H, et al. A point-of-care selenium nanoparticle-based test for the combined detection of anti-SARS-CoV-2 IgM and IgG in human serum and blood. Lab Chip. 2020;20:4255–4261. doi:10.1039/D0LC00828A
41. Liu B, Wang L, Tong B, et al. Development and comparison of immunochromatographic strips with three nanomaterial labels: colloidal gold, nanogold-polyaniline-nanogold microspheres (GPGs) and colloidal carbon for visual detection of salbutamol. Biosens Bioelectron. 2016;85:337–342. doi:10.1016/j.bios.2016.05.032
42. Chen C, Hu H, Li X, et al. Rapid detection of anti-SARS-CoV-2 antibody using a selenium nanoparticle-based lateral flow immunoassay. IEEE T Nanobiosci. 2022;21:37–43. doi:10.1109/TNB.2021.3105662
43. Jing H, Li X, Xu L, et al. Development of a colloidal gold immunochromatographic strip for the rapid detection of channel catfish virus. J AOAC Int. 2021;104(5):1350–1354. doi:10.1093/jaoacint/qsaa152
44. Wang Z, Zhi D, Zhao Y, et al. Lateral flow test-strip based on colloidal selenium immunoassay for rapid detection of melamine in milk, milk powder and animal feed. Int J Nanomed. 2014;9(1):1699–1707. doi:10.2147/IJN.S58942
45. Zhang Y, Chen Y, He Y, et al. Development of receptor binding domain-based double-antigen sandwich lateral flow immunoassay for the detection and evaluation of SARS-CoV-2 neutralizing antibody in clinical sera samples compared with the conventional virus neutralization test. Talanta. 2023;255:124200. doi:10.1016/j.talanta.2022.124200
46. Li Z, Yi Y, Lou X, et al. Development and clinical application of a rapid IgM-IgG combined antibody test for SARS-CoV-2 infection diagnosis. J Med Virol. 2020;92(9):1518–1524. doi:10.1002/jmv.25727
47. Hoffmann M, Kleine-Weber H, Schroeder S, et al. SARS-CoV-2 cell entry depends on ACE2 and TMPRSS2 and is blocked by a clinically proven protease inhibitor. Cell. 2020;181(2):271–280. doi:10.1016/j.cell.2020.02.052
48. Wrapp D, Wang N, Corbett K, et al. Cryo-EM structure of the 2019-nCoV spike in the prefusion conformation. Science. 2020;367(6483):1260–1263. doi:10.1126/science.abb2507
49. Beyerstedt S, Casaro EB, Rangel EB. COVID-19: angiotensin-converting enzyme 2 (ACE2) expression and tissue susceptibility to SARS-CoV-2 infection. Eur J Clin Microbiol Infect Dis. 2021;40(5):905–919. doi:10.1007/s10096-020-04138-6
50. Baum A, Fulton BO, Wloga E, et al. Antibody cocktail to SARS-CoV-2 spike protein prevents rapid mutational escape seen with individual antibodies. Science. 2020;369(6506):1014–1018. doi:10.1126/science.abd0831
51. Jackson LA, Anderson EJ, Rouphael NG, et al. An mRNA vaccine against SARS-CoV-2 - preliminary report. N Engl J Med. 2020;383(20):1920–1931. doi:10.1056/NEJMoa2022483
52. Dagotto G, Yu J, Barouch DH. Approaches and challenges in SARS-CoV-2 vaccine development. Cell Host Microbe. 2020;28(3):364–370. doi:10.1016/j.chom.2020.08.002
53. Krammer F. SARS-CoV-2 vaccines in development. Nature. 2020;586(7830):516–527. doi:10.1038/s41586-020-2798-3
54. Li J, Liu B, Tang X, et al. Development of a smartphone-based quantum dot lateral flow immunoassay strip for ultrasensitive detection of anti-SARS-CoV-2 IgG and neutralizing antibodies. Int J Infect Dis. 2022;121:58–65. doi:10.1016/j.ijid.2022.04.042
55. Wang L, Zhao P, Si X, et al. Rapid and specific detection of Listeria monocytogenes with an isothermal amplification and lateral flow strip combined method that eliminates false-positive signals from primer-dimers. Front Microbiol. 2020;10:2959. doi:10.3389/fmicb.2019.02959
56. Choi JR, Hu J, Feng S, et al. Sensitive biomolecule detection in lateral flow assay with a portable temperature-humidity control device. Biosens Bioelectron. 2016;79:98–107. doi:10.1016/j.bios.2015.12.005
57. Wang L, Mi S, Madera R, et al. A neutralizing monoclonal antibody-based competitive ELISA for classical swine fever C-strain post-vaccination monitoring. BMC Vet Res. 2020;16(1):14. doi:10.1186/s12917-020-2237-6
58. Painter SD, Ovsyannikova IG, Poland GA. The weight of obesity on the human immune response to vaccination. Vaccine. 2015;33(36):4422–4429. doi:10.1016/j.vaccine.2015.06.101
59. Nasr MC, Geerling E, Pinto AK. Impact of obesity on vaccination to SARS-CoV-2. Front Endocrinol. 2022;13:898810. doi:10.3389/fendo.2022.898810
60. Levin EG, Lustig Y, Cohen C, et al. Waning immune humoral response to BNT162b2 COVID-19 vaccine over 6 months. NEJM. 2021;385(24):84. doi:10.1056/NEJMoa2114583
61. Tong H, Cao C, You M, et al. Artificial intelligence-assisted colorimetric lateral flow immunoassay for sensitive and quantitative detection of COVID-19 neutralizing antibody. Biosens Bioelectron. 2022;213:114449. doi:10.1016/j.bios.2022.114449
62. Oh SJ, Kim JM, Choi YJ, et al. Neutralizing antibody responses in vaccinated and unvaccinated individuals infected with Omicron BA.1. J Clin Virol. 2022;155:105253. doi:10.1016/j.jcv.2022.105253
 © 2023 The Author(s). This work is published and licensed by Dove Medical Press Limited. The
full terms of this license are available at https://www.dovepress.com/terms
and incorporate the Creative Commons Attribution
- Non Commercial (unported, 3.0) License.
By accessing the work you hereby accept the Terms. Non-commercial uses of the work are permitted
without any further permission from Dove Medical Press Limited, provided the work is properly
attributed. For permission for commercial use of this work, please see paragraphs 4.2 and 5 of our Terms.
© 2023 The Author(s). This work is published and licensed by Dove Medical Press Limited. The
full terms of this license are available at https://www.dovepress.com/terms
and incorporate the Creative Commons Attribution
- Non Commercial (unported, 3.0) License.
By accessing the work you hereby accept the Terms. Non-commercial uses of the work are permitted
without any further permission from Dove Medical Press Limited, provided the work is properly
attributed. For permission for commercial use of this work, please see paragraphs 4.2 and 5 of our Terms.