Back to Journals » OncoTargets and Therapy » Volume 14
Development and Validation of an Autophagy-Stroma-Based Microenvironment Gene Signature for Risk Stratification in Colorectal Cancer
Authors Chen L ![]() , Zhang K, Sun J
, Zhang K, Sun J ![]() , Tang J, Zhou J
, Tang J, Zhou J ![]()
Received 20 March 2021
Accepted for publication 10 May 2021
Published 31 May 2021 Volume 2021:14 Pages 3503—3515
DOI https://doi.org/10.2147/OTT.S312003
Checked for plagiarism Yes
Review by Single anonymous peer review
Peer reviewer comments 3
Editor who approved publication: Dr William C. Cho
Lin Chen,* Kunzi Zhang,* Jian Sun, Jingtong Tang, Jianping Zhou
Department of gastrointestinal surgery of the First Hospital of China Medical University, Shenyang, 110001, People’s Republic of China
*These authors contributed equally to this work
Correspondence: Jianping Zhou Tel +8613840509519
Email [email protected]
Background: Colorectal cancer is the fourth most common cancer and the second leading cause of cancer-related death in the USA. The aim of this study was to establish a tumor gene signature based on tumor stromal cell and autophagy for predicting the risk of recurrence in patients with colorectal cancer.
Methods: We used “Rtsne” and “xCell” R packages to estimate autophagy and stroma status, respectively. The discovery cohort used microarray gene expression data retrieved from the GSE39582 dataset. The Cox regression model and Least Absolute Shrinkage and Selection Operator (LASSO) were used to identify prognostic genes and to construct an autophagy-stroma-based gene signature. Moreover, external validation was conducted using GSE17538, GSE38832, TCGA database, and patient data obtained from the First Hospital of China Medical University (CMU).
Results: The LASSO model identified three genes (TNS1, TAGLN, and SFRP4) which were used to develop a risk stratification gene signature. The autophagy-stroma-based gene signature was identified as an independent prognostic factor by multivariate analysis (p = 0.0023). The results were validated in GSE17538 (p=0.0062), GSE38832 (p=0.028), TCGA (p=0.046) database, and patient data obtained from the First Hospital of China Medical University (CMU) (p=0.027).
Conclusion: We have established and verified a feasible prognostic model of colorectal cancer based on autophagy and stromal cell characteristics of patients. The model can be used to evaluate recurrence risk of cancer patients, and the hub genes in the model provide potential targets for targeted colorectal cancer treatment.
Keywords: autophagy, stroma, tumor microenvironment, colorectal cancer, TNS1, TAGLN, SFRP4
Background
Colorectal cancer (CRC) is the fourth most common cancer (8.2% of all new cancer cases) and the second leading cause of cancer-related death (8.8% of all cancer deaths) in the USA.1 However, its incidence varies widely from region to region. CRC can be regarded as a sign of socio-economic development because its incidence rate tends to rise consistently with increase of the human development index.2 Therefore, it is foreseeable that its incidence will increase significantly with further development of the global economic situation. It is worth noting that the 5-year relative survival rate for colorectal cancer patients is 65%. A previous study reported that the incidence rate of patients diagnosed with stage I or stage II CRC accounted for 20% and 22%, respectively, and the 5-year relative survival rates were 91% and 82%, respectively. However, the 5-year survival rate for stage IV CRC decreases to 12%.3 In recent years, the tumor microenvironment has become increasingly important to researchers. Studies have shown that the tumor microenvironment of CRC is a key factor affecting the prognosis of colorectal cancer,4,5 and holds keys to future cancer therapy.6 Generally, colorectal tumors are rich in stroma.7 Previous studies have reported that stromal cells are differentially expressed in CRC tissues and adjacent tissues,8 and affect the occurrence of colorectal cancer.9 Notably, stromal cells affect the prognosis of CRC patients by affecting the tumor microenvironment.10 On the other hand, the role of autophagy in tumors is controversial. Some researchers believe that autophagy can promote the occurrence and development of colorectal cancer.11–13 However, a recent study by Nassour et al14 reported that autophagy has an inhibitory effect on cancer. For example, one study has shown that autophagy can inhibit the occurrence and development of colorectal cancer.15 Interestingly, accumulating evidence indicates that there is a direct or indirect interaction between stromal cells and autophagy in the tumor microenvironment.16,17 In this study, we speculate that the interaction between autophagy and stromal cells can provide prognostic value for patients with colorectal cancer. Therefore, we combined the status of autophagy and stromal cell into the existing clinicopathological characteristics and staging system through a series of systematic analysis, and developed a new prognostic model aimed at improving the prognosis of colorectal cancer.
Methods
Patient Cohort
The discovery cohort, containing 574 CRC patients, used microarray gene expression data retrieved from the NCBI Gene Expression Omnibus (GSE39582). We then conducted external validations using four independent cohorts, which included 200 patients from the GSE17538 dataset, 92 patients from the GSE38832 dataset, 179 patients from the TCGA database, and 82 colorectal cancer patients from the First Affiliated Hospital of China Medical University (CMU). The 82 CRC patients from the hospital signed informed consent before the study begun and the procedure was approved by the Ethics Committee of The First Affiliated Hospital of China Medical University. Committee approval number: AF-SOP-07-1.1–01
Identification of Autophagy Status and Autophagy-Related DEGs
We used Rtsne18 R package to randomly simulate the autophagy state. T-SNE utilizes an unsupervised, non-parametric approach to divide patients into several different groups based on given characteristics. We downloaded autophagy marker gene set from the molecular signature database (MSigDB19,20 version7.1), which included 152 genes. Two groups of autophagy states were determined depending on the clustering results, including the “autophagytype1” group and the “autophagytype2” group. In addition, we analyzed the expression changes of target genes involved in autophagy signaling pathway between the “autophagytype1” group and the “autophagytype2” group to investigate their association with autophagy. These targets were downloaded from the molecular signature database (MSigDB19,20 version7.1), including 120 genes associated with “positive regulation of autophagy” and 84 genes associated with “negative regulation of autophagy”. We then used the limma21 algorithm to determine differentially expressed genes (DEGs) between two groups.20 Genes with a false discovery rate (FDR)-corrected p-value (q-value) of < 0.0001 and an absolute log2 fold change (log FC) ≥ 1.5 were considered as autophagy-related genes.
Identification of Stroma Status and Stroma-Related DEGs
xCell22 is a tool that performs cell type enrichment analysis from gene expression data for 64 immune and stromal cell types. In this study, we calculated the stromal cell score using “xCell” R package, and divided patients into two groups according to the stromal cell score. Moreover, we examined and compared the prognosis of both groups. Patients with high stromal cell score were classified into the “stromahigh” group based on the median, while those with low stromal cell scores were considered to be in the “stromalow” group. Next, we identified DEGs between the low and high stroma groups using limma algorithm. Genes with a false discovery rate (FDR)-corrected p-value (q-value) of < 0.0001 and an absolute log2 fold change (log FC) ≥ 1.5 were considered as stroma-related genes.
Identification of Autophagy-Stroma-Related Prognostic DEGs
The above autophagy and stromal states were further composed into a two-dimensional index, and the patients were segmented into three groups, namely autophagytype1/stromalow, autophagytype2/stromahigh, and the mixed group. Autophagy-stroma related DEGs (|log2 FC|>1.5, FDR correction p<0.0001) were obtained by comparing the expression of autophagytype1/stromalow and autophagytype2/stromahigh group. Next, the protective gene set and risk gene set were identified by overlapping the autophagy-stroma-related genes and autophagy/stroma associated genes. Finally, univariate Cox regression analysis was performed for all protective and risk genes in order to obtain prognostic indicators associated with autophagy and stroma. P <0.05 was considered to be statistically significant.
Derivation of Autophagy-Stroma-Based Gene Classifier and Prognosis Classifier
A popular penalization method is the Least Absolute Shrinkage and Selection Operator (LASSO),23,24 which can avoid overfitting and retain valuable variables. LASSO has been extended and is used in Cox regression survival analysis and is ideal for high-dimensional data. In our study, we screened the most prognostic gene marker using the LASSO-Cox regression model of glmnet25 R package from identified prognostic factors associated with autophagy and stroma in the discovery cohort. To reduce the potential instability of the results, three cross-validation tests and 1000 iterations were performed. Notably, the best tuning parameter is determined using the 1-SE (standard error) rule. Afterwards, we built a prognostic signature on an individual-level predictive score based on selected risk gene characteristics. The risk score for an individual was the sum of the product of the expression level of the risk marker gene and the coefficient obtained by the LASSO model, that is, the risk score =∑ (coefficient × expression of the characteristic gene). Based on the risk score at the individual-level, an optimal critical value was determined using the maximum selectable rank statistics method26 in order to develop a prognostic classifier for colorectal cancer patients.
Pan-Cancer Data
ENCORI27 was used to analyze gene expression RNAseq dataset of pan-cancer data in TCGA.
Statistical Analysis
Statistical analyses were conducted using R version 3.6.3 (http://www.R-project.org). R package “Rtsne” was used to implement the t-SNE algorithm based on nonlinear dimensionality reduction. Moreover, the “xCell” R package was used to score tumor microenvironment stromal cells, while the “glmnet” R package was used for LASSO-Cox regression modeling. The datum was analyzed using appropriate standard statistical tests and the FDR method was used to adjust for several trials. Finally, we performed a multiple Cox regression analysis to adjust for covariates in order to determine independent survival risk factors.
Results
Autophagy Status and Autophagy-Related DEGs in CRC
The discovery cohort was composed of 574 colorectal cancer patients, and their relapse free survival (RFS) data was retrieved from the GSE39582 data set. Table 1 shows the clinicopathological characteristics of the patients. Tumor staging: 6.4% in stage I, 46.4% in stage II, 35.8% in stage III, and 10.4% in stage IV. We used the expression matrix of 152 hypoxia marker genes in MSigDB version 7.1 to calculate the Euclidean distance between any two patients in the cohort, and used the non-linear dimensionality reduction algorithm t-SNE to compress it into a two-dimensional point. Results identified three patient groups and all patients are each assigned to their closest group (Figure 1A). The patients were classified into three groups: cluster 1(172), cluster 2(189), and cluster(213). Results indicated that there were statistically significant differences in survival rate between these three groups (log rank test, p<0.001). Patients in the first group had the best relapse free survival rate. However, patients in group 2 had the worst prognosis (Figures 1C and D). We further investigated the changes in the expression of genes that regulate autophagy in the two groups of patients. Two gene sets were used, including genes that positively regulate autophagy (120 genes) and genes that negatively regulate autophagy (84 genes). Among the 120 genes associated with “positive regulation of autophagy”, 44 (36.67%) were highly expressed in autophagytype2 group, and 33 (27.5%) were highly expressed in autophagytype1 group. Moreover, 30 (35.71%) of the 84 genes associated with “negative regulation of autophagy” were overexpressed in the autophagytype2 group, and 14 (16.67%) were overexpressed in the autophagytype1 group. The results above suggest that the identified group has a significant correlation with autophagy status. To obtain autophagy-related DEGs, we compared the expression profile of autophagytype1 group and autophagytype2 group. Our results identified a total of 39 DEGs (Table S1) associated with autophagy (Figure 1B). Among them, 26 (67.7%) were overexpressed in the autophagytype2 group, and the survival rate of patients in the group was comparatively poor. We speculate that these genes are risk factors associated with autophagy. In the autophagytype1 group, 13 DEGs were highly expressed, and the prognosis of patients was good, indicating that these genes are protective components associated with autophagy. In general, most of the DEGs associated with autophagy are considered to be risk factors.
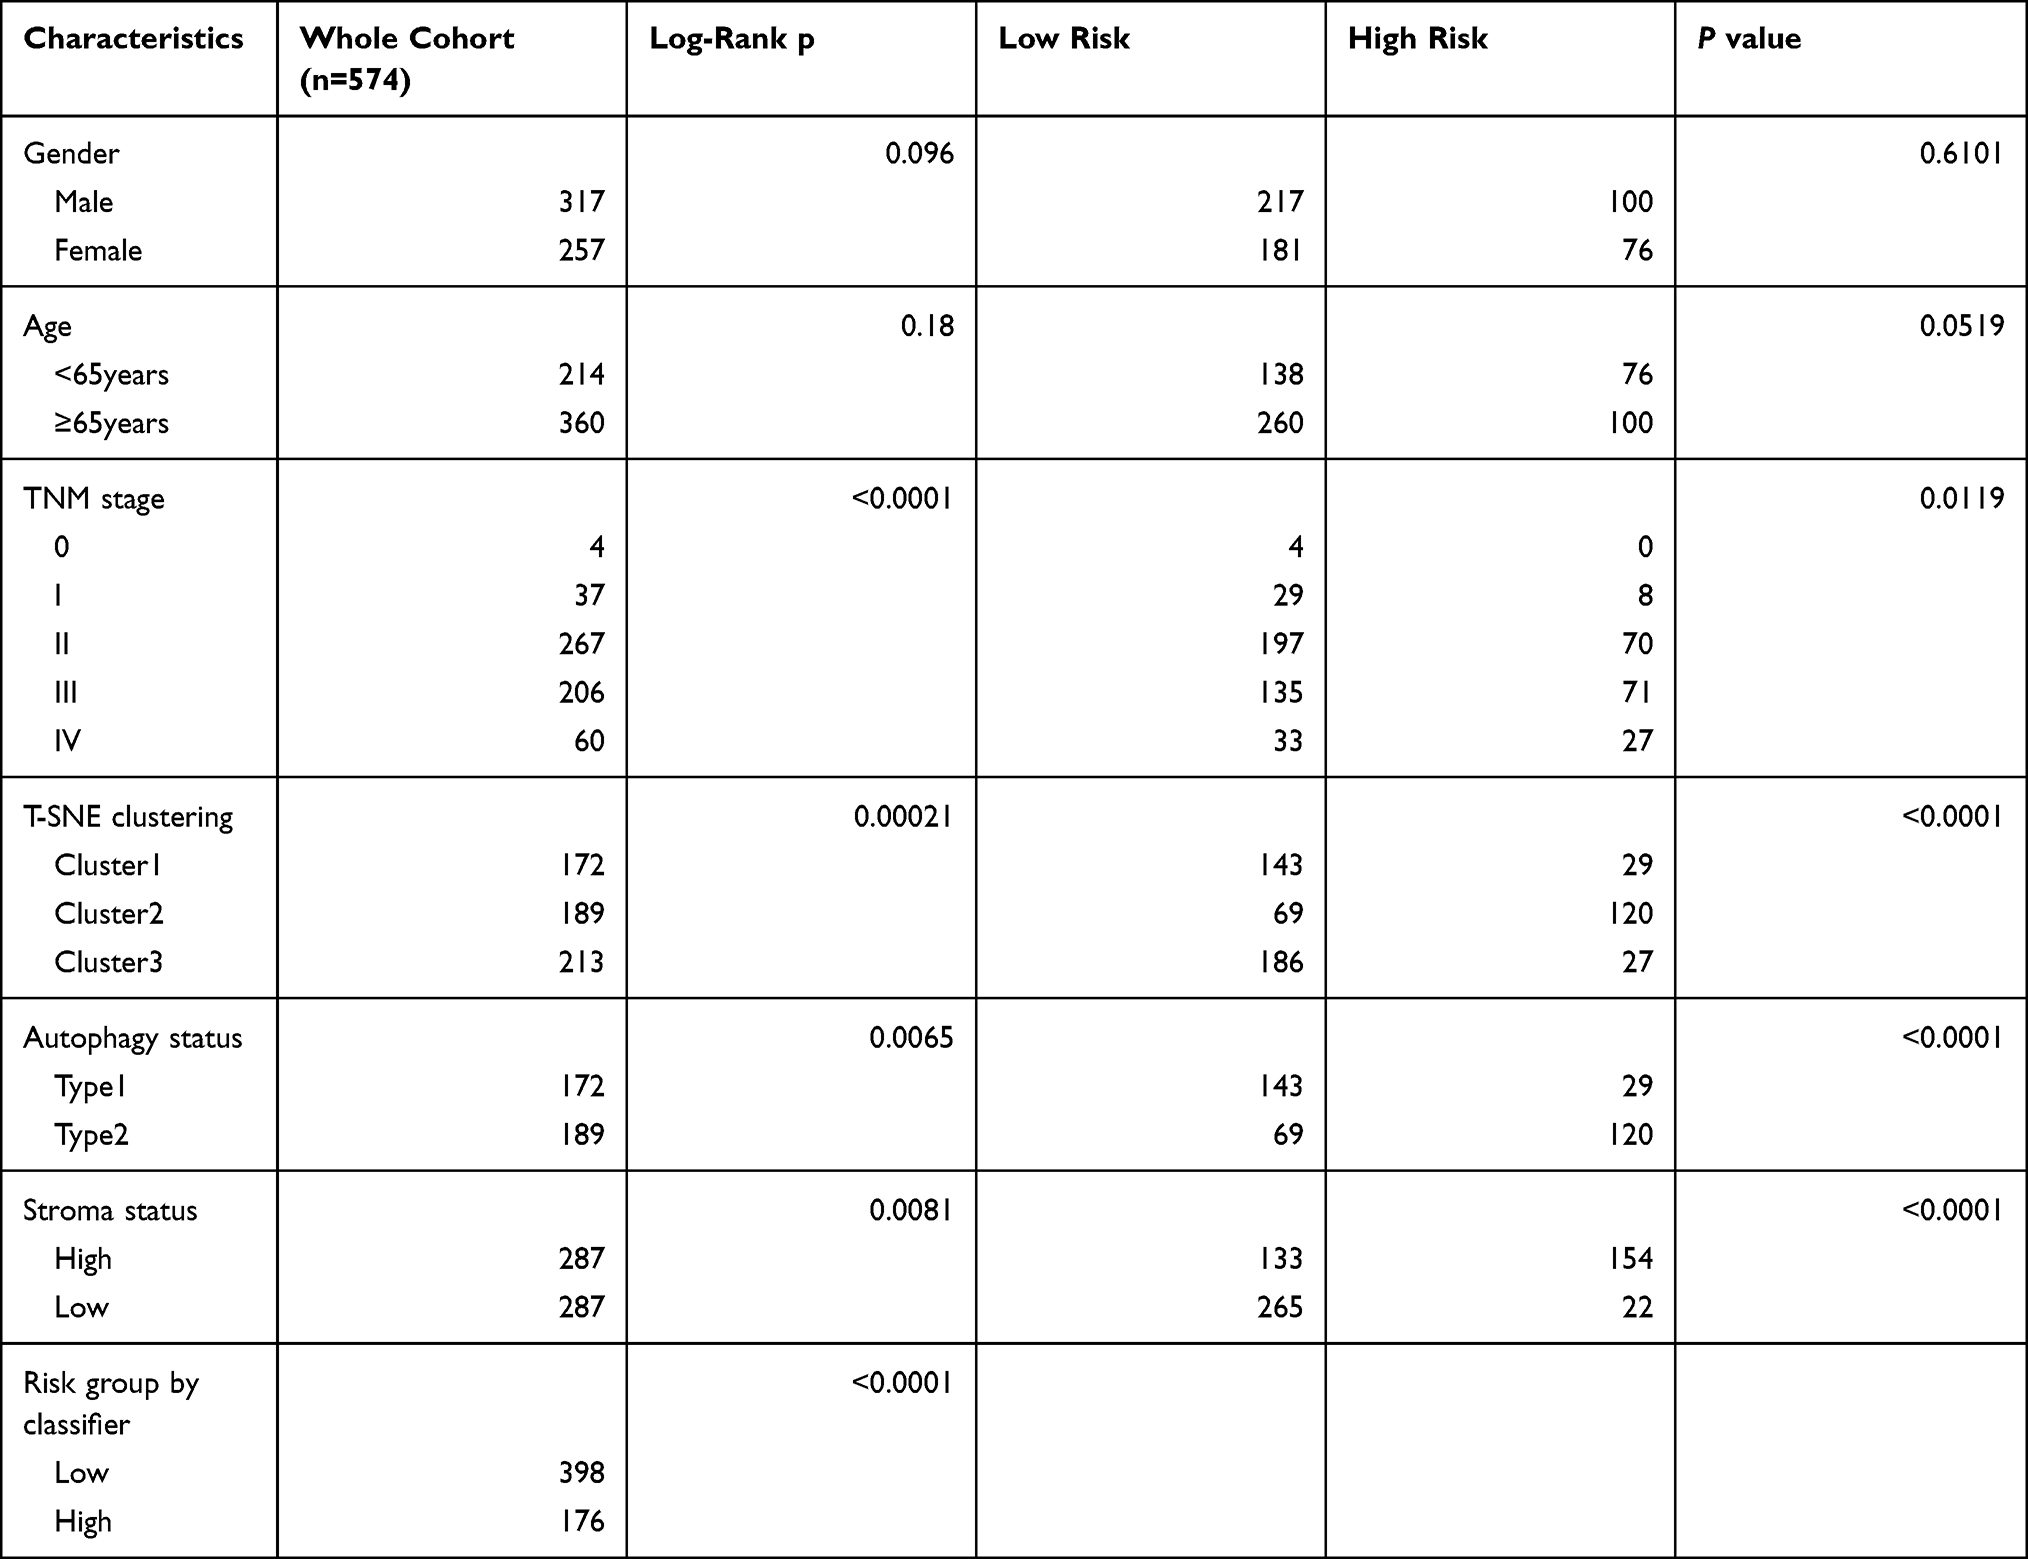 |
Table 1 Baseline Characteristics of Patients in the Discovery Cohort |
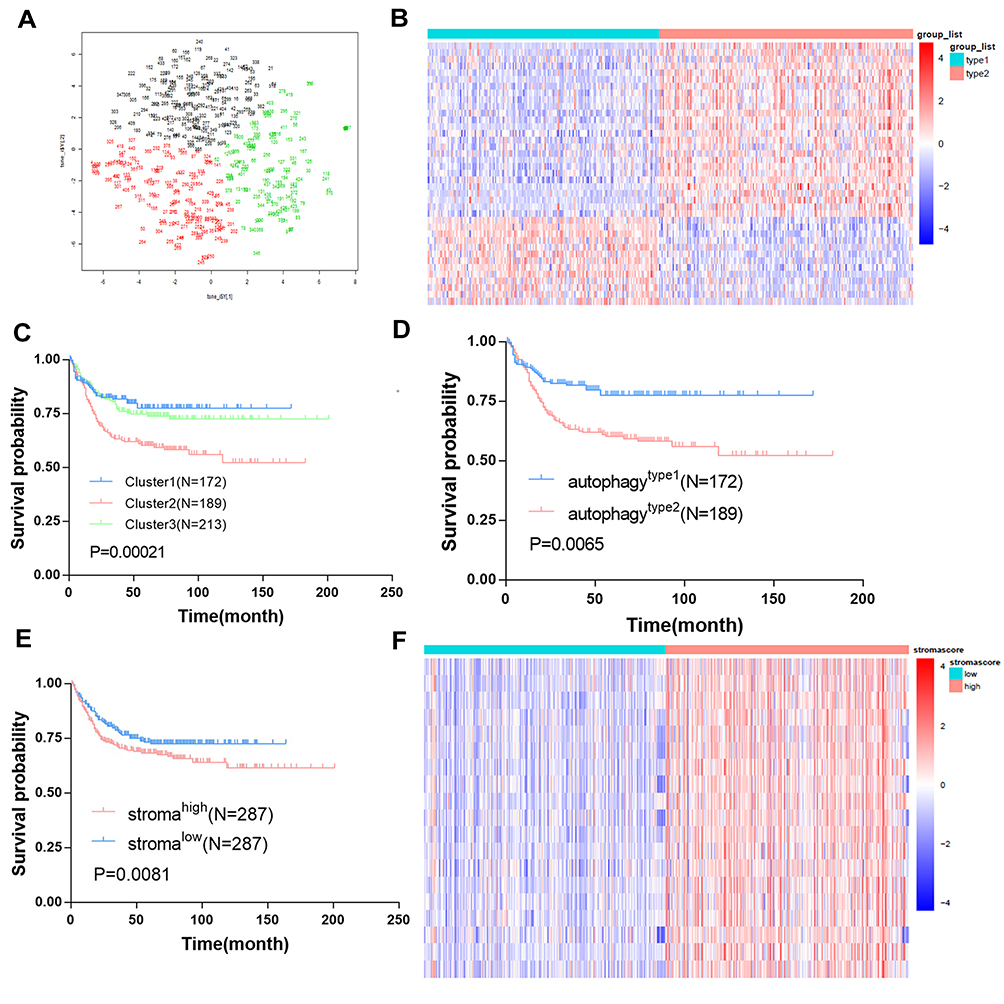 |
Figure 1 Identification of autophagy and stroma status and autophagy-stroma-related DEGs. (A) Dot plot for three distinct clusters identified by t-SNE algorithm based on 152 autophagy hallmark genes. (B) Heatmap showing expression profiles for autophagy-related DEGs with comparison between type1 and type2 groups. (C) Kaplan–Meier plot of overall survival for patients in three clusters. (D) Kaplan–Meier plot of overall survival for patients in type1 and type2 clusters. (E) Kaplan–Meier plot of overall survival for patients in high-stroma and low-stroma groups. (F) Heatmap showing expression profiles for stroma-related DEGs with comparison between high-stroma and low-stroma groups. |
Stroma Status and Stroma-Related DEGs in CRC
We classified the 574 patients according to the condition of stromal cells in tumor tissues and used the “xCell” R package to calculate stromal cell score. We then divided the patients into two groups (the high stromal cell score group and the low stromal cell score group) based on the median of the stromal cell score. Results showed that the prognosis of patients in the stromalow group was better than that in the stromahigh group (Figure 1E). In addition, we compared the stromalow group and stromahigh group in order to determine stroma-related DEGs. In total, 19 stroma-related DEGs (Table S2) were screened (Figure 1F), and all the 19 genes were over-expressed in the stromahigh group. Moreover, the patients in the group had relatively poor survival rates. Therefore, we speculate that these DEGs are immune-related dangerous DEGs. In general, most of the DEGs associated with high-stroma cells are considered risk factors.
Autophagy-Stroma-Related Prognostic DEGs in CRC
We further combined the above autophagy and stroma status into a two-dimensional index, and divided the patients into three groups: autophagytype1/stromalow group, autophagytype2/stromahigh group, and the mixed group. Survival analysis showed that there were significant differences among the three groups of patients, where autophagytype1/stromalow group had the best prognosis, while the autophagytype2/stromahigh group had the worst survival rate (Figure 2A). We further compared the expression profiles of autophagytype1/stromalow and autophagytype2/stromahigh groups in order to obtain autophagy-stroma related DEGs. In total, 140 autophagy-stroma related DEGs (Table S3) were identified, of which 25 were overexpressed in the autophagytype1/stromalow group. Patients in the group had better survival rates and were defined as autophagy-stroma related protective DEGs. On the other hand, 115 DEGs were overexpressed in autophagytype2/stromahigh with poor patient prognosis, and thus they were defined as risk DEGs. In addition, we performed Gene Set Enrichment Analysis (GSEA) on the differential genes (Figure 2B), and the results showed that the autophagytype2/stromahigh group was highly activated in the EMT pathway and inhibited a subgroup of genes regulated by MYC, genes encoding cell cycle related targets of E2F transcription factors, and oxidative phosphorylation pathway. We also overlapped the autophagy (or stroma) related DEGs and the autophagy-stroma related DEGs obtained above to establish a risk gene set (the protective gene set did not have genes that met the requirements). Finally, a total of nine risk genes were identified (Figure 2C). Furthermore, we performed univariate Cox regression analysis on all key risk genes. Among the nine risk factors, six genes had a significant effect on the prognosis of patients.
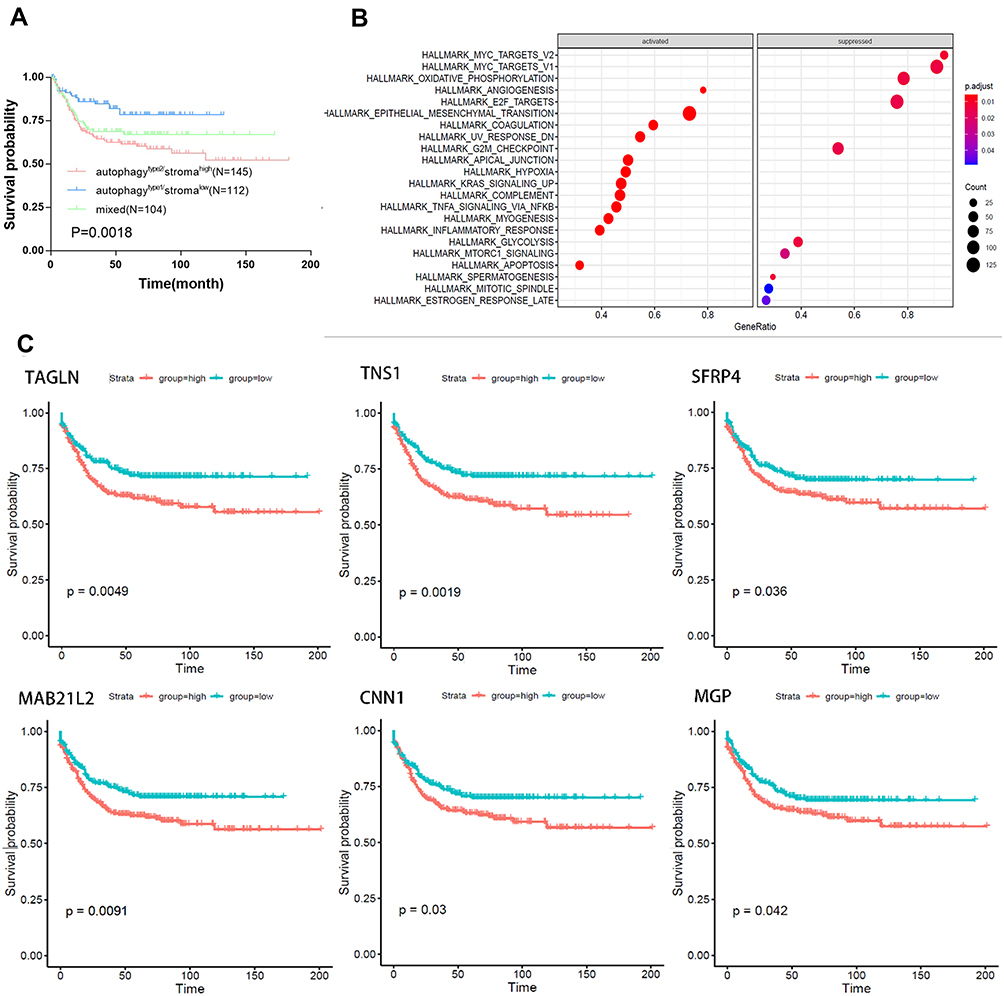 |
Figure 2 Identification and biological function of autophagy-stroma-related protective and risk DEGs. (A) Kaplan–Meier plot of overall survival for patients in three groups by combining the autophagy and stroma status. (B) Representative Gene Ontology terms enriched by the autophagy-stroma-related protective and risk DEGs. P-values were adjusted by false discovery rate. (C) Prognostic values of 6 hub genes in Colorectal cancer. Kaplan–Meier analyses were performed based on the median levels of hub genes. |
Autophagy-Stroma-Based Gene Classifier and Prognosis Classifier in CRC
We used the LASSO-Cox regression model to determine the most ideal prognostic gene markers from nine autophagy-stroma-related prognostic DEGs that were obtained above (Figures 3A and B). Results indicated that the optimal gene signature was composed of three genes (TAGLN, TNS1, and SFRP4) and the corresponding coefficients were calculated. It is worth noting that the three characteristic genes are all risk genes. The risk score of each CRC patient was calculated as follows: Risk Score=0.01942066×TAGLN expression + 0.007341004×TNS1 expression + 0.03543974×SFRP4 expression. The risk curve and characteristic DEGs expression pattern, based on the risk score of these three genes, are shown in Figure 3D. Comparison of the survival rate showed that the prognosis of patients in the high-risk group was significantly worse than that in the low-risk group (Log rank test P<0.001) (Figure 3C)
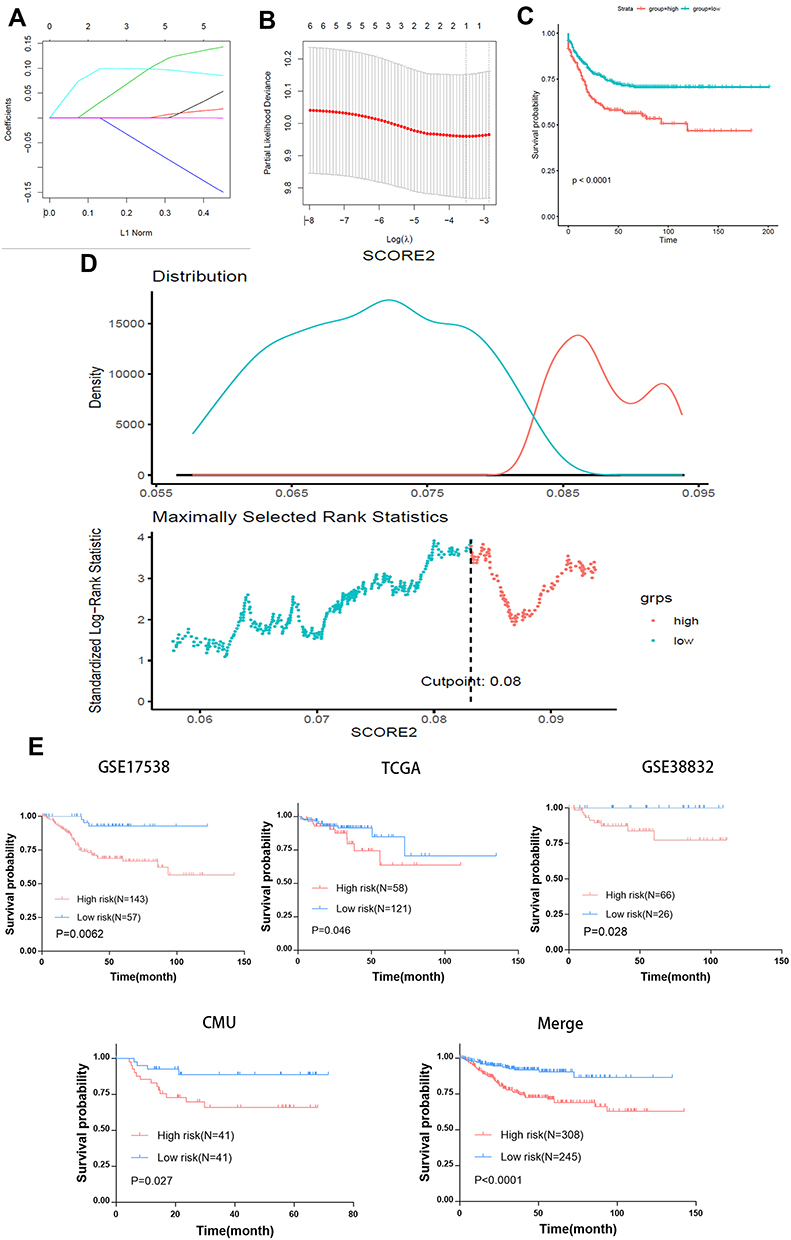 |
Figure 3 Autophagy-stroma-based prognosis classifier. (A) LASSO coefficient profiles of the autophagy-stroma-related prognostic DEGs. (B) Three-fold cross-validation for tuning parameter selection in the LASSO model. The partial likelihood deviance is plotted against log (λ), where λ is the tuning parameter. Partial likelihood deviance values are shown, with error bars representing SE. The dotted vertical lines are drawn at the optimal values by minimum criteria and 1-SE criteria. (C) Survival analysis of high-risk group and low-risk group in the training set. (D) Plot depicting the calibration of the nomogram in terms of the agreement between predicted and observed outcomes. Nomogram performance is shown by the plot relative to the dotted line, which represents perfect prediction. (E) Validation of the model in different data sets. |
Autophagy-Stroma-Based Prognosis Signature and Clinicopathologic Characteristics in CRC
Table 1 shows patients’ clinicopathological characteristics in the low-risk group and the group of high risk. Results showed that the gender and age of the two groups were comparable. The group of high risk had more patients with advanced tumors, while the group of low risk had more patients with early tumors (p=0.0119, chi-square test). Moreover, the high-risk group tended to have type 2 autophagy status (p<0.001, χ2 test) and patients with high-stroma status (p<0.001, χ2 test,), which is consistent with results described above. Univariate analysis in the cohort showed that autophagy and stromal cell status, and prognostic classification were important factors related to survival (p=0.0065, p=0.0081, and p<0.0001, respectively, Log rank test). On the other hand, prognostic classification was identified as an independent prognostic factor by multivariate analysis, independent of tumor stage (Table 2). This suggests the role of stroma cells and autophagy in the prognostic stratification of colorectal cancer.
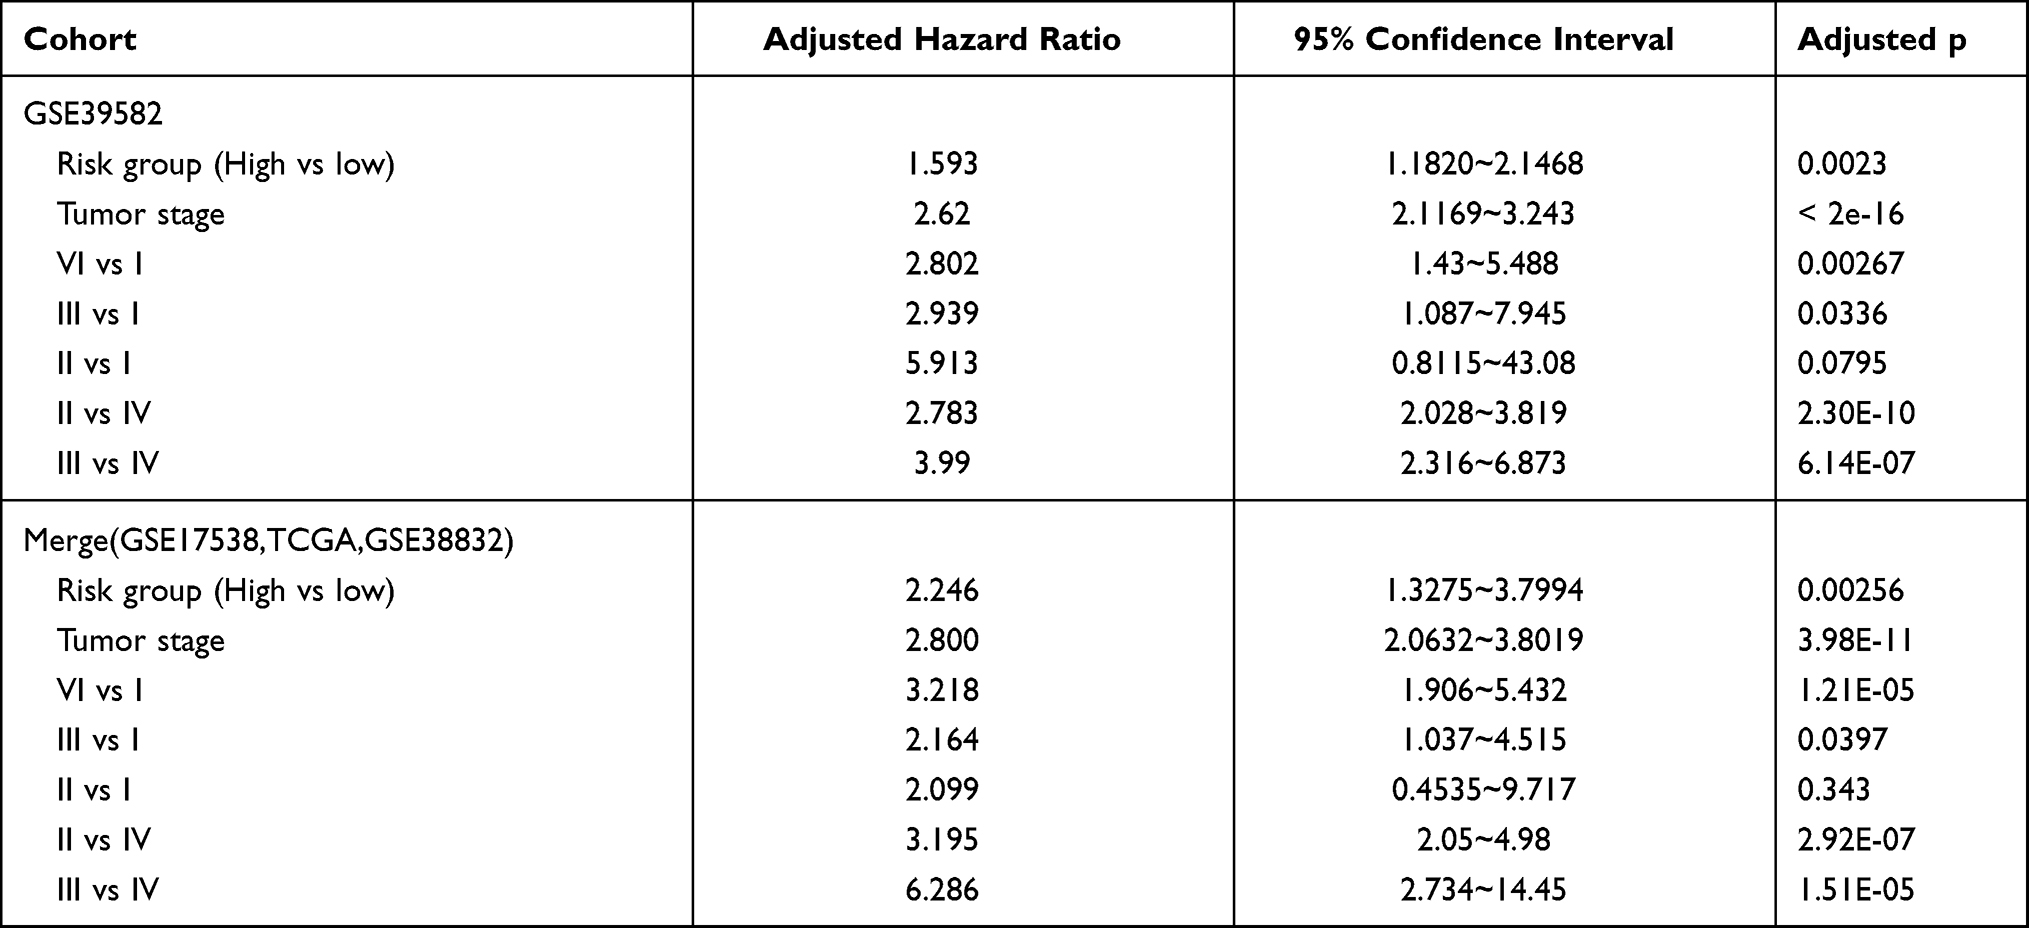 |
Table 2 Multivariate Cox Regression Analyses of Risk Factors for Relapse Free Survival |
Validation of Autophagy-Stroma-Based Prognosis Classifier
The prognostic classification of autophagy-stroma was further verified using four independent cohorts, including GSE17538, TCGA, GSE38832, and the CMU cohort. The clinicopathological characteristics of the patients are listed in Table 3. The prognostic classifier consistently divided the three validation cohorts into a high-risk group with a poor survival rate and a low-risk group with a good prognosis (GSE17538 group p=0.0052, GSE38832 group p=0.028, TCGA group p=0.046, and CMU group p=0.027, Log rank test) (Figure 3E), which was consistent with results obtained in the discovery cohort. In addition, survival analysis of the four independent cohorts and a verification cohort composed of these four cohorts showed that there was significant difference between the high-risk group and the low-risk group (p<0.0001). Multivariate analysis showed that prognostic classification is an independent prognostic factor in the validation cohort (p=0.00256) and was parallel to the training set (Table 2).
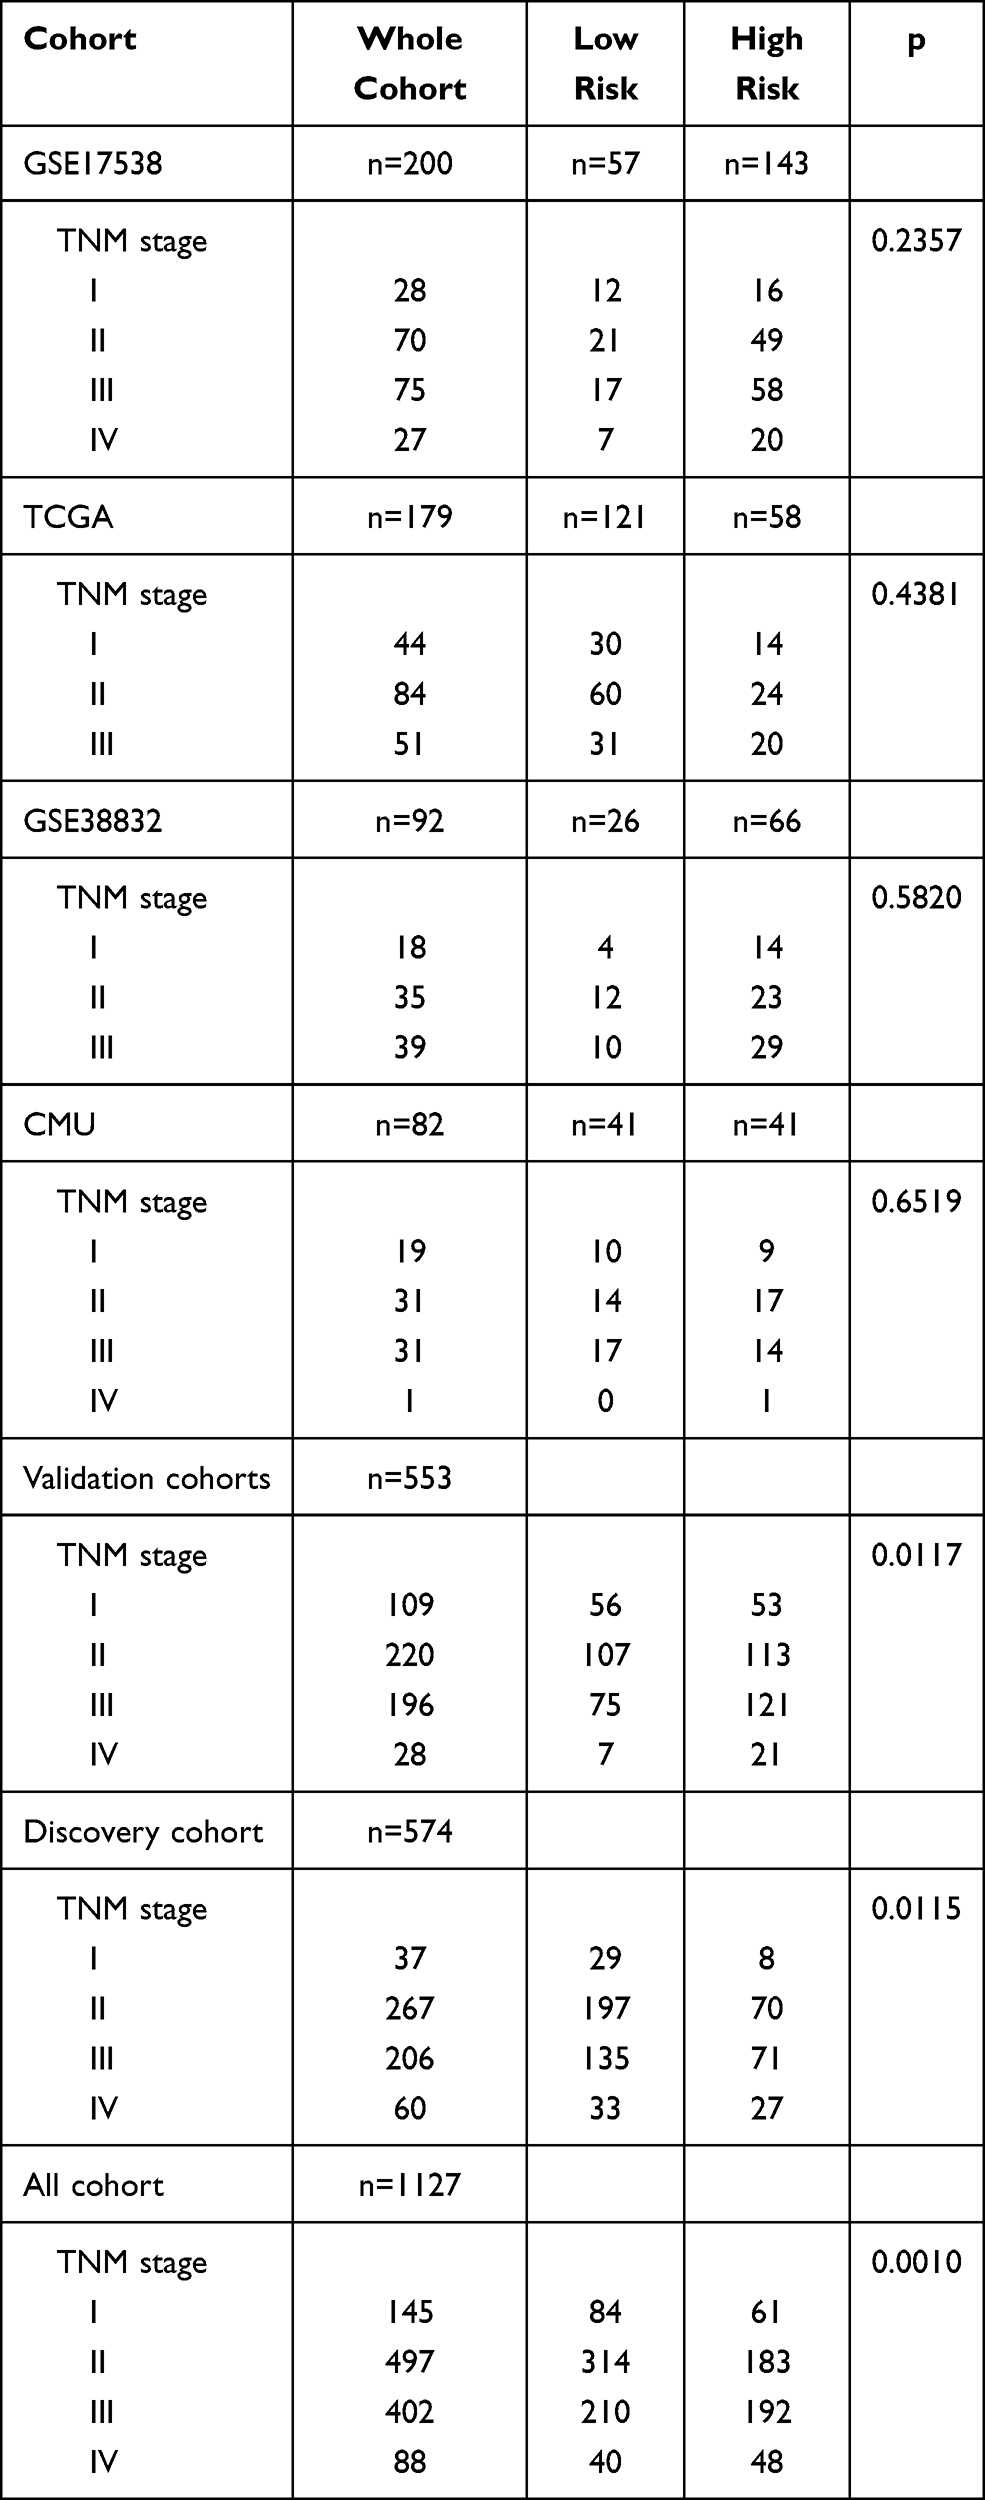 |
Table 3 TNM Characteristics of Patients in Discovery Cohort and Three Independent Validation Cohorts |
The Risk Score Was Significantly Higher in Normal Tissues Than in the Cancer Group, but the Score Gradually Increased with Tumor Development
Furthermore, we analyzed the expression levels of the three key genes of the model constructed using the TCGA pan-cancer data, and found that TNS1 and TAGLN were significantly higher in normal tissues than in tumor tissues (Figures 4A–C). We then compared the scores of 40 normal tissues in the TCGA data set (70 cases of TNM1 stage, 166 cases of TNM2 stage, 107 cases of TNM3 stage, and 65 cases of TNM4 stage, making a total of 448 samples) (Figure 4D). Results showed that the scores in the normal group were significantly higher than those in the cancer group, but the score increases gradually as the cancer develops (increased TNM staging), thereby indicating a worse prognosis.
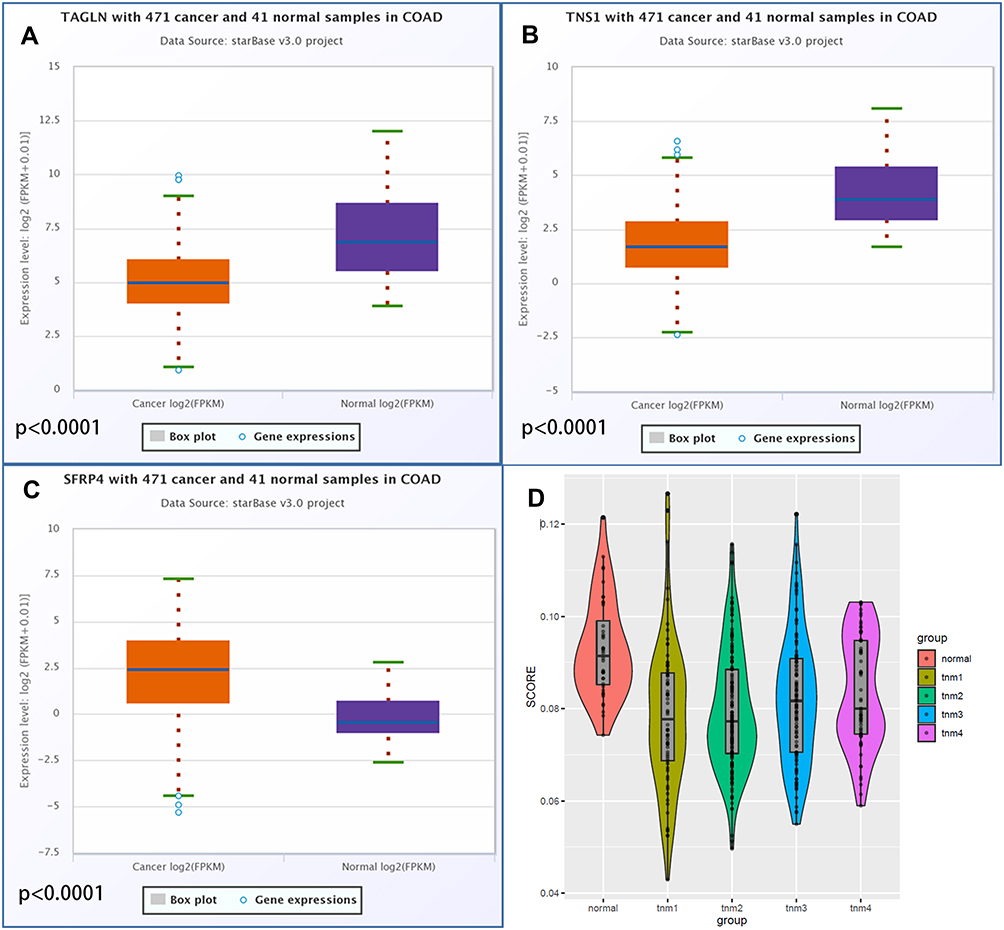 |
Figure 4 Differential expression of hub genes in colorectal cancer tissues and para-cancerous tissues and the difference of model scores in different TNM stages of colorectal cancer. (A) Differential expression of TNS1 in colorectal cancer tissues and para-cancerous tissues. (B) Differential expression of TAGLN in colorectal cancer tissues and para-cancerous tissues. (C) Differential expression of SFRP4 in colorectal cancer tissues and para-cancerous tissues. (D) Difference of model scores in different TNM stages of colorectal cancer. |
Discussion
In recent years, researchers have focused on the tumor microenvironment. In fact, the tumor microenvironment has been used to construct in vivo and in vitro models for colon cancer research,28 but the clinical application is less. Only a few drugs, such as cetuximab and Avastin, have been used in clinic.6 A previous study reported that stromal cells play an important role in the recurrence and metastasis of colorectal cancer.29 Many studies have also confirmed that stromal cells can promote the recurrence and metastasis of colorectal cancer. For example, Hu et al30 reported that stromal cell secreted exosomes promote metastasis and chemotherapy resistance by enhancing cell stemness and epithelial-mesenchymal transition in colorectal cancer. In addition, Ouahoud et al31 revealed that bidirectional tumor/stroma crosstalk promotes metastasis in mesenchymal colorectal cancer. Several studies have also shown that stromal cells help to promote cancer cell survival and can protect them against anticancer therapy.32–35 In this study, results showed that patients with high stromal cell score were more likely to relapse.
During tumor development, the autophagic process appears to function as a tumor suppressor and limits tumorigenesis.17 The study by Yue et al36 reported that beclin 1 is a critical component of mammalian autophagy and it establishes a role for autophagy in tumor suppression. On the other hand, Takamura et al37 found that autophagy is important for the suppression of spontaneous tumorigenesis through a cell-intrinsic mechanism, particularly in the liver, and that p62 accumulation contributes to tumor progression. Down-regulation of ATG6, a crucial autophagy-related gene, is associated with susceptibility to thyroid cancer38 and colorectal cancer.39 Collectively, these results indicate that autophagy is inhibited during tumorigenesis. There is also a corresponding decrease in model score during the transformation of colorectal cancer from carcinoma in situ to stage 1. However, the enhancement of autophagy may cause adverse effects during the process of cancer progression. For example, Rangwala et al40 has shown that inhibiting autophagy can treat advanced solid tumors and melanomas. Vogl et al41 reported that inhibition of autophagy can treat relapsed/refractory myeloma. Moreover, Cui et al42 revealed that radiation induces autophagic cell death in breast cancer cells via the p53/DRAM signaling pathway. These results suggest that autophagy has a controversial effect on cancer. Our results indicated that the model score gradually increases as the cancer progresses, and the patient’s prognosis worsens. Previous studies have reported that cancer cells induce and exploit elevated levels of autophagy in stromal cells for their aberrant growth.43–45 Therefore, we speculate that the interaction between autophagy and stroma cells can provide prognostic value for patients with colorectal cancer. In this study, we combined autophagy and stromal cell status into the existing clinicopathological characteristics and staging system using a series of systematic analysis, and developed a new genetic marker, with the overarching goal of improving the prognosis of colorectal cancer.
Firstly, we identified genes that are mostly associated with colorectal cancer recurrence under different autophagy states. We classified 574 patients in the GSE39582 data set into three groups using t-SNE, according to the autophagy marker gene set in the MSigDB database. Survival analysis showed that there were significant differences in prognosis among the three groups. Secondly, we chose the two groups with the largest difference, and used them to calculate the correlation between the two groups of patients and the gene set that regulates autophagy. Furthermore, we verified the difference between the two groups. Finally, the genes between the two groups were analyzed to confirm the DEGs associated with autophagy.
Subsequently, we used xCell to score the stroma status of 574 patients, and divided the patients into two groups (high-stroma and low-stroma) according to the score. Survival analysis of the two groups found that the prognosis between the two groups was significantly different. Finally, the genes between the two groups were analyzed to confirm DEGs associated with stroma status.
Next, we divided the patients into autophagytype1/stromalow group, autophagytype2/stromahigh group, and the mixed group. Survival analysis showed that there were significant survival differences among the three groups. We then performed difference analysis between the autophagytype1/stromalow group and autophagytype2/stromahigh group in order to obtain autophagy-stroma-related DEGs.
After obtaining the autophagy/stroma and autophagy-stroma related DEGs, the intersection of the three groups was chosen as the hub genes and used to build the model. In total, we obtained nine genes (SFRP4, ACTG2, SYNPO2, MAB21L2, MGP, SFRP2, CNN1, TNS1, and TAGLN), which are risk genes indicating a poor prognosis when highly expressed. For further survival analysis, six genes with p<0.05 were selected (TAGLN, MGP, TNS1, CNN1, SFRP4, and MAB21L2) and introduced into the Cox model with “glmnet” R package, risk score=0.01942066×TAGLN expression + 0.007341004×TNS1 expression + 0.03543974×SFRP4 expression. Moreover, the 574 patients with colorectal cancer in the GSE39582 data set were scored, and the “maxstat” R package used to determine the optimal cut-point for one or multiple continuous variables at once. Finally, it was verified in 553 patients using GSE17538 (200), GSE38832 (92), TCGA (179), and CMU (82) data sets.
Interestingly, the established model also had some implications for revealing the pathogenesis of colorectal cancer in addition to predicting the recurrence of colorectal cancer. We found that the expression of model key genes, TNS1 and TAGLN, in normal tissues was significantly higher than that in colorectal cancer tissues. However, high expression of TNS1 and TAGLN in colorectal cancer predicted worse prognosis. Moreover, our model had a significantly higher score in normal colorectal tissues than in the cancer group, but the score increased gradually with tumor progression. Therefore, we have reason to believe that normal colorectal tissue experienced a process of decreased stromal cell expression and autophagy changes during carcinogenesis. However, increased expression of stromal cells and changes in autophagy during tumor progression provided favorable conditions for tumor recurrence and metastasis.
Conclusion
In summary, we have established and verified a feasible prognostic model of colorectal cancer based on the autophagy and stromal cell characteristics of patients. The model can be used to evaluate recurrence risk of cancer patients, and the genes in the model provide potential targets for targeted treatment of colorectal cancer. In addition, the mechanism of the occurrence and development of colorectal cancer were reasonably forecasted.
Abbreviations
GEO, Gene Expression Omnibus; TCGA, The Cancer Genome Atlas; CMU, China Medical University; CRC, Colorectal Cancer; DEG, Differentially Expressed Genes; FDR, False Discovery Rate; LASSO, The Least Absolute Shrinkage and Selection Operator; GSEA, Gene Set Enrichment Analysis.
Data Sharing Statement
The data used or analysed during the current study are available from the corresponding author on reasonable request.
Ethics Approval
This study was conducted in accordance with the Declaration of Helsinki. This research project was approved by the Ethics Committee of The First Hospital of China Medical University. The patients provided full informed written consent to participate in the study. Committee approval number: AF-SOP-07-1.1-01
Consent to Participate and for Publication
This research project was approved by the Ethics Committee of The First Hospital of China Medical University. Written informed consent for publication was obtained from all participants.
Acknowledgments
We acknowledge the support from the Department of gastrointestinal surgery of the First Hospital of China Medical University.
Author Contributions
LC and JPZ contributed to the conception and design of the research. KZZ and JTT contributed to the PCR experiment and analysis of the data. LC and JS contributed to the analysis and interpretation of the data. All authors contributed to data analysis, drafting or revising the article, have agreed on the journal to which the article will be submitted, gave final approval of the version to be published, and agree to be accountable for all aspects of the work.
Disclosure
The authors declare that the research was conducted in the absence of any commercial or financial relationships that could be construed as a potential conflict of interest.
References
1. Siegel RL, Miller KD, Jemal A. Cancer statistics, 2020. CA Cancer J Clin. 2020;70(1):7–30. doi:10.3322/caac.21590
2. Bray F, Ferlay J, Soerjomataram I, Siegel RL, Torre LA, Jemal A. Global cancer statistics 2018: GLOBOCAN estimates of incidence and mortality worldwide for 36 cancers in 185 countries. CA Cancer J Clin. 2018;68(6):394–424. doi:10.3322/caac.21492
3. Miller KD, Nogueira L, Mariotto AB, et al. Cancer treatment and survivorship statistics, 2019. CA Cancer J Clin. 2019;69(5):363–385. doi:10.3322/caac.21565
4. van Pelt GW, Sandberg TP, Morreau H, et al. The tumour-stroma ratio in colon cancer: the biological role and its prognostic impact. Histopathology. 2018;73(2):197–206. doi:10.1111/his.13489
5. Angell HK, Bruni D, Barrett JC, Herbst R, Galon GJ. The immunoscore: colon cancer and beyond. Clin Cancer Res. 2020;26(2):332–339. doi:10.1158/1078-0432.CCR-18-1851
6. Chen S, Huang EH. The colon cancer stem cell microenvironment holds keys to future cancer therapy. J Gastrointest Surg. 2014;18(5):1040–1048. doi:10.1007/s11605-014-2497-1
7. Kim BG, Li C, Qiao W, et al. Smad4 signalling in T cells is required for suppression of gastrointestinal cancer. Nature. 2006;441(7096):1015–1019. doi:10.1038/nature04846
8. Sugiyama Y, Farrow B, Murillo C, et al. Analysis of differential gene expression patterns in colon cancer and cancer stroma using microdissected tissues. Gastroenterology. 2005;128(2):480–486. doi:10.1053/j.gastro.2004.11.010
9. Ishiguro K, Yoshida T, Yagishita H, Numata Y, Okayasu T. Epithelial and stromal genetic instability contributes to genesis of colorectal adenomas. Gut. 2006;55(5):695–702. doi:10.1136/gut.2005.079459
10. Danielsen HE, Hveem TS, Domingo E, et al. Prognostic markers for colorectal cancer: estimating ploidy and stroma. Ann Oncol. 2018;29(3):616–623. doi:10.1093/annonc/mdx794
11. Levy J, Cacheux W, Bara MA, et al. Intestinal inhibition of Atg7 prevents tumour initiation through a microbiome-influenced immune response and suppresses tumour growth. Nat Cell Biol. 2015;17(8):1062–1073. doi:10.1038/ncb3206
12. Wen YA, Xing X, Harris JW, et al. Adipocytes activate mitochondrial fatty acid oxidation and autophagy to promote tumor growth in colon cancer. Cell Death Dis. 2017;8(2):e2593. doi:10.1038/cddis.2017.21
13. Liu J, Long S, Wang H, et al. Blocking AMPK/ULK1-dependent autophagy promoted apoptosis and suppressed colon cancer growth. Cancer Cell Int. 2019;19:336. doi:10.1186/s12935-019-1054-0
14. Nassour J, Radford R, Correia A, et al. Autophagic cell death restricts chromosomal instability during replicative crisis. Nature. 2019;565(7741):659–663. doi:10.1038/s41586-019-0885-0
15. Lucas C, Salesse L, Hoang MHT, et al. Autophagy of intestinal epithelial cells inhibits colorectal carcinogenesis induced by colibactin-producing Escherichia coli in Apc(Min/+) mice. Gastroenterology. 2020;158(5):1373–1388. doi:10.1053/j.gastro.2019.12.026
16. Schaaf MB, Houbaert D, Mece O, Agostinis P. Autophagy in endothelial cells and tumor angiogenesis. Cell Death Differ. 2019;26(4):665–679. doi:10.1038/s41418-019-0287-8
17. Folkerts H, Hilgendorf S, Vellenga E, Bremer E, Wiersma VR. The multifaceted role of autophagy in cancer and the microenvironment. Med Res Rev. 2019;39(2):517–560. doi:10.1002/med.21531
18. Wu H, Dai D, Wang X. A novel radar HRRP recognition method with accelerated T-distributed stochastic neighbor embedding and density-based clustering. Sensors. 2019;19:23. doi:10.3390/s19235112
19. Subramanian A, Tamayo P, Mootha VK, et al. Gene set enrichment analysis: a knowledge-based approach for interpreting genome-wide expression profiles. Proc Natl Acad Sci U S A. 2005;102(43):15545–15550. doi:10.1073/pnas.0506580102
20. Mootha VK, Lindgren CM, Eriksson KF, et al. PGC-1alpha-responsive genes involved in oxidative phosphorylation are coordinately downregulated in human diabetes. Nat Genet. 2003;34(3):267–273. doi:10.1038/ng1180
21. Ritchie ME, Phipson B, Wu D, et al. limma powers differential expression analyses for RNA-sequencing and microarray studies. Nucleic Acids Res. 2015;43(7):e47. doi:10.1093/nar/gkv007
22. Aran D, Hu Z, Butte AJ. xCell: digitally portraying the tissue cellular heterogeneity landscape. Genome Biol. 2017;18(1):220. doi:10.1186/s13059-017-1349-1
23. Tibshirani R. The lasso method for variable selection in the Cox model. Stat Med. 1997;16(4):385–395. doi:10.1002/(SICI)1097-0258(19970228)16:4<385::AID-SIM380>3.0.CO;2-3
24. Zhang JX, Song W, Chen ZH, et al. Prognostic and predictive value of a microRNA signature in stage II colon cancer: a microRNA expression analysis. Lancet Oncol. 2013;14(13):1295–1306. doi:10.1016/S1470-2045(13)70491-1
25. Friedman J, Hastie T, Tibshirani R. Regularization paths for generalized linear models via coordinate descent. J Stat Softw. 2010;33(1):1–22. doi:10.18637/jss.v033.i01
26. Hothorn T, Zeileis A. Generalized maximally selected statistics. Biometrics. 2008;64(4):1263–1269. doi:10.1111/j.1541-0420.2008.00995.x
27. Li JH, Liu S, Zhou H, Qu LH, Yang JH. starBase v2.0: decoding miRNA-ceRNA, miRNA-ncRNA and protein-RNA interaction networks from large-scale CLIP-seq data. Nucleic Acids Res. 2014;42:D92–97. doi:10.1093/nar/gkt1248
28. Lannagan TR, Jackstadt R, Leedham SJ, Sansom OJ. Advances in colon cancer research: in vitro and animal models. Curr Opin Genet Dev. 2021;66:50–56. doi:10.1016/j.gde.2020.12.003
29. Tauriello DV, Calon A, Lonardo E, Batlle E. Determinants of metastatic competency in colorectal cancer. Mol Oncol. 2017;11(1):97–119. doi:10.1002/1878-0261.12018
30. Hu JL, Wang W, Lan XL, et al. CAFs secreted exosomes promote metastasis and chemotherapy resistance by enhancing cell stemness and epithelial-mesenchymal transition in colorectal cancer. Mol Cancer. 2019;18(1):91. doi:10.1186/s12943-019-1019-x
31. Ouahoud S, Voorneveld PW, van der Burg LRA, et al. Bidirectional tumor/stroma crosstalk promotes metastasis in mesenchymal colorectal cancer. Oncogene. 2020;39(12):2453–2466. doi:10.1038/s41388-020-1157-z
32. Wang Q, Xue L, Zhang X, Bu S, Zhu X, Lai D. Autophagy protects ovarian cancer-associated fibroblasts against oxidative stress. Cell Cycle. 2016;15(10):1376–1385. doi:10.1080/15384101.2016.1170269
33. Ko YH, Lin Z, Flomenberg N, et al. Glutamine fuels a vicious cycle of autophagy in the tumor stroma and oxidative mitochondrial metabolism in epithelial cancer cells: implications for preventing chemotherapy resistance. Cancer Biol Ther. 2011;12(12):1085–1097. doi:10.4161/cbt.12.12.18671
34. Martinez-Outschoorn UE, Trimmer C, Lin Z, et al. Autophagy in cancer associated fibroblasts promotes tumor cell survival: role of hypoxia, HIF1 induction and NFkappaB activation in the tumor stromal microenvironment. Cell Cycle. 2010;9(17):3515–3533. doi:10.4161/cc.9.17.12928
35. Zhang MH, Hu YD, Xu Y, et al. Human mesenchymal stem cells enhance autophagy of lung carcinoma cells against apoptosis during serum deprivation. Int J Oncol. 2013;42(4):1390–1398. doi:10.3892/ijo.2013.1810
36. Yue Z, Jin S, Yang C, Levine AJ, Heintz N. Beclin 1, an autophagy gene essential for early embryonic development, is a haploinsufficient tumor suppressor. Proc Natl Acad Sci U S A. 2003;100(25):15077–15082. doi:10.1073/pnas.2436255100
37. Takamura A, Komatsu M, Hara T, et al. Autophagy-deficient mice develop multiple liver tumors. Genes Dev. 2011;25(8):795–800. doi:10.1101/gad.2016211
38. Huijbers A, Plantinga TS, Joosten LA, et al. The effect of the ATG16L1 Thr300Ala polymorphism on susceptibility and outcome of patients with epithelial cell-derived thyroid carcinoma. Endocr Relat Cancer. 2012;19(3):L15–18. doi:10.1530/ERC-11-0302
39. Nicoli ER, Dumitrescu T, Uscatu CD, et al. Determination of autophagy gene ATG16L1 polymorphism in human colorectal cancer. Rom J Morphol Embryol. 2014;55(1):57–62.
40. Rangwala R, Chang YC, Hu J, et al. Combined MTOR and autophagy inhibition: Phase I trial of hydroxychloroquine and temsirolimus in patients with advanced solid tumors and melanoma. Autophagy. 2014;10(8):1391–1402. doi:10.4161/auto.29119
41. Vogl DT, Stadtmauer EA, Tan KS, et al. Combined autophagy and proteasome inhibition: a Phase 1 trial of hydroxychloroquine and bortezomib in patients with relapsed/refractory myeloma. Autophagy. 2014;10(8):1380–1390. doi:10.4161/auto.29264
42. Cui L, Song Z, Liang B, Jia L, Ma S, Liu X. Radiation induces autophagic cell death via the p53/DRAM signaling pathway in breast cancer cells. Oncol Rep. 2016;35(6):3639–3647. doi:10.3892/or.2016.4752
43. Zhou W, Xu G, Wang Y, et al. Oxidative stress induced autophagy in cancer associated fibroblast enhances proliferation and metabolism of colorectal cancer cells. Cell Cycle. 2017;16(1):73–81. doi:10.1080/15384101.2016.1252882
44. New J, Arnold L, Ananth M, et al. Secretory autophagy in cancer-associated fibroblasts promotes head and neck cancer progression and offers a novel therapeutic target. Cancer Res. 2017;77(23):6679–6691. doi:10.1158/0008-5472.CAN-17-1077
45. Martinez-Outschoorn UE, Balliet RM, Rivadeneira DB, et al. Oxidative stress in cancer associated fibroblasts drives tumor-stroma co-evolution: a new paradigm for understanding tumor metabolism, the field effect and genomic instability in cancer cells. Cell Cycle. 2010;9(16):3256–3276. doi:10.4161/cc.9.16.12553
 © 2021 The Author(s). This work is published and licensed by Dove Medical Press Limited. The
full terms of this license are available at https://www.dovepress.com/terms
and incorporate the Creative Commons Attribution
- Non Commercial (unported, 3.0) License.
By accessing the work you hereby accept the Terms. Non-commercial uses of the work are permitted
without any further permission from Dove Medical Press Limited, provided the work is properly
attributed. For permission for commercial use of this work, please see paragraphs 4.2 and 5 of our Terms.
© 2021 The Author(s). This work is published and licensed by Dove Medical Press Limited. The
full terms of this license are available at https://www.dovepress.com/terms
and incorporate the Creative Commons Attribution
- Non Commercial (unported, 3.0) License.
By accessing the work you hereby accept the Terms. Non-commercial uses of the work are permitted
without any further permission from Dove Medical Press Limited, provided the work is properly
attributed. For permission for commercial use of this work, please see paragraphs 4.2 and 5 of our Terms.