Back to Journals » Journal of Multidisciplinary Healthcare » Volume 16
Development and Validation of a Scale Measuring the Post Pandemic-Health Promotion Behavior (PP-HPB) of Young Adults in the Digital Era
Authors Heo ML, Jang YM, Kim HY ![]()
Received 26 May 2023
Accepted for publication 15 August 2023
Published 25 August 2023 Volume 2023:16 Pages 2449—2462
DOI https://doi.org/10.2147/JMDH.S421060
Checked for plagiarism Yes
Review by Single anonymous peer review
Peer reviewer comments 3
Editor who approved publication: Dr Scott Fraser
Myoung-Lyun Heo,1 Yang-Min Jang,2 Hyun-Young Kim1
1Department of Nursing, Jeonju University, Jeonju-si, 55069, Republic of Korea; 2Department of Nursing, Shinsung University, Dangjin-si, 31801, Republic of Korea
Correspondence: Hyun-Young Kim, Department of Nursing, Jeonju University, 303 Cheonjam-ro, Wansan-gu, Jeonju-si, 55069, Republic of Korea, Tel +82-63-220-2504, Email [email protected]
Purpose: This study aims to develop and validate a health promotion behavior scale that reflects the lifestyle changes driven by the COVID-19 pandemic and the increased use of digital devices among young adults.
Methods: Questions were selected using a literature review and validated by a group of experts. The sample consisted of 446 young adults aged 19– 29 years living in South Korea who agreed to participate in the study and were surveyed online using Google Forms on September 19 and 20, 2022. Construct validity was confirmed by exploratory and confirmatory factor analyses; reliability was tested using Cronbach’s α, and interrater validity was confirmed with the Health Promoting Lifestyle II (HPLP-II) instrument.
Results: After conducting an item analysis of 49 preliminary items and an exploratory factor analysis, six factors and 27 items were selected. The six factors were named psychosocial health, personal hygiene, dietary habits, health care, using mobile devices, and physical activity. The confirmatory factor analysis verified the model fit, convergent validity, and discriminant validity. The correlation coefficient with the Health Promoting Lifestyle II (HPLP-II) instrument was 0.69, confirming criterion validity, and the reliability of the final instrument was high (Cronbach’s α = 0.90).
Conclusion: The validity and reliability of the developed scale were confirmed. The scale can be used to measure the health promotion behavior of young adults in light of the lifestyle changes driven by the COVID-19 pandemic and the increased use of digital devices. We hope that future studies will use the tool as a basis for improving the health promotion behavior of young adults.
Keywords: young adults, health promotion behavior, scale development, scale validation
Introduction
Health promotion behavior is an essential component of preventing disease and improving quality of life, and therefore, a central concept in the field of public health.1 Exercise, diet, and the management of stress caused by a person’s lifestyle influence health promotion behavior, but so do changes in the living environment.2 For example, the outbreak of SARS-CoV-2 in December 2019 changed the daily lives of people worldwide. After the COVID-19 pandemic was officially declared by the World Health Organization (WHO), health authorities recommended the public to adopt social distancing and minimize interpersonal contact as preventive measures.3 With the rapid development of information technology,4 contact-free digital tools have begun to be adopted not only for work and study but also for relaxation and leisure.5 However, the rising use of digital technology has led to negative psychological health outcomes, decreased physical and social activity, and health problems related to sleep and eating habits.6 A study of preventive clinical interventions for health problems associated with the overuse of digital devices found that in addition to mental health problems such as depression and anxiety, new health problems have emerged, including reduced physical activity, musculoskeletal problems, eye disease, and developmental abnormalities.7
While recent research has focused on exploring the current state of health issues because of the major threat to public health posed by the COVID-19 pandemic, future research should focus on health issues in the post-pandemic period, including the improvement of health promotion and prevention of newly emerging diseases. Pender’s Health Promotion Model (HPM) is widely used as a conceptual framework for predicting a particular behavior, such as health-promoting lifestyle activities and exercise.8 The Health Promoting Lifestyle II (HPLP-II) measures six areas—health responsibility, physical activities, nutrition, interpersonal relationships, spiritual growth, and stress management—and was developed to validate the HPM.9 According to Pender,10 the self-directed perception of human-environment interaction patterns is essential for behavioral change. Correspondingly, Heo and Jang11 reported that, since the COVID-19 pandemic, the intergenerational factors affecting human-environment interaction among young adults should inform health promotion policies; furthermore, the online lifestyle of and new health perceptions in younger generations must be considered in the context of health promotion and management.
Accordingly, a measurement tool that can analyze, predict, and verify the effectiveness of health promotion behavior in the new post-pandemic era is needed. In particular, people in their twenties (young adults hereafter) have been accustomed to using mobile devices such as laptops, tablets, cell phones, and wireless earbuds in all aspects of daily life since birth.8 Further, this segment of the population is expected to adapt to global changes faster than other generations, making it necessary to develop a valid tool that accounts for their lifestyle and characteristics. Young adults perceive health in terms of not only physical and mental well-being but also optimal productivity, that is, for self-control and self-care, consequently indicating the need for a broader conceptualization of health-promoting behaviors.11
Against this backdrop, we aimed to develop and validate a post-pandemic health promotion behavior (PP-HPB) scale that reflects the lifestyles of young adults and measures their health promotion behavior. We subsequently verified the reliability and validity of the PP-HPB scale among a sample of young adults in South Korea.
Materials and Methods
Study Design
To develop the PP-HPB scale and verify its reliability and validity, we followed the eight-step scale development guidelines outlined by DeVellis and Thorpe.9
Conceptual Framework
We established a conceptual framework based on (a) the components of the HPLP-II, a widely used tool for measuring health-promoting behaviors; (b) the traditional concept of health-promoting behaviors used in the literature; and (c) post-pandemic health promotion guidelines disseminated by health-related organizations worldwide, including the Korean Disease Control and Prevention Agency (KDCA), US Centers for Disease Control and Prevention (CDC), and WHO. Additionally, the framework (Figure 1) included situational predictors based on the changed lifestyle patterns and health concepts of young adults, as discussed in Heo and Jang’s work.11
 |
Figure 1 Conceptual framework for the study. |
Formulating the Preliminary Questions
To select the preliminary questions for the PP-HPB scale, we reviewed the health behavior factors examined in previous studies. Several databases, including CINAHL, PubMed, EBSCO, RISS, KISS, DBpia, and Google Scholar, were used to review the Korean and international literature. Search terms such as “Health”, “Promotion”, “Behavior”, and “Lifestyle” were used in combination. Based on 16 existing tools for measuring health-promoting behaviors among different age groups—including adolescents, college students, adults, and older adults—and two qualitative studies pertaining to post-pandemic lifestyle patterns, we identified 10 factors, for which we developed 159 questions in total. These 10 factors were termed dietary habits, physical activity, health responsibility, self-reflection and realization, emotional management, interpersonal relationships, rest and sleep, personal hygiene, using mobile devices, and self-management. The three researchers reviewed, revised, and deleted the items that were redundant or applicable to multiple factors, and 98 preliminary items were selected in the first round.
Content Validity
Two rounds of expert validation were conducted to examine the content validity of the 10 factors and 98 preliminary items. The first content validity test was conducted by a group of four nursing professors, who reviewed the suitability of the content and factors for measuring health promotion behavior in light of the lifestyle changes following the COVID-19 pandemic. They were asked to rate each item on a 4-point scale from 1 (not at all valid), 2 (not valid), 3 (valid), to 4 (very valid). Those who gave ratings of 1 and 2 were asked to suggest modifications. Further, for those gave ratings of 3 and 4, we calculated an item-content validity index (I-CVI). As a result, the average scale-level CVI (S-CVI) was 0.71 and the I-CVI ranged from 0.25 to 1.00.
After checking the experts’ consensus for the 10 factors of health promotion behavior, we found that the I-CVI was below 0.80 for the factors of self-reflection and realization, interpersonal relationships, using mobile devices, and self-management. Therefore, we combined interpersonal relationships, self-management, and self-reflection and realization into the factor of emotional management. Although using mobile devices had an initial I-CVI value of 0.5, which is below the threshold criterion, it was retained because it is an important factor reflecting the lifestyle patterns of young adults today. At the item level, the three researchers reviewed items with an I-CVI value below 0.80, merged overlapping items, and modified and deleted sentences. This process resulted in seven factors and 49 items, which were subjected to a second round of expert validation.
The expert group for the second content validity test consisted of two of the nursing professors who participated in the first round, one nursing professor who did not, and two physicians practicing outpatient care. In the second round, the average S-CVI was 0.96 and the I-CVI values ranged from 0.67 to 1.00. Items with an I-CVI below 0.80 were reviewed by the three researchers; some were revised and deleted. The item “I spend 2 hours or less sitting except for study or work”, which had an I-CVI value below 0.8, was retained without modification, as it met the criteria proposed by Koh, which were based on the physical activity guidelines for Koreans published by the Ministry of Health and Welfare.10 We also checked the inter-expert agreement for the seven factors and found an I-CVI of 1.0 for each.
Next, we constructed a preliminary set of questions for the survey based on these seven factors, including 10 questions on dietary habits, five questions on personal hygiene, eight questions on interpersonal relationships and emotional management, six questions on using mobile devices, five questions on physical activity, 11 questions on health responsibility and self-management, and four questions on rest and sleep. To check the usefulness of the tool and eliminate difficult words and ambiguous questions, we assessed face validity with three adults aged 19–29 years. The three adults had no difficulty responding to any of the questions and took less than 10 minutes to complete the survey; the I-CVI value was 1.00. Hence, all 49 questions were included as is.
Selection of the Final Tool and Response Format
The final instrument consisted of 49 items and the response format was a Likert scale, which is often used to measure attitudes. The absence of a midpoint in Likert scale responses forces a positive or negative response to questions.11 This scale seeks to understand respondents’ general attitudes, not the knowledge or existence of unpredictable conditions; therefore, a 5-point Likert scale with a midpoint was used to prevent the distortion of responses (1 = strongly disagree, 5 = strongly agree).
Evaluation of the Tool
Participants and Data Collection
This study targeted adults aged 19–29 years living in South Korea and excluded those who did not agree to participate. Participant recruitment was conducted on September 19 and 20, 2022 after approval by the Institutional Review Board of the investigator’s institution. We used Google Forms to collect data from an unspecified number of people using Internet bulletin boards and social networking sites. The sample size was calculated based on DeVellis and Thorpe’s9 guideline, which recommends that five to ten times the number of items in a factor analysis are needed to obtain reliable factors for tool development, and Hair et al12 criterion, wherein a minimum sample size of 100–150 is needed for confirmatory factor analysis (CFA). Data were collected from 520 respondents after accounting for dropouts, and the data of 446 respondents were used for the analysis after excluding 74 missing values and duplicate responses.
Tool for Verifying Criterion Validity
The Health Promoting Lifestyle Profile II (HPLP-II) was developed by Walker et al to supplement the original Health Promoting Lifestyle Profile.13 It was adapted and modified by Yun and Kim14 for the South Korean context, which we used to verify the criterion validity of the tool developed in this study. The HPLP-II consists of 52 items across six factors. These 52 items were adapted without modification by Yun and Kim14 and are grouped into: interpersonal relationships (nine items), nutrition (nine items), health responsibility (nine items), physical activity (eight items), stress management (eight items), and spiritual growth (nine items). The participants were asked to rate themselves on a 4-point Likert scale ranging from “never” to “always” on the extent to which they practice a health-promoting lifestyle. The Cronbach’s ⍺ values were 0.94 for Walker et al13 0.91 for Yun and Kim,14 and 0.95 in this study.
Reliability and Validity Assessment
The collected data were analyzed using SPSS 27.0 and AMOS 27.0. The general characteristics of the sample were analyzed using frequency analysis and descriptive statistics, and construct validity was tested using exploratory factor analysis (EFA) and CFA. Prior to conducting the EFA, the means, standard deviations, skewness, and kurtosis of the 49 items were analyzed, and items that did not meet West et al criteria of skewness of 2 or less and kurtosis of 7 or less were removed.15 We also checked the corrected item-total correlation coefficient and deleted items with a coefficient of 0.30 or less.16 Thereafter, the Kaiser–Meyer–Olkin (KMO) test (p > 0.05) and Bartlett’s test of sphericity (p < 0.05) were conducted to confirm the adequacy of the EFA, and principal component analysis was performed using the Varimax orthogonalization method with an eigenvalue of 1.17 The numbers of the items and factors were determined based on the following criteria: commonality of 0.40 or higher, factor loading of 0.40 or higher, and average variance extracted (AVE) of 60% or higher. A CFA was conducted on the selected factors, and the model fit was checked using normed chi-square (χ2)/degrees of freedom (df) as well as three goodness-of-fit indices: root mean square residual (RMR), root mean square error of approximation (RMSEA), and standard root mean square residual (SRMR). Moreover, convergent validity, which checks the consistency of the items explaining the factors, was tested by analyzing whether the criteria of β > 0.50, AVE > 0.50, and construct reliability (CR) > 0.70 were met. In addition, discriminant validity was tested by fulfilling the two criteria of AVE > r2 and (r ± 2 * SE) ≠ 1 to ensure that the factors measured different concepts.18 Finally, Cronbach’s α coefficients were used for measuring internal consistency reliability, while correlations with the HPLP-II instrument were conducted to assess convergent validity.
Ethical Considerations
This study was approved by the Institutional Review Board of the investigator’s institution (jjIRB-220421-HR-2022-0410). In accordance with the Declaration of Helsinki, the participants were provided with an explanation of the purpose, procedures, and methods of the study and the time required for participation. They were also informed about the potential benefits and risks and compensation associated with participation in the study, and matters concerning personal information and withdrawal from the study. The collected data did not contain personal information that could be used to identify the participants, and were coded and used only for research purposes.
Results
Sample Characteristics
The mean age of the 445 respondents was 25.55 ± 2.42 years; 142 (31.9%) were under the age of 25 and 303 (68.1%) were 25 or older, with 150 (33.7%) men and 295 (66.3%) women. In terms of occupation, 172 (38.7%) were college or graduate students; 169 (38.0%), office workers; 46 (10.3%), service workers; 21 (4.7%), field workers; 9 (2.0%), self-employed; 19 (4.3%), freelancers; and 9 (2.0%) unemployed. The respondents’ education level was as follows: 17 (3.8%) with a high school diploma or less, 414 (93.0%) in college or university, and 14 (3.1%) with a graduate degree or higher. In the sample, 111 (24.9%) participants had a monthly income under KRW 1 million; 100 (22.5%) participants, KRW 1–2 million; 210 (47.2%) participants, KRW 2–3 million; and 24 (5.4%), no income.
Further, 165 (37.1%) lived alone, 253 (56.3%) lived with their family, and 27 (6.1%) lived with friends or colleagues. In terms of sleep, 254 (57.1%) slept regularly and 191 (42.9%) slept irregularly. One hundred thirty-three (29.9%) participants rated their health as good, 277 (62.2%) as fair, and 35 (7.9%) as poor. In total, 218 (49%) participants indicated they were well rested and 227 (51%) indicated they were not. The participants spent an average of 6.56 ± 3.28 hours per day on their mobile devices, with 244 (54.8%) spending less than 6 hours and 201 (45.2%) spending more than 6 hours; they spent an average of 6.47 ± 3.91 hours per day lying or sitting, with 245 (55.1%) spending less than 6 hours and 200 (44.9%) spending more than 6 hours. Table 1 presents the characteristics of the sample.
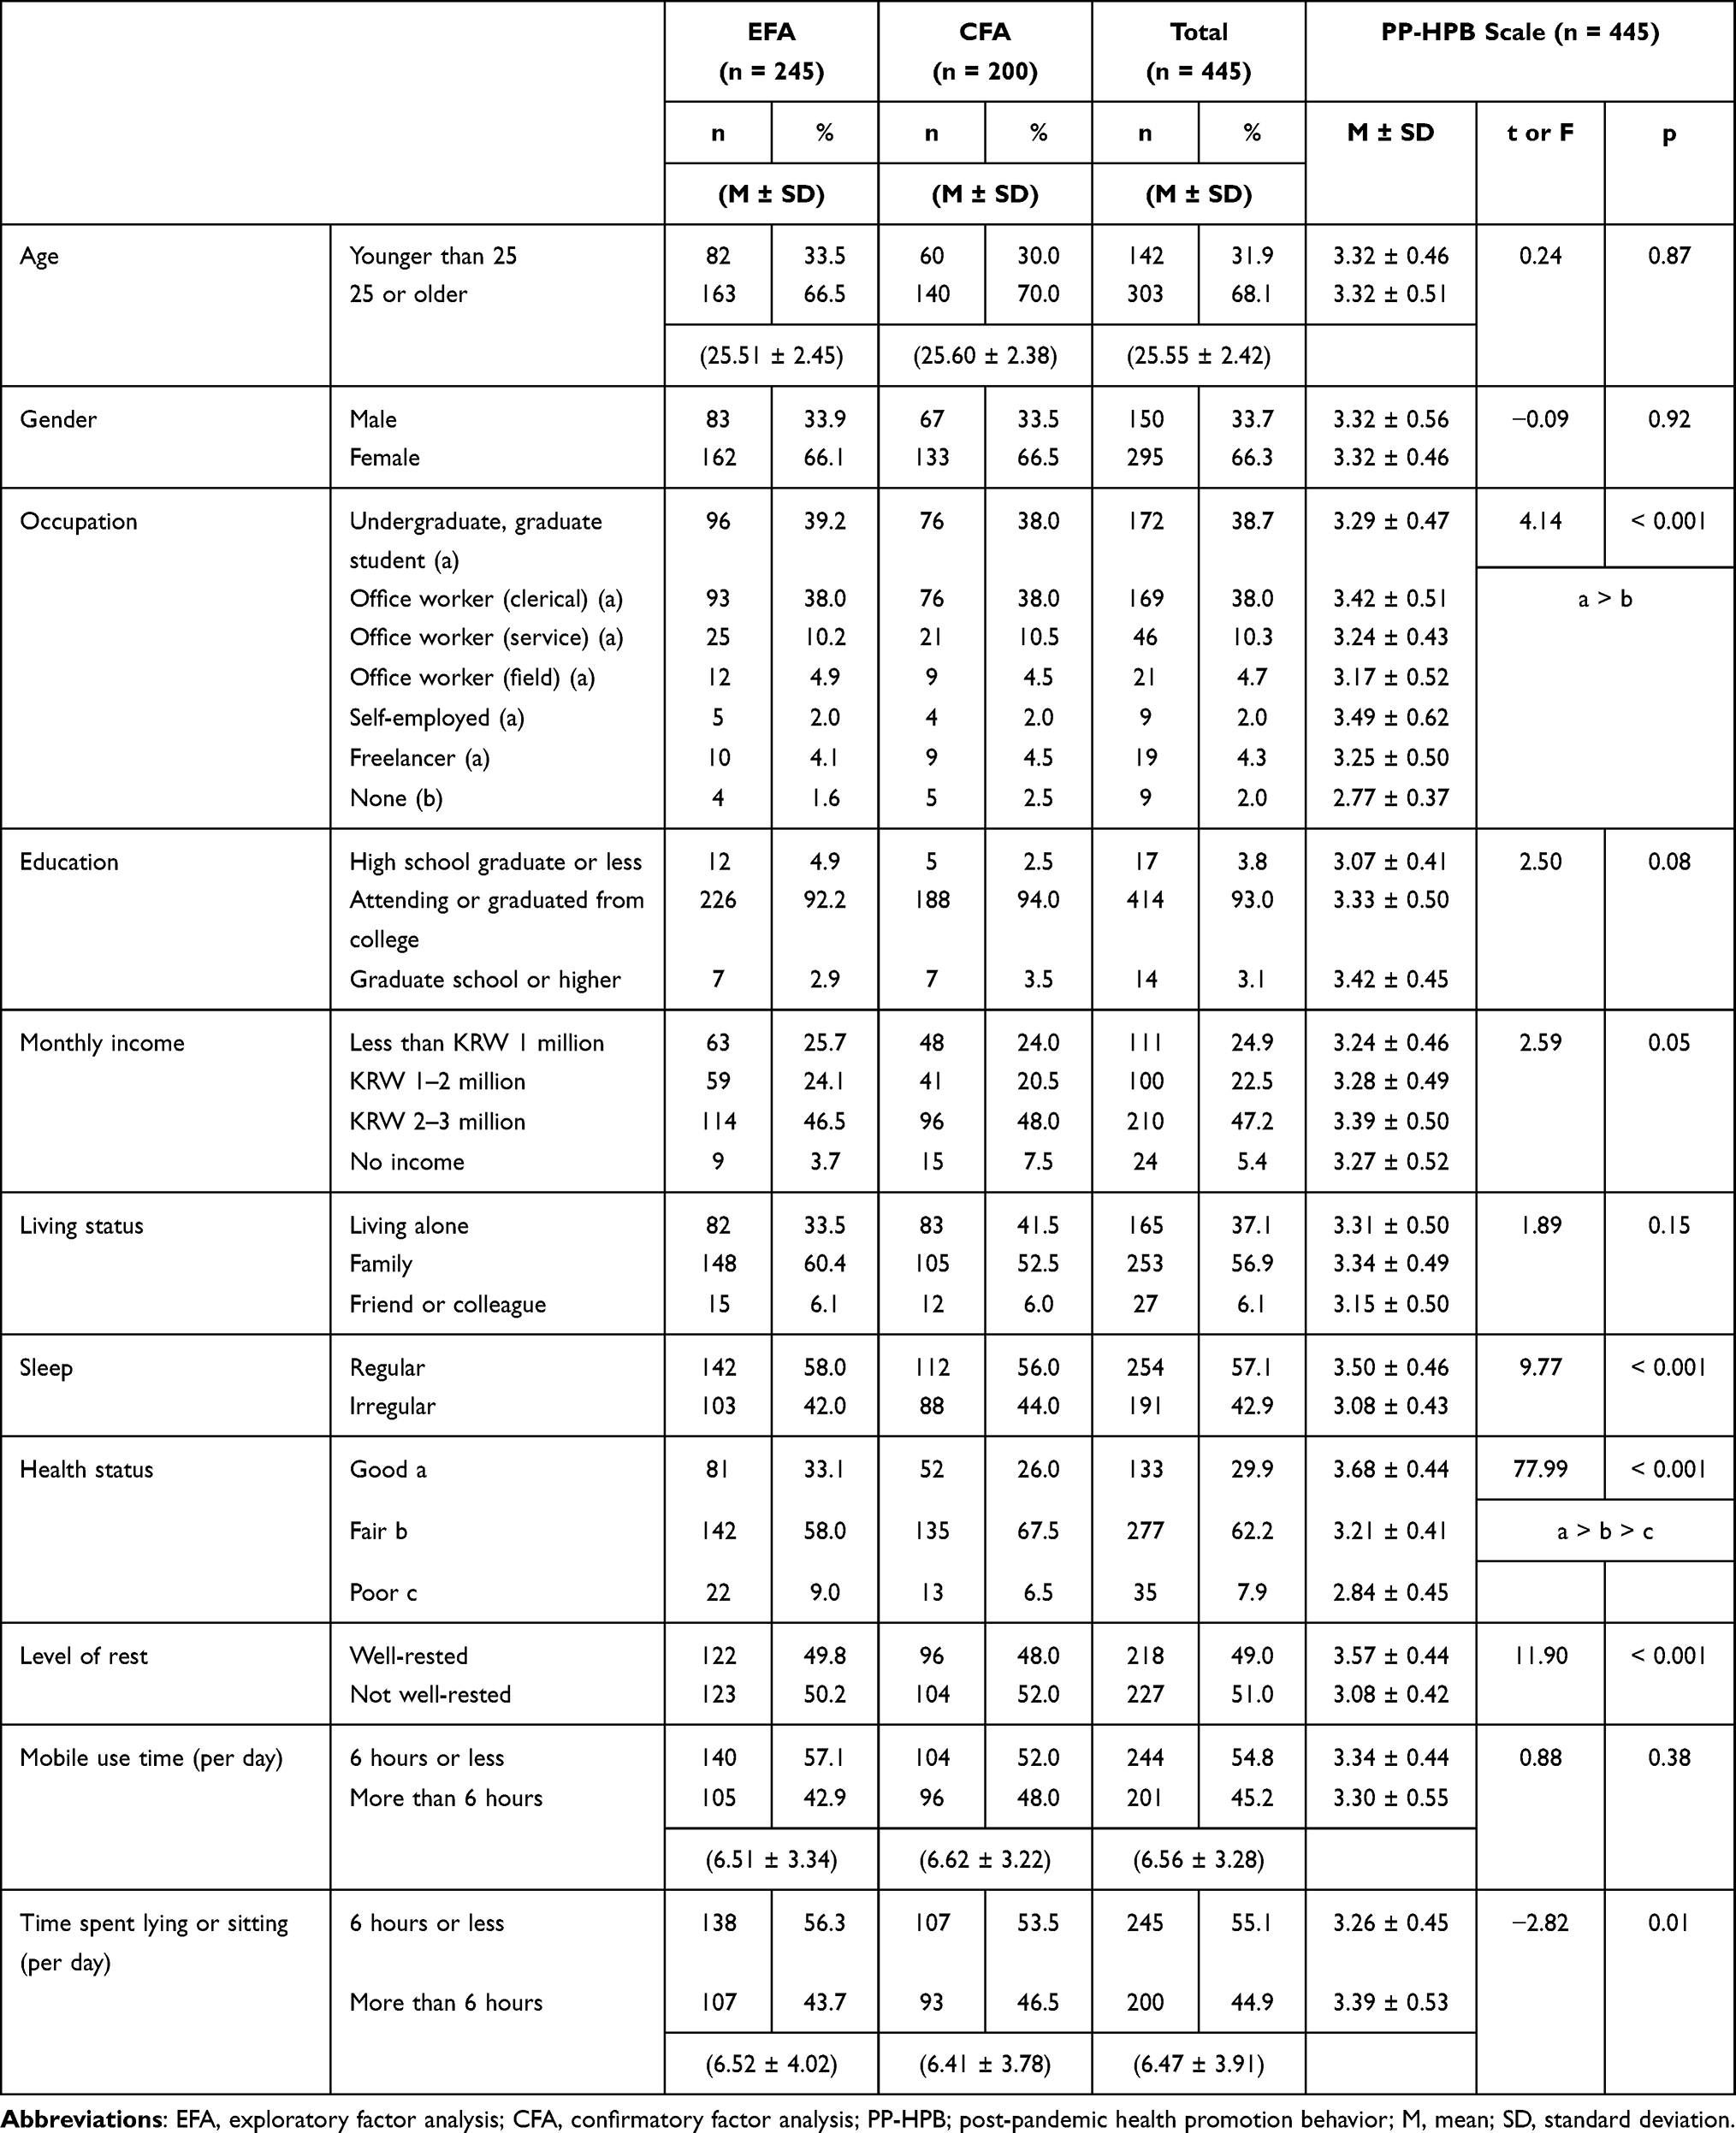 |
Table 1 Health Promotion Behavior Based on the Sample’s Demographic Characteristics |
Exploratory Factor Analysis
An EFA was conducted with 245 randomly selected responses. Further, we calculated the means, standard deviations, and skewness and kurtosis values of the 49 preliminary questions. Skewness values ranged from −1.15 to 0.92 and the scores for all the questions were below 2. Kurtosis values ranged from −1.15 to 0.67 and the scores for all the questions were below 7, confirming normality. To examine the internal consistency of the 49-item scale, we analyzed the correlation coefficients (r) of the individual and total items and removed items 37 and 8, which had r values below 3. The correlation coefficients ranged from 0.13 to 0.64.
We conducted eight EFAs with the remaining 47 items to test construct validity. The EFAs were conducted using principal component analysis with Varimax rotation and an eigenvalue of 1. In the analysis, we removed items that either had commonality values below 0.40 or factor loadings below 0.50 or were duplicated in two factors. In these eight EFAs, we removed three items (22, 34, 40), two items (1, 4), five items (2, 30, 39, 45, 56), two items (10, 29), one item (47), one item (49), seven items (21, 42, 44), and eight items (25, 35, 36) to arrive at the final 27 questions and six factors. The six factors were named “emotional and social health”, “personal hygiene”, “dietary habits”, “health care”, “using mobile devices”, and “physical activity.” The normality of the 27 items was tested; the skewness values ranged from −0.42 to 0.11 and the kurtosis values ranged from −0.94 to 0.65. The correlation coefficients of the individual and total items ranged from 0.32 to 0.62, confirming internal consistency. An EFA of the final question revealed a KMO value of 0.88, Bartlett’s test of sphericity of χ2 value of 2516.44 (p < 0.001), cumulative explanatory power of 58.8%, commonality values ranging from 0.42 to 0.72, and factor loadings ranging from 0.42 to 0.81 (Table 2).
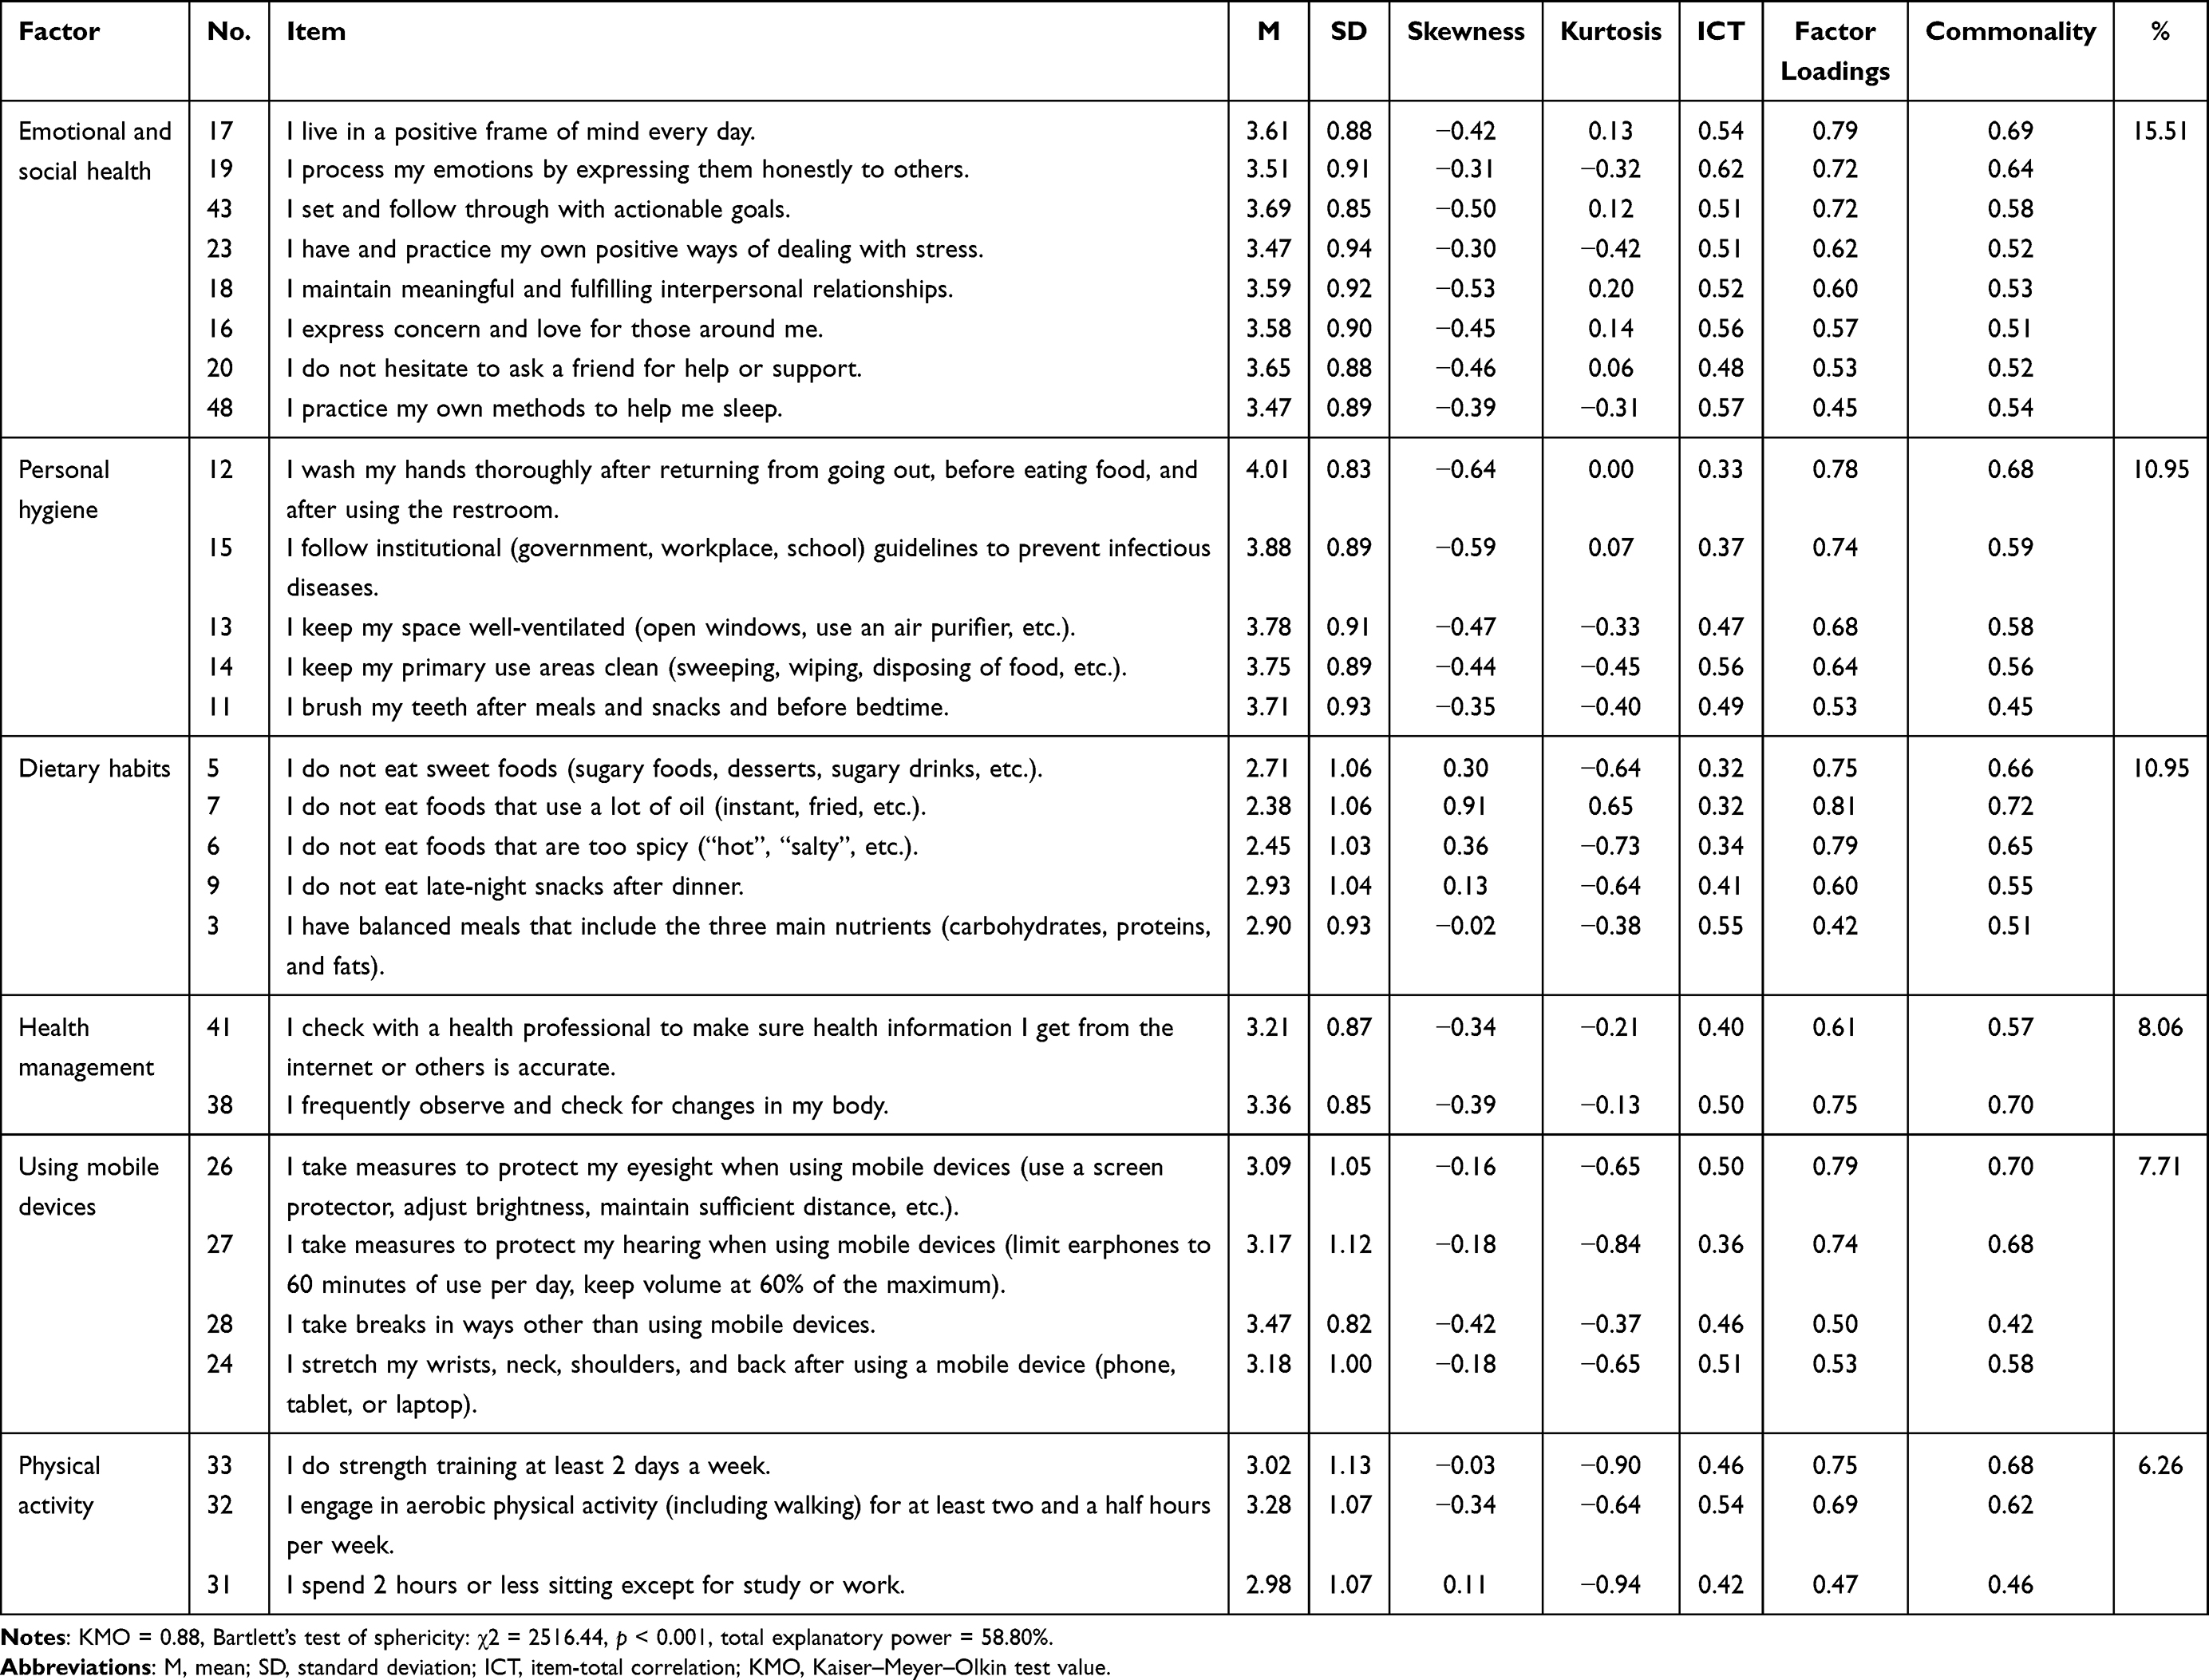 |
Table 2 Item and Exploratory Factor Analyses (n = 245) |
Confirmatory Factor Analysis
For the CFA, 200 samples were used, excluding those used in the EFA. The model fit was χ2 = 578.99 (p < 0.001), χ2/df = 1.87, RMR = 0.07, RMSEA = 0.06, and goodness-of-fit index (GFI) = 0.88 (> 0.90). The results of the CFA are shown in Table 3.
 |
Table 3 Convergent Validity with Confirmatory Factor Analysis (n = 200) |
Convergent Validity
The convergent validity of each item was checked and all the items had β values ranging from 0.51 to 0.89, which met the criterion of β ≧ 0.50. Further, for all six factors, the criterion of AVE > 0.50 was met and the CR values were above 0.70. The results of the convergent validity tests are shown in Table 3.
Discriminant Validity
The first discriminant validity test was conducted to ensured that the r2 values between the factors were lower than the AVE values of each factor. The results indicated good discriminant validity across all the factors.
The second discriminant validity test was based on the criterion (r ± 2*SE) ≠ 1, and the results indicated discriminant validity among the six factors. Table 4 summarizes the results of both discriminant validity tests.
 |
Table 4 Discriminant Validity with Confirmatory Factor Analysis (n = 200) |
Criterion Validity Analysis
To test criterion validity using the HPLP-II, a correlation analysis was conducted for the data of all 445 participants. The total scores of the two instruments were positively correlated (r = 0.86, p < 0.001). All of the six factors demonstrated significant positive correlations, indicating strong criterion validity (see Table 5).
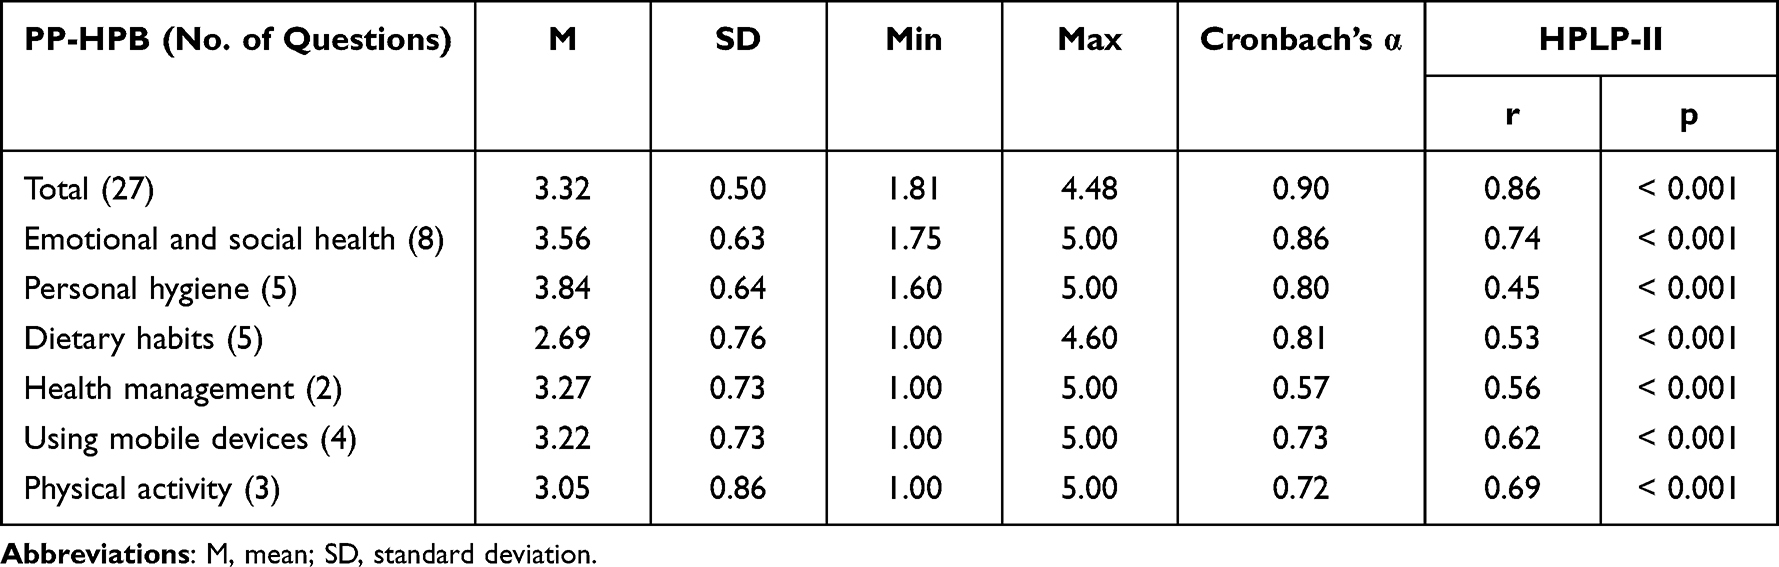 |
Table 5 Reliability of the Final Instrument and Criterion Validity with the HPLP-II (n = 445) |
Reliability Analysis
The mean score of the PP-HPB scale in the study sample was 3.32 ± 0.50 and the means of the six factors were 3.56 ± 0.63 for emotional and social health, 3.84 ± 0.64 for personal hygiene, 2.69 ± 0.76 for dietary habits, 3.27 ± 0.73 for health management, 3.22 ± 0.73 for using mobile devices, and 3.05 ± 0.86 for physical activity. The overall reliability of the instrument was high (Cronbach’s α = 0.90). By factor, the reliability values were 0.86 for emotional and social health, 0.80 for personal hygiene, 0.81 for dietary habits, 0.57 for health management, 0.73 for using mobile devices, and 0.72 for physical activity (see Table 5).
Analysis of the PP-HPB Scale
The final 27-item PP-HPB scale (Supplementary Material) was analyzed based on the sample characteristics and showed statistically significant differences based on occupation (F = 4.14, p < 0.001), sleep (t = 9.77, p < 0.001), health status (F = 77.99, p < 0.001), rest level (t = 11.90, p < 0.001), and time spent lying or sitting during the day (t = −2.82, p = 0.01), as shown in Table 1.
Discussion
The PP-HPB scale is a six-factor, 27-item instrument that was developed in this study to measure post-pandemic health promotion behavior among young adults. While the dictionary definition of health promotion behavior is “any activity designed to improve health”, its factors can vary.19 Traditionally, the HPLP-II developed by Walker et al2 is the most widely used instrument, and its six factors are health responsibility, physical activity, nutrition, spiritual growth, interpersonal relationships, and stress management. On the contrary, the six factors of the PP-HPB scale are named psychosocial health, personal hygiene, dietary habits, health management, using mobile devices, and physical activity. The most prominent feature of the factor structure is that the factors of self-management, interpersonal relationships, and rest and sleep, which appeared in the initial factor development stage, were incorporated into the single factor of psychosocial health. This was done in accordance with Woo,18 who suggests that any variables that are statistically highly correlated in an EFA can be grouped together. Moreover, given its close relation to emotional well-being, sleep can be integrated into another factor rather than forming a separate one.20
The combination of standard personal hygiene practices such as handwashing, cleaning, and brushing teeth in the question “I follow institutional guidelines to prevent infectious diseases” in the personal hygiene factor is relevant for measuring preparedness for future pandemics. In addition, we included eye health, ear health, musculoskeletal health, and activity level as factors to reflect recent lifestyle changes such as the increased use of mobile devices, decreased physical activity, and increased sedentary behaviors. Hence, the PP-HPB scale is suitable for measuring health promotion behavior among young adults in today’s digital age.21
An EFA was conducted to check the factors of the PP-PHB scale, and the results of the KMO test and Bartlett’s test of sphericity confirmed the presence of a normal distribution as well as a factor loading value above 0.04, thereby confirming construct validity. However, the total explanatory power was 58.80%, which is slightly below the standard 60% or more suggested to be meaningful in social sciences. On the contrary, Lee et al22 state that when conducting an EFA, it is desirable to select factors until the cumulative explanatory power is 60% or until the explanatory power is at least 5%. In this study, physical activity was the factor with the lowest proportion of explained variance (6.26%). We considered it to be appropriate for inclusion because it explained more than 5% of the total variance.
The model’s fit to the factors was checked using χ2/df, which had a value of 1.87. As this value was below 2 or 3,23 it was considered to be appropriate. Furthermore, the RMR value of 0.07 was inadequate according to the threshold of 0.05 set by Woo.18 However, the sample size in this study was reduced by separating the participants into the EFA and CFA. Furthermore, checking the RMSEA, which is less affected by sample size, is recommended for models that may be problematic because of a small sample size.18 Hu and Bentler24 suggest RMSEA ≤ 0.06 as the criterion for a good fit. The RMSEA value in this study was 0.06; hence, the model can be considered to be a good fit. We also calculated the GFI value, a popular absolute goodness-of-fit index that is less sensitive to model complexity; its value was 0.82, which is below the threshold of 0.90.23 However, the GFI is also indirectly affected by sample size.
In this study, following Hair et al12 criteria, we aimed for a minimum sample size of 100–150 for the CFA, but the small sample size may have affected the model fit; hence, future studies that use the PP-HPB scale should have a sufficient sample size for performing CFA. Although a better model fit is desirable, it is not advisable to build a research model based solely on the criterion of a good model fit.18 Therefore, the PP-HPB scale can be considered to be usable. Furthermore, the results of the CFA revealed that all the factors had AVE and CR values above 0.50 and 0.70, respectively, indicating that all the items converged to the corresponding factors. Moreover, the results of the two discriminant validity tests met the criteria, confirming that the factors comprising health promotion behavior had low correlations and do not overlap. In addition, Cronbach’s α of the final tool was 0.90, which indicates high reliability. However, the health management factor had a low Cronbach’s α (0.57) because it consisted of only two questions.
The mean of the final PP-HPB scale was 3.32, which is moderate. Of the six factors, dietary habits and physical activity had relatively low scores, which may reflect the characteristics of young adults after the COVID-19 pandemic. The healthy eating habits of young adults are negatively influenced by the culture of eating alone, using meal kits, eating out, and using food delivery services.25 Thus, future research should aim to improve young adults’ dietary habits. The greater use of digital devices during the COVID-19 pandemic led to significantly decreased physical activity among adults,26 and the results of this study confirm this. In contrast, personal hygiene was the highest scoring factor in the PP-HPB scale. This is likely because of increased education and sensitization about infection prevention during the COVID—19 pandemic,27 and is worth examining in future research.
During early adulthood, various groups such as students, workers, and job seekers coexist.28 The findings of this study showed that unemployed participants had significantly lower levels of health promotion behavior. Although it is difficult to generalize this result because owing to the small sample size, attention should be paid to young adults who are not affiliated with schools or workplaces, and therefore, in the blind spot of health management. In addition, the participants’ health promotion behavior differed according to the regularity of sleep, perceived health status, and level of rest, which confirm that good rest and sleep are closely related to better health.
The present results showed that health promotion behavior was significantly lower if sedentary time exceeded 6 hours per day. Similarly, Romero-Blanco et al29 reported that college students in their twenties experienced reduced mobility, decreased physical activity, and increased sedentary time during the COVID-19 pandemic. As this phenomenon is associated with health promotion behavior, it is important to develop programs to identify lifestyle patterns and increase activity levels among young adults. Most of the participants in this study had a college education or higher. Given that health behaviors generally increase with education levels, the findings may have limited generalizability.30
The PP-HPB scale can be used to measure the health promotion behavior of young adults in the post-COVID-19 era. Of particular significance is that this newly developed tool showed a significant positive correlation in criterion validity with the HPLP-II, despite the addition of personal hygiene content related to pandemic guidelines and new lifestyle patterns such as using mobile devices. We hope that future studies will use the tool as a basis for improving the health promotion behavior of young adults.
Conclusion
The 27-item PP-HPB scale developed in this study is composed of six factors, namely, psychosocial health, personal hygiene, dietary habits, health care, using mobile devices, and physical activity. It reflects the lifestyle patterns of young adults in modern society, considering the recent emphasis on infection prevention and prevalence of digital lifestyles. As a valid and reliable tool that is composed of easy and concise questions, the PP-HPB scale would be useful for future research. Nonetheless, this scale has some limitations owing to its generalizability, as it is based on a sample of young adults in South Korea, as well as the small sample size, which affected the model fit. In addition, the study data were collected via an online survey; therefore, a risk of sample or bias exists. Future research could address these limitations in two ways. First, we recommend a replication study with a larger sample size of people of different ethnicities and countries. Second, future studies could develop educational and other types of programs to improve health promotion behavior using this scale.
Ethics Approval and Consent to Participate
The study was approved by the Institutional Review Board of Jeonju University (IRB No. jjIRB-220421-HR-2022-0410). We obtained written informed consent from all participants in this study.
Acknowledgments
The authors express sincere gratitude toward all the participants of the study.
Funding
This work was supported by the National Research Foundation of Korea (NRF) grant funded by the Korea government (MSIT) (No. 2021R1F1A1062667).
Disclosure
The authors declare no conflicts of interest in this work.
References
1. Johnson BT, Scott-Sheldon LA, Carey MP. Meta-synthesis of health behavior change meta-analyses. Am J Public Health. 2010;100(11):2193–2198. doi:10.2105/AJPH.2008.155200
2. Walker SN, Sechrist KR, Pender NJ. The health-promoting lifestyle profile: development and psychometric characteristics. Nurs Res. 1987;36(2):76–81. doi:10.1097/00006199-198703000-00002
3. Van den Broucke S. Why health promotion matters to the COVID-19 pandemic, and vice versa. Health Promot Int. 2020;35(2):181–186. doi:10.1093/heapro/daaa042
4. Khalifa SAM, Swilam MM, El-Wahed AAA, et al. Beyond the pandemic: COVID-19 pandemic changed the face of life. Int J Environ Res Public Health. 2021;18(11):5645. doi:10.3390/ijerph18115645
5. Hussain MW, Mirza T, Hassan MM. Impact of COVID-19 pandemic on the human behavior. Int J Educ Manag Eng. 2020;10(5):35–61. doi:10.5815/ijeme.2020.05.05
6. Ammar A, Trabelsi K, Brach M, et al. Effects of home confinement on mental health and lifestyle behaviours during the COVID-19 outbreak: insights from the ECLB-COVID19 multicentre study. Biol Sport. 2021;38(1):9–21. doi:10.5114/biolsport.2020.96857
7. Lee HK, Lim HW, Lee JJ, Shin YM, Lee SY, Jeong SH. Development of Preventive Intervention Recommendation for Health Problem Related to Excessive Use of Digital Contents/Devices. Seoul, Korea: Korean Medical Association; 2020.
8. Hwang S, Kim H. The effect of using digital devices on the eyes and musculoskeletal system in university students. Korean J Vis Sci. 2022;24(4):461–472. doi:10.17337/JMBI.2022.24.4.461
9. DeVellis RF, Thorpe CT. Scale Development: Theory and Applications. Thousand Oaks (CA): Sage Publications; 2021.
10. Koh KW. Physical activity guideline for social distancing during COVID-19. Korean J Health Educ Promot. 2020;37(1):109–112. doi:10.14367/kjhep.2020.37.1.109
11. Jang D, Cho SK. Is the mid-point of a Likert-type scale necessary? Comparison between the scales with or without the mid-point. Survey Res. 2017;18(4):1–24. doi:10.20997/SR.18.4.1
12. Hair JF, Black WC, Babin BJ, Anderson RE, Tatham RL. Multivariate Data Analysis.
13. Walker SN, Sechrist KR, Pender NJ. Health Promotion Model-Instruments to Measure Health Promoting Lifestyle: Health-Promoting Lifestyle Profile [HPLP II] (Adult Version). Omaha (NE): University of Nebraska Medical Center; 1995.
14. Yun SN, Kim JH. Health-promoting behaviors of the women workers at the manufacturing industry-based on the Pender’s health promotion model. Korean J Occup Health Nurs. 1999;8(2):130–140.
15. West SG, Finch JF, Curran PJ. Structural Equation Models with Nonnormal Variables: Problems and Remedies. Thousand Oaks (CA): Sage Publications; 1995.
16. Tabachnick BG, Fidell LS, Ullman JB. Using Multivariate Statistics.
17. Kaiser HF. An index of factorial simplicity. Psychometrika. 1974;39(1):31–36. doi:10.1007/bf02291575
18. Woo J. The Concept and Understanding of Structural Equation Model. Seoul: Hannarae Academy; 2012.
19. Kim D. Study on the concept of health promotion. J Korean Soc Health Educ. 1994;11(2):1–17.
20. Vandekerckhove M, Cluydts R. The emotional brain and sleep: an intimate relationship. Sleep Med Rev. 2010;14(4):219–226. doi:10.1016/j.smrv.2010.01.002
21. Stockwell S, Trott M, Tully M, et al. Changes in physical activity and sedentary behaviours from before to during the COVID-19 pandemic lockdown: a systematic review. BMJ Open Sport Exerc Med. 2021;7(1):e000960. doi:10.1136/bmjsem-2020-000960
22. Lee EO, Im NY, Park HA, Lee IS, Kim JI, Bae JE. Nursing Study and Statistical Analysis. Paju: Sumoonsa; 2009.
23. Kang H. Discussions on the suitable interpretation of model fit indices and the strategies to fit model in structural equation modeling. J Korean Data Anal Soc. 2013;15(2):653–668.
24. Hu LT, Bentler PM. Cutoff criteria for fit indexes in covariance structure analysis: conventional criteria versus new alternatives. Struct Equ Modeling. 1999;6(1):1–55. doi:10.1080/10705519909540118
25. Lee D, Ahn J, Nam J. Self-rated health according to change of lifestyle after COVID-19: differences between age groups. Korean J Health Educ Promot. 2022;39(2):1–13. doi:10.14367/kjhep.2022.39.2.1
26. Castañeda-Babarro A, Arbillaga-Etxarri A, Gutiérrez-Santamaría B, Coca A. Physical activity change during COVID-19 confinement. Int J Environ Res Public Health. 2020;17(18):6878. doi:10.3390/ijerph17186878
27. Heo ML, Jang YM. Development and validation of the infection prevention behavior scale of individuals (IPBS-I) for the general population. J Multidiscip Healthc. 2021;14:2791–2802. doi:10.2147/JMDH.S334154
28. Heo M, Lee S. Effects of physical activity characteristics in Korean early adult in their 20s on the current status of hypertension: comparison of ‘normal’ and ‘above prehypertension groups. Health Welfare. 2021;23(4):91–109. doi:10.23948/kshw.2021.12.23.4.91
29. Romero-Blanco C, Rodríguez-Almagro J, Onieva-Zafra MD, Parra-Fernández ML, Prado-Laguna MDC, Hernández-Martínez A. Physical activity and sedentary lifestyle in university students: changes during confinement due to the COVID-19 pandemic. Int J Environ Res Public Health. 2020;17(18):6567. doi:10.3390/ijerph17186567
30. Bijwaard GE, van Kippersluis H, Veenman J. Education and health: the role of cognitive ability. J Health Econ. 2015;42:29–43. doi:10.1016/j.jhealeco.2015.03.003
 © 2023 The Author(s). This work is published and licensed by Dove Medical Press Limited. The
full terms of this license are available at https://www.dovepress.com/terms
and incorporate the Creative Commons Attribution
- Non Commercial (unported, 3.0) License.
By accessing the work you hereby accept the Terms. Non-commercial uses of the work are permitted
without any further permission from Dove Medical Press Limited, provided the work is properly
attributed. For permission for commercial use of this work, please see paragraphs 4.2 and 5 of our Terms.
© 2023 The Author(s). This work is published and licensed by Dove Medical Press Limited. The
full terms of this license are available at https://www.dovepress.com/terms
and incorporate the Creative Commons Attribution
- Non Commercial (unported, 3.0) License.
By accessing the work you hereby accept the Terms. Non-commercial uses of the work are permitted
without any further permission from Dove Medical Press Limited, provided the work is properly
attributed. For permission for commercial use of this work, please see paragraphs 4.2 and 5 of our Terms.
Recommended articles
Teachers Who are Stuck in Time: Development and Validation of Teachers’ Time Poverty Scale
Liu T, Yang X, Meng F, Wang Q
Psychology Research and Behavior Management 2023, 16:2267-2281
Published Date: 21 June 2023