Back to Journals » Degenerative Neurological and Neuromuscular Disease » Volume 13
Development and Validation of a Risk Prediction Model to Estimate the Risk of Stroke Among Hypertensive Patients in University of Gondar Comprehensive Specialized Hospital, Gondar, 2012 to 2022
Authors Chekol YM ![]() , Merid MW, Tesema GA
, Merid MW, Tesema GA ![]() , Tesfie TK, Tebeje TM
, Tesfie TK, Tebeje TM ![]() , Gelaw NB, Gebi NB
, Gelaw NB, Gebi NB ![]() , Seretew WS
, Seretew WS
Received 13 September 2023
Accepted for publication 7 December 2023
Published 14 December 2023 Volume 2023:13 Pages 89—110
DOI https://doi.org/10.2147/DNND.S435806
Checked for plagiarism Yes
Review by Single anonymous peer review
Peer reviewer comments 2
Editor who approved publication: Dr Thomas Müller
Yazachew Moges Chekol,1 Mehari Woldemariam Merid,2,* Getayeneh Antehunegn Tesema,2,* Tigabu Kidie Tesfie,3,* Tsion Mulat Tebeje,4,* Negalegn Byadgie Gelaw,5,* Nebiyu Bekele Gebi,6,* Wullo Sisay Seretew2,*
1Department of Health Information Technician, Mizan Aman College of Health Science, Mizan Aman, Ethiopia; 2Department of Epidemiology and Biostatistics, University of Gondar, Gondar, Ethiopia; 3Department of Public Health, Debre Markos University, Debre Markos, Ethiopia; 4Department of Epidemiology and Biostatistics, Dilla University, Dilla, Ethiopia; 5Department of Public Health, Mizan Aman College of Health Science, Mizan Aman, Ethiopia; 6Department of Medicine, University of Gondar, Gondar, Ethiopia
*These authors contributed equally to this work
Correspondence: Yazachew Moges Chekol, Email [email protected]
Background: A risk prediction model to predict the risk of stroke has been developed for hypertensive patients. However, the discriminating power is poor, and the predictors are not easily accessible in low-income countries. Therefore, developing a validated risk prediction model to estimate the risk of stroke could help physicians to choose optimal treatment and precisely estimate the risk of stroke.
Objective: This study aims to develop and validate a risk prediction model to estimate the risk of stroke among hypertensive patients at the University of Gondar Comprehensive Specialized Hospital.
Methods: A retrospective follow-up study was conducted among 743 hypertensive patients between September 01/2012 and January 31/2022. The participants were selected using a simple random sampling technique. Model performance was evaluated using discrimination, calibration, and Brier scores. Internal validity and clinical utility were evaluated using bootstrapping and a decision curve analysis.
Results: Incidence of stroke was 31.4 per 1000 person-years (95% CI: 26.0, 37.7). Combinations of six predictors were selected for model development (sex, residence, baseline diastolic blood pressure, comorbidity, diabetes, and uncontrolled hypertension). In multivariable logistic regression, the discriminatory power of the model was 0.973 (95% CI: 0.959, 0.987). Calibration plot illustrated an overlap between the probabilities of the predicted and actual observed risks after 10,000 times bootstrap re-sampling, with a sensitivity of 92.79%, specificity 93.51%, and accuracy of 93.41%. The decision curve analysis demonstrated that the net benefit of the model was better than other intervention strategies, starting from the initial point.
Conclusion: An internally validated, accurate prediction model was developed and visualized in a nomogram. The model is then changed to an offline mobile web-based application to facilitate clinical applicability. The authors recommend that other researchers eternally validate the model.
Keywords: a risk prediction model, stroke, nomogram, hypertensive patients, Gondar
Introduction
Hypertension (HTN) is defined as systolic blood pressure (SBP) ≥ 140 mmHg and/or diastolic blood pressure (DBP) ≥ 90 mmHg when measured on two different occasions in persons who are not taking antihypertensive drugs.1 Blood pressure has decreased significantly in high-income regions but has increased in Low- and Middle-Income Countries (LMICs). Adults in sub-Saharan Africa have a higher prevalence of HTN than those in high-income nations.2 Based on a systematic review and meta-analysis, the prevalence of HTN in Ethiopians was estimated to be 19.6%, which was higher in urban areas (23.7%) than in rural areas (19.2%).3 Other studies demonstrated the prevalence of HTN to be similar in males (20.6%) and females (19.2%).3–5
Previous studies have found HTN is the leading cause of retinopathy, nephropathy, and stroke.6,7 Stroke complications can occur as a result of hemorrhage in the brain’s blood vessels or, more commonly, as a result of poor blood flow through arteries damaged by persistently high blood pressure.1 Among all stroke cases 85% of strokes are ischemic or caused by a lack of blood flow.1,8
Globally, stroke is the second leading cause of death, accounting for 9.7% of global mortality and annually 5.5 million stroke-related deaths occur in the Europe region.7,9 Men are more at risk than women, with 2.9 and 2.6 million deaths from stroke, respectively.10 If no intervention is implemented, there will be more than 23 and 7.8 million stroke cases and mortalities by 2030, respectively.11 Stroke is the most common cause of morbidity and mortality in.12 The incidence of stroke reduced by 12% in developed countries but increased by 12% in developing countries.13
Mortality in Stroke is highest in sub-Saharan African countries, including Ethiopia, accounting for more than 85% of global stroke deaths.14,15 Treatment standards recommend that stroke patients present at hospitals within 3 h of symptom onset to receive urgent treatment to prevent further or permanent damage. Delays in stroke management will result in permanent disabilities and management difficulties in the future.16
Ethiopia has started to enter an epidemiological shift, according to the WHO, Noncommunicable Diseases (NCDs) account about 34% of all deaths in Ethiopia, with stroke being one of the most common causes.17 Stroke is the sixth leading cause of death.18 It is the most prevalent neurological disorder in hospital-admitted patients. In Tikur Anbessa Specialized Hospital (TASH) and Felege Hiwot Referral Hospital (FHRH), cerebrovascular accidents (CVA) account for 23.6% and 7.5% of all neurological admissions, respectively.19,20 Despite the fact that Ethiopia signed a sustainable development agreement to reduce premature deaths from non-communicable diseases by one-third from 2016 to 2030, the annual death rate of Ethiopians due to non-communicable diseases such as uncontrolled HTN remained high (39%).21
The identification of major behavioral risk factors for stroke has a direct impact on stroke prevention and therapeutic measures in high-risk groups such as hypertensive patients.22 Furthermore, lack of awareness leads to low compliance with preventive programs.23,24 The Framingham Stroke Risk Score (FSRS) and Ischemic Cardiovascular Disease model (ICVD) were developed in 1994 and 2006, respectively, and use age, sex, smoking, blood pressure (BP), total cholesterol, diabetes mellitus, heart disease, and body mass index (BMI) to predict risk with an AUC of 0.588.25,26 However, these two models have a limited capacity to predict stroke risk, and their ability to predict a single stroke result is unknown. Furthermore, assessing shifting risk variables and their consequences on stroke is out of date.27 Therefore, in this study, a stroke risk prediction model was developed for hypertensive patients using easily measurable predictors with better discrimination performance.
Although there are several studies on the incidence and predictors of stroke among HTN patients with HTN, there is limited evidence on risk prediction models for predicting stroke among HTN patients with HTN. Therefore, this study aims to develop and validate a risk prediction model for stroke among hypertensive patients at the University of Gondar Comprehensive Specialized Hospital. To effectively target interventions to reduce the risk of stroke among HTN patients, a reliable risk prediction model is useful for identifying HTN patients with HTN at a higher risk of stroke, to effectively target interventions to reduce the risk of stroke among patients with HTN. Identifying which group of HTN patients is at a higher risk of developing stroke using clinical prediction scores is essential for health-care providers to establish early, accurate, and affordable interventions.
Methods and Materials
Study Design and Period
This institution-based retrospective follow-up study was conducted at the University of Gondar Comprehensive Specialized Hospital, Gondar, between September 2012 and January 2022.
Study Area
The study was conducted at the University of Gondar Comprehensive Specialized Hospital Chronic Follow-up Care Unit, Gondar Town, Amhara region, Northwest Ethiopia. Gondar town is located at a distance of 727 km from Addis Ababa in the North and 185 km from the regional capital city of Bahir Dar (Figure 1). According to the 2007 Ethiopian census report, the country has a total population of 207,044, and more than half (108,924) of them are females.28 The population of Gondar town in 2021 is estimated to be 378,000.28 The University of Gondar's Specialized Referral Hospital is a teaching hospital serving approximately 5–7 million people throughout most of Amhara state and neighboring regions. Teaching hospitals play an important role in providing teaching, research, and community services. The facility has more than 500 inpatient beds and a range of specialties, including pediatrics, surgery, gynecology, psychiatry, HIV care, and outpatient clinics. The outpatient center has an ultrasound department, pharmacy, laboratory, CT scan, and an MRI room. Currently, the chronic follow-up care unit provides follow-up care services with the aid of 23 senior specialists, six general practitioners, and eight BSc nurses. About 4845 adult hypertensive patients visited the department between September 2012 and January 2022 for chronic care-related services.
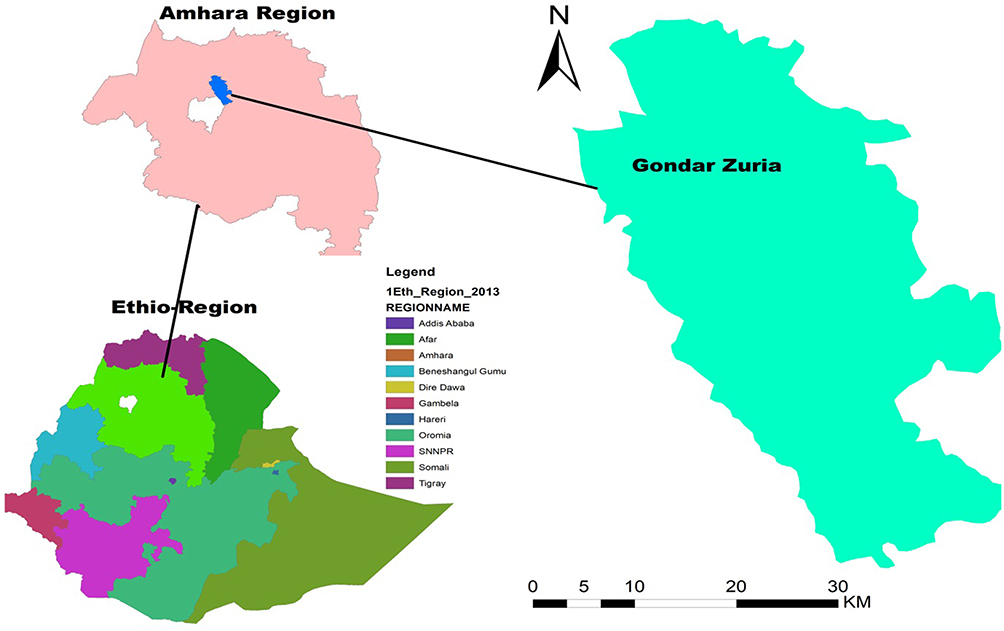 |
Figure 1 Location of study area (Gondar town), 2022. |
Source and Study Population
All adult hypertensive patients received chronic follow-up care at the University of Gondar Comprehensive Specialized Hospital.
All newly diagnosed adult patients with hypertension received chronic follow-up care at the University of Gondar Comprehensive Specialized Hospital between September 2012 and January 2022.
Inclusion and Exclusion Criteria
All hypertensive patients in the chronic follow-up care unit from September 2012 to January 2022, aged ≥18 years, and with at least 14 months of follow-up29 in the study area were included in the study.
Patients in chronic follow-up care whose records were incomplete for the evaluation of stroke and those who developed or diagnosed stroke at baseline were excluded from this study.
Sampling Procedure
At the University of Gondar Comprehensive Specialized Hospital, a list of patients with hypertension is available in the registration book. Those over the age of 18 years were chosen first from among those under the age of 18 years based on their medical record numbers. This study included 10 years of registered patients with hypertension, confirmed by health professionals. The study participants were selected using a simple random sampling technique after providing a continuous number for each medical record to minimize selection bias in selecting patients from a tertiary center (Figure 2).
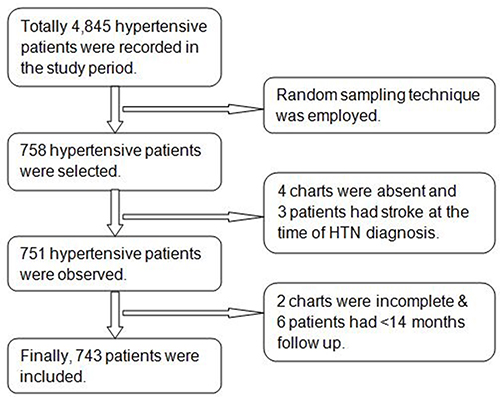 |
Figure 2 Flowchart of participant’s selection to estimate the risk of stroke among hypertensive patients in UOGCSH, 2012 to 2022. Abbreviation: UOGCSH, University of Gondar Comprehensive Specialized Hospital. |
Data Collection Tools and Procedures
A semi-structured data extraction tool was prepared, which was designed after analyzing several works in literature and prior studies of a similar nature, and then organized according to the objectives of the study. The proposed questionnaire was changed to an electronic data collection tool called the KoBoToolbox. A digital data-collection template was deployed after installing the KoBoCollect mobile application on the smartphone device of each data collector. Data were collected using KoBoCollect digital data collection tools, which were written in English and included three sections: descriptive factors of patients with hypertension, prognostic markers, and prognostic determinants. The data gathering method involved eight professional data collectors and one supervisor. Nurses working in the chronic follow-up care unit extracted the required data from patient charts under the supervision of the hospital, and senior physicians or neurologists working in the department adjudicated the events. Patient medical records were accessed from 17/06/2022 to 08/07/2022.
Quality Assurance
The customized data extraction tool was validated by the researchers prior to data extraction. Before data extraction, a pre-test was conducted by taking 38 (5%) of the total sample size to ensure the presence of the recorded variables and to ensure that the data collectors and supervisors were competent enough to collect and supervise the data collection process. Consequently, the number of unrecorded variables in the data extraction tool is minimized. One day of training was provided to data collectors and supervisors. The training covered how to use the KoBoCollect digital data extraction tool, how to access records and approach each item in patient records, and data handling. During the data extraction process, the selected supervisor and principal investigator provided close supervision and the collected data were checked for completeness. This quality check was performed daily after data collection, and corrections were performed.
Data Management and Analysis
Data collected using the KoBoCollect digital data collection tool were exported to STATA 16 and R 4.1.3 software for further processing and statistical analysis. Before the analysis, the data were cleaned and coded. Descriptive analysis: means, standard deviations (SD), counts, percentages, and multicollinearity were calculated. The incidence of stroke was determined. Nineteen predictors were assessed using the chi-squared test. Predictors were selected using a multivariable logistic regression analysis at a significance level of p<0.05. These predictors were quantified as coefficients with 95% confidence intervals (CI) to build the prediction model. Moreover, machine learning algorithms, such as random forest, decision tree, and artificial neural network, were applied to compare the results with those of the multivariable logistic regression model. Artificial Neural Network (ANN) and decision tree were computed using a multilayer perceptron (MLP) mathematical function and Chi-square Automatic Interaction Detection (CHAID) algorithm, respectively. BlueSky statistics version 7.5 was used to compute the random forest, and SPSS Version 25 software was used for ANN and decision tree. The total data was randomly divided in to 30% and 70% for testing and training, respectively. Conventionally, the majority of samples are used to train the algorithm to represent every subgroup in the data.30 The best combination of predictors for the machine-learning algorithms was identified using the highest log-likelihood.
Predictor’s Selection
The least Absolute Shrinkage and Selection Operator (LASSO) is a variant of penalized estimation. This approach penalizes the sum of the absolute values of the regression coefficients. This causes some coefficients to become zero. Predictors with zero coefficients are excluded from the model. Predictors with non-zero coefficients were included in the final multivariable binary logistic regression model. All the risk predictors were changed to categorical variables to develop a nomogram.
Missing Data Management
Missing data are unavoidable in long-term studies and can lead to bias and imprecision. Patterns of missingness were assessed using missingness logistic regression for each missing value. If the p-value was <0.05, the assumption of missing data completely at random (MCAR) was violated. With missing random assumptions, multiple imputations were employed to minimize bias and prevent eliminating participants from the study.31 Imputations typically fail when there are large amounts of missing data. Therefore, predictors with more than 50% missing data were excluded from this study.32
Model Development and Validation
Stroke risk was predicted using a predictive nomogram. A combination of potent predictors was identified using a reduced model to develop a risk-prediction model. Finally, sex, place of residence, baseline diastolic blood pressure (DBP), diabetes melitus (DM), comorbidities, and uncontrolled hypertension were selected based on their better discrimination power and calibration of the model performance. In addition, it was used to determine the association between the occurrence of these factors.
The domain included hypertensive patients who received chronic follow-up care at the University of Gondar Comprehensive Specialized Hospital (UOGCSH).
Theoretical Design


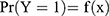 , where Y=1 indicates a stroke and Y=0 indicates no strokes.

The determinants were sex, residence, baseline DBP, DM, comorbidities, and uncontrolled HTN, and the domain was hypertensive patients.

Nomogram Development
A risk prediction nomogram was constructed based on the original beta coefficients from the output of multivariable binary logistic regression. The final reduced model was used to develop a nomogram. Based on the developed clinical prediction model, the Youden index was used to estimate the cutoff point for predicted stroke probability and risk stratification.
Mobile Web-Based Application Development
To make the nomogram accessible to physicians and patients, an offline mobile web-based application tool was developed to predict the risk of stroke in hypertensive patients.
Model Performance Evaluation
Model performance was evaluated based on Brier score, discrimination, and calibration ability. Model calibration in model performance was measured in terms of agreement between the predicted and observed stroke risks.33 The calibration ability of the model was evaluated statistically; if it was not significant, the model had a high predictive ability or was appropriate and accurate for prediction. Optimum calibration occurs when the calibration plot aligns with a 45-degree inclination at an intercept of zero and a slope of 1.34 According to the Hosmer–Lemeshow test statistics, which had an insignificant (p-value >0.05) result, the predictors in the final reduced model produced a well-fitted model.
AUROC was used to evaluate discrimination (the capacity to distinguish between stroke and no stroke) with 95% confidence interval. If AUROC is <0.5 a chance result, between 0.5 and 0.7 poor accuracy, between 0.7 and 0.9 good accuracy, and >0.9 excellent discrimination ability, then 1 is the ideal one which is perfect discrimination.35 Predictive performance was also evaluated using a density plot that illustrated the capacity to distinguish hypertensive patients with a risk of stroke (cases) from those without a risk of stroke (non-case). The model had 100% accuracy in predicting the future if the density plot between cases and non-cases did not overlap.
Internal Validation
Bootstrapping methods were used to internally validate the regression coefficients with their 95% confidence intervals and the AUC.36 Randomly selected bootstrap samples (10,000) with replacements were obtained from a dataset that contained full data on all predictors. Predictive performance of the model after bootstrapping is considered as the performance that may be expected when the model is applied to upcoming populations with comparable characteristics. The overall model performance was evaluated using the Brier score. Better predictions are indicated by smaller numbers (close to zero). Perfect accuracy was represented by a Brier score of 0, whereas perfect inaccuracy was represented by a score of 1.
Cutoff Point Determination
For statistical stability and practical usability, the estimated probability of stroke was reported based on three cutoff point categories. The categories were arbitrarily chosen at random, with a view to the reasonable size of each category toward public health sensibility and an acceptable size for each group. The result was later changed to a binary “prediction test”, allowing each hypertensive patient to be categorized as having a high or low stroke risk. Sensitivity analysis was performed at cutoff values of 0.15, 0.16, 0.20, 0.22, and 0.24. Calculations were performed for the sensitivity, specificity, positive and negative predictive values, and likelihood ratios of each score.
Decision Curve Analysis
Decision curve analysis (DCA) was conducted to assess the net benefit across a range of threshold probabilities and the model’s effects on clinical and public health (0 to 1),37 in the DCA. The model was contrasted with the “intervention for all” and “no intervention” extreme situations. In this case, the intervention under consideration was counseling and treating high-risk hypertensive patients to promote lifestyle modifications and medication compliance.

True- and false-positive counts refer to the number of patients with both true- and false-positive results, whereas n refers to the total number of patients. In summary, we subtracted the proportion of all patients who were false-positives from the proportion of true-positive patients, weighted by the proportional harm of false-positive and false-negative results. Transparent reporting of a multivariable prediction model for individual prognosis or diagnosis (TRIPOD) statement was followed in this study.38
Ethical Consideration
Ethical approval was obtained from the Ethical Review Committee of the Institute of Public Health, College of Medicine and Health Sciences, University of Gondar, with the reference number IPH/2107/2014. An official letter was obtained from the University of Gondar Compressive Specialized Hospital as it complies with the Declaration of the Helsinki. Informed consent was not obtained directly from the study participants as it was entirely secondary. Verbal consent was obtained from the hospital’s chief director and clinicians on behalf of their patients. The confidentiality and privacy of patient records were preserved by excluding names from the extraction form in favor of the (MRN), although the institution was asked for permission to use their patient’s information.
Results
Missing Data Management
Missing values for the following six candidate predictors ranged from 17.9% to 39.8%: smoking (26.9%), alcohol drinking (27.3%), total cholesterol (17.9%), HDL (37.4%), LDL (39.8%), and triglyceride (21.1%). Marital status, educational status, high-fat diet, regular exercise, non-adherence to medication, and obesity were excluded from the analysis because they were absent in a significant section of the patient population.
Patterns of missingness were assessed for each missing value by examining the frequency distribution of predictors. Total cholesterol, triglyceride, HDL, and LDL were predictors of missingness, and associations were identified among the four predictors. Considering that the pattern of missingness is missing at random (MAR) multivariable multiple-imputation technique was employed to manage missing data. The number of imputations was determined using STATA version 16 after installing the package “how_many_imputations”; M for the imputed datasets was 121. The standard error (SE) estimates were typically changed by less than 5% when the data were imputed again with the same number of imputations.
Socio-Demographic and Behavioral Characteristics of the Study Participants
Among a total of 758 patients newly diagnosed with hypertension, 2% of patients were excluded because of incompleteness for the assessment of stroke. A total of 743 hypertensive patients were included in the analysis, and 14.9% developed the stroke. The completeness of this study was 98%. The mean age of the study participants was 56.28 years (SD 12.89). The majority (58.01%) of them were females and more than three-quarters (77.93%) were urban residents. Approximately 383 (51.55%) of the study participants had reduced salt intake from meals. The vast majority (89.23%) of the patients were non-smokers and (58.14%) were drinking alcohol at baseline (Table 1).
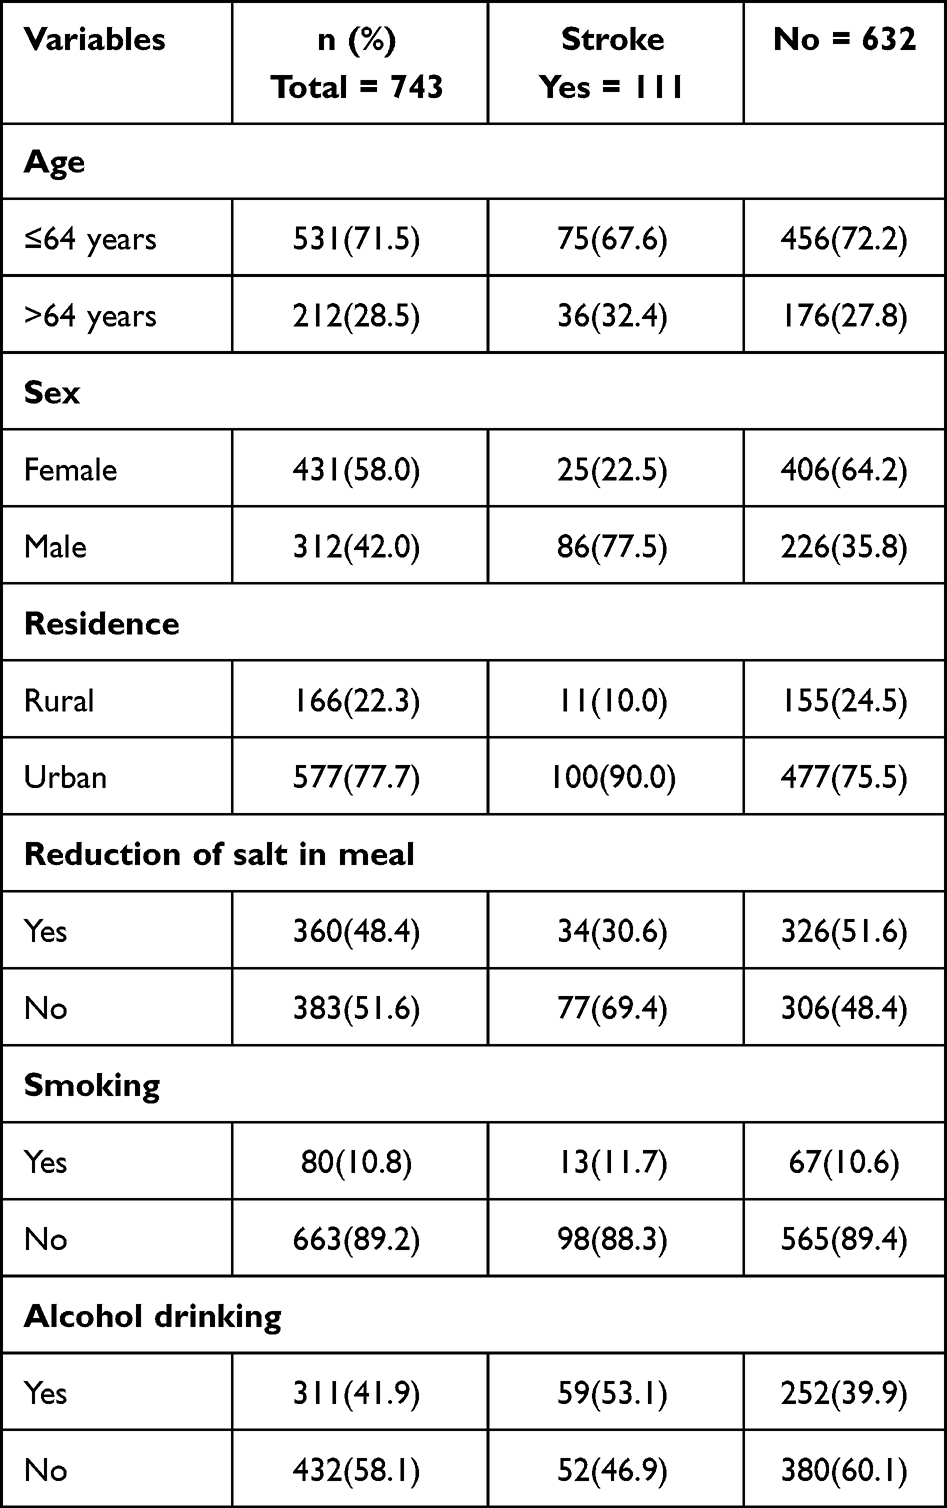 |
Table 1 Baseline Socio-Demographic and Behavioral Characteristics of Hypertensive Patients at UoGCSH from 2012 to 2022 (n=743) |
Clinical Characteristics of the Study Participants
Regarding family history of stroke, about 634 (85.33%) of the patients had no family history of stroke. Nearly half (47.11%) of the had DM. Three-fourths (74.97%) of the patients had controlled hypertension. Two-thirds (66.62%) and nearly two-thirds (63.66%) of HTN patients had high levels of LDL and triglycerides, respectively. In relation to baseline blood pressure status, approximately 445 (59.89%) of the participants had ≥160mmHg SBP and 416 (55.99%) had ≥100mmHg DBP (Table 2).
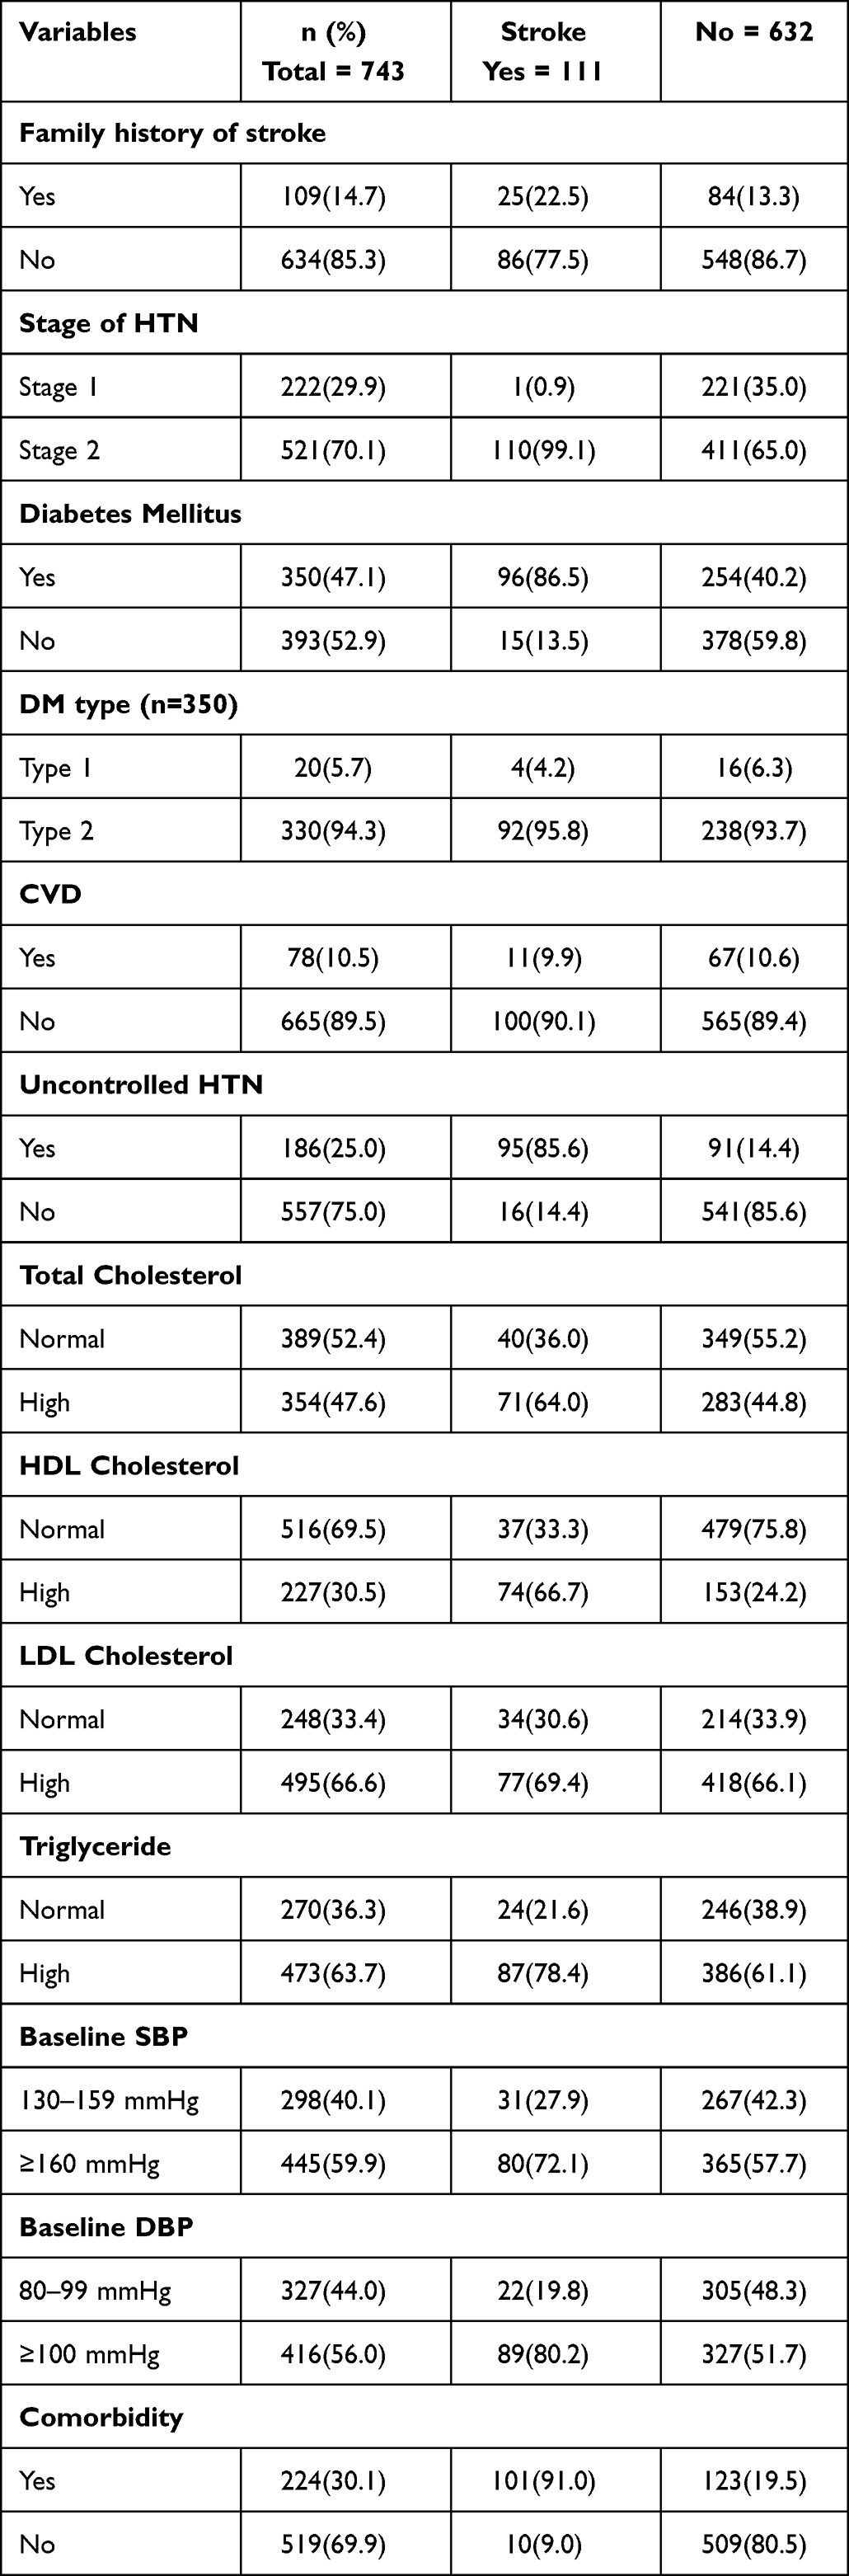 |
Table 2 Baseline Clinical Characteristics of Hypertensive Patients at UoGCSH from 2012 to 2022 (n=743) |
Incidence of Stroke
The incidence of stroke among hypertensive patients in the University of Gondar Comprehensive Specialized Hospital was 31.4 per 1000 person-years (95% CI: 26.0, 37.7). Among the 111 patients had a stroke, which was diagnosed by CT-Scan (70.27%) and MRI (20.72%), and the remaining, clinically. Of the stroke patients, 86 (77.48%) were males and 100 (90.1%) were urban residents. Regarding the type of stroke, 86 (77.48%) cases had ischemic stroke, and 25 (22.52%) cases were hemorrhagic stroke. Diabetes mellitus was a common comorbidity among stroke patients and that accounted for 86.49%, followed by uncontrolled hypertension (85.58%). Regarding biomarkers, 69.37%, 78.38%, 66.67%, and 63.96% of stroke patients had high levels of LDL, triglycerides, HDL, and total cholesterol, respectively.
A Prediction Model for Risk of Stroke
The final reduced multivariable regression analysis retained nine predictors: sex, residence, baseline SBP, baseline DBP, comorbidity, diabetes mellitus, uncontrolled hypertension, HDL, and triglycerides. Model development utilized each significant coefficient in the final reduced model. The final reduced model AUC was 0.984 (95% CI, 0.971, 0.996) (S1 Figure). The Hosmer–Lemeshow goodness-of-fit test had a p-value of 0.8694, and a p-value of 0.094 in the calibration test showed that the model represented the data (Table 3).
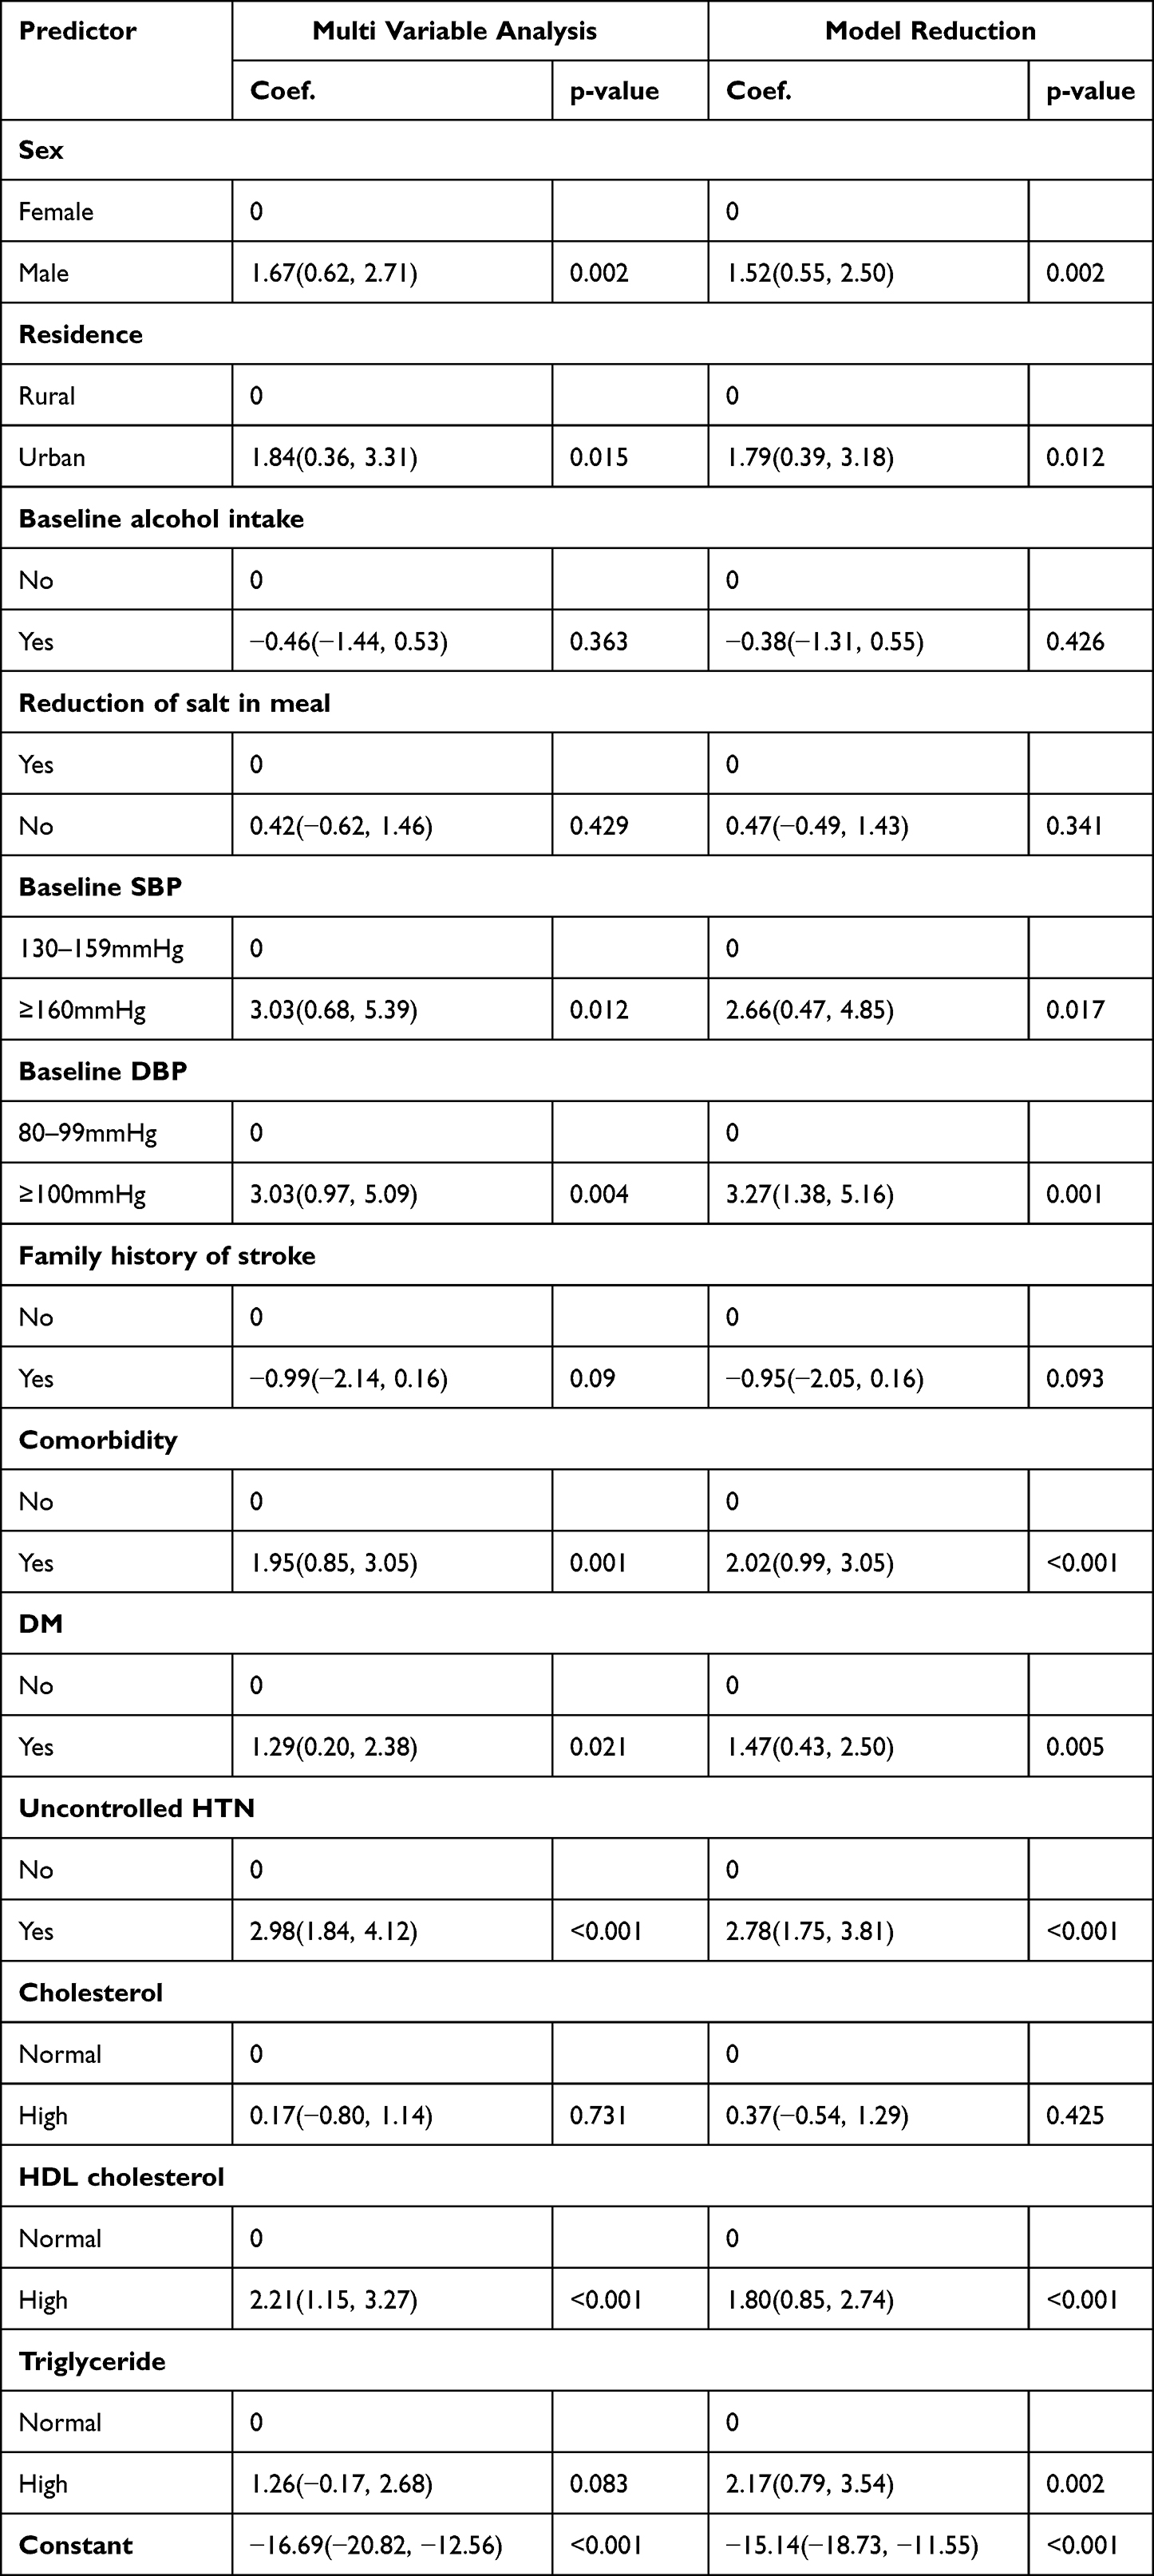 |
Table 3 Multivariable Logistic Regression Coefficients of Each Predictor Included in the Final Reduced Model to Predict Stroke Among Hypertensive Patients (n = 743) |
Development and Validation of a Risk Prediction Model
The prediction model was constructed using multivariable logistic regression model coefficients based on six identified predictors (uncontrolled HTN, DM, comorbidity, baseline DBP, residence, and sex), which can be easily identified to assist health-care providers in discriminating patients with a high risk of stroke, enabling them to implement preventive measures as early as possible. To simplify the determination of the predicted probability of stroke in patients with hypertension, a prediction model was developed, internally validated, and then transformed into a nomogram. The nomogram visualizes the model in a user-friendly manner.
Model Performance Evaluation
With AUROC ranging from 0.57 to 0.85, individual predictors in the final reduced model perform relatively poorly in discriminating the risk of stroke among hypertensive patients. However, when combined, they exhibit good discriminatory qualities. The accuracy of the model’s prediction when combining sex, place of residence, and baseline DBP was 0.86 (95% CI: 0.83, 0.89), it was 96.92% when combined with comorbidities and uncontrolled HTN (95% CI: 95.5, 98.3%). Finally, using the original beta coefficients, the final reduced model with six predictors showed an area under the ROC curve of 97.3% (95% CI: 95.9, 98.7%) (Figure 3).
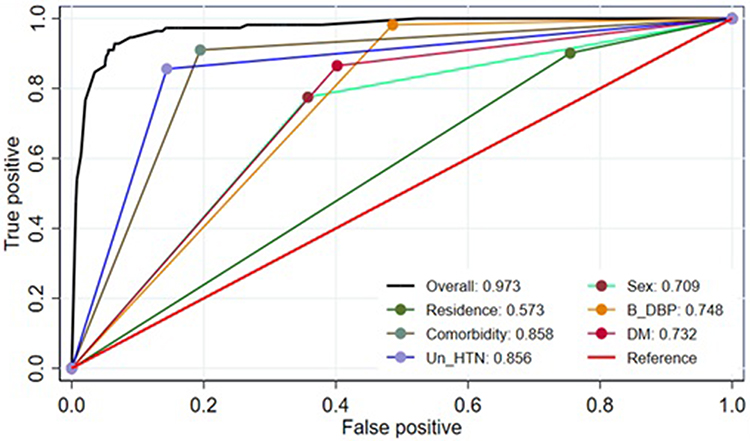 |
Figure 3 The ROC curve represents the probability of risk for stroke among hypertensive patients at UoGCSH, 2012–2022. Abbreviations: Un_HTN, Uncontrolled Hypertension; B_DBP, Baseline Diastolic Blood Pressure, DM, Diabetes Mellitus; ROC, Receiver Operator Characteristics. |
The developed model was well calibrated (p-value = 0.774), which indicated that the model presented the data well or that there was agreement between the observed outcome and the predicted probability (Figure 4).
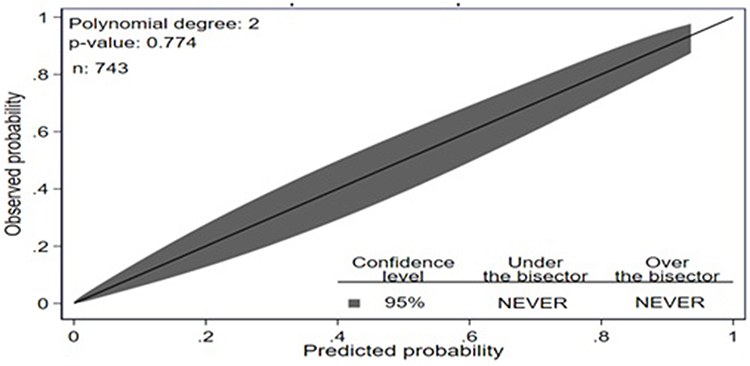 |
Figure 4 Calibration plot for developed model based on original beta coefficient for stroke prediction model among hypertensive patients at UoGCSH, 2012–2022. Abbreviation: UOGCSH, University of Gondar Comprehensive Specialized Hospital. Notes: 95% CI calibration belts are plotted in dark gray. The black diagonal line is the reference line indicating perfect calibration. |
Internal Validation
Bootstrapping was used to validate the model using 10,000 replacement runs to check for bias and overfitting of the created model. AUROC was evaluated based on bootstrap dataset coefficients, considering the bias caused by bootstrapping and nomograms. The optimism correction estimate is calculated by subtracting the predicted performance from the actual performance, which is close to zero. AUC=0.973 (95% CI: 0.959, 0.987) (Figure 5) indicates that the model with the coefficient result was internally valid, and the calibration plot p-value was 0.774 (Figure 6).
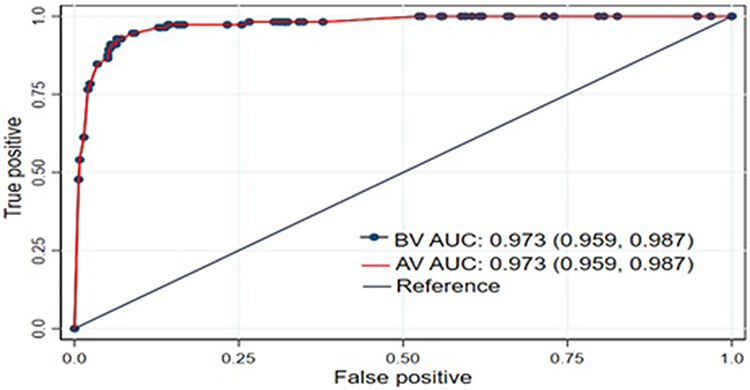 |
Figure 5 The ROC curve represents the probability of risk of stroke among hypertensive patients after internal validation at UoGCSH, 2012–2022. Abbreviations: BV, Before Validation; AV, After Validation; UOGCSH, University of Gondar Comprehensive Specialized Hospital; ROC, Receiver Operator Characteristics. |
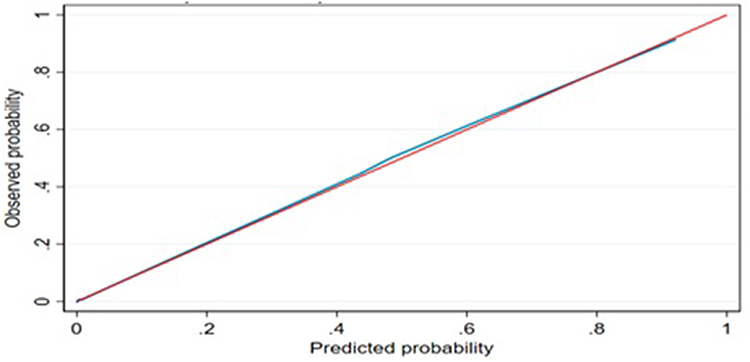 |
Figure 6 Calibration plot for a risk prediction model of stroke among hypertensive patients after internal validation at UoGCSH, 2012–2022. Abbreviation: UOGCSH, University of Gondar Comprehensive Specialized Hospital. |
Prediction Density Plot
In terms of a prediction density plot, the model’s ability for separating hypertensive patients with and without risk of stroke was also evaluated. The green line represented by “1” (cases) and the red one represented by “0” (non-cases) did not overlap. As a result, our model is excellent at predicting or differentiating between hypertensive patients at risk for stroke and those who are not (Figure 7).
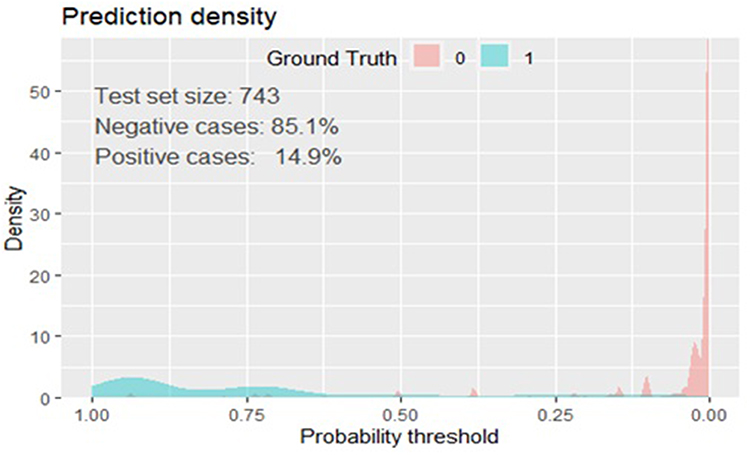 |
Figure 7 Prediction density plot for developed model using original beta coefficients at UoGCSH, 2012–2022. Abbreviation: UOGCSH, University of Gondar Comprehensive Specialized Hospital. |
Overall Model Performance
The Brier score is superior to other statistical performance metrics such as AUC because it takes both discrimination and calibration into account simultaneously. Better predictions are indicated by smaller numbers (close to zero). Perfect accuracy is represented by a Brier score of zero, whereas perfect inaccuracy is represented by a score of 1.39 The Brier score of the model was 0.03, which indicated better accuracy for the probabilistic prediction risk of stroke with a correlation of 0.83 and ROC curve of 0.973 (p-value < 0.001).
Nomogram
Nomogram interpretation: The observed value of each feature predictor is assigned a certain number of points by drawing a vertical line towards the bottom of the nomogram score (Figure 8). The sum of the points for each predictor corresponds to the individual risk of stroke. Assuming that an urban resident of a female hypertensive patient has a baseline DBP ≥ 100mmHg, uncontrolled blood pressure, comorbidity (CKD), but no diabetes, we can calculate the score of each feature of the patient according to the value of each predictor: female (0 points) + urban resident (4.4 points) + baseline DBP ≥ 100mmHg (10 points) + uncontrolled blood pressure (7 points) + comorbidity (5.8 points) + no diabetes (0 points) = 27.2 total points (S1 Table). From the total point scale, a line perpendicular to the risk scale at the bottom shows that the probability of stroke occurrence was approximately 35% (high risk).
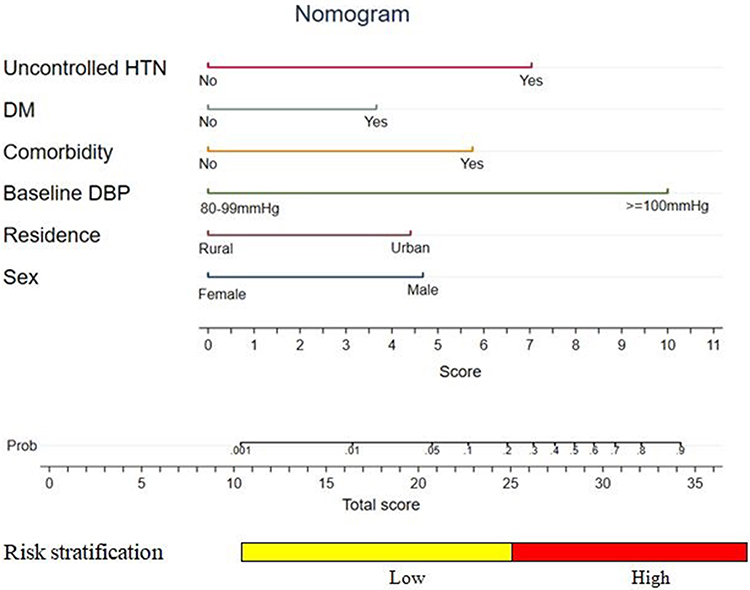 |
Figure 8 Nomogram for predicting the risk of stroke in hypertensive patients at UoGCSH, 2012–2022. Abbreviations: UOGCSH, University of Gondar Comprehensive Specialized Hospital; HTN, Hypertension; DM, Diabetes Mellitus; DBP, Diastolic Blood Pressure. Notes: Stroke risk prediction with nomogram = sex (1.52) + residence (1.79) + baseline DBP (3.27) + DM (1.47) + comorbidity (2.02) + uncontrolled HTN (2.78). |
A Mobile Web-Based Application
The probability of stroke was calculated from the total score of the nomogram using the scores of the predictors. A mobile web-based stroke risk-prediction model was built using the risk classification of the nomogram to facilitate its clinical applicability (Figure 9).
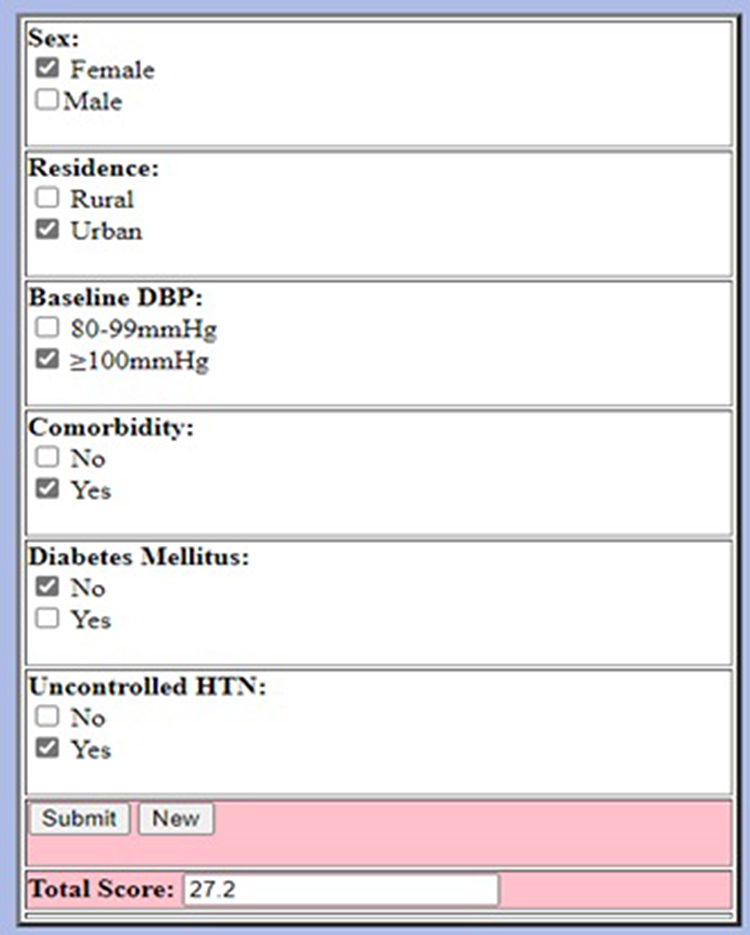 |
Figure 9 Mobile web-based stroke risk prediction model at UoGCSH, 2012–2022. Abbreviation: UOGCSH University of Gondar Comprehensive Specialized Hospital. |
Determination of Optimal Cutoff Values for the Nomogram
The optimal cutoff value for the highest Youden index (sensitivity+specificity-1) was 0.2003. The created model was used to predict stroke in the participants and to classify the recruited patients into three risk categories: low-, intermediate-, and high-risk. The cutoff points were categorized as follows: <0.2003 (low risk), between 0.2003 and 0.624 (intermediate risk), and ≥0.624 (high-risk) (Table 4). When we dichotomized to low risk (<0.2003) and high risk (≥0.2003) based on the cutoff points, the low-risk group included 595 (80.1%) hypertensive patients, 8 (1.3%) of whom had stroke. The high-risk group included 148 (19.9%) hypertensive patients, 103 (69.6%) of whom had stroke. The sensitivity 92.79% (95% CI: 86.29, 96.83), specificity 93.51% (95% CI: 91.30, 95.30), accuracy 93.41% (95% CI: 91.37, 95.08), positive predictive value (PPV) 71.53% (95% CI: 63.41, 78.73), negative predictive value (NPV) 98.66% (95% CI: 97.38, 99.42), positive likelihood ratio (PLR) (14.3%), and negative likelihood ratio (NLR) (0.08%) (S2 Table).
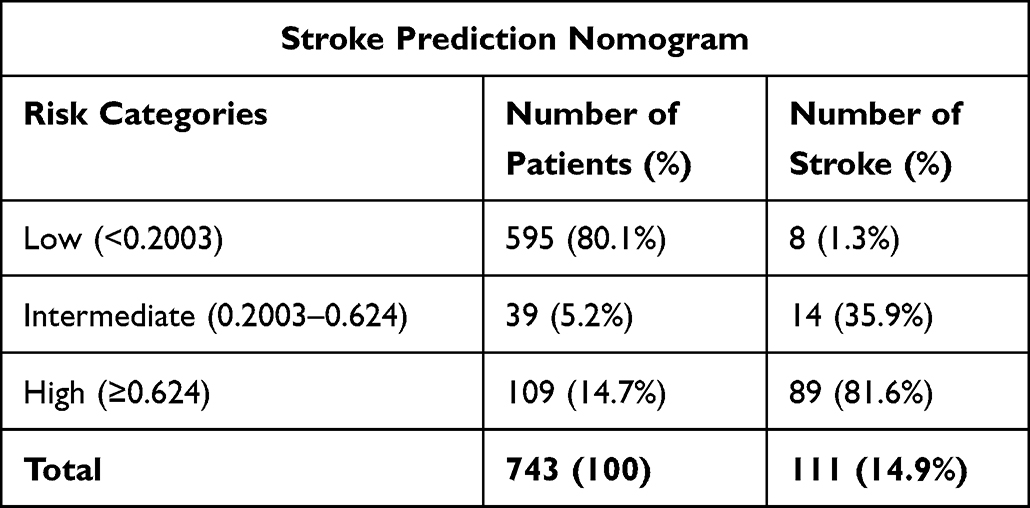 |
Table 4 Risk Classification of Stroke Among Hypertensive Patients Using a Nomogram (n=743) |
Decision Curve Analysis
The model had the highest net benefit across the full range of threshold probabilities, as illustrated in Figure 10, which clearly shows its highest clinical and public health values. Therefore, counseling and treatment decisions made using the model have a higher net benefit than not counseling and treating at all or counseling and treating at all, regardless of the risk threshold. For example, at the 0.2 threshold probability risk cutoff, the net benefit was approximately 82%, which was equivalent to performing 82 further risks of stroke screenings per 100 hypertensive patients without false estimation of stroke risk.
 |
Figure 10 Decision curve analysis for the nomogram plotting net benefit of the model against threshold probability at UoGCSH, 2012–2022. Abbreviation: UOGCSH, University of Gondar Comprehensive Specialized Hospital. Notes: The y-axis represents a standardized net benefit. The thick red solid line is a nomogram used to predict stroke risk. The thin red solid line represents the 95% CI. The black solid line represents the assumption that all patients had no stroke. The gray solid line represented the assumption that all patients had stroke. |
Machine Learning Algorithms
Artificial Neural Network (ANN)
The multilayer perceptron ANN diagram comprised 13 input variables, nine neurons in the first hidden layer, seven neurons in the second hidden layer, and two output levels (no and yes stroke response). The input variables included sex, residence, salt reduction, systolic BP, diastolic BP, stroke history, comorbidities, diabetes mellitus, uncontrolled HTN, cholesterol, HDL, LDL, and triglycerides. In the second phase, variables with normalized importance were used for the ANN model analysis. Finally, five predictors with high levels of importance were selected.
We estimate the Normalized Importance Index for the input predictors. Uncontrolled HTN, comorbidity, and baseline SBP had the highest influence, as indicated by their normalized importance indices (100%, 92.7%, and 92.2%, respectively), followed by LDL (normalized importance index = 89.8%). The normalized importance index of the remaining input variables gradually decreased but never reached zero (S3 Table).
Finally, five predictors were selected based on their importance in the model development (Figure 11). Overall, the network had a fairly high accuracy, evidenced by the percentage of incorrect classifications in the training and testing stages, which were 5% and 3.3%, respectively.
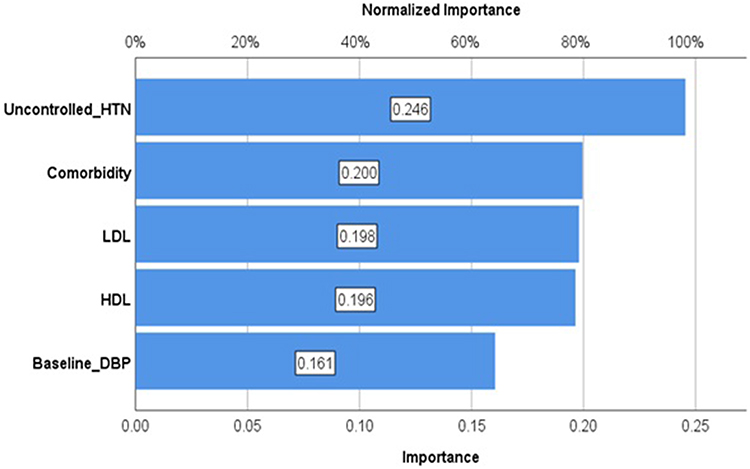 |
Figure 11 The ANN estimated importance of final selected predictors in classifying stroke at UoGCSH, 2012–2022. Abbreviations: ANN, Artificial Neural Network; UOGCSH, University of Gondar Comprehensive Specialized Hospital. |
Performance of ANN Model
At 0.44 cutoff point, the overall accuracy of the model was 95.29% (95% CI: 93.50%, 96.70%). The sensitivity and specificity of the ANN model were significantly high 90.09% (95% CI: 82.96%, 94.95%) and 96.20% (95% CI: 94.40%, 97.55%), respectively, with positive predictive value of 80.65% (95% CI: 72.58%, 87.19%) and negative predictive value of 98.22 (95% CI: 96.84%, 99.11%). The area under the ROC was 97.34% (95% CI: 95.83%, 98.84%).
Decision Tree and Random Forest
A decision tree model was used as the second machine learning algorithm to identify potent predictors for estimating the risk of stroke. Thirteen predictors were used for the classification using CHAID algorithm. A total of 512 (68.9%) and 231 (31.1%) samples were used to train and test the model, respectively (S2 and S3 Figures), using a random allocation technique. Consequently, 9 and 5 nodes and terminal nodes were obtained, respectively. Overall performance of the model was excellent, as evidenced by the percentages of incorrect classifications in the training and testing stages, which were 1.2% and 1.9%, respectively. A random forest algorithm was used to avoid the limitation (overfitting) of the decision tree. Four predictors were identified using random forest (baseline DBP, baseline SBP, comorbidity, and uncontrolled HTN) with 96.5% (95.1, 97.9) discriminating power and 92.2% (90.0, 94.0) accuracy.
Comparison of Multivariable Logistic Regression Model and Machine Learning Algorithms
Each model was constructed using different predictors and was validated using a testing set and bootstrap re-sampling. The artificial neural network (ANN) and multivariable logistic regression models had the same discriminating power 97.3% (Table 5). However, the ANN included biomarkers that were not easily measurable (uncontrolled HTN, comorbidity, LDL, HDL, and baseline DBP), and the calibration was poor (p = 0.043). The accuracy of test was high in ANN model 95.29% (95% CI: 93.50, 96.70) and specificity of 96.20% (95% CI: 94.40, 97.55) (Figure 12 and S4 Table).
 |
Table 5 Overall Model Performance Evaluation Using the Brier Score for Machine Learning and Multivariable Logistic Regression Model at UoGCSH, 2012–2012 |
 |
Figure 12 AUROC curves of the machine learning algorithm and multivariable logistic regression at UoGCSH, 2012–2022. Abbreviations: LR, logistic regression; ANN, artificial neural network; DT, decision tree; RF, Random Forest; UOGCSH, University of Gondar Comprehensive Specialized Hospital. |
Discussion
This study developed a quantifiable and simple nomogram to predict the risk of stroke in hypertensive patients at the University of Gondar Comprehensive Specialized Hospital. In the present study, the incidence of stroke was 31. Four events per 1000 person-years (95% CI: 26.0, 37.7). This study created a practical nomogram with six predictors (sex, place of residence, baseline DBP, comorbidity, diabetes mellitus, and uncontrolled hypertension), which were the best combinations of hypertensive patient variables for predicting stroke. Without employing sophisticated laboratory or imaging procedures, this study examined the predicted effectiveness of a model using the features of patients with hypertension.
The individual predictors of stroke risk among hypertensive individuals were good and their combined effect was excellent. A greater total score on the nomograms indicated a higher risk of stroke, and the prediction model fitted the data well. The model demonstrated high prediction performance for both the development and validation datasets. In terms of development and internal validation, the area under the AUROC was 0.973. This means the ability to discriminate between hypertensive patients who are at high risk and low risk for stroke was 97% using predictive nomogram.
Zheng et al developed a model to predict the risk of acute ischemic stroke in geriatric patients with primary hypertension in China with performance in the development and validation cohorts AUROC of 0.730 and 0.725, respectively, by taking into account factors such as smoking, alcohol use, blood pressure control, stroke history, diabetes, and carotid artery stenosis.40 However, the model is less useful because some of the variables utilized, including carotid artery stenosis, are not readily available in standard clinical and public health practices.
Although the performance of the developed model was good, it was still inferior to our model because of less accurate estimation. The model was constructed using data from patients older than 60 and a two-year follow-up study, which could be one explanation. In addition, they used the sample-split technique to validate the model, and the validation performance was less effective than the development performance. The sample split may have limitations because it is difficult to measure the optimism coefficient and the limited sample size was accompanied by a high number of variables, which led to overfitting of the model’s performance. However, a bootstrap resampling (10,000 times) validation technique, which assesses performance by calculating the optimism coefficient and validating the results with a sufficient sample size, was used to validate our model. Our prediction model includes factors that are accessible and sufficiently accurate for use in health-care settings by mid- and lower-level health-care providers. Four of the hypertensive patient features in our model can be quickly determined from their history, and two are determined by physical examination.
In a study of adults over 45 years of age in China,26 the development performance for a 2-year new-onset stroke risk prediction model was AUROC 0.707 and the validation performance was 0.710. Even if the model was valid, it performed poorly in differentiating between low and high risk, whereas our model performed very well with sensitivity, specificity, and positive and negative predictive values of 92.79%, 93.51%, 71.53%, and 98.66%, respectively. The cutoff point for risk of stroke in our model based on this coefficient was 20%. The positive likelihood ratio was 14.3, and the negative likelihood ratio was 0.08. The accuracy rate was 93.4%. According to a study conducted in China, the cutoff points for sensitivity, specificity, and accuracy were 77.4%, 54.5%, and 54.7%, respectively. Compared to our study, this finding has low specificity and accuracy, which could increase the number of false positives and make it difficult to reliably rule out a low risk of stroke. Additionally, there were more false positives.
A decision curve analysis was used to assess the effects of the model on clinical and public health. Although the model’s performance in terms of discrimination and calibration was evaluated, it may not be used in a clinical setting unless it has therapeutic significance. Our model assumes that deciding to counsel and treat high-risk hypertensive patients promotes lifestyle modifications and medication compliance. DCA contrasts the created model with two extreme cases: counseling and treating every patient with hypertension, and not counseling and treating every patient with hypertension, regardless of risk. When compared to not counseling and treating everyone and counseling and treating everyone regardless of risk, the created model had the highest net benefit ratio, starting at a threshold probability >0. This finding suggests that decisions regarding counseling and treatment based on the model created for the best possible treatment and investigation have clinical and public health relevance.
The outcomes of the machine learning algorithms were compared to those of multivariable logistic regression analysis, the traditional reference standard, in several articles. In our study, considering discrimination, calibration, and overall model performance, no clear difference was observed in performance between the machine learning algorithms and the logistic regression model. This finding is in agreement with those of several previous studies.41,42
This study has several advantages. First, the model is built using a sufficient number of events per predictor variable. Second, the bootstrapping technique was used to evaluate our model internally, and the optimism coefficient was near zero, indicating that our model was less sample dependent. Third, the prediction model is relevant because it was developed using easily measurable predictors. Fourth, the outcomes of the machine learning algorithms were compared with those of the multivariable logistic regression analysis, and a similar performance was identified. Finally, a mobile web-based stroke risk model was developed using the risk classification of the nomogram owing to its easy applicability.
The following limitations should be considered when interpreting the conclusions of this study: Due to the fact that it is a single-site study, it must first have external validation before being used to another setting. Physical exercise, high-fat diet, obesity, nonadherence to medication, marital status, and educational status were not examined; however, these factors have been identified in other studies as crucial stroke risk factors. As a result, the study lost important predictors from the model.
Conclusion and Recommendation
Our nomogram and mobile web-based risk model can be used as a simple, easily measurable, affordable, and implementable tool to predict a person’s risk of stroke in a university of Gondar hypertensive patients. Early identification of at-risk individuals and aggressive intervention at an early stage can provide advanced strategies from a preventive, predictive, and individualized intervention perspective.
A nomogram developed to estimate the risk of stroke among patients with hypertension was built with excellent discriminating power, good calibration, and internal validity. Sex, residence, uncontrolled HTN, comorbidity, DM, and baseline DBP were used for the prediction model development and also visualized using a nomogram and a mobile web-based stroke risk model, which is useful for its clinical application.
The predictive nomogram will help stratify the risk of stroke in patients with hypertension and identify those at a higher risk. A neurologist or senior clinician can then be contacted to provide a second evaluation, better counseling, and management for high-risk groups. To improve chronic follow-up treatment and reduce hypertension-related stroke problems, a realistic prediction model should be used.
Abbreviations
ANN, Artificial Neural Network; AUC, Area under the Curve; BP, Blood Pressure; CI, Confidence Interval; CVD, Cardiovascular Disease; DBP, Diastolic Blood pressure; DCA, Decision Curve Analysis; DM, Diabetes Mellitus; HTN, Hypertension; LASSO, Least Absolute Shrinkage and Selection Operator; ROC, Receiver Operator Characteristics; SBP, Systolic Blood Pressure; UoGCSH, University of Gondar Comprehensive Specialized Hospital; WHO, World Health Organization.
Acknowledgments
YMC would like to thank the University of Gondar, College of Medicine and Health Science, Institute of Public Health, for giving them the opportunity to develop this thesis and for providing Internet access, and Mizan Aman College of Health Science, which gave them a chance to learn a second degree.
Disclosure
The authors report no conflicts of interest in this work.
References
1. Khanna R, Wilson AS, Gregor JC, Prowse KL, Afif W. Clinical guidelines for the management of IBD. Gastroenterology. 2021;161(6):2059–2062. doi:10.1053/j.gastro.2021.09.021
2. Namale G, Kamacooko O, Kinengyere A, et al. Risk factors for hemorrhagic and ischemic stroke in Sub-Saharan Africa. J Trop Med. 2018;2018:1–11. doi:10.1155/2018/4650851
3. Kibret KT, Mesfin YM. Prevalence of hypertension in Ethiopia: a systematic meta-analysis. Public Health Rev. 2015;36(1). doi:10.1186/s40985-015-0014-z
4. Mills KT, Stefanescu A, He J. The global epidemiology of hypertension Katherine. Physiol Behav. 2016;176:139–148.
5. Zhou B, Perel P, Mensah GA, Ezzati M. Global epidemiology, health burden and effective interventions for elevated blood pressure and hypertension. Nat Rev Cardiol. 2021;18(11):785–802. doi:10.1038/s41569-021-00559-8
6. Aberhe W, Mariye T, Bahrey D, Zereabruk K, Hailay A, Mebrahtom G. Prevalence and factors associated with uncontrolled hypertension among adult hypertensive patients on follow-up at Northern Ethiopia, 2019: cross-sectional study. Pan Afr Med J. 2020;36:1–14. doi:10.11604/pamj.2020.36.1.22528
7. Abate AT, Bayu N, Mariam TG. Hypertensive Patients’ Knowledge of Risk Factors and Warning Signs of Stroke at Felege Hiwot Referral Hospital, Northwest Ethiopia: a Cross-Sectional Study. Neurol Res Int. 2019;2019:1–7. doi:10.1155/2019/8570428
8. Shackelford BK. Health complications of hypertension persistent high blood pressure can result in multiple problems with the heart and blood vessels problems with the eyes stroke and other brain issues; 2021:1–4.
9. Wittenauer BR, Smith L. Priority Medicines for Europe and the World “A Public Health Approach to Innovation” Update on 2004 background paper written by Eduardo Sabaté and Sunil Wimalaratna Background Paper 6. 6 Ischaemic and Haemorrhagic Stroke. World Health Organization; 2012.
10. Gorelick PB. The global burden of stroke: persistent and disabling. Lancet Neurol. 2019;18(5):417–418. doi:10.1016/S1474-4422(19)30030-4
11. Mathers C, Bernard C, Iburg K. Global burden of disease in 2002: data sources, methods and results. Glob Program Evid Heal Policy Discuss [Internet]. 2004; 2003: 1–116. Available from: http://www.who.int/entity/healthinfo/paper54.pdf.
12. Mathers CD, Loncar D. 2005-Updated_projections_of_global_mortality_and_burden_of_disease_2002-2030_data_sources_methods_and_results; 2002.
13. Feigin VL, Norrving B, Mensah GA. Global Burden of Stroke. Circ Res. 2017;120(3):439–448. doi:10.1161/CIRCRESAHA.116.308413
14. Strong K, Mathers C, Bonita R. Preventing stroke: saving lives around the world. Lancet Neurol. 2007;6(2):182–187. doi:10.1016/S1474-4422(07)70031-5
15. Feigin VL, Lawes CMM, Bennett DA, Barker-Collo SL, Parag V. Worldwide stroke incidence and early case fatality reported in 56 population-based studies: a systematic review. Lancet Neurol. 2009;8(4):355–369. doi:10.1016/S1474-4422(09)70025-0
16. Powers WJ, Derdeyn CP, Biller J, et al. 2015 American Heart Association/American stroke association focused update of the 2013 guidelines for the early management of patients with acute ischemic stroke regarding endovascular treatment: a guideline for healthcare professionals from the American. Stroke. 2015;46(10):3020–3035. doi:10.1161/STR.0000000000000074
17. Misganaw A, Mariam DH, Ali A, Araya T. Epidemiology of major non-communicable diseases in Ethiopia: a systematic review. J Health Popul Nutr. 2014;32(1):1–13.
18. Misganaw A, Haregu TN, Deribe K, Tessema GA, Deribew A. National mortality burden due to communicable, non-communicable, and other diseases in Ethiopia, 1990 – 2015: findings from the Global Burden of Disease Study 2015. Popul Health Metr. 2017;15(1):1–17. doi:10.1186/s12963-016-0118-9
19. Alemayehu CM. Assessment of stoke patients: occurrence of unusually high number of haemorrhagic stroke cases in Tikur Anbessa Specialized Hospital, Addis Ababa, Ethiopia. Clin Med Res. 2013;2(5):94. doi:10.11648/j.cmr.20130205.11
20. Mulat B, Mohammed J, Yeseni M, et al. Of stroke and associated factors among patients Magnitude who attended the medical ward of Felege Hiwot Referral Hospital. Original article Magnitude of stroke and associated factors among patients who attended the medical ward of Felege Hiwot Referral. Res Gate. 2017;30:1–7.
21. Girum T, Mesfin D, Bedewi J, Shewangizaw M. The burden of noncommunicable diseases in Ethiopia, 2000 – 2016: analysis of evidence from global burden of disease study 2016 and Global Health Estimates 2016. Int J Chro Dis. 2020;2020:1–10. doi:10.1155/2020/3679528
22. Wolf PA, D’Agostino RB, O’Neal MA, et al. Secular trends in stroke incidence and mortality. The Framingham Study. Stroke. 1992;23(11):1551–1555. doi:10.1161/01.STR.23.11.1551
23. Seshadri S, Beiser A, Kelly-Hayes M, et al. The lifetime risk of stroke: estimates from the Framingham Study. Stroke. 2006;37(2):345–350. doi:10.1161/01.STR.0000199613.38911.b2
24. Zewudie AZ, Regasa T, Hambisa S, et al. Treatment outcome and its determinants among patients admitted to stroke unit of Jimma University Medical Center, Southwest Ethiopia. Stro Res Treat. 2020;2020:1–8. doi:10.1155/2020/8817948
25. D’Agostino RB, Wolf PA, Belanger AJ, Kannel WB. Stroke risk profile: adjustment for antihypertensive medication. The Framingham Study. Stroke. 1994;25(1):40–43. doi:10.1161/01.STR.25.1.40
26. Yao Q, Zhang J, Yan K, et al. Development and validation of a 2-year new-onset stroke risk prediction model for people over age 45 in China. Medicine. 2020;99(41):e22680. doi:10.1097/MD.0000000000022680
27. Dufouil C, Beiser A, McLure LA, et al. Revised Framingham stroke risk profile to reflect temporal trends. Circulation. 2017;135(12):1145–1159. doi:10.1161/CIRCULATIONAHA.115.021275
28. MacroTrends. Gondar, Ethiopia Metro Area Population 1950-2022. Availalbe from: https://www.macrotrends.net/cities/20926/gondar/population.
29. Sarfo FS, Mobula LM, Plange-Rhule J, Ansong D, Ofori-Adjei D. Incident stroke among Ghanaians with hypertension and diabetes: a multicenter, prospective cohort study. J Neurol Sci. 2018;395:17–24. doi:10.1016/j.jns.2018.09.018
30. Suvorov R. CaMLA Working Papers. CaMLA Work Pap. 2018;1:1–16.
31. Donders ART, van der Heijden GJMG, Stijnen T, Moons KGM. Review: a gentle introduction to imputation of missing values. J Clin Epidemiol. 2006;59(10):1087–1091. doi:10.1016/j.jclinepi.2006.01.014
32. Dietz K, Gail M, Krickeberg K, et al. Statistics for Biology and Health. Springer; 2000.
33. Steyerberg EW, Vickers AJ, Cook NR, et al. Assessing the performance of prediction models: a framework for traditional and novel measures. Epidemiology. 2010;21(1):128–138. doi:10.1097/EDE.0b013e3181c30fb2
34. Ahmed I, Debray TP, Moons KG, Riley RD. Developing and validating risk prediction models in an individual participant data meta-analysis. BMC Med Res Methodol. 2014;14:14. doi:10.1186/1471-2288-14-14
35. Carter JV, Pan J, Rai SN, Galandiuk S. ROC-ing along: evaluation and interpretation of receiver operating characteristic curves. Surgery. 2016;159(6):1638–1645. doi:10.1016/j.surg.2015.12.029
36. Efron B, Tibshorani RJ. An Introduction to the Bootstrap.
37. Vickers AJ, Cronin AM, Elkin EB, Gonen M. Extensions to decision curve analysis, a novel method for evaluating diagnostic tests, prediction models and molecular markers. BMC Med Inform Decis Mak. 2008;8(1):1–17. doi:10.1186/1472-6947-8-53
38. Collins GS, Reitsma JB, Altman DG, Moons KGM. Transparent reporting of a multivariable prediction model for individual prognosis or diagnosis (TRIPOD): the tripod statement. J Clin Epidemiol. 2015;68(2):112–121. doi:10.1016/j.jclinepi.2014.11.010
39. Assel M, Sjoberg DD, Vickers AJ. The Brier score does not evaluate the clinical utility of diagnostic tests or prediction models. Diagnostic Progn Res. 2017;1(1):1–7. doi:10.1186/s41512-017-0020-3
40. Zheng X, Fang F, Nong W, Feng D, Yang Y. Development and validation of a model to estimate the risk of acute ischemic stroke in geriatric patients with primary hypertension. BMC Geriatr. 2021;21(1):1–10. doi:10.1186/s12877-021-02392-7
41. Gravesteijn BY, Nieboer D, Ercole A, et al. Machine learning algorithms performed no better than regression models for prognostication in traumatic brain injury. J Clin Epidemiol. 2020;122:95–107. doi:10.1016/j.jclinepi.2020.03.005
42. Christodoulou E, Ma J, Collins GS, Steyerberg EW, Verbakel JY, Van Calster B. A systematic review shows no performance benefit of machine learning over logistic regression for clinical prediction models. J Clin Epidemiol. 2019;110:12–22. doi:10.1016/j.jclinepi.2019.02.004
 © 2023 The Author(s). This work is published and licensed by Dove Medical Press Limited. The
full terms of this license are available at https://www.dovepress.com/terms
and incorporate the Creative Commons Attribution
- Non Commercial (unported, 3.0) License.
By accessing the work you hereby accept the Terms. Non-commercial uses of the work are permitted
without any further permission from Dove Medical Press Limited, provided the work is properly
attributed. For permission for commercial use of this work, please see paragraphs 4.2 and 5 of our Terms.
© 2023 The Author(s). This work is published and licensed by Dove Medical Press Limited. The
full terms of this license are available at https://www.dovepress.com/terms
and incorporate the Creative Commons Attribution
- Non Commercial (unported, 3.0) License.
By accessing the work you hereby accept the Terms. Non-commercial uses of the work are permitted
without any further permission from Dove Medical Press Limited, provided the work is properly
attributed. For permission for commercial use of this work, please see paragraphs 4.2 and 5 of our Terms.
Recommended articles
Dynamic Nomogram for Predicting the Fall Risk of Stroke Patients: An Observational Study
Wu Y, Jiang X, Wang D, Xu L, Sun H, Xie B, Tan S, Chai Y, Wang T
Clinical Interventions in Aging 2025, 20:197-212
Published Date: 25 February 2025
Machine Learning Analysis of Risk Factors for Catheter-Associated Urinary Tract Infections in Stroke Patients and Their Impact on Healthcare Quality
Lu L, Li X, Cai D, Mei C, Hong X, Xie J
International Journal of General Medicine 2026, 19:591432
Published Date: 8 April 2026