Back to Journals » Infection and Drug Resistance » Volume 15
Development and Validation of a Nomogram for the Prediction of Unfavorable Treatment Outcome Among Multi-Drug Resistant Tuberculosis Patients in North West Ethiopia: An Application of Prediction Modelling
Authors Anley DT ![]() , Akalu TY
, Akalu TY ![]() , Merid MW, Tsegaye T
, Merid MW, Tsegaye T ![]()
Received 26 April 2022
Accepted for publication 12 July 2022
Published 21 July 2022 Volume 2022:15 Pages 3887—3904
DOI https://doi.org/10.2147/IDR.S372351
Checked for plagiarism Yes
Review by Single anonymous peer review
Peer reviewer comments 2
Editor who approved publication: Professor Suresh Antony
Denekew Tenaw Anley,1 Temesgen Yihunie Akalu,2 Mehari Woldemariam Merid,2 Tewodros Tsegaye3
1Department of Public Health, College of Health Sciences, Debre Tabor University, Debre Tabor, Ethiopia; 2Department of Epidemiology and Biostatistics, Institute of Public Health, College of Medicine and Health Sciences, University of Gondar, Gondar, Ethiopia; 3Department of Internal Medicine, School of Medicine, College of Medicine and Health Sciences, University of Gondar, Gondar, Ethiopia
Correspondence: Denekew Tenaw Anley, Department of Public Health, Debre Tabor University, 272, Debre Tabor, Amhara Region, Ethiopia, Email [email protected]
Background: Multidrug-resistant tuberculosis (MDR-TB) is a global problem and a health security threat, which makes “Ending the global TB epidemic in 2035” unachievable. Globally, the unfavourable treatment outcome remains unacceptably high. Therefore, this study aimed to develop a risk prediction model for unfavorable treatment outcomes in MDR-TB patients, which can be used by clinicians as a simple clinical tool in their decision-making.
Objective: The objective of this study was to develop and validate a risk prediction model for the prediction of unfavorable treatment outcomes among MDR-TB patients in North-West Ethiopia.
Methods: We used MDR-TB data collected from the University of Gondar and Debre Markos referral hospitals. A retrospective follow-up study was conducted and a total of 517 patients were included in the study. STATA version 16 statistical software and R version 4.0.5 were used for the analysis. Descriptive statistics were carried out. A multivariable model was fitted using all potent predictors selected by the lasso regression method. A simplified risk prediction model (nomogram) was developed based on the binomial logit-based model, and its performance was described by assessing its discriminatory power and calibration. Finally, decision curve analysis (DCA) was done to evaluate the clinical and public health impact of the developed model.
Results: The developed nomogram comprised six predictors: baseline anemia, major adverse event, comorbidity, age, marital status, and treatment supporter. The model has a discriminatory power of 0.753 (95% CI: 0.708, 0.798) and calibration test of (P-value = 0.695). It was internally validated by bootstrapping method, and it has a relatively corrected discrimination performance (AUC = 0.744, 95CI: 0.699, 0.788). The optimism coefficient was found to be 0.009. The decision curve analysis showed the net benefit of the model as threshold probabilities varied.
Conclusion: The developed nomogram can be used for individualized prediction of unfavorable treatment outcomes in MDR-TB patients for it has a satisfactory level of accuracy and good calibration. The model is clinically interpretable and was found to have added benefits in clinical practice.
Keywords: prediction, unfavourable treatment outcome, multidrug-resistant tuberculosis, Ethiopia
Background
Tuberculosis (TB) is caused by the bacillus mycobacterium tuberculosis, and it is one of the top infectious killers globally.1,2 Multi-drug-resistant tuberculosis (MDR-TB) is a serious clinical condition that remains a global public health concern.1
The global MDR-TB crisis is the result of low access to treatment for MDR-TB and poor treatment outcomes. According to the WHO report of 2020, only 1 in 3 MDR-TB patients accessed treatment of half a million people who fell ill with it in 2019.1 Another condition which makes MDR-TB a global health security threat is the low global treatment success rate and the emergence of XDR-TB mostly as a result of treatment failure in MDR-TB patients. The disease also results in job and income loss. The combination of lost income and extra costs is generally catastrophic for the affected individuals and their families. Studies showed that 38–92% of patients reported income loss and 26–76% of TB patients lost their jobs due to unfavorable outcomes of MDR-TB, further worsening the financial problem.12
The current global pandemic, coronavirus disease-19 (COVID-19), may reverse the whole progress made so far for the “Ending the global TB epidemic” come true.1 The Stop TB partnership study suggested that the COVID-19 pandemic could cause an additional 6.3 million TB cases globally between 2020 and 2025.5 Predictions made regarding the impact of COVID-19 on TB showed that the burden of global TB disease and associated outcomes may go to the level that it was in 2012 and 2015.1,5 The condition is more frightening when it comes to MDR-TB. This impact of COVID-19 together with the global low level of MDR-TB treatment success rate will make MDR-TB a more serious threat to mankind, possibly more so than it has ever been before.
Globally, only 57% of MDR-TB patients are successfully treated.1 Africa is one of the WHO regions where the high burden of MDR-TB (25% new cases) is found next to the WHO Southeast Asian region (44% of new cases). The 85–89% of the global burden of MDR-TB is found in 30 High Burden Countries (HBCs) identified by WHO.1,3
The WHO 2016 global report had put Ethiopia as one of the HBCs for MDR-TB and TB/HIV co-infection.4 However, Ethiopia has good achievements in fighting against tuberculosis disease.5 Between 2012 and 2013 culture DST services expanded to different regional laboratories across the country to increase case finding and prompt treatment initiation. By the end of 2016, a total of 46 MDR-TB initiation centers (TIC) and 658 TFCs were functional where the country had been implementing a decentralized ambulatory MDR-TB treatment service delivery model.5
Despite the implementation of different tuberculosis-related programs so far, to bring MDR-TB under control, it remains to be a threat for Ethiopia with its unacceptably high level of unfavorable treatment outcomes ranging from 12.5% to 45.1% in different health institutions across the country.6–10 As WHO 2020 global report revealed the country has annual estimated cases of above 3300.1 In the country, there is an increasing trend of MDR-TB, low notification and treatment of MDR-TB compared to the estimated percentage of new cases, and an unacceptably high level of unfavourable treatment outcomes among MDR-TB patients contributing to the emerging of XDR-TB which is difficult for the health system to manage and the affected individuals to cope-up and survive.11,12
Studies identified different predictors of unfavourable treatment outcomes among MDR-TB patients. Older age, baseline alcohol use, illicit drug use, pulmonary TB (PTB) with extra pulmonary involvement, cavitary disease, culture-positive at baseline, relapsed TB, treatment non-compliance, previous TB treatment, longer treatment duration, diagnosis during hospitalization or in the emergency unit, adverse events, and history of second-line drug resistance are among significant predictors.6,8,9,13–24 Studies have also shown baseline anemia, comorbidities, and medical complications as prognostic determinants in MDR-TB patients.9,15,17,18,20,22,25–29,46
As evidenced by different studies, the outcomes of treatment vary with individual patients, which points to the importance of developing and using patient-centered models of care, one of which could be developing individual patient’s risk prediction models for unfavourable MDR-TB treatment outcomes. Hence, this study was aimed at developing a model for the prediction of unfavourable treatment outcomes among MDR-TB patients in Ethiopia, particularly North West Ethiopia. This model would be used as a simple clinical tool to help clinicians in their decision-making based on a more objectively estimated probability of MDR-TB treatment outcome in the future, thereby lives will be saved and further development of XDR-TB will be prevented.
Methods
Study Design and Setting
A multi-center retrospective follow-up study was conducted from September 2010 to July 2020 among MDR-TB patients in two Treatment Initiating Centers (TICs) of North West Ethiopia. The first TIC was the University of Gondar Compressive Specialized Hospital (UoGCSH). It is located 737 km away from Addis Ababa, the capital city of Ethiopia. The hospital is one of the biggest tertiary-level teaching and referral hospitals in the region. It has a capacity of more than 500 beds. The hospital serves as a referral center for 5 million populations in the North Gondar administrative zone and the surrounding region. It has been providing MDR-TB treatment since September 2010 and about 450 MDR-TB patients have been enrolled since the beginning of the treatment initiation. The hospital started offering a new short-term regimen of MDR-TB treatment in 2018, and more than fourteen patients were treated to date.
The second TIC was Debre Markos Referral Hospital, which is found 300 km far from Addis Ababa. The hospital provides health services to more than 3.5 million populations. It has 140 beds with about 152 staff for inpatient and outpatient services. The hospital has a TB/HIV clinic as well as MDR-TB ward used for diagnosis and treatment of MDR-TB patients. The hospital started MDR-TB diagnosis and treatment initiation service in 2015. It enrolled 95 MDR-TB patients and received 31 transferred patients since then, making a total of 126 MDR-TB patients served in the hospital so far.
Population and Sample
The source population was all MDR-TB patients enrolled in North West Ethiopia, whereas patients enrolled in the two TICs were the study population. All MDR-TB patients who had follow-ups at the UoGCSH and Debre Markos referral hospital were included in the study. Patients for whom the outcome was not ascertained and those who were on treatment were excluded. The sample size was calculated ensuring the number of events per parameter (EPP) of ≥10.30 This method is the most frequently used which is a conventional rule of thumb for minimizing the problem of overfitting in multivariable prediction modelling. A more recently conducted study in Saint Peter in Addis Ababa was used to calculate the sample size.8
The sample size was calculated as follows:

where EPP is the number of events per parameter, n is the sample size, ⏀ is the overall rate of the outcome and P is the number of parameters to be involved in the model development. Rearranging Equation (1), the minimum sample size was written as follows:


Taking an EPP of ≥10 and the number of parameters of 22 and ⏀ of 0.451 from the aforementioned study, the sample size (n) calculated using Equation (2) was found to be 488. Therefore, the minimum sample size was 488 MDR-TB patients for whom the outcome was ascertained in the two selected hospitals of North West Ethiopia. Then, all patients who fulfilled the inclusion criteria were included in the study, and the analysis was done on a total of 517 patients.
Variables of the Study
The outcome variable was unfavourable treatment outcome (yes/no). It was defined as the treatment outcome of patients being death or treatment failure or LTFU.31 Age, sex, residence, treatment supporter, educational status, marital status, baseline sputum culture, baseline radiological abnormality, baseline smear result, registration type, major adverse events, site of MDR-TB, type of resistance, resistance to second-line drugs, complications, presence of HIV co-infection and other comorbidities, baseline BMI, baseline anemia, baseline alcohol drinking, baseline smoking, and baseline khat use were prognostic determinants.
Data Collection Procedure and Quality Control
A structured data extracting tool (checklist) was developed using different literature and piece of evidence available on the medical charts of patients. Predictors of unfavourable treatment outcomes such as sociodemographic factors, treatment-related factors, laboratory-related factors, comorbidities, and behavioural factors were extracted. Body Mass Index (BMI) of patients was calculated by taking the baseline weight in kilogram and dividing it by height in meter squared. MDR-TB registration book and individual patient’s medical cards were used for data extraction. The data was collected by four clinical nurses working at Debre Markos referral hospital and UoGCSH from March 4 to April 4/2021. Data quality was managed by training and appropriate supervision of data collectors. Overall supervision was made by the supervisor and principal investigator. The collected data were checked for completeness, clarity, accuracy, out-of-range values, and missing values. The quality checking was done consistently daily after, and a correction was made before the next data collection measures.
Data Processing and Analysis
The coded data containing demographic, clinical, and behavioural variables were entered into Epi-info version 7. Then, it was exported to STATA version 16 statistical software and R version 4.0.5 for analysis. Variables with missing values were baseline alcohol use 30 (5.8%), baseline smoking status 42 (8.1%), comorbidity 10 (1.9) and marital status 12 (2.3%), educational status 15 (2.9%), and baseline anemia status 11 (2.1). The variable income was dropped because it was missed for the majority of observations 368 (71.2%). The missing data was managed by multiple imputation techniques using the “mice” package in r assuming that the data were missed at random (MAR). The imputation process was performed on the whole dataset and 5 imputed datasets were generated. Sensitivity analysis was done to investigate the plausibility of the MAR assumption. Descriptive statistics, frequencies, and percentages were done for categorical variables. The normality distribution test was done using the Kolmogorov–Smirnov test. Incidence was calculated to determine the occurrence of unfavourable treatment outcomes.
For the multivariable prediction model development, the theoretical design is that; the incidence of unfavourable treatment outcome at a future time “t” is a function of prognostic determinants like demographic factors, clinical factors, and behavioural factors measured or ascertained at one or more time points before the occurrence of the unfavourable treatment outcome, ie, “t0” which is the moment of prognostication. It was written in the following way;

Model Development and Validation
The Least Absolute Shrinkage and Selection Operator (LASSO) algorithm was used to select the most potent predictors. Penalized regression method was preferred for feature selection to develop unbiased and most parsimonies unfavourable treatment outcome risk prediction model by minimizing the problem of overfitting.32
Variables were considered for multivariate unfavourable treatment outcome prediction model development based on their easy obtainability, biologically plausible relationship with the outcome, and ease of interpretation in clinical practice. The lasso model with optimum shrinkage factor and minimum cross-validation mean deviance was selected to take predictors with non-zero coefficients for multivariable logistic regression analysis.
The most potent predictors selected by LASSO regression were incorporated into the multivariable analysis. Then, variables were removed from the multivariable model step by step to build a simplified reduced model at a significance level of <0.15 just to be more liberal. The final simplified risk prediction model was presented in the form of a nomogram, and its performance was described by assessing its discriminatory power and calibration. The discriminatory power of the simplified risk prediction model was determined by calculating c-statistics. The c-statistics might range from 0.5 (no predictive ability) to 1 (perfect discrimination).33,34 The developed risk prediction model was also assessed qualitatively by using Swets’s criteria, which values range from 0.5–0.6 (bad), 0.6–0.7 (poor), 0.7–0.8 (satisfactory), 0.8–0.9 (good), and 0.9–1.0 (excellent).35
The calibration of the model was presented graphically using the calibration plot and Hosmer–Lemeshow test. For the model calibration test, a value of P > 0.05 suggested a good model calibration. Bootstrap resampling (with 10,000 repetitions) of the original set was performed for internal model validation to calculate the relatively corrected C-statistics (AUC). Patients were classified as high and low risk of unfavourable treatment outcomes using the optimal cut-off point identified by the Youden index. The traditional risk prediction model performance measures (discrimination and calibration) could not address the issue of how useful the developed nomogram would be in clinical practice. Therefore, Decision Curve Analysis (DCA) was done to provide a clinically interpretable risk prediction model which could show the clinical and public health impact of using it. It was plotted by putting the net benefit of carrying out a specified intervention using the developed risk prediction model or intervention on all of the patients or none of them on the y-axis and the threshold probabilities on the x-axis. The study was reported per the TRIPOD (transparent reporting of a multivariable prediction model for individual prognosis or diagnosis) statement.36
Results
From September 2010 until April 2021, a total of 578 patients were enrolled and commenced with MDR-TB treatment in two hospitals in North West Ethiopia. Treatment outcomes were not recorded for 9 patients. The overall completeness of the study was 89.4% (Figure 1).
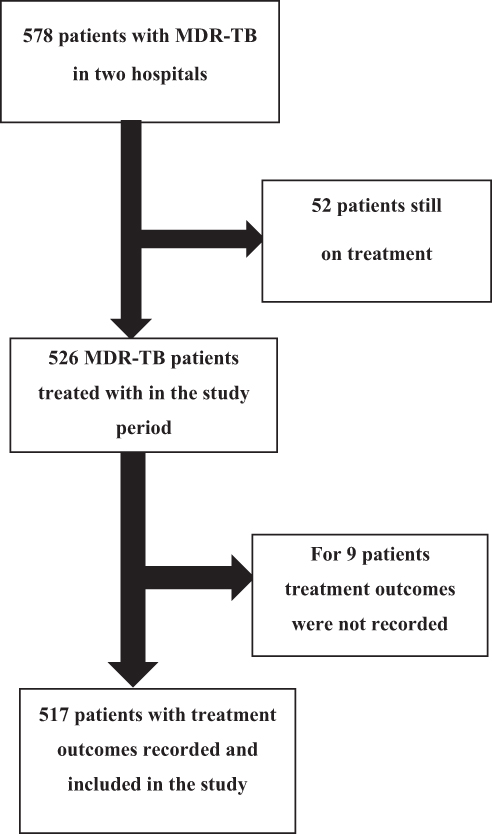 |
Figure 1 Flowchart of participant selection for the development of nomogram for prediction of unfavorable treatment outcome among MDR-TB patients, and reasons for exclusion, North West Ethiopia, September 2010 to July 2020. |
Socio-Demographic and Behavioural Characteristics
Of all, 321 (62.1%) of participants were male. The median age of participants was 30 years with an interquartile range (IQR) of 17 years. Regarding educational level, 37.3% of the study subjects were with no formal education. A total of 24 (4.6%) of study patients had a history of cigarette smoking and 42 (27.8%) participants had a history of alcohol use. Only 18 (3.8%) of patients had a history of khat use (Table 1).
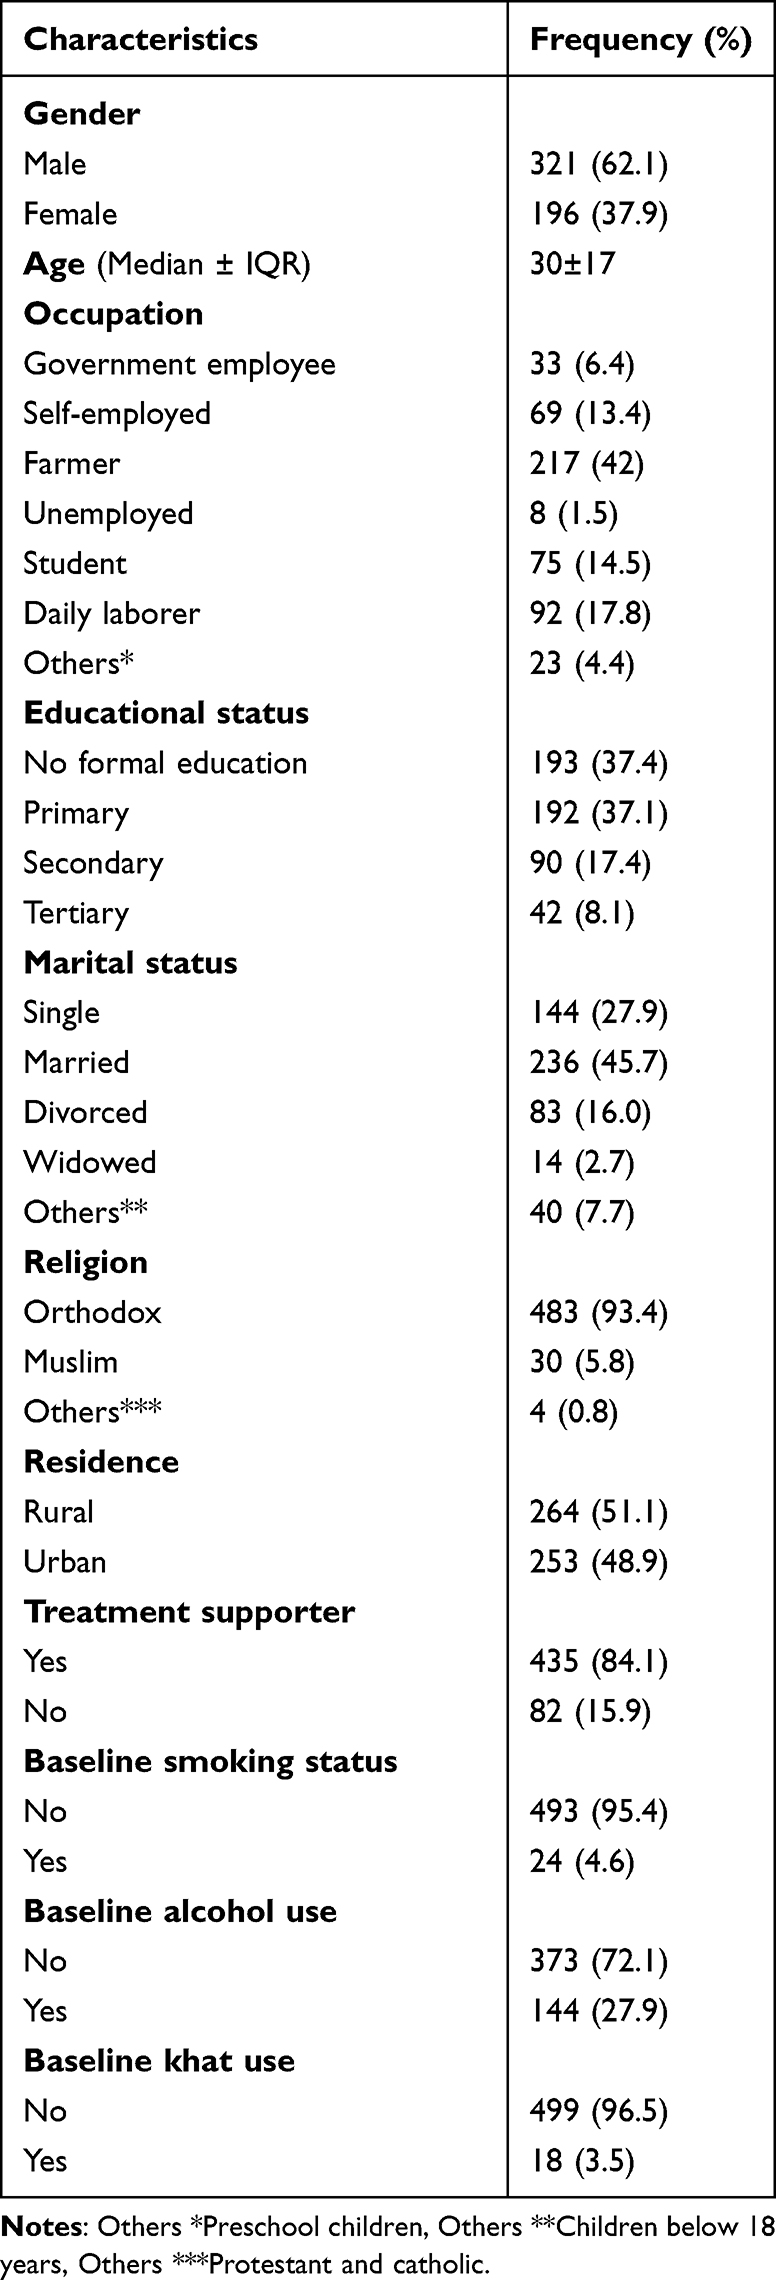 |
Table 1 Socio-Demographic and Behavioral Characteristics of MDR-TB Patients in North West Ethiopia, 2010 to 2020 (N = 517) |
Clinical Characteristics of MDR-TB Patients
Of all participants, 81.6% had a previous history of anti TB treatment. One-third of the total participants had comorbid conditions. Of all subjects, 25.9% were HIV positive. About 47.9% of the participants were anemic and most of them (83.2%) had radiological abnormalities. Most of the participants (60.9%) had rifampicin resistance TB (Table 2).
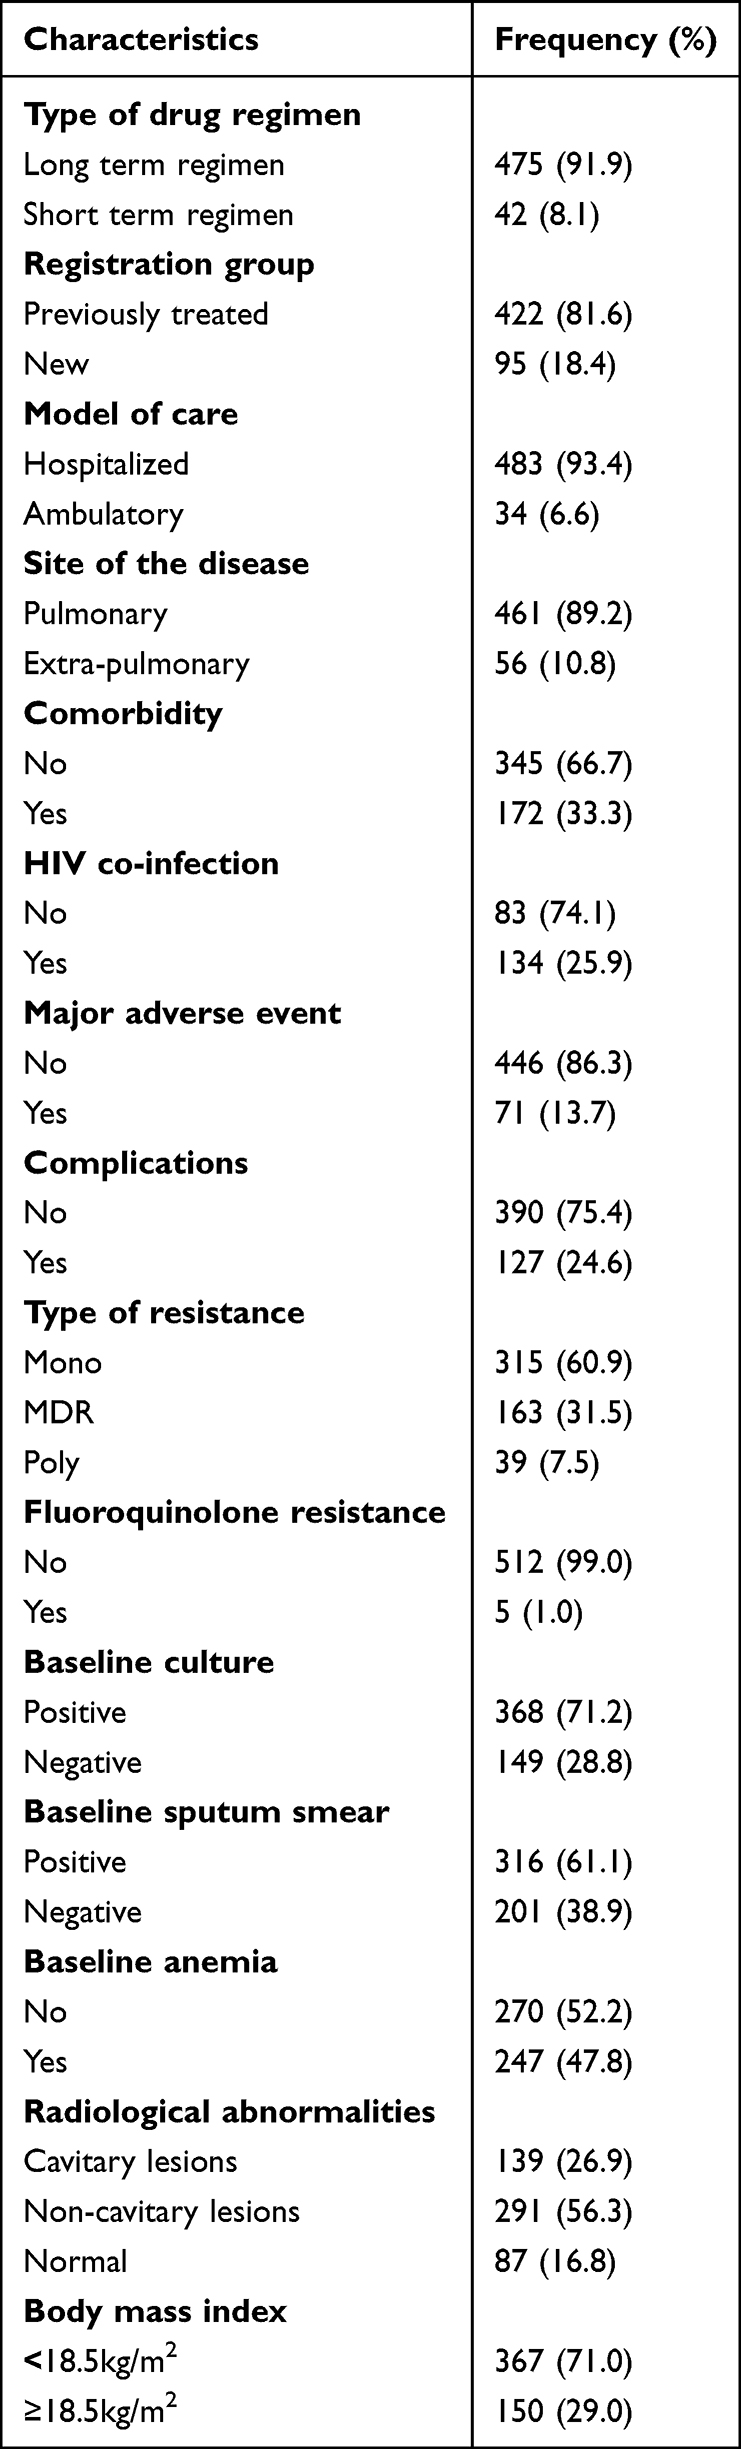 |
Table 2 Clinical Characteristics of MDR TB Patients in North West Ethiopia, 2010 to 2020 (N = 517) |
Treatment Outcomes
A total of 157 (30.4%) patients had unfavourable treatment outcomes. The remaining 69.6% of study subjects had successful treatment outcomes (Figure 2).
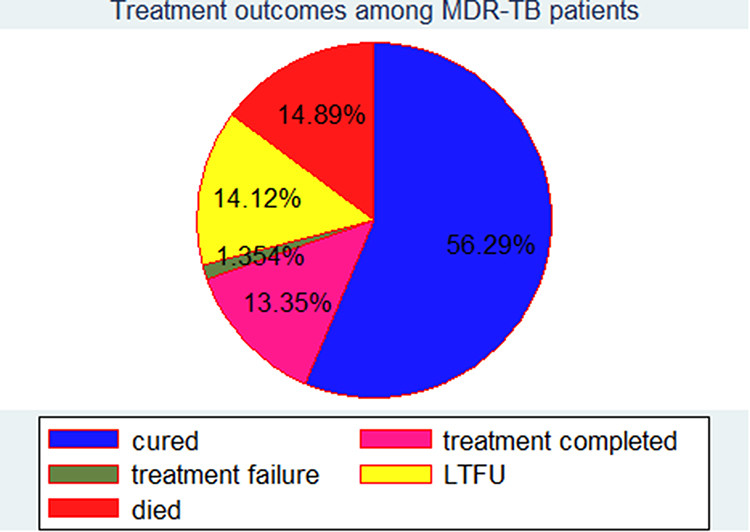 |
Figure 2 Treatment outcomes among MDR-TB patients in North West Ethiopia, September 2010 to July 2020. |
Variable Selection and Model Diagnosis
A total of 28 models were generated using LASSO regression with a 10-fold cross-validation selection method and LASSO estimator. The 24th model was found to be the most parsimonious model with an optimum penalty factor (lambda) of 0.014 and minimum cross-validation mean deviance. Among 22 co-variants entered in LASSO regression, 12 potential features (predictors) were selected.
The identified 12 potential predictors selected by lasso regression were incorporated into the multivariable analysis. These variables were baseline anemia, sex, age, major adverse events, residence, treatment supporter, educational status, baseline smoking, baseline alcohol use, baseline smear, and marital status.
Development of an Individualized Risk Prediction Model
An individualized unfavourable treatment outcome risk prediction model was developed based on multivariable binomial regression analysis using the identified potential predictors selected by the lasso algorithm. Most of the predictors are easily ascertainable right at patient enrolment time. The role of each predictor was assessed by reducing them one by one from the full multivariable model at a significant level of <0.15 (Table 3).
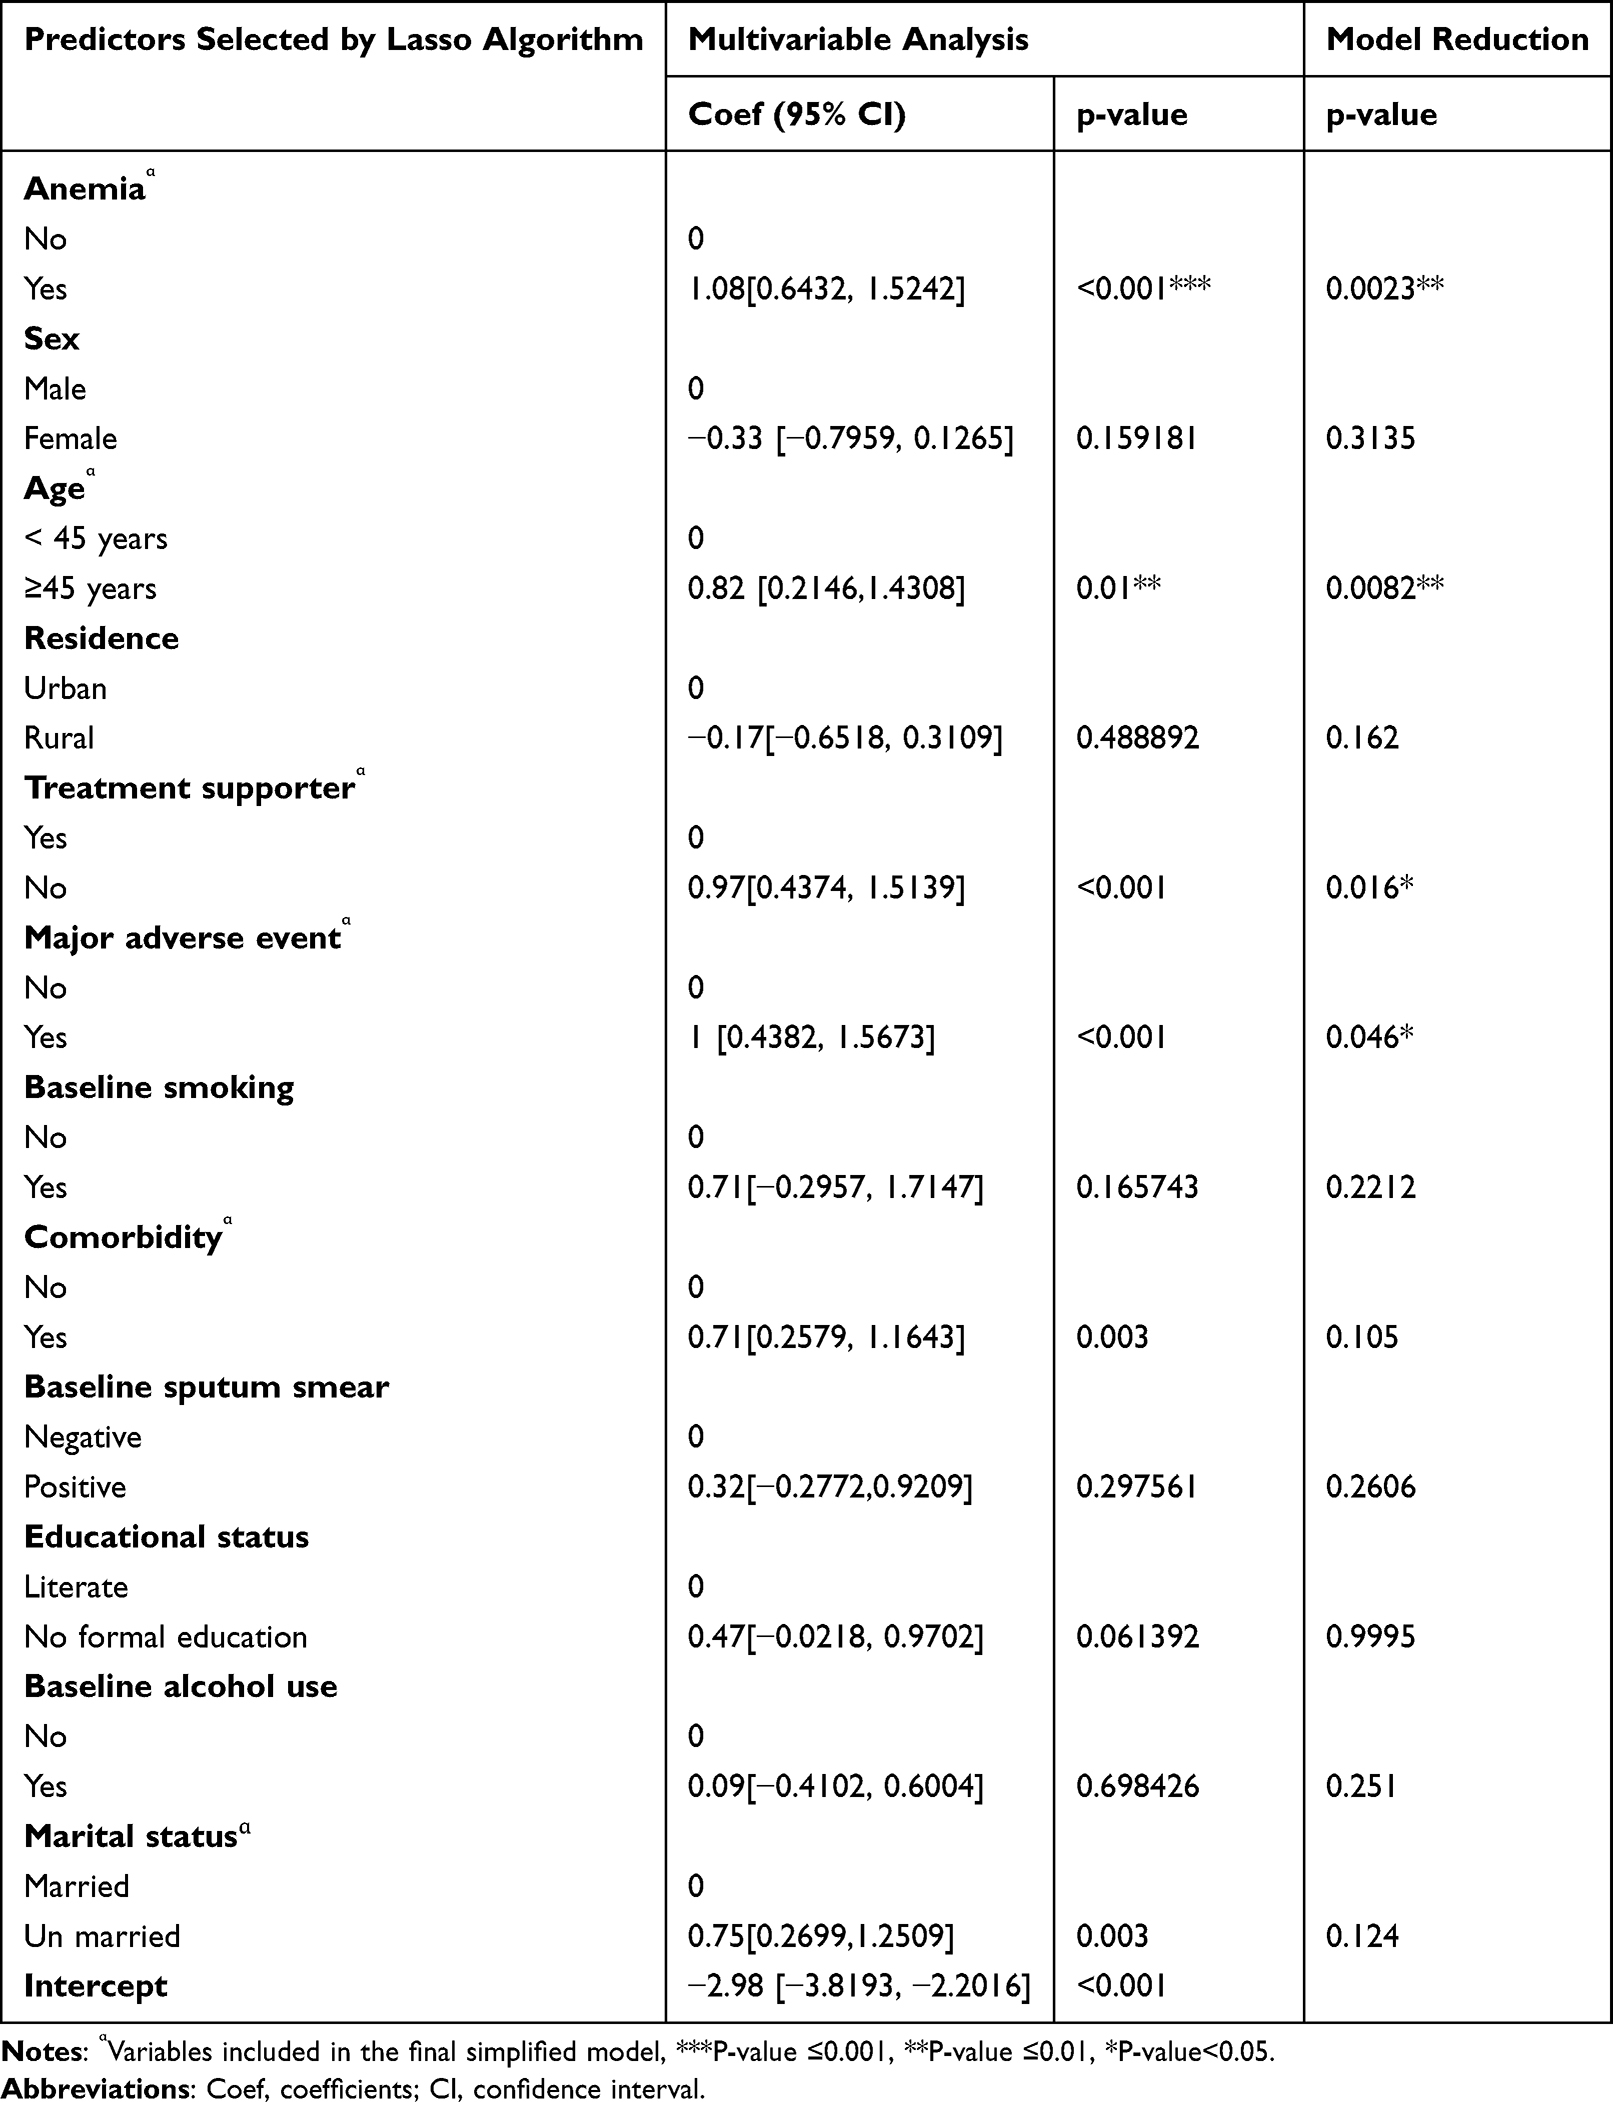 |
Table 3 Multivariable Logistic Regression Analysis and Model Reduction Using Potential Predictors of Unfavorable Treatment Outcome in Patients with Multidrug-Resistant Tuberculosis, in North West Ethiopia, 2010–2020 (N = 517) |
The regression results of the complete case analysis and the multiple imputations were compared in terms of regression coefficients, standard errors and p values. They were found to be almost similar, ensuring the absence of problem with the analysis result of the imputed dataset. The finding is illustrated by the following supplementary table (Supplementary Table 1).
Nomogram of the Final Model
Predictors which were significant in the model reduction were used in the construction of the nomogram. These predictors are Baseline anemia, comorbidity, MAE (Major adverse event), Age, Treatment supporter, and Marital status of the patient. The developed nomogram could be used to calculate the risk of individual patients for unfavorable treatment outcomes easily. For instance, the risk of a 48 years old, diabetic, married, and anemic female MDR-TB patient who had treatment supporter could be calculated as follows: The age of the patient was ≥45 years and the score for this category of age was 9.8. She was anemic and the score for this category of baseline anemia is 10. She was diabetic and the score for this category of comorbidity is 7.5. She was married and the score for this category of marital status is 0. She was evaluated at the time of enrolment, and hence no major adverse event was associated with treatment, and the score for this category of a major adverse event is 0. The patient had a treatment supporter and the score associated with this category of treatment supporter is 0. The total score would be the sum of the scores for each category of predictors, ie, 9.8+10+7.5+0+0+0=27.3. The risk of the patient for unfavorable treatment outcome with this total score would be read from the nomogram and it is 0.58 (high risk) (Figure 3).
 |
Figure 3 Nomogram for the prediction of unfavorable treatment outcome among MDR-TB patients in North West Ethiopia, September 2010 to July 2020. |
Performance of the Nomogram Developed
The two measures of risk prediction model performance are discriminatory power and calibration. Hence, the performance of the nomogram was evaluated by assessing its calibration and discriminatory power. Its discriminatory power was determined by calculating the AUC of the receiver operating characteristic curve (ROC-curve). ROC-curve is the probability curve and AUC is the measure of the degree of separability, and it was found to have a discriminatory power of (AUC = 0.753, 95% CI; 0.708, 0.798). Estimated risk of unfavorable treatment outcome = 1/(1 + exp − (−2.98 + 1.08 × Anemia (Yes) + 0.82 × Age (≥45 years) + 1 × Treatment supporter (No) + 1 × Major adverse event (Yes) + 0.71 × Comorbidity (Yes) + 0.75 × Marital status (unmarried).
The prediction role of individual prognostic determinants; baseline anemia (yes), age (≥45 years), major adverse event (yes), comorbidity (yes), treatment supporter (no), and marital status (unmarried) was assessed, and it was found to be 0.642, 0.546, 0.561, 0.606, 0.574, 0.563, respectively.
The model calibration was assessed by plotting the actual probability against the predicted one. It was assessed using both the calibration plot and the goodness-of-fit test (Hosmer–Lemeshow test) (Figure 4).
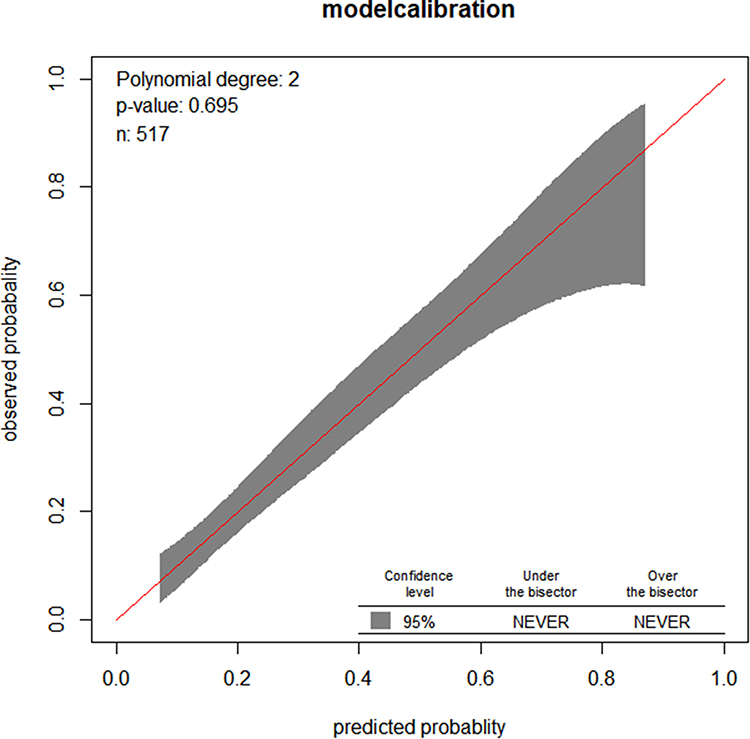 |
Figure 4 Observed versus predicted unfavorable treatment outcome probabilities in a sample. |
Risk Classification Using a Nomogram
The final simplified model was presented in the form of a nomogram just for practical utility. Patients are classified as at low, intermediate, and high risk of unfavorable treatment outcomes based on the risk probability identified using the nomogram. The risk probability calculation using the nomogram is so simple that any health professional at any level can do. Hence, using the cutoff (0.298) identified by the Youden index method, patients are classified as at low, intermediate, and high risk of unfavorable treatment outcomes. The proportion of unfavorable treatment outcome in low (<0.298), intermediate (0.298–0.62) and high-risk groups (≥0.62) were; 14.3%, 44.4% and 46.8%, respectively (Table 4).
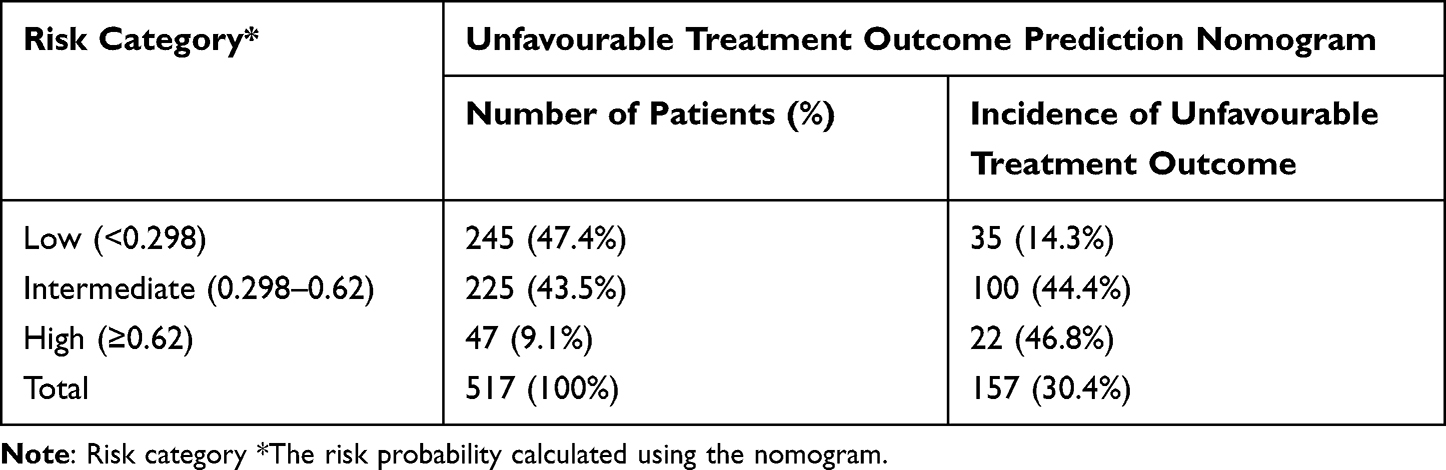 |
Table 4 Risk Classification of Unfavourable Treatment Outcome Using a Nomogram (n = 517) |
The optimum cut-off point was the one identified by the Youden index method, and it was 0.298. Then, the risk of patients was dichotomized to low risk (<0.298) and high risk (≥0.298). The proportion of patients at low and high risk of unfavorable treatment outcomes were 47.4% and 52.6%, respectively. The following table shows the performance of the nomogram at different cut-off points (Table 5).
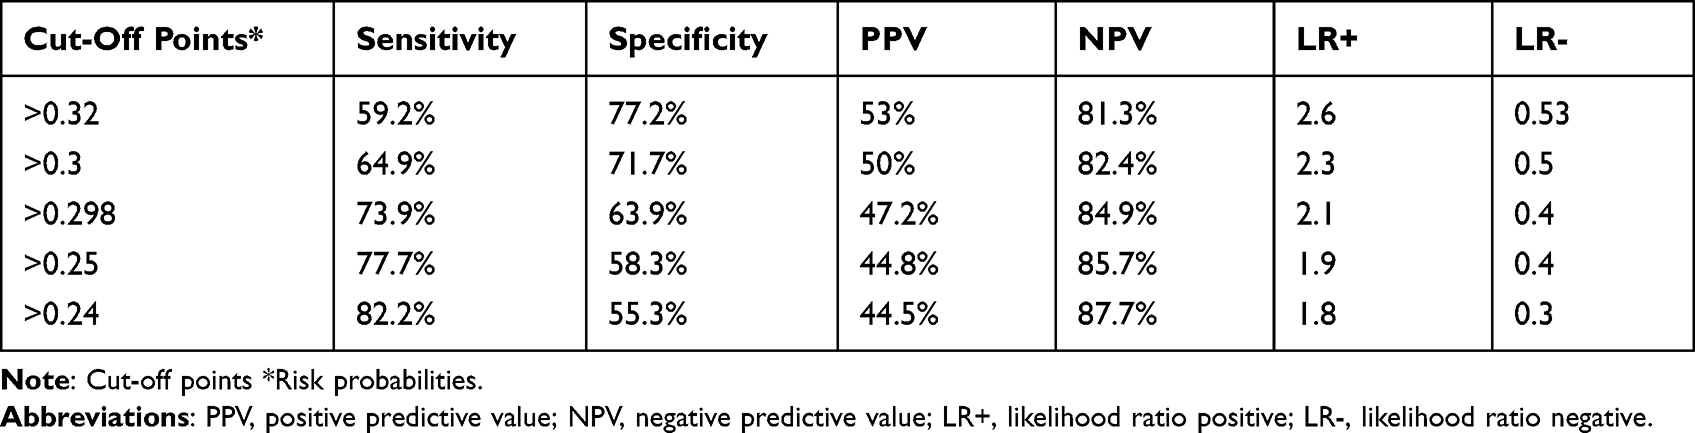 |
Table 5 Sensitivity, Specificity, PPV, and NPV of the Nomogram for Several Cut-off Points |
Model Validation
The model was validated internally using the bootstrapping method. This method was preferred over other methods of model validation like the split-half method and cross-validation for models validated through this method are more stable. It was performed by drawing bootstrap samples of 10,000 repetitions with replacement and was found to have a relatively corrected discriminatory power of 0.744 (95% CI; 0.699, 0.788) with a model calibration test of (p-value = 0.538) (Figure 5). The optimism coefficient was found to be 0.009.
 |
Figure 5 ROC curve of the model after internal validation using the bootstrapping method. |
Decision Curve Analysis (DCA)
The red line represents the developed risk prediction nomogram, the thin black line represents the assumption that all patients are at risk of unfavorable treatment outcomes and the thick black line represents that none of the patients are at risk of unfavorable treatment outcomes.
The net benefit was calculated by subtracting the proportion of all patients who are false-positive from the proportion who are true positive, weighted by the relative harm of not taking an intervention compared with the negative consequences of unnecessary intervention. The relative harm was calculated as; ( ).37 Here, “pt” stands for the threshold probability.
As the following DCA plot shows, the net benefit of using the model to carry out a certain intervention, which could be determined according to the status of the clinical setting, to tackle the unfavorable treatment outcome in MDR-TB patients was found to be higher than intervening on all or none of the MDR-TB patients. The decision curve showed that if the threshold probability is greater than 15%, using the developed risk prediction nomogram adds more benefit than the intervention on all or none of the patients (Figure 6).
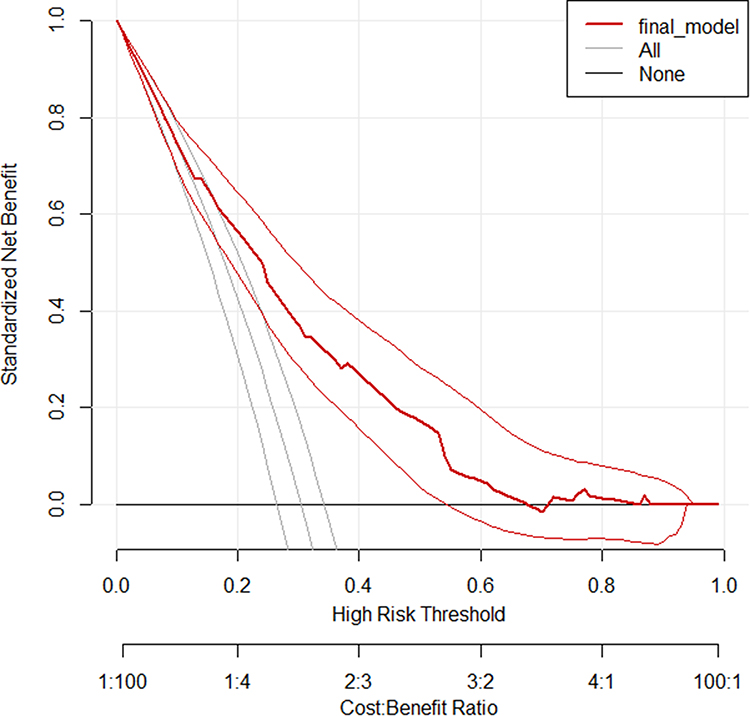 |
Figure 6 Decision curve plot showing the net benefit of the developed model for carrying out an intervention measure in MDR-TB patients at risk of unfavorable treatment outcome compared to all or none scenarios. |
Discussion
In this study, the incidence of unfavourable treatment outcomes was unacceptably high and the treatment success rate was below the national (75%).1 A total of 157 (30.4%, 95% CI; 26.5%, 34.5%) of patients had unfavourable treatment outcome. This finding is in line with studies conducted in Gabon, Tanzania, Viet Nam.38–40 However, it is lower compared to a systematic review and meta-analysis study, a study conducted in India, Uzbekistan, Portugal, Brazil and Colombia, Armenia, and a systematic review and meta-analysis done in Ethiopia.6,41–48 This could be due to the improvement in MDR-TB treatment and care as well as the introduction of highly effective short-term all-oral bedaquiline containing regimens in the treatment of MDR-TB which could decrease poor treatment outcomes.49
A multivariable risk prediction nomogram was built and internally validated for the individualized prediction of unfavourable treatment outcomes among MDR-TB patients. The model was built with the great intention of offering a clinical tool that could assist clinicians in their MDR-TB management and care, which is now challenging in many highly burdened countries, especially in this period of global crisis imposed by COVID-19. Visualizing the risk prediction model graphically using a nomogram was preferred to make the model built more user-friendly during its application in clinical settings. The risk prediction nomogram was built by incorporating easily ascertainable demographic, behavioural, and clinical characteristics of MDR-TB patients.
Predictors used in the construction of the model were selected by examining their association with the outcome by shrinking the regression coefficients with the lasso method. This method of penalized regression for predictor selection was preferred to select the most potent predictors of the outcome, hence a parsimonious and potentially robust model could be developed. The method reduced 22 candidate features to 12 potential predictors, which were then passed through multivariable analysis and reduced from the model one by one according to their role in the multivariable model after specifying the significance level of below 0.15 just to be liberal.
The final simplified model was constructed and presented as a risk prediction nomogram to make it more convenient and easier to use clinical tool.
The model comprised six variables identified as independent predictors of unfavourable treatment outcomes. These variables were baseline anemia, age of the patient, major adverse events, comorbidity, treatment supporter, and marital status. The finding was in line with other studies, which identified either baseline anemia, age, or comorbidity as independent predictors of unfavourable treatment outcomes.6,42,45,50–56 The major adverse event which occurred in the course of MDR TB treatment was also found to be a significant predictor of unfavourable treatment outcomes. This was also supported by other studies conducted in different countries.55,57–59 The absence of treatment supporter was also one of the independent predictors of the outcome which has pointed out the necessity of proper psychosocial support for the treatment success in MDR-TB patients. This is also supported by a study conducted in China, Ghana, and a systematic review and meta-analysis study.60–62
The prediction model comprised of the aforementioned predictors was developed in the whole dataset. The model was found to have a satisfactory level of discrimination accuracy (AUC = 0.753) and good calibration (p value = 0.65). The calibration of the model was assessed in two ways; one was by drawing the calibration plot. The calibration belt coincides with the y = x line (the 45-degree line) and is within the 95% confidence interval showing that the predicted and observed probabilities of unfavourable treatment outcomes are similar. The second method was using the Hosmer–Lemeshow goodness-of-fit test. The identified insignificant p-value of 0.65 indicates that the two probabilities are the same. Both methods of model calibration assessment methods revealed that the model well represented the data. A relatively wider belt of the calibration plot at the right top side of the plot showed that the model slightly overestimates the risk of high-risk MDR-TB patients for unfavourable treatment outcomes. However, this does not compromise the predictive role of the model for the possible intervention does not involve any life-threatening surgical procedures and investigations, rather it will guide clinicians to strictly follow these high-risk patients. The predictive role of each of the predictors was assessed for the identification of individuals at greater risk of unfavourable treatment outcomes. The prediction capacity for baseline anemia (yes), age (≥45 years), major adverse event (yes), comorbidity (yes), treatment supporter (yes) and marital status (unmarried) is 0.642, 0.546, 0.561, 0.606, 0.574 and 0.563, respectively. Hence, patients anemic at baseline and/or with comorbidity are relatively at higher risk for unfavourable treatment outcomes.
The model was internally validated using the bootstrap resampling method of 10,000 repetitions with replacement. The performance metrics done after internal validation revealed the well-calibrated model (p value = 0.52) with satisfactory discrimination power (AUC = 0.744). During internal validation by bootstrapping method, the model was trained in the bootstrap sample and tested in the original dataset. The difference between the apparent performance (performance in the derivation dataset) and the tested performance (performance in the tested dataset) is optimism expected in the apparent performance. The identified optimism coefficient of 0.009 ensures that the model is less likely to be sample-dependent. The calculated optimism could be averaged to find a relatively stable optimism and found to be 0.0045.
The developed model has an acceptable level of specificity, sensitivity, PPV, and NPV at a cut-off point of 0.298 identified by the Youden index method. The threshold point can be varied to increase either the specificity or sensitivity depending on the aim of the intervention and availability of resources.
The performance of our model was found to be better than other prediction models developed to predict unfavourable treatment outcomes among MDR-TB patients in Brazil,13 a nomogram to predict death and dropouts with prediction accuracy of 0.65 and 0.7, respectively. The variables used for the construction of the model were the number of previous MDR-TB treatments, use of illicit drugs, and how the case was discovered (at the emergency ward or through routine investigations). The predictors were easily obtainable except that the discriminatory performance of the nomogram comprised of these predictors was poor and it might be due to the lower number of predictors incorporated compared to the case in our study.
However, our model has a slightly lower performance when compared to the risk prediction model developed to predict death among TB patients in Tamaulipas, Mexico (c-statistics=0.77).63 The study used predictors like age, male gender, MDR-TB, HIV, DM, malnutrition, alcoholism, and pulmonary TB for the construction of the risk score. The difference might be due to the difference in study participants and the number of predictors involved in the model development. Another study conducted in India on a model to predict unfavourable treatment outcomes among TB/HIV co-infected patients had a discriminatory performance of 0.78.64 It was built based on a binomial logit model incorporating three predictors: baseline smear (negative or positive), disease type (pulmonary or extra-pulmonary or both), and TB treatment category (new or previously treated). Predictors that build the risk score are easily obtainable. The difference in the performance of our model and the aforementioned study might be due to the difference in study participants.
The benefit that the developed nomogram would add to clinical practice was also presented in the form of a decision curve. This latest metrics of examining the real benefit of the prediction model over the treat-all or treat-none scheme, DCA, would answer what the traditional performance measures (discrimination and calibration) could not answer. The net benefit of the nomogram was indicated across different threshold probabilities. It has a greater net benefit than using the treat all or treat none strategies when the threshold probability of the patient is above 15%.
For instance, if the personal threshold probability of a patient is 40%, then the net benefit is about 0.19 when using the developed risk prediction nomogram to decide whether to do a certain intervention, with added benefit than intervention on all or none of the patients. However, the model is not useful for threshold probabilities below 15%. Therefore, threshold probabilities are the most important components of the decision curve analysis depending on which a clinician can decide on whether to use the model or not when there is a need to carry out an intervention for patients at risk of unfavorable treatment outcomes.
Generally, the model is easy to use yet very important, for it was constructed using easily ascertainable predictors and presented in the form of a nomogram. A clinician can calculate the risk of unfavorable treatment outcomes and classify patients as at higher and lower risk of unfavorable treatment outcomes in an easy-to-do way. Any clinician at any level can use the nomogram developed because it does not demand any mathematics-intensive calculation.
It is also a clinically interpretable model because it is supported by decision curve analysis. To the best of our knowledge, it is the first prognostic model done on unfavorable treatment outcomes among MDR-TB patients specific to the selected settings in particular and specific to Ethiopia in general.
Therefore, it will be a useful clinical tool that health care professionals can use in their decision-making for personalized treatment and care of MDR-TB patients. Furthermore, this study can contribute to the global End TB strategy as the third pillar of End TB strategy is intensified researches and innovations which is aimed at accelerating discovery, development, and rapid uptake of new tools.65,66 Policymakers and program managers can also use the model for designing individual patient-specific policies and programs targeted towards reducing the unacceptably high level of poor treatment outcomes in MDR-TB patients.
However, the study was not without limitations; it would have been better if it was done using a prospective study design and validated externally. Besides, future researchers should improve the developed model by incorporating important predictors like income and adherence, variables that were missed in the retrospectively collected data.
Implication and Conclusion
The developed nomogram can be easily used for individualized prediction of unfavorable treatment outcomes in MDR-TB patients because it has a satisfactory level of accuracy and good calibration. It could be used as an accurate and discriminatory decision-making tool for predicting unfavorable treatment outcomes in MDR-TB patients whereby the unacceptably high level of unfavorable treatment outcomes can be reduced.
The small optimism coefficient identified in the validation process ensures the less likely overfitting of the model, and hence it can predict the outcome when applied to an independent set of samples.
The model was clinically interpretable and was found to have added benefits in clinical practice as it was assured by the decision curve analysis metrics. Its role in clinical care and practice would be substantial, especially in this period of a global pandemic in which global TB care is being threatened by COVID-19.
Abbreviations
AFB, Acid Fast Bacilli; AUC, Area Under Curve; BMI, Body Mass Index; CCA, Complete Case Analysis; CKD, Chronic Kidney Disease; DCA, Decision Curve Analysis; DM, Diabetes Mellitus; DR-TB, Drug-Resistant Tuberculosis; HBC, High Burden Country; HIV, Human Immunodeficiency Virus; IQR, Inter Quartile Range; MAR, Missing at Random; MDR-TB, Multi-Drug Resistant Tuberculosis; MI, Multiple Imputation; NPV, Negative Predictive Value; PPV, Positive Predictive Value; RR-TB, Rifampicin Resistant Tuberculosis; SLDs, Second-Line Drugs; TB, Tuberculosis; TIC, Treatment Initiating Center; TFC, Treatment Follow-up Center; UoGCSH, University of Gondar Compressive Specialized Hospital; WHO, World Health Organization; XDR-TB, Extremely Drug-Resistant Tuberculosis.
Data Sharing Statement
The datasets used and/or analysed during the current study are available from the corresponding author on reasonable request.
Ethics Approval and Consent to Participate
Ethical approval was obtained from the Institutional Review Board (IRB) of the University of Gondar with reference number: /IPH/1440/2021. A permission letter was obtained from the hospital administration and DR-TB ward focal person in the two TICs. Personal identifiers were excluded to maintain confidentiality. Informed consent was not taken directly from the study participants as it is entirely secondary data. Hence, the institutional Review Board (IRB) of the university waived the consent from the study participants.
Acknowledgments
Our heartfelt gratitude goes to the University of Gondar Compressive Specialized Hospital and Debre Markos referral hospital for their permission and encouragement. We also thank data collectors and card room workers for their contribution to the accomplishment of this study.
Author Contributions
All authors made a significant contribution to the work reported, whether that is in the conception, study design, execution, acquisition of data, analysis and interpretation, or in all these areas; took part in drafting, revising or critically reviewing the article; gave final approval of the version to be published; have agreed on the journal to which the article has been submitted; and agree to be accountable for all aspects of the work.
Disclosure
The authors declare that they have no competing interests.
References
1. World Health Organization. Global Tuberculosis Report 2020. Geneva: World Health Organization; 2020. Licence: CC BY-NC-SA 3.0 IGO. Available from: https://www.who.int/publications/i/item/9789240013131.
2. Global Tuberculosis Report. Advocacy toolkit; 2020.
3. Stop TB Partnership. High Burden Countries for Tuberculosis. Global Health Campus. Geneva, Switzerland 2021. Available from. https://www.stoptb.org/securing-quality-tb-care-all/high-burden-countries-tuberculosis. Accessed on February 5, 2021.
4. World Health Oraganization. Global Tuberculosis Report 2016. Geneva: World Health Organization; 2016. Available from: https://apps.who.int/iris/bitstream/handle/10665/250441/9789241565394-eng.pdf?sequence=1.
5. (FDRE-MH), F.D.R.o.E.M.o.H. National strategic plan tuberculosis and leprosy control 2006–2013 EC (2013/14 – 2020) with update – for 2010; 2017.
6. Alemu A, Bitew ZW, Worku T. Poor treatment outcome and its predictors among drug-resistant tuberculosis patients in Ethiopia: a systematic review and meta-analysis. Int J Infect Dis. 2020;98:420–439. doi:10.1016/j.ijid.2020.05.087
7. Baye A, Sarhie WD, Endalew B. Treatment outcomes of multi-drug-resistant tuberculosis and its determinants in Boru Meda hospital, Northeast Ethiopia. J Infect Dis Ther. 2018;6(350):1–5. doi:10.4172/2332-0877.1000350
8. Bekele TA, Aynalem GA, Berhe TT. Multi-drug resistant tuberculosis treatment outcome and associated factors in Addis Ababa, Ethiopia: a retrospective cross-sectional study; 2020.
9. Girum T, Tariku Y, Dessu S. Survival status and treatment outcome of multidrug resistant tuberculosis (MDR-TB) among patients treated in treatment initiation centers (TIC) in South Ethiopia: a retrospective cohort study. Ann Med Health Sci Res. 2017;7(5):1.
10. Woldeyohannes D, Assefa T, Aman R, et al. Predictors of time to unfavorable treatment outcomes among patients with multidrug resistant tuberculosis in Oromia region, Ethiopia. PLoS One. 2019;14(10):e0224025. doi:10.1371/journal.pone.0224025
11. World Health Organization. Global Tuberculosis Report 2018. Geneva: World Health Organization. Licence: CC BY-NC-SA 3.0 IGO; 2018.
12. World Health Organization. Ethiopia launched new guideline for reaching missed tuberculosis cases; 2018.
13. Arroyo LH, Ramos ACV. Predictive model of unfavorable outcomes for multidrug-resistant tuberculosis. Revista de Saúde Pública. 2019;53:77.
14. Butov D, Lange C, Heyckendorf J, et al. Multidrug-resistant tuberculosis in the Kharkiv Region, Ukraine. Medicine. 2020;24(5):485–491.
15. Elmi OS, Hasan H, Abdullah S, et al. Treatment outcomes of patients with Multidrug-Resistant Tuberculosis (MDR- TB) compared with Non-MDR-TB infections in Peninsular Malaysia. Malays J Med Sci. 2016;23(4):17–25.
16. Janmeja AK, Aggarwal D, Dhillon R. Factors predicting treatment success in multi-drug resistant tuberculosis patients treated under programmatic conditions. Indian J Tuberc. 2018;65(2):135–139. doi:10.1016/j.ijtb.2017.12.015
17. Khaliaukin A, Kumar AMV, Skrahina A, et al. Poor treatment outcomes among multidrug-resistant tuberculosis patients in Gomel Region, Republic of Belarus. Public Health Action. 2014;4(Suppl 2):S24–S28. doi:10.5588/pha.14.0042
18. Mohd Shariff N, Shah SA, Kamaludin F. Predictors of death among drug-resistant tuberculosis patients in Kuala Lumpur, Malaysia: a retrospective cohort study from 2009 to 2013. J Glob Antimicrob Resist. 2016;6:102–107. doi:10.1016/j.jgar.2016.04.005
19. Parmar MM, Sachdeva KS, Dewan PK, et al. Unacceptable treatment outcomes and associated factors among India’s initial cohorts of multidrug-resistant tuberculosis (MDR-TB) patients under the revised national TB control programme (2007–2011): evidence leading to policy enhancement. PLoS One. 2018;13(4):e0193903. doi:10.1371/journal.pone.0193903
20. Tang S, Tan S, Yao L, et al. Risk factors for poor treatment outcomes in patients with MDR-TB and XDR-TB in China: retrospective multi-center investigation. PLoS One. 2013;8(12):e82943. doi:10.1371/journal.pone.0082943
21. Tobón Á, Rueda J, Cáceres DH, et al. Adverse treatment outcomes in multidrug resistant tuberculosis go beyond the microbe-drug interaction: results of a multiple correspondence analysis. Biomedica. 2020;40(4):616–625. doi:10.7705/biomedica.5072
22. Van LH, Phu PT, Vinh DN, et al. Risk factors for poor treatment outcomes of 2266 multidrug-resistant tuberculosis cases in Ho Chi Minh City: a retrospective study. BMC Infect Dis. 2020;20(1):164. doi:10.1186/s12879-020-4887-1
23. Zhang L, Meng Q, Chen S, et al. Treatment outcomes of multidrug-resistant tuberculosis patients in Zhejiang, China, 2009–2013. Clin Microbiol Infect. 2018;24(4):381–388. doi:10.1016/j.cmi.2017.07.008
24. Li Q, Shi CX, Lu M, et al. Treatment outcomes of multidrug-resistant tuberculosis in Hangzhou, China, 2011 to 2015. Medicine. 2020;99(30):e21296. doi:10.1097/MD.0000000000021296
25. Aibana O, Bachmaha M, Krasiuk V, et al. Risk factors for poor multidrug-resistant tuberculosis treatment outcomes in Kyiv Oblast, Ukraine. BMC Infect Dis. 2017;17(1):129. doi:10.1186/s12879-017-2230-2
26. Huerga H, Bastard M, Kamene M, et al. Outcomes from the first multidrug-resistant tuberculosis programme in Kenya. Int J Tuberc Lung Dis. 2017;21(3):314–319. doi:10.5588/ijtld.16.0661
27. Nguyen NV. Management and treatment outcomes of MDR-TB: results from a setting with high rates of drug resistance. Trop Med Infect Dis. 2015;19(9):1109–1114.
28. van Altena R, de Vries G, Haar CH, et al. Highly successful treatment outcome of multidrug-resistant tuberculosis in the Netherlands, 2000–2009. Int J Tuberc Lung Dis. 2015;19(4):406–412. doi:10.5588/ijtld.14.0838
29. Verdecchia M, Keus K, Blankley S. Model of care and risk factors for poor outcomes in patients on multi-drug resistant tuberculosis treatment at two facilities in Eswatini (formerly Swaziland), 2011–2013. PLoS One. 2018;13(10):e0205601. doi:10.1371/journal.pone.0205601
30. Riley RD, Snell KI, Ensor J, et al. Minimum sample size for developing a multivariable prediction model: PART II‐binary and time‐to‐event outcomes. Stat Med. 2019;38(7):1276–1296. doi:10.1002/sim.7992
31. World Health Organization. Definitions and reporting framework for tuberculosis. Geneva, Swizerland; 2013. Available from: https://apps.who.int/iris/bitstream/handle/10665/79199/9789241505345_eng.pdf?sequence=1.
32. Pavlou M, Ambler G, Seaman SR, et al. How to develop a more accurate risk prediction model when there are few events. BMJ. 2015;351. doi:10.1136/bmj.h3868
33. Steyerberg EW, Vickers AJ, Cook NR, et al. Assessing the performance of prediction models: a framework for some traditional and novel measures. Epidemiology. 2010;21(1):128. doi:10.1097/EDE.0b013e3181c30fb2
34. Zhou Z-R, Wang -W-W, Li Y, et al. In-depth mining of clinical data: the construction of clinical prediction model with R. Ann Transl Med. 2019;7(23):796. doi:10.21037/atm.2019.08.63
35. Swets JA. Measuring the accuracy of diagnostic systems; 1988.
36. Collins GS, Reitsma JB, Altman DG, et al. Transparent reporting of a multivariable prediction model for individual prognosis or diagnosis (TRIPOD): the TRIPOD statement. BMJ. 2015;350:g7594. doi:10.1136/bmj.g7594
37. Vickers AJ, Cronin AM, Elkin EB, et al. Extensions to decision curve analysis, a novel method for evaluating diagnostic tests, prediction models and molecular markers. BMC Med Inform Decis Mak. 2008;8(1):1–17. doi:10.1186/1472-6947-8-53
38. Bélard S, Bootsma S, Traoré AN, et al. Tuberculosis treatment outcome and drug resistance in lambarene, Gabon: a prospective cohort study. Am J Trop Med Hyg. 2016;95(2):472–480. doi:10.4269/ajtmh.15-0668
39. Leveri TH, Lekule I, Mollel E, et al. Predictors of treatment outcomes among multidrug resistant tuberculosis patients in Tanzania. Tuberc Res Treat. 2019;2019. doi:10.1155/2019/3569018
40. Phuong N, Nhung NV, Hoa NB, et al. Management and treatment outcomes of patients enrolled in MDR-TB treatment in Viet Nam. Public Health Action. 2016;6(1):25–31. doi:10.5588/pha.15.0068
41. Kibret KT, Moges Y, Memiah P, et al. Treatment outcomes for multidrug-resistant tuberculosis under DOTS-Plus: a systematic review and meta-analysis of published studies. Infect Dis Poverty. 2017;6(1):1–8. doi:10.1186/s40249-016-0214-x
42. Nair D, Velayutham B, Kannan T, et al. Predictors of unfavourable treatment outcome in patients with multidrug-resistant tuberculosis in India. Public Health Action. 2017;7(1):32–38. doi:10.5588/pha.16.0055
43. Kalandarova L, Tillashaikhov M, Parpieva N, et al. Treatment outcomes and adverse reactions in patients with multidrug-resistant tuberculosis managed by ambulatory or hospitalized care from 2010–2011 in Tashkent, Uzbekistan. Public Health Panorama. 2016;2(1):21–29.
44. Oliveira O, Gaio R, Correia-Neves M, et al. Evaluation of drug-resistant tuberculosis treatment outcome in Portugal, 2000–2016. PLoS One. 2021;16(4):e0250028. doi:10.1371/journal.pone.0250028
45. Bhering M, Duarte R, Kritski A, Escobar-Gutiérrez A. Predictive factors for unfavourable treatment in MDR-TB and XDR-TB patients in Rio de Janeiro State, Brazil, 2000–2016. PLoS One. 2019;14(11):e0218299. doi:10.1371/journal.pone.0218299
46. Suryawanshi S, Shewade HD, Nagaraja SB, et al. Unfavourable outcomes among patients with MDR-TB on the standard 24-month regimen in Maharashtra, India. Public Health Action. 2017;7(2):116–122. doi:10.5588/pha.17.0013
47. Chaves-Torres NM, Fadul S, Patiño J, et al. Factors associated with unfavorable treatment outcomes in patients with rifampicin-resistant tuberculosis in Colombia 2013–2015: a retrospective cohort study. PLoS One. 2021;16(4):e0249565. doi:10.1371/journal.pone.0249565
48. Khachatryan L, Grigoryan R, Dadu A, et al. Factors associated with unfavourable treatment outcomes among people with rifampicin-resistant tuberculosis in Armenia, 2014–2017. Monaldi Arch Chest Dis. 2021;91(1). doi:10.4081/monaldi.2021.1677
49. Schnippel K, Ndjeka N, Maartens G, et al. Effect of bedaquiline on mortality in South African patients with drug-resistant tuberculosis: a retrospective cohort study. Lancet Respir Med. 2018;6(9):699–706. doi:10.1016/S2213-2600(18)30235-2
50. Alene KA, Viney K, McBryde ES, et al. Treatment outcomes in patients with multidrug-resistant tuberculosis in north-west Ethiopia. Trop Med Int Health. 2017;22(3):351–362. doi:10.1111/tmi.12826
51. Li D, Ge E, Shen X, et al. Risk factors of treatment outcomes for multi-drug resistant tuberculosis in Shanghai, 2009–2012. Procedia Environ Sci. 2016;36:12–19. doi:10.1016/j.proenv.2016.09.003
52. Bogale L, Tsegaye T, Abdulkadir M, et al. Unfavorable treatment outcome and its predictors among patients with multidrug-resistance tuberculosis in Southern Ethiopia in 2014 to 2019: a multi-center retrospective follow-up study. Infect Drug Resist. 2021;14:1343. doi:10.2147/IDR.S300814
53. Bhering M, Kritski A. Primary and acquired multidrug-resistant tuberculosis: predictive factors for unfavorable treatment outcomes in Rio de Janeiro, 2000–2016. Revista Panamericana de Salud Pública. 2020;44:1. doi:10.26633/RPSP.2020.178
54. Gadallah MA, Mokhtar A, Rady M, et al. Prognostic factors of treatment among patients with multidrug-resistant tuberculosis in Egypt. J Formos Med Assoc. 2016;115(11):997–1003. doi:10.1016/j.jfma.2015.10.002
55. Samuels JP, Sood A, Campbell JR, et al. Comorbidities and treatment outcomes in multidrug resistant tuberculosis: a systematic review and meta-analysis. Sci Rep. 2018;8(1):1–13. doi:10.1038/s41598-018-23344-z
56. Khan I, Ahmad N, Khan S, et al. Evaluation of treatment outcomes and factors associated with unsuccessful outcomes in multidrug resistant tuberculosis patients in Baluchistan province of Pakistan. J Infect Public Health. 2019;12(6):809–815. doi:10.1016/j.jiph.2019.04.009
57. Zhang Y, Wu S, Xia Y, et al. Adverse events associated with treatment of multidrug-resistant tuberculosis in China: an ambispective cohort study. Med Sci Monit. 2017;23:2348. doi:10.12659/MSM.904682
58. Shean K, Streicher E, Pieterson E, et al. Drug-associated adverse events and their relationship with outcomes in patients receiving treatment for extensively drug-resistant tuberculosis in South Africa. PLoS One. 2013;8(5):e63057. doi:10.1371/journal.pone.0063057
59. Harouna S, Ortuno-Gutierrez N, Souleymane MB, et al. Short-course treatment outcomes and adverse events in adults and children-adolescents with MDR-TB in Niger. Int J Tuberc Lung Dis. 2019;23(5):625–630. doi:10.5588/ijtld.17.0871
60. Yin J, Wang X, Zhou L, et al. The relationship between social support, treatment interruption and treatment outcome in patients with multidrug‐resistant tuberculosis in China: a mixed‐methods study. Trop Med Int Health. 2018;23(6):668–677. doi:10.1111/tmi.13066
61. Wen S, Yin J, Sun Q. Impacts of social support on the treatment outcomes of drug-resistant tuberculosis: a systematic review and meta-analysis. BMJ open. 2020;10(10):e036985. doi:10.1136/bmjopen-2020-036985
62. Azagba CK. Tuberculosis treatment outcomes using treatment supporters in Ketu South Municipality of Volta Region in Ghana. University of Ghana; 2013.
63. Abdelbary BE, Garcia-Viveros M, Ramirez-Oropesa H, et al. Predicting treatment failure, death and drug resistance using a computed risk score among newly diagnosed TB patients in Tamaulipas, Mexico. Epidemiol Infect. 2017;145(14):3020–3034. doi:10.1017/S0950268817001911
64. Madan C, Chopra KK, Satyanarayana S, et al. Developing a model to predict unfavourable treatment outcomes in patients with tuberculosis and human immunodeficiency virus co-infection in Delhi, India. PLoS One. 2018;13(10):e0204982. doi:10.1371/journal.pone.0204982
65. World Health Organization. The End TB Strategy. World Health Organization; 2015. Available from: https://www.who.int/tb/strategy/en/.
66. World Health Organization. Framework for implementing the “End TB Strategy” in the African Region 2016–2020. Geneva: World Health Organization; 2017. Available from: http://apps.who.int/iris.
 © 2022 The Author(s). This work is published and licensed by Dove Medical Press Limited. The
full terms of this license are available at https://www.dovepress.com/terms
and incorporate the Creative Commons Attribution
- Non Commercial (unported, 3.0) License.
By accessing the work you hereby accept the Terms. Non-commercial uses of the work are permitted
without any further permission from Dove Medical Press Limited, provided the work is properly
attributed. For permission for commercial use of this work, please see paragraphs 4.2 and 5 of our Terms.
© 2022 The Author(s). This work is published and licensed by Dove Medical Press Limited. The
full terms of this license are available at https://www.dovepress.com/terms
and incorporate the Creative Commons Attribution
- Non Commercial (unported, 3.0) License.
By accessing the work you hereby accept the Terms. Non-commercial uses of the work are permitted
without any further permission from Dove Medical Press Limited, provided the work is properly
attributed. For permission for commercial use of this work, please see paragraphs 4.2 and 5 of our Terms.
Recommended articles
Multidrug-Resistant Tuberculosis Treatment Outcome and Associated Factors at the University of Gondar Comprehensive Specialized Hospital: A Ten-Year Retrospective Study
Belachew T, Yaheya S, Tilahun N, Gebrie E, Seid R, Nega T, Biset S
Infection and Drug Resistance 2022, 15:2891-2899
Published Date: 3 June 2022