
Back to Journals » Cancer Management and Research » Volume 18

Development and Validation of a Clinical Radiomics Nomogram for Predicting Early Recurrence After Microwave Ablation in Hepatocellular Carcinoma Patients With Type 2 Diabetes
Authors Sun Z, Wang N, Wu X, Wang T, Liu D, Zou Y, He R, Jia N 
Received 8 May 2026
Accepted for publication 10 July 2026
Published 17 July 2026 Volume 2026:18 617875
DOI https://doi.org/10.2147/CMAR.S617875
Checked for plagiarism Yes
Review by Single anonymous peer review
Peer reviewer comments 2
Editor who approved publication: Dr Sanjeev K. Srivastava
Ze Sun,1,* Neng Wang,2,* Xufan Wu,1,* Tianyi Wang,1 Dong Liu,1 Yiran Zou,2 Ruilin He,1 Ningyang Jia1
1Department of Imaging Medicine and Nuclear Medicine, Eastern Hepatobiliary Surgery Hospital, Shanghai, People’s Republic of China; 2Department of Ultrasound Interventional Department, Eastern Hepatobiliary Surgery Hospital, Shanghai, People’s Republic of China
*These authors contributed equally to this work
Correspondence: Ningyang Jia, Email [email protected]
Objective: To develop and validate a non-invasive model for predicting early recurrence (ER) after microwave ablation (MWA) in patients with hepatocellular carcinoma (HCC) and comorbid type 2 diabetes (T2D).
Methods: This retrospective study enrolled 186 HCC patients with T2D who underwent MWA and were divided into training (n=149) and validation (n=37) cohorts. Preoperative clinical parameters and portal-venous phase MRI radiomic features were extracted. A radiomics score (RAD -score) was constructed using the K-nearest neighbors (KNN) algorithm after feature selection. A clinical model was built using logistic regression, and a nomogram integrating clinical factors and the RAD -score was established. Model performance was evaluated using ROC curves, calibration curves, and decision curve analysis (DCA). Kaplan–-Meier curves, pathological analysis, and immunohistochemistry validated prognostic stratification.
Results: Four core radiomic features were identified. The combined nomogram achieved AUCs of 0.877 (training) and 0.846 (validation), outperforming the clinical (AUC 0.718) and radiomics (AUC 0.774) models alone. In the validation cohort, the sensitivity, specificity, and negative predictive value were 80.0%, 83.8%, and 90.1%, respectively. DCA showed a significant net benefit across threshold probabilities of 0.1– 0.9. High-risk patients had a 5.8-fold (training) and 2.51-fold (validation) higher recurrence risk with significantly shorter progression-free survival. Pathological and immunohistochemical analyses confirmed more aggressive tumor features (higher rates of microvascular invasion, poor differentiation, thick-trabecular type, CD34 expression, and glypican-3 expression) in the high-risk group.
Conclusion: The nomogram provides a satisfactory prediction of early recurrence within two years after MWA in HCC patients with T2D, enabling individualized postoperative surveillance and intervention.
Keywords: hepatocellular carcinoma, type 2 diabetes, microwave ablation, early recurrence, radiomics nomogram
Introduction
Primary liver cancer is the sixth most common malignancy and third leading cause of cancer-related deaths worldwide.1 Hepatocellular carcinoma (HCC) accounts for approximately 75–85% of all primary liver cancers.2 In recent years, the landscape of systemic treatment for hepatocellular carcinoma has been constantly evolving; targeted and immunotherapy have become the standard first-line treatments for advanced hepatocellular carcinoma and have shown promise in terms of disease downstaging, disease conversion and management following recurrence.3,4 Nevertheless, for patients with early-stage HCC who are not candidates for surgical resection, microwave ablation (MWA) remains one of the preferred curative treatment options. MWA offers comparable overall survival and disease-free survival to surgery, along with advantages including fewer complications, shorter hospital stays, lower costs, and repeatability.5
Despite the efficacy of MWA, early recurrence following ablation remains a major clinical concern. Studies have reported that the recurrence rate in patients with cirrhosis-associated HCC can reach up to 70.0% within five years, with the highest risk occurring within the first two years after ablation.6 To date, established risk factors for post-ablation recurrence include tumor size, tumor number, histological differentiation grade, and cirrhosis stage. However, the recurrence risk profile in specific patient populations with distinct comorbidities—particularly type 2 diabetes (T2D)—remains poorly characterized and requires further investigation.
Accumulating evidence has shown that T2D has a close bidirectional interaction with liver disease progression and is a well-recognized independent risk factor for HCC development.7 Diabetes accelerates liver fibrosis and drives malignant transformation through multiple pathophysiological mechanisms, including insulin resistance, hyperinsulinemia, chronic oxidative stress, and persistent inflammatory responses. At the molecular level, the oxidative stress regulator PRDX6 has been verified to promote HCC malignant progression and correlate with poor prognosis,8 providing mechanistic evidence for diabetes-aggravated HCC development. Collectively, these pathological alterations increase HCC risk by two to threefold in patients with T2D.9–14 On the other hand, liver cirrhosis itself disrupts glucose metabolic homeostasis and induces hepatogenous diabetes, forming a vicious cycle of diabetes-cirrhosis-HCC and further complicating disease progression.15–17 Recent studies have confirmed that patients with concurrent diabetes and cirrhosis face a significantly higher risk of developing HCC than those with either condition alone. Furthermore, once diagnosed with HCC, these patients have substantially higher risks of all-cause mortality and disease progression compared with non-diabetic patients.18 Taken together, these findings indicate that patients with cirrhosis-associated HCC and comorbid T2D represent an ultra-high-risk population for postoperative recurrence, with unique clinical characteristics and unmet needs for targeted recurrence prevention strategies.
In current clinical practice, HCC is typically diagnosed and staged using noninvasive imaging modalities such as computed tomography (CT) or magnetic resonance imaging (MRI).19 As an emerging imaging analysis technique, radiomics extracts quantitative high-throughput features from medical images and converts visual diagnostic information into analyzable structured data to support clinical decision-making. Its core theoretical basis is that biomedical images contain rich pathophysiological information that cannot be visually identified by clinicians.20,21 To date, radiomics has been successfully applied as a non-invasive biomarker for predicting HCC diagnosis,22 tumor staging,23 prognosis,24 and treatment response.25 However, for the high-risk population of HCC patients with comorbid T2D, reliable non-invasive biomarkers for accurate prediction of early recurrence after MWA are still lacking. Therefore, integrating conventional clinical risk factors with MRI-based radiomics features to develop and validate a personalized recurrence prediction model is of great clinical significance, which can facilitate the identification of high-risk patients, guide intensified postoperative surveillance, and inform individualized adjuvant treatment decisions.
Methods
Study Population
This retrospective study enrolled patients hospitalized at the Eastern Hepatobiliary Surgery Hospital between January 1, 2015, and December 30, 2019. All eligible participants were diagnosed with HCC and received percutaneous MWA as curative treatment. Inclusion criteria were: (1) confirmed diagnosis of HCC based on the 2010 AASLD guidelines, (2) completion of contrast-enhanced MRI within 4 weeks prior to treatment, and (3) absence of a history of other malignancies. The exclusion criteria were: (1) incomplete clinical data, (2) loss to follow-up, and (3) poor MRI image quality. In this study, early recurrence (ER) was defined as tumor recurrence occurring within two years after MWA. This retrospective study was conducted in accordance with the Declaration of Helsinki. The study protocol was approved by the Ethics Committee of Eastern Hepatobiliary Surgery Hospital (approval number: EHBHK Y2022-H-P002). Due to the retrospective design, informed consent was waived by the ethics committee. All data were fully anonymized before analysis. The detailed screening process is illustrated in Figure 1.
 |
Figure 1 Flow chart of patients inclusion and exclusion of the whole study. |
Microwave Ablation Procedure
The primary MWA device used was a KY-2000 model (Nanjing Kangyou Microwave Energy Application Institute, China). Ultrasound-guided percutaneous thermal ablation was performed under local anesthesia supplemented with intravenous anesthesia. Pre-treatment contrast-enhanced MRI and ultrasound were used to assess the tumor size, location, and surrounding vasculature. The microwave antenna was inserted under ultrasound guidance, and the ablation power was set at 80–100 W. For tumors with a maximum diameter exceeding 2 cm, simultaneous multipoint ablation was performed.
MRI Data Acquisition and ROI (Region of Interest) Segmentation
All patients underwent contrast-enhanced abdominal MRI within 4 weeks before MWA using a 3T GE Signa MR scanner with an eight-channel phased-array coil. Sequences included axial T1WI (in-phase and out-phase), axial T2WI, and axial dynamic contrast-enhanced imaging (arterial, portal venous, and delayed phases). Gadopentetate dimeglumine (Gd-DTPA) was injected at 2.0 mL/s (0.1 mmol/kg), followed by a 20 mL saline flush. The portal venous phase was acquired 55–65 s after the injection.
Before tumor segmentation, portal venous phase images were preprocessed as follows: (1) voxel size resampling to 1×1×1 mm using linear interpolation and (2) gray-level normalization and discretization into 32 bins to improve feature robustness. Tumor regions of interest (ROIs) were manually delineated on portal venous phase images using ITK-SNAP version 4.2.2. A radiologist with seven years of experience performed the initial segmentation, which was then confirmed by a radiologist with nine years of experience. Disagreements were resolved by consensus. To assess reproducibility, one radiologist randomly selected 20 patients and re-segmented the ROIs after two weeks (intra-observer ICC). Another radiologist independently segmented a different set of 20 patients (inter-observer ICC). An ICC >0.8 indicated good agreement. Detailed MRI acquisition parameters, standardized image preprocessing protocols, and complete intra- and inter-observer reproducibility analyses are fully documented in the Supplementary Methods.
Development and Validation of the Radiomics Score
Radiomics features were extracted from the original and derived images using the open-source package PyRadiomics 3.1.0. The features were categorized into first-order statistics, shape-based features, and second-order statistics (GLCM, GLRLM, GLSZM, GLDM, and NGTDM). All features were normalized using Z-score normalization.
The feature selection followed a three-step procedure. First, univariate analysis using an independent samples t-test was performed to preliminarily screen for features associated with early recurrence (P<0.05). Second, Spearman rank correlation analysis was applied to remove highly collinear features with a correlation coefficient of ≥0.90, thereby eliminating redundancy and reducing the risk of overfitting. Third, LASSO regression with L1 regularization, combined with five-fold cross-validation, was used to further penalize redundant features and select the most predictive non-zero coefficient subset for constructing the Radscore. This regularization approach shrinks the coefficients of noise features to zero, effectively reducing model complexity and overfitting.
Six machine-learning algorithms were compared for radiomics model development: logistic regression (LR), support vector machine (SVM), K-nearest neighbors (KNN), extremely randomized trees (ExtraTrees), light gradient boosting machine (LightGBM), and multilayer perceptron (MLP). Model selection was based on a comprehensive evaluation framework covering multiple dimensions: discriminative performance (AUC, sensitivity, specificity, accuracy, F1 score), generalization stability (AUC difference between training and validation cohorts, degree of overfitting), computational efficiency, and clinical interpretability. The DeLong test was used to compare the AUCs between models. The RAD score obtained from the optimal model selected was used for subsequent analysis.
Clinical Model and Combined Nomogram
Logistic regression analysis was used to screen potential clinical factors affecting early recurrence after MWA, including age, sex, alpha-fetoprotein (AFP), alanine aminotransferase, aspartate aminotransferase, γ-glutamyltransferase, fasting blood glucose, total bilirubin, albumin, white blood cell count, neutrophil count, lymphocyte count, platelet count, prothrombin time (PT), number of ablations, maximum tumor diameter, total tumor diameter, number of tumors, use of hypoglycemic agents, hepatitis status, and AFP variants. Variables with P<0.05 in univariate analysis were entered into multivariate logistic regression with backward stepwise selection to construct the clinical model, avoiding overfitting caused by excessive variable inclusion.
A combined model integrating the Rad-score and clinical model prediction scores was constructed via multivariate logistic regression to improve prediction accuracy. For clinical applicability, a nomogram was established based on the combined model, providing a graphical scoring system to convert individual patient data into personalized probabilities of early recurrence within two years postoperatively. Using the median nomogram score in the validation cohort as the cutoff, patients were stratified into low- and high-risk groups. Progression-free survival (PFS) was compared between groups using Kaplan-Meier curves. Additionally, pathological and immunohistochemical data were compared between the high-risk and low-risk groups of patients who experienced early recurrence and underwent salvage surgical resection.
Statistical Analysis
Statistical analyses were performed using SPSS 27.0 and R 4.4.3 Continuous variables were compared using the independent samples t-test or Mann–Whitney U-test; categorical variables were compared using the chi-square test or Fisher’s exact test. A binary logistic regression was used to construct the models. Model discrimination was evaluated using ROC curves with calculation of AUC and 95% confidence intervals (CIs) as well as sensitivity, specificity, accuracy, F1 score, positive predictive value (PPV), and negative predictive value (NPV). Calibration was assessed using calibration curves, and clinical utility was evaluated using decision curve analysis (DCA). Statistical significance was set at P<0.05.
Patient Follow-Up
Regular follow-up was performed after discharge. The first follow-up was performed at two months to evaluate the local treatment response. Subsequent follow-up examinations, including serum AFP levels, liver function tests, and contrast-enhanced CT or MRI, were conducted every 3 months. Contrast-enhanced ultrasonography was performed in selected cases when necessary. The starting point was the date of MWA and the primary endpoint was early recurrence. Recurrence was diagnosed based on new intrahepatic lesions or metastases with characteristic HCC imaging features, or confirmed by histopathology. The last follow-up date was February 28, 2022.
Results
Patient Characteristics
A total of 186 patients were enrolled, with 149 in the training cohort and 37 in the validation cohort. Within two years after MWA, recurrence occurred in 121 patients (65.05%): 97/149 (65.10%) in the training cohort and 24/37 (64.86%) in the validation cohort. The baseline clinical and tumor characteristics are summarized in Table 1. No significant differences were observed between the two cohorts for any of the variables (all P>0.05).
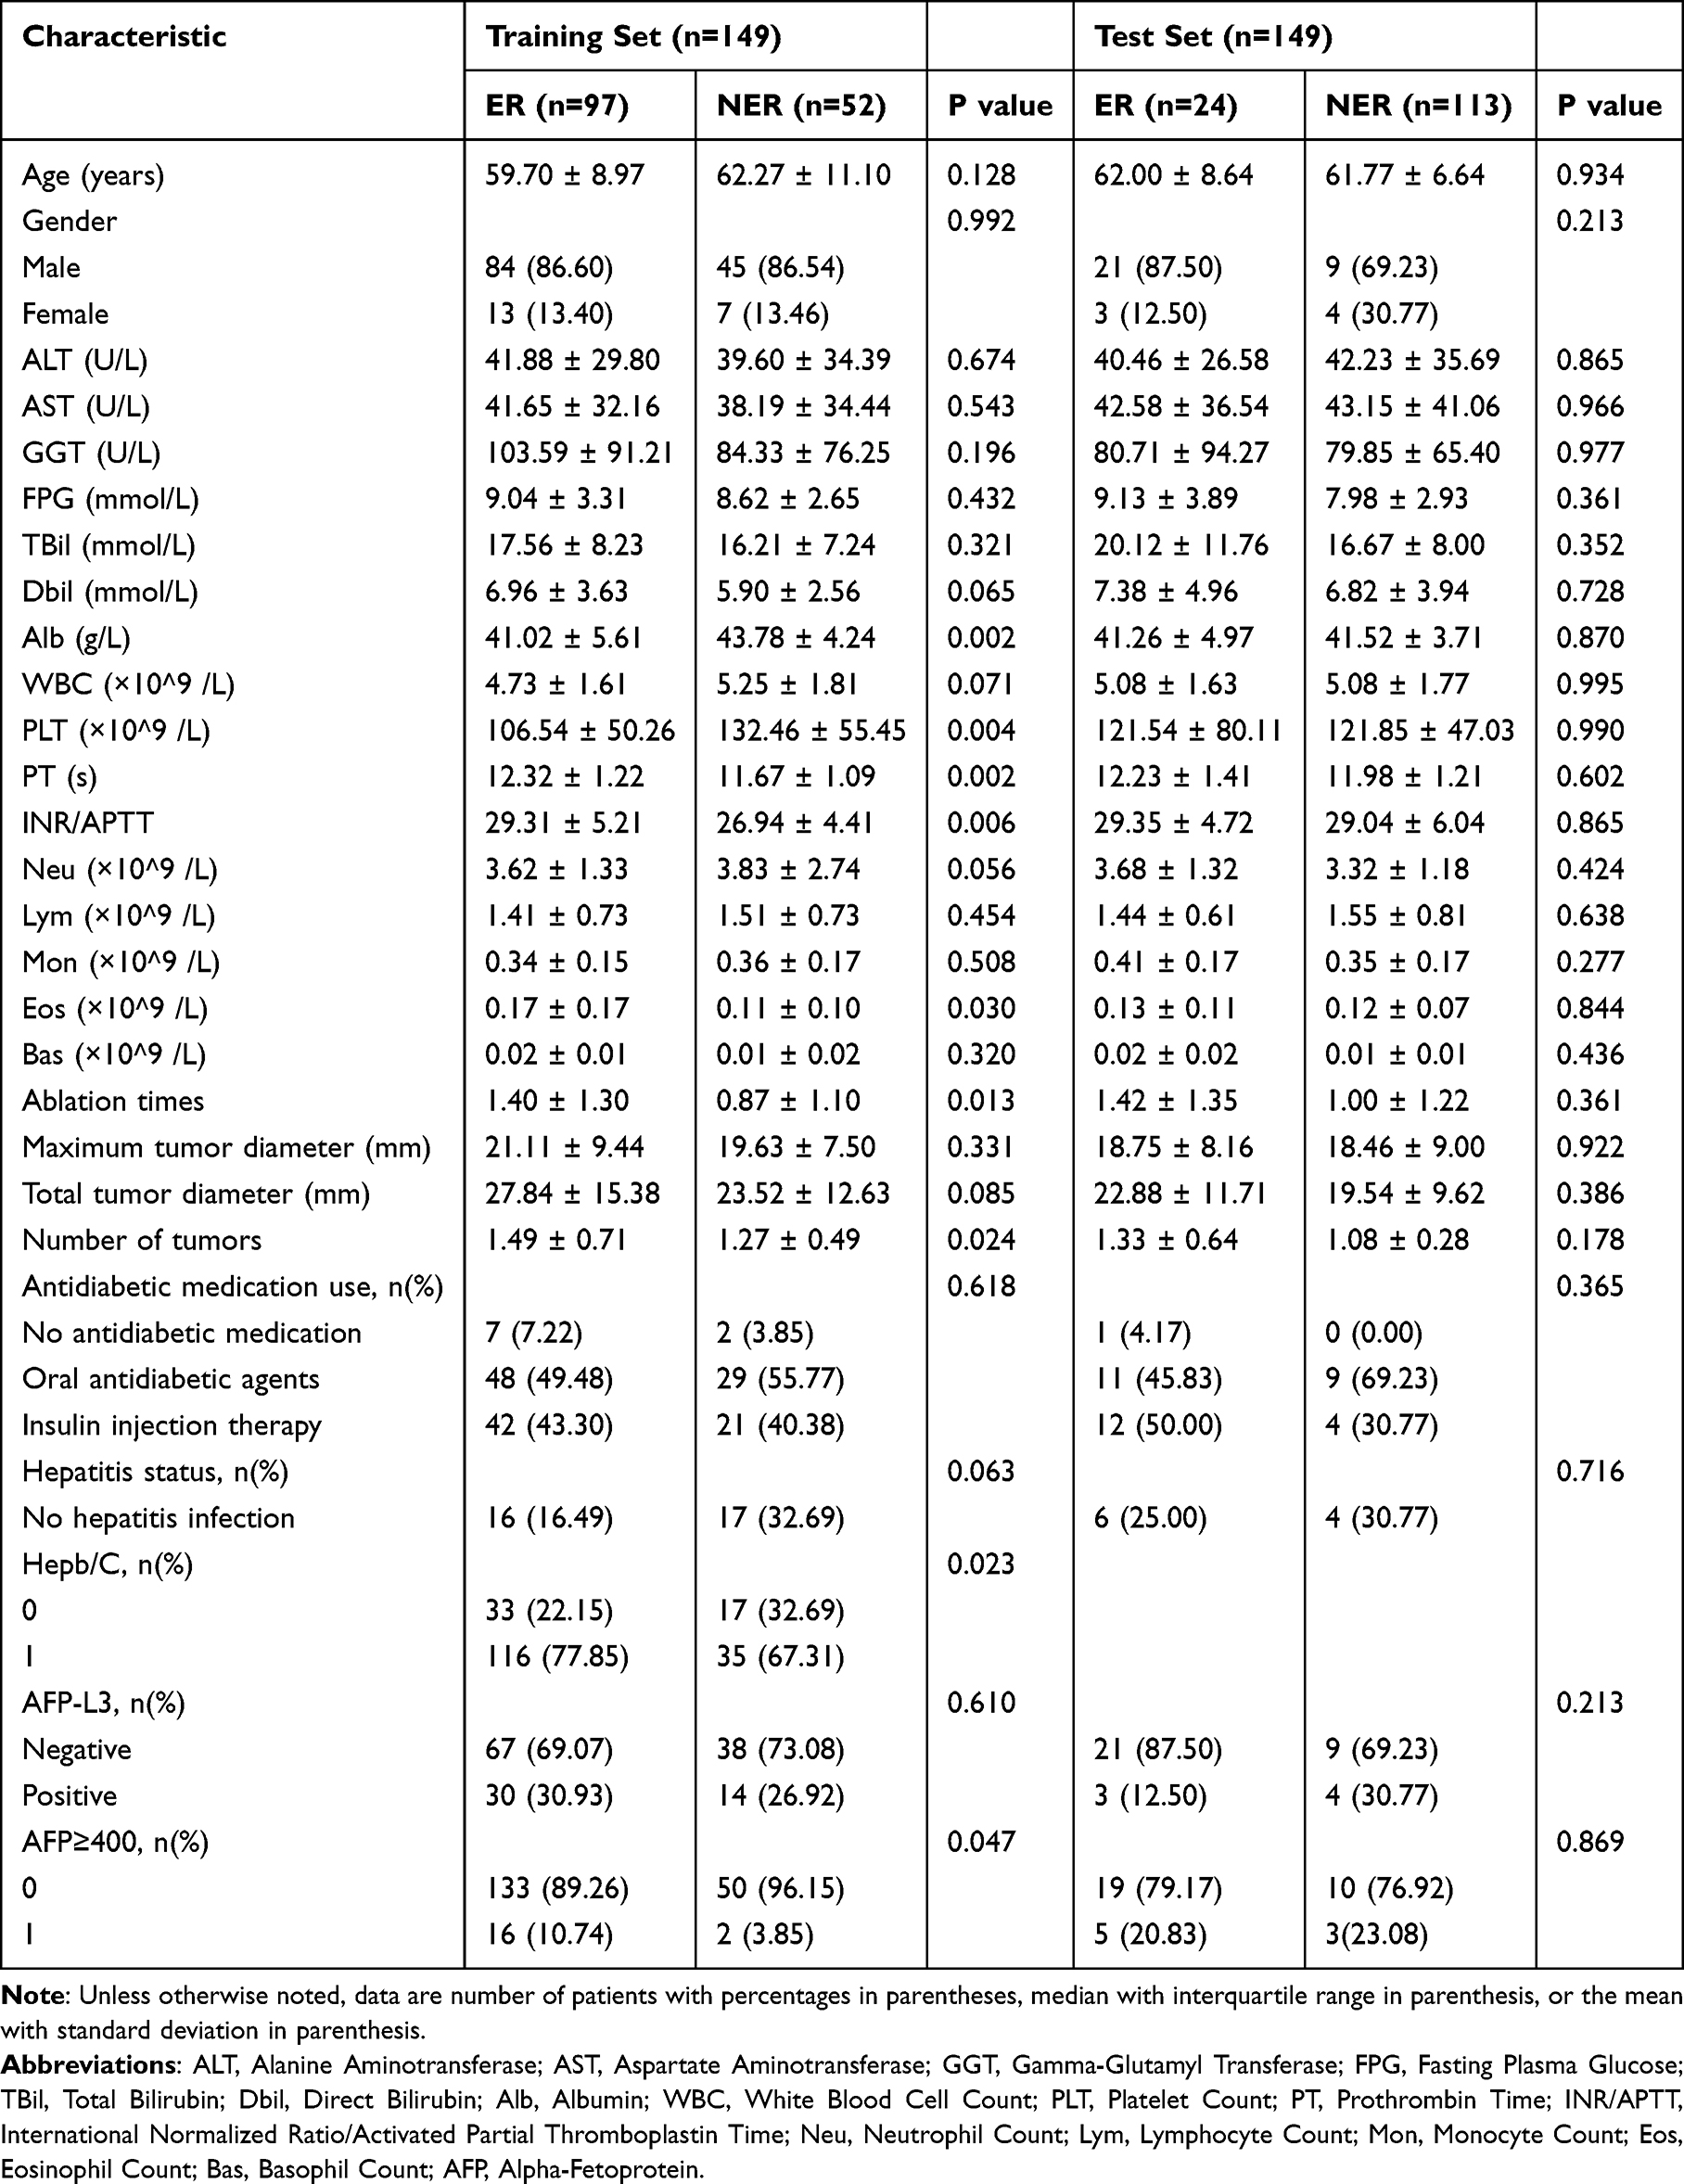 |
Table 1 Baseline Characteristics in Training and Test Sets for Predicting Early Recurrence, n (%) |
Radiomics Model Performance
From 108 extracted radiomics features, Spearman correlation (cutoff 0.90) and LASSO regression were used to select four core features with non-zero coefficients to construct the Radscore. Consistent with the prespecified evaluation framework, multiple performance metrics were compared across the six candidate algorithms. Among the six machine learning algorithms evaluated, the KNN model achieved superior predictive performance in the training cohort (AUC=0.826) and maintained the highest AUC in the validation cohort (0.774), with an AUC gap of only 0.052 between the two cohorts, indicating minimal performance decay and a very low degree of overfitting. In addition to discriminative power, the KNN model showed minimal overfitting risk and low computational overhead, which are favorable attributes for subsequent clinical translation. In the validation cohort, the KNN model had a sensitivity of 62.5%, a specificity of 84.6%, and a PPV of 88.2%. The detailed performance metrics for all the six models are presented in Supplementary Tables 1 and 2. Taken together, considering generalizability, robustness, computational efficiency, and clinical applicability, the KNN model was selected as the optimal radiomics model, and its RAD score was used for further integration.
Clinical Model and Combined Nomogram
To construct the clinical prediction model, univariate logistic regression was first performed, which identified the number of ablation sessions (P=0.023) and hepatitis status (P=0.031) as significant predictors of early recurrence. These two variables were subsequently entered into multivariate logistic regression analysis to construct the clinical model (Table 2). With only two independent clinical predictors retained, the clinical model maintains a parsimonious structure to minimize overfitting risk. The clinical model achieved an AUC of 0.732 (95% CI, 0.712–0.744) in the training cohort and 0.718 (95% CI, 0.668–0.768) in the validation cohort.
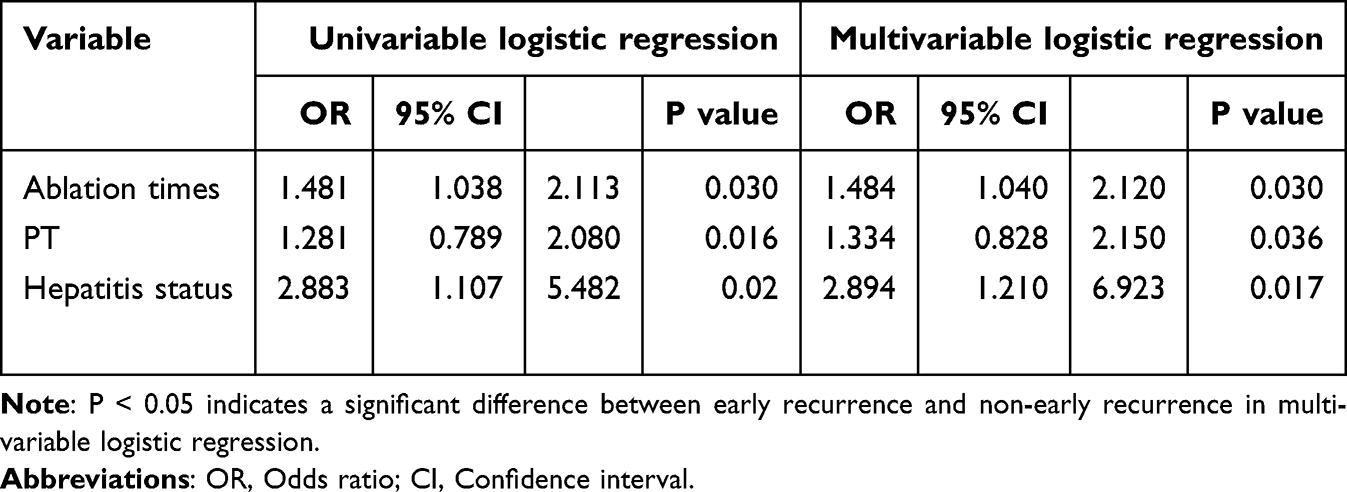 |
Table 2 Univariate and Multivariate Logistic Regression Analyses in Training Set for Predicting Early Recurrence |
The combined nomogram integrating the RAD -score and the two clinical predictors is shown in Figure 2. ROC curves (Figure 3) and comparative results (Tables 3 and 4) demonstrated that the combined nomogram outperformed both the clinical and radiomics models alone. Specifically, the combined model achieved AUCs of 0.877 (95% CI: 0.824–0.931) in the training cohort and 0.846 (95% CI: 0.687–0.973) in the validation cohort. DeLong tests confirmed that the differences between the combined model and clinical model (P=0.008) and between the combined model and radiomics model (P=0.041) in the validation cohort were statistically significant.
 |
Table 3 Diagnostic Value of Different Models in the Training Cohort |
 |
Table 4 Diagnostic Value of Different Models in the Validation Cohort |
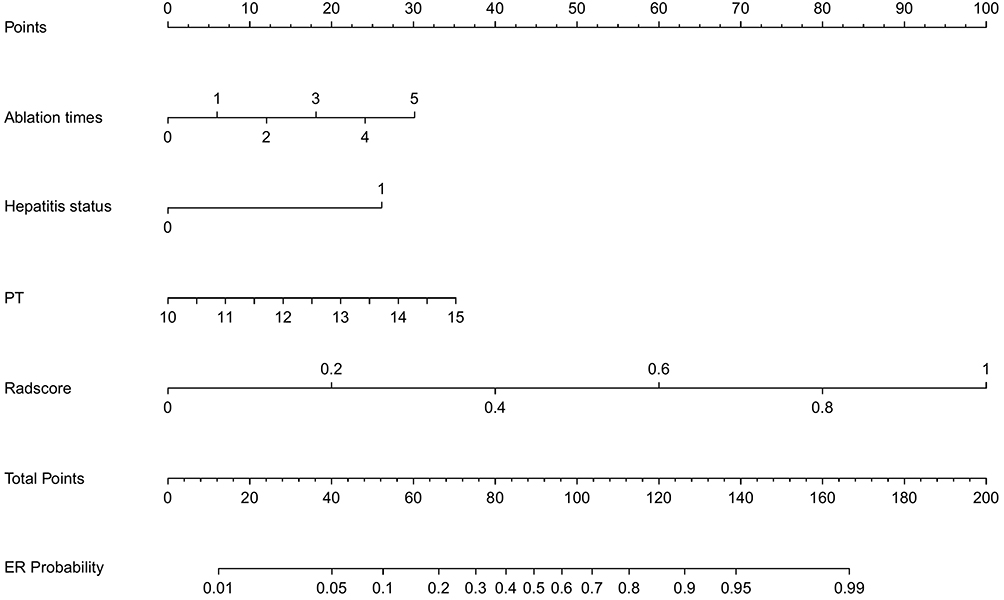 |
Figure 2 Nomogram for predicting early recurrence after microwave ablation in hepatocellular carcinoma patients with type 2 diabetes. |
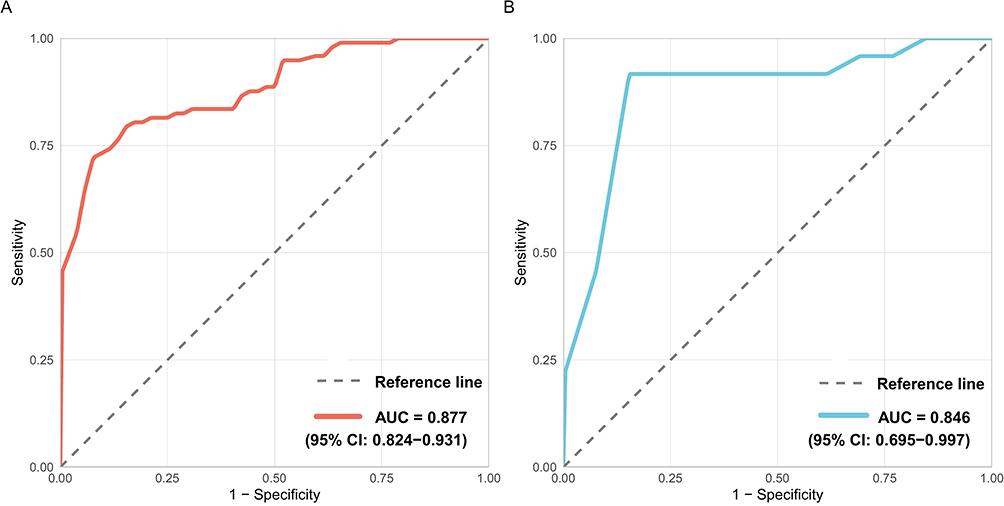 |
Figure 3 Receiver operating characteristic curves for training set, and validation set. (A) training set, (B) validation set. Abbreviation: AUC, Area under the curve. |
Beyond discriminative performance, the nomogram also achieved satisfactory accuracy and clinical utility. In terms of accuracy, the nomogram reached 82.0% in the validation cohort, which was higher than that of the radiomics model (76.0%) and the clinical model (80.0%). Additionally, the nomogram achieved an optimal balance between sensitivity and specificity: in the validation cohort, sensitivity was 80.0%, specificity was 83.8%, and the negative predictive value was 90.1%. The calibration curves showed good agreement between the predicted probabilities and the observed outcomes in both cohorts (Figure 4). Furthermore, decision curve analysis demonstrated that the nomogram provided higher net benefit than the “treat all” or “treat none” strategies across a wide range of threshold probabilities (0.1–0.9) (Figure 5).
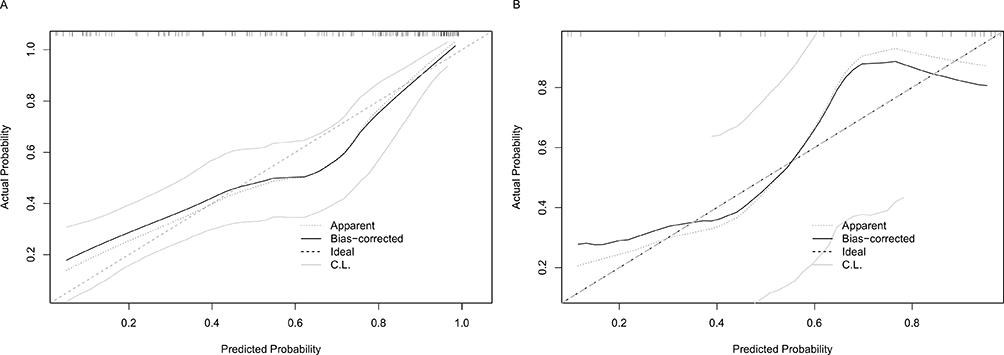 |
Figure 4 Calibration curves for training and validation sets. (A) training set; (B) validation set. |
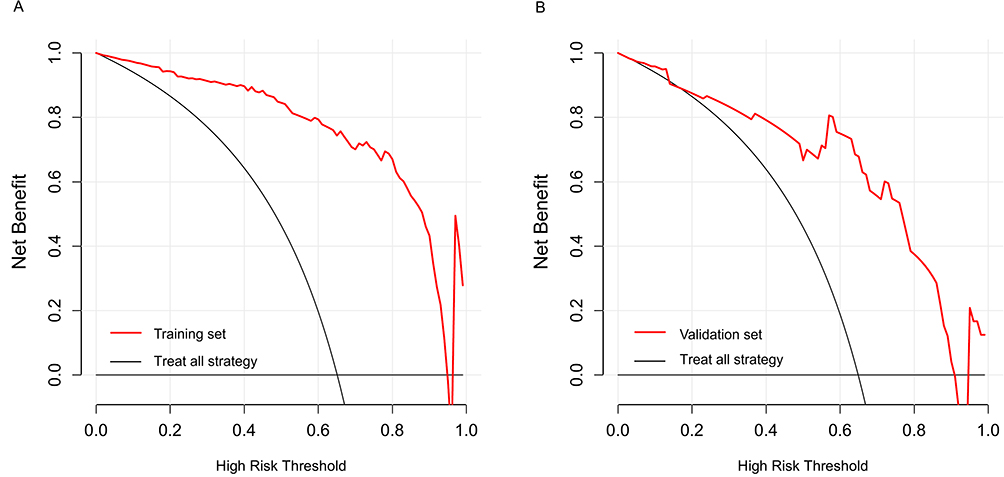 |
Figure 5 Decision curves for training and validation sets. (A) training set; (B) validation set. |
Risk Stratification and Biological Validation
Using the median nomogram score in the validation cohort as the cutoff, patients were stratified into low- and high-risk groups. In the training cohort (n=149), the high-risk group (n=75) had a significantly higher early recurrence rate (93.3% vs 36.5%) and shorter median PFS (6 months vs not reached) than the low-risk group (n=74), with a hazard ratio of 5.8 (95% CI: 3.66–9.2, P<0.001). In the validation cohort (n=37), the high-risk group (n=13) similarly exhibited a higher recurrence rate (84.6% vs 54.2%) and shorter median PFS (9 months vs 23 months), with an HR of 2.51 (95% CI: 1.11–5.67, P=0.022). Kaplan-Meier survival curves visually illustrated these differences (Figure 6).
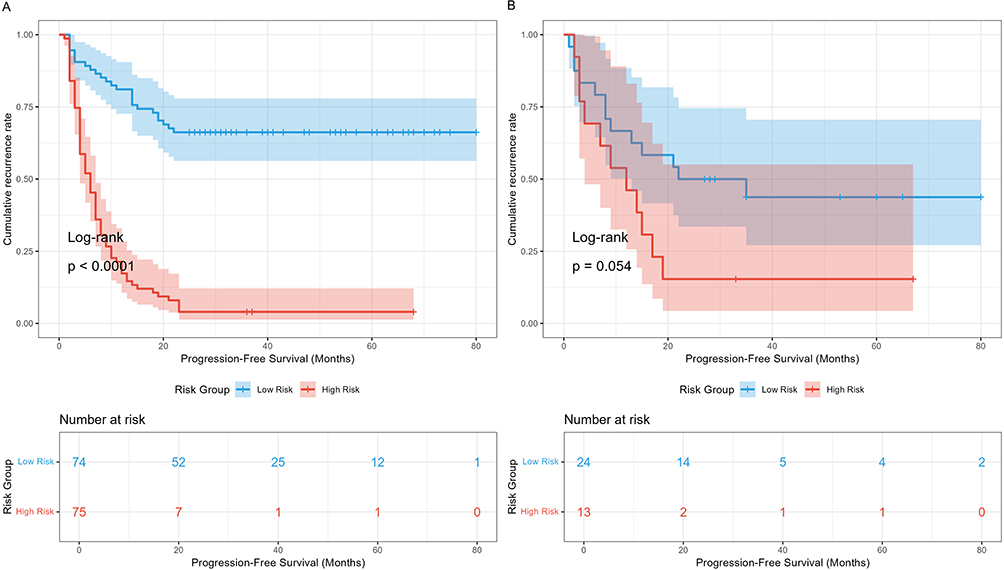 |
Figure 6 Kaplan-Meier analysis for association of nomogram score and PFS. (A) Training set; (B) Validation set. |
To further validate the biological plausibility of our model, we compared the pathological and immunohistochemical features between high-risk and low-risk groups in patients who underwent salvage resection after recurrence (41 patients, 33.88% of recurrent patients). This subgroup included 24 high-risk and 17 low-risk patients (Figure 7). The high-risk group showed a higher proportion of thick-trabecular type (70.8% vs 40.0%, P=0.030), lower tumor differentiation grade (75.0% vs 44.0%, P=0.027), and a higher rate of microvascular invasion (MVI) (70.6% vs 35.0%, P=0.031). Immunohistochemistry revealed higher expression rates of CD34 (95.8% vs 76.0%, P=0.047) and glypican-3 (GPC-3) (78.3% vs 45.5%, P=0.023) in the high-risk group.
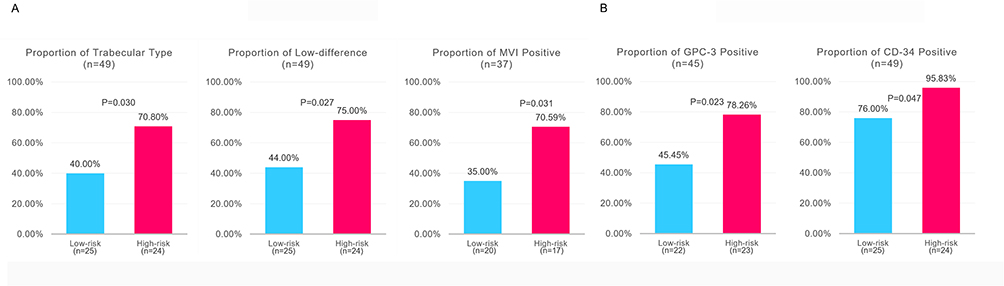 |
Figure 7 Biological information was collected to explain multimodal model results. (A) Pathology analysis; (B) Immunohistochemistry analysis. Abbreviations: MVI, Microvascular invasion; GPC-3, Glypican-3. |
Discussion
In this study, we developed and validated a combined nomogram integrating preoperative MRI-based radiomics features with conventional clinical indicators to predict early recurrence after MWA, specifically in patients with HCC and comorbid T2D. Quantitatively, the nomogram achieved AUCs of 0.877 and 0.846 in the training and validation cohorts, respectively, significantly outperforming either the clinical or radiomic model alone. Mechanistically, this finding indicates that clinical risk factors (reflecting host disease status) and radiomic features (capturing intratumoral heterogeneity) provide complementary prognostic information. Accordingly, their integration enables a more comprehensive assessment of early recurrence risk from two dimensions: underlying host disease and biological tumor behavior.
Several previous studies have explored radiomics-based prediction of recurrence after HCC ablation. Tabari et al26 developed a random forest model based on radiological and clinical features to predict pathological tumor response using pre-ablation MRI. Luo et al27 evaluated delta radiomics scores from multiphase contrast-enhanced MRI, combined with clinical features, to predict survival after thermal ablation. Li et al28 used a light-gradient boosting machine incorporating intratumoral and peritumoral regions to predict early recurrence after curative ablation. Chen et al29 constructed a deep learning-radiomics-clinical nomogram to identify patients with HCC with early recurrence within six months after thermal ablation. However, all these studies enrolled unselected HCC populations, without developing tailored models for the high-risk subgroup with comorbid T2D or considering the synergistic effect of T2D and cirrhosis on recurrence. Therefore, our study addresses this clinical gap by establishing a population-specific prediction model.
A notable finding of this study is that diabetes-related indicators (eg, fasting blood glucose, glycated hemoglobin, and use of hypoglycemic agents) were not retained in the final combined model. We attribute this result to three interrelated reasons. First, all participants had T2D, and the study aimed to build a population-specific model rather than compare diabetic and non-diabetic groups, leading to limited heterogeneity of diabetes-related variables. Second, T2D affects HCC recurrence mainly through indirect mechanisms including insulin resistance, chronic inflammation, and liver fibrosis, rather than direct glycemic effects. Prothrombin time and Radscore in our model have already captured core prognostic information mediated by diabetes, leaving no independent predictive value for direct glycemic indicators in multivariate analysis. Third, incomplete documentation of diabetes duration and specific regimens in this retrospective study further limited statistical power to detect their effects.
Beyond discriminative performance, survival analysis confirmed the nomogram’s robust prognostic stratification ability. In the training cohort, high-risk patients had a 5.8-fold higher recurrence risk than low-risk patients. In the independent validation cohort, despite the limited number of high-risk patients (n=13), the recurrence risk remained 2.51-fold higher, with a clinically meaningful difference in the median PFS of 14 months (23 vs 9 months). Collectively, these findings support the model’s clinical relevance.
From a clinical practice perspective, these findings support the translational value of the proposed nomogram for individualized postoperative management. Specifically, for high-risk patients identified by the nomogram, clinicians can adopt intensified surveillance strategies (eg, shortened follow-up intervals, additional imaging or tumor marker tests) and proactively evaluate the indication for adjuvant systemic therapies such as targeted therapy or immunotherapy to reduce recurrence risk. In contrast, for low-risk patients with relatively indolent tumor biology, standard follow-up protocols may be sufficient, avoiding unnecessary examinations and reducing healthcare burden. Notably, this risk-stratified management strategy is particularly relevant for HCC patients with comorbid T2D, who often have multiple underlying comorbidities and require more delicate treatment balance.
Despite favorable performance, this study has several limitations. First, this retrospective single-center study lacks external validation, limiting generalizability to other clinical settings. Second, although multiple strategies were implemented to control overfitting, including stepwise feature filtering, LASSO regularization, five-fold cross‑validation, and a parsimonious final model structure, internal validation alone cannot fully eliminate the potential risk of overfitting, and prospective external multicenter validation is required to further confirm the model’s generalizability and robustness. Third, retrospective design led to incomplete documentation of detailed diabetes-related information, precluding in-depth analysis of their impact on recurrence. Fourth, manual ROI delineation for radiomics extraction, despite good ICC-verified consistency, carries inherent inter-operator variability. Fifth, pathological validation was limited to recurrent patients receiving salvage surgery, which may introduce selection bias.
Based on these findings, we propose several future research directions. First, large prospective multicenter cohorts are needed to validate the model’s stability and generalizability. Second, prospective standardized collection of detailed diabetes indicators will help clarify whether glycemic control and treatment regimens can further improve model performance. Third, deep learning-based automatic segmentation can replace manual ROI delineation to improve efficiency and reproducibility. Fourth, whole-cohort pathological and molecular validation using pretreatment biopsy specimens will help elucidate the underlying biological mechanisms. Fifth, prospective interventional trials are warranted to verify whether this nomogram-based risk stratification can reduce early recurrence and improve long-term survival in this population.
Conclusion
In conclusion, within this single-center cohort of HCC patients with comorbid T2D, we developed and internally validated a nomogram integrating clinical features with MRI-based radiomics for predicting early recurrence within two years after MWA. The model demonstrated favorable discriminative ability, calibration, and clinical utility in the current study population, suggesting its potential as a noninvasive preoperative risk assessment tool for this specific patient group. If validated in external cohorts, it may assist clinicians in identifying high-risk patients, facilitating individualized postoperative surveillance strategies and adjuvant interventions, and ultimately supporting improved patient management. Further prospective multicenter validation and technical optimization are warranted to confirm its broader clinical applicability.
Patient Consent
Consent for publication was obtained for every individual’s data include in the study.
Disclosure
The authors report no conflicts of interest in this work.
References
1. Filho AM, Laversanne M, Ferlay J, et al. The GLOBOCAN 2022 cancer estimates: data sources, methods, and a snapshot of the cancer burden worldwide. Int J Cancer. 2025;156:1336–12. doi:10.1002/ijc.35278
2. Jemal A. Global cancer statistics 2018: GLOBOCAN estimates of incidence and mortality worldwide for 36 cancers in 185 countries. CA Cancer J Clin. 2018;68. doi:10.3322/caac.21492
3. Sensi B, Angelico R, Toti L, et al. Mechanism, potential, and concerns of immunotherapy for hepatocellular carcinoma and liver transplantation. Curr Mol Pharmacol. 2024;17:e18761429310703. PMID: 39225204. doi:10.2174/0118761429310703240823045808
4. Zhou Y, Gu J, Yu H, et al. Screening and identification of ESR1 as a target of icaritin in hepatocellular carcinoma: evidence from bibliometrics and bioinformatic analysis. Curr Mol Pharmacol. 2024;17:e18761429260902. PMID: 38239068. doi:10.2174/0118761429260902230925044009
5. Gao W, Wang W, Song D, et al. A predictive model integrating deep and radiomics features based on gadobenate dimeglumine-enhanced MRI for postoperative early recurrence of hepatocellular carcinoma. La radiologia medica. 2022;127(3):259–271. doi:10.1007/s11547-021-01445-6
6. Rimola J, Forner A, Sapena V, et al. Performance of gadoxetic acid MRI and diffusion-weighted imaging for the diagnosis of early recurrence of hepatocellular carcinoma. Eur Radiol. 2020;30(1):186–194. doi:10.1007/s00330-019-06351-0
7. Giovannucci E, M HD, C AM, et al. Diabetes and Cancer. Am Diabet Assoc. 2010. doi:10.2337/dc10-0666
8. Mu R, Chang M, Feng C, et al. Analysis of the expression of PRDX6 in patients with hepatocellular carcinoma and its effect on the phenotype of hepatocellular carcinoma cells. Curr Genomics. 2024;25(1):2–11. PMID: 38544826; PMCID: PMC10964084. doi:10.2174/0113892029273682240111052317
9. B GC, Picariello R. Tartaglino B, et al. Hepatocellular carcinoma in a large cohort of type 2 diabetes patients. Diabetes Res Clin Pract. 2023;200. doi:10.1016/j.diabres.2023.110684
10. El–Serag HB, Hampel H, Javadi F. The association between diabetes and hepatocellular carcinoma: a systematic review of epidemiologic evidence. Clin Gastroenterol Hepatol. 2006;4(3):369–380. doi:10.1016/j.cgh.2005.12.007
11. Itoh H, Kaneko H, Okada A, et al. Fasting plasma glucose and incident colorectal cancer: analysis of a nationwide epidemiological database fasting plasma glucose and colorectal cancer. J Clin Endocrinol Metab. 2021;106(11):e4448–e4458. doi:10.1210/clinem/dgab466
12. Giovannucci E, Michaud D. The Role of Obesity and Related Metabolic Disturbances in Cancers of the Colon, Prostate, and Pancreas. Gastroenterology. 2007;132(6):2208–2225. doi:10.1053/j.gastro.2007.03.050
13. Joshu CE, Prizment AE, Dluzniewski PJ, et al. Glycated hemoglobin and cancer incidence and mortality in the Atherosclerosis in Communities (ARIC) Study, 1990–2006. Int J Cancer J Inter du Cancer. 2012;131(7):1667–1677. doi:10.1002/ijc.27394
14. Singh MK, KumarChoudhary B, SandeepGupta D, Umesh K. Diabetes and hepatocellular carcinoma: a pathophysiological link and pharmacological management. Biomed Pharmacothe. 2018;106:991–1002.
15. I CL, A CO, A BI, et al. Association between liver cirrhosis and diabetes mellitus: a review on hepatic outcomes. J Clin Med. 2021;10(2):262. doi:10.3390/jcm10020262
16. P JM, Patel J, Byrne CD. Diabetes is associated with increased risk of hepatocellular carcinoma in non-alcoholic steatohepatitis with cirrhosis – Implications for surveillance and future pharmacotherapy. 肝胆外科与营养. 2020(2):5. doi:10.21037/hbsn.2019.10.09
17. Zang Y, Xu W, Qiu Y, Jiang X, Fan Y. Presence of diabetes further heightens hepatocellular carcinoma risk in patients with hepatitis B or hepatitis C virus-related cirrhosis: a meta-analysis. Heliyon. 2023;9:e18425. doi:10.1016/j.heliyon.2023.e18425
18. Mahajan A, Esper S, Oo TH, et al. Development and validation of a machine learning model to identify patients before surgery at high risk for postoperative adverse events. JAMA Network Open. 2023;6(7):e2322285. doi:10.1001/jamanetworkopen.2023.22285
19. Gomes MA, Priolli DG, Tralhao JG, Botelho MF. Hepatocellular carcinoma: epidemiology, biology, diagnosis, and therapies. Rev Assoc Med Bras. 2013. doi:10.1016/S2255-4823(13)70511-3
20. Lambin P, H LRT, M DT, et al. Radiomics: the bridge between medical imaging and personalized medicine. Nat Rev Clin Oncol. 2017;14:749–762. doi:10.1038/nrclinonc.2017.141
21. Gillies RJ, Kinahan PE, Hricak H. Radiomics: images are more than pictures, they are data. 2013.
22. Gao R, Zhao S, Aishanjiang K. Deep learning for differential diagnosis of malignant hepatic tumors based on multi-phase contrast-enhanced CT and clinical data. J Hematol Oncol. 2021;14(1):154. doi:10.1186/s13045-021-01167-2
23. Wu M, Tan H, Gao F, et al. Predicting the grade of hepatocellular carcinoma based on non-contrast-enhanced MRI radiomics signature. Eur Radiol. 2019;29(6):2802–2811. doi:10.1007/s00330-018-5787-2
24. Yu Y, Fan Y, Wang X, et al. Gd-EOB-DTPA-enhanced MRI radiomics to predict vessels encapsulating tumor clusters (VETC) and patient prognosis in hepatocellular carcinoma. Eur Radiol. 2022;32(2):959–970. doi:10.1007/s00330-021-08250-9
25. Chen B, Gan YY, Zou EG, et al. Machine learning and radiomics-based model for predicting response to lenvatinib combined with TACE in patients with unresectable hepatocellular carcinoma. Zhonghua Yi Xue Za Zhi. 2026;106(12):1162–1170. Chinese. doi:10.3760/cma.j.cn112137-20260120-00240
26. Tabari A, D’Amore B, Cox M, et al. Machine learning-based radiomic features on pre-ablation MRI as predictors of pathologic response in patients with hepatocellular carcinoma who underwent hepatic transplant. Cancers. 2023;15(7):2058. doi:10.3390/cancers15072058
27. Luo J, Xin H, Wang Y, et al. Multiphase MRI-derived delta radiomics integrated with clinical features for survival prediction in hepatocellular carcinoma after thermal ablation. Eur J Radiol. 2025;192(c):112368. doi:10.1016/j.ejrad.2025.112368
28. H LY, X QG, Yao L, et al. Preoperative model for predicting early recurrence in hepatocellular carcinoma patients using radiomics and deep learning: A multicenter study. World J Gastroint Oncol. 2025;17(6):136–150.
29. Chen Y, Zhao Y, Guan W, et al. MRI-based deep learning and radiomics nomogram for predicting hepatocellular carcinoma recurrence within six months after thermal ablation. J Hepatocell Carcinoma. 2025;12:2247–2261. doi:10.2147/JHC.S541329
 © 2026 The Author(s). This work is published and licensed by Dove Medical Press Limited. The
full terms of this license are available at https://www.dovepress.com/terms
and incorporate the Creative Commons Attribution
- Non Commercial (unported, 4.0) License.
By accessing the work you hereby accept the Terms. Non-commercial uses of the work are permitted
without any further permission from Dove Medical Press Limited, provided the work is properly
attributed. For permission for commercial use of this work, please see paragraphs 4.2 and 5 of our Terms.
© 2026 The Author(s). This work is published and licensed by Dove Medical Press Limited. The
full terms of this license are available at https://www.dovepress.com/terms
and incorporate the Creative Commons Attribution
- Non Commercial (unported, 4.0) License.
By accessing the work you hereby accept the Terms. Non-commercial uses of the work are permitted
without any further permission from Dove Medical Press Limited, provided the work is properly
attributed. For permission for commercial use of this work, please see paragraphs 4.2 and 5 of our Terms.
Recommended articles

Integration of Multimodal Computed Tomography Radiomic Features of Primary Tumors and the Spleen to Predict Early Recurrence in Patients with Postoperative Adjuvant Transarterial Chemoembolization
Chen C, Liu J, Gu Z, Sun Y, Lu W, Liu X, Chen K, Ma T, Zhao S, Zhao H
Journal of Hepatocellular Carcinoma 2023, 10:1295-1308
Published Date: 8 August 2023
Establishing and Externally Validating a Hemoglobin, Albumin, Lymphocyte, and Platelet (HALP) Score-Based Nomogram for Predicting Early Recurrence in BCLC Stage 0/A Hepatocellular Carcinoma Patients After Radical Liver Resection: A Multi-Center Study
Liu X, Qiu Z, Ndhlovu E, Wan Y, Sun H, Wang S, Cao Y, Zhu P
Journal of Hepatocellular Carcinoma 2024, 11:1127-1141
Published Date: 14 June 2024

Bridging the Gap Between Imaging and Molecular Characterization: Current Understanding of Radiomics and Radiogenomics in Hepatocellular Carcinoma
Ren L, Chen DB, Yan X, She S, Yang Y, Zhang X, Liao W, Chen H
Journal of Hepatocellular Carcinoma 2024, 11:2359-2372
Published Date: 27 November 2024
CT Radiomics Combined with Metabolic-Biomarkers Enables Early Recurrence Prediction in Hepatocellular Carcinoma

Ren L, Chen D, Xu T, Wei R, Zhao B, Zhou Y, He Y, Liao M, Chen H, Liao W
Journal of Hepatocellular Carcinoma 2025, 12:2183-2196
Published Date: 29 September 2025
Preoperative Prediction of TACE Refractoriness in Hepatocellular Carcinoma Using CT-Based Radiomics Model
Yang L, Liu D, Yang S, Chen J, Wen G
Journal of Hepatocellular Carcinoma 2026, 13:587246
Published Date: 27 April 2026