
Back to Journals » Clinical Ophthalmology » Volume 20
Development and Clinical Accuracy of the New Paraxial Ray-Tracing IOL Power Formula (VRT) Based on the Thin Lens Assumption
Authors Voytsekhivskyy OV 
Received 26 March 2026
Accepted for publication 26 May 2026
Published 29 May 2026 Volume 2026:20 611115
DOI https://doi.org/10.2147/OPTH.S611115
Checked for plagiarism Yes
Review by Single anonymous peer review
Peer reviewer comments 2
Editor who approved publication: Dr Sotiria Palioura
Oleksiy V Voytsekhivskyy
Department of Corneal Pathology, Ophthalmic Oncology and Oculoplasty, Kyiv Clinical Ophthalmology Hospital Eye Microsurgery Center, Kyiv, Ukraine
Correspondence: Oleksiy V Voytsekhivskyy, Department of Corneal Pathology, Ophthalmic Oncology and Oculoplasty, Kyiv Clinical Ophthalmology Hospital Eye Microsurgery Center, Kyiv, Ukraine, Tel +38 067 584-28-11, Email [email protected]
Purpose: To develop and evaluate the refractive and clinical accuracy of the novel IOL power calculation formula (VRT) in unoperated Caucasian eyes.
Methods: This retrospective and single-center study included 1016 eyes of 1016 patients, all operated on by a single surgeon using PARTIAL-RoF narrow IOL (Tecnis 1 ZCB00, Johnson & Johnson Vision, Jacksonville, FL, USA). The complete data set was divided into two groups: the first was used to develop the new formula (489 eyes), and the second—the test group (527 eyes)—was used to assess its performance alongside other formulas (Barrett Universal II (BUII), Haigis, Hoffer Q, Hoffer QST, Holladay 1, Cooke K6, Kane, Norrby RT, Olsen (OLCR), Olsen (standalone), Pearl-DGS, SRK/T, VRF, and VRF CMAL). The VRT formula is based on a paraxial ray-tracing method that employs two constants and the thin-lens assumption. The ELP algorithm was adopted from the VRF formula, incorporating the Cooke-modified axial length (CMAL) correction. Subgroup analysis was also stratified by axial length as follows: short (≤ 22.00 mm), medium (22.01– 25.99 mm), and long (≥ 26.00 mm). Preoperative examination was performed using the SS-OCT biometer (IOLMaster 700; Carl Zeiss Meditec AG). All descriptive statistics were analyzed using optimized lens constants.
Results: The VRT formula demonstrated the highest accuracy (SD 0.358 D), outperforming all traditional formulas (Haigis, Hoffer Q, Holladay 1, SRK/T), modern thin lens formulas (VRF), and some ray-tracing methods (Norrby RT, Olsen (OLCR), Olsen (standalone); P < 0.05). Meanwhile, the new formula showed comparable accuracy with modern methods such as BUII, Hoffer QST, Cooke K6, Kane, and Pearl-DGS (P > 0.05).
Conclusion: The VRT formula showed promising results, outperformed traditional formulas, and was comparable to modern IOL power calculation methods in Caucasians, using one IOL model, which can be considered a limitation of this study.
Keywords: IOL power, VRT formula, IOLMaster 700, calculation, ray-tracing
Introduction
Intraocular lens (IOL) power calculation is a crucial part of any cataract surgery. Over the past decade, cataract surgery has evolved into a more comprehensive refractive procedure, encompassing not only the removal of a cloudy lens but also the correction of vision.1,2 As a result, patient expectations have increased, prompting the development of new, alternative, sophisticated, and more accurate methods for calculating intraocular lens power.3–5
Despite the rapid development of artificial intelligence (AI) and its application to IOL power calculation, alternative physical principles remain widely used to calculate IOL power. Gaussian optics (including assumptions for the thin and thick lenses) and ray-tracing are proven methodologies that have demonstrated accuracy and finite precision in intraocular lens selection.6–8
Recently, a classification of IOL power calculation formulas based on physical principles has been established, providing a clear and accurate description of existing calculation methods.9 Four main groups based on physical principles were highlighted: formulas based on Gaussian optics (vergence), ray-tracing methodology, artificial intelligence methods, and hybrid models that combine aspects of these approaches. Today, more than thirty intraocular lens power calculation methods have been introduced.10–12 Some are well-described, but many lack detailed information. For most of these methods, only partial information is available about their physical principles and mathematical methodology. The Haigis, Hoffer Q, Holladay 1, and SRK/T are widely used methods that were described many years ago.13–16 Among the newer methodologies, Castrop, Naeser 2, Pearl-DGS, T2, and VRF have also been described and can be easily reproduced in Excel following the authors’ recommendations.4,5,17–19 Newer techniques such as Eom, EVO 2.0, Hoffer QST, Cooke K6, Kane, Karmona, Ladas Super Formula AI (hereafter, LSF AI), Panacea, and VRF-G remain proprietary and cannot be reproduced without the authors’ involvement.3,20–27 Aside from these, a small subset of methods includes paraxial (Barrett Universal II, O formula, Olsen (standalone), Olsen (OLCR), and Z-Calc) and exact ray-tracing techniques, such as CSO, OKULIX, and Olsen.7,28–33 The only hybrid model that combines ray-tracing and AI is the ZEISS-AI formula, introduced by Zeiss, which is not yet commercially available.34
The focus of this study is on the recently developed ray-tracing IOL power calculation formula by the author. Voytsekhivskyy ray-tracing (hereafter, VRT) is based on a paraxial ray-tracing methodology that uses two constants and the thin lens assumption. This allows it to be used without detailed information about the IOL geometry, including radii, refractive index, thickness, and other parameters that are often hidden by lens manufacturers.
This investigation aims to compare the accuracy of the novel ray-tracing formula (VRT) with established methods such as Haigis, Hoffer Q, Holladay 1, and SRK/T, as well as modern ray-tracing formulas including Barrett Universal II, Norrby RT, Olsen (standalone), and Olsen (OLCR). The three vergence AI methods (Hoffer QST, Kane, and PEARL-DGS), as well as modern vergence thin lens formulas (Cooke K6, VRF, and VRF CMAL), were also included in the comparison. In total, fifteen IOL power calculation formulas were compared and analyzed. The goal was not only to assess the pure refractive accuracy of the new formula, but also to evaluate its clinical importance and compare it with well-known methods based on different physical principles.
Materials and Methods
The full data set (1016 eyes) was divided into two subsets: the first (489 eyes) was used to develop the new formula, and the second—the test group (527 eyes)—was used to evaluate its performance relative to the other formulas. We retrospectively recruited 1016 eyes of 1016 patients who had undergone uneventful sutureless phacoemulsification under topical anesthesia (Oxybuprocaine hydrochloride 0.4% solution) and implantation of a one-piece hydrophobic acrylic posterior chamber PARTIAL−RoF narrow IOL (Tecnis 1 ZCB00, Johnson & Johnson Vision, Jacksonville, FL, USA) by one cataract surgeon between August 2018 and January 2025. As the routine technique for lens removal, we used the “phaco-chop” technique with a clear corneal tunnel incision of 2.2 mm with a 5.0 mm circular capsulorhexis. The study patients’ characteristics are presented in Table 1.
 |
Table 1 Demographics of Study Subjects. |
The research is compliant with the Health Insurance Portability and Accountability Act, and all participant data were anonymized to ensure confidentiality. The study methods adhered to the Helsinki Declaration on Human Participation in Biomedical Research. The research was approved by the local ethics committee (Institutional Review Board of Center Microsurgery of Eye №202501-Ethics). Written informed consent was obtained from each patient before cataract surgery.
All patients had cataracts without comorbidity according to Wisconsin grades 3 or 4. The inclusion criteria comprised participants aged between 26 and 95 years with all AL ranges. Of the 1063 patients who had cataract surgery with IOL implantation, 1016 were eligible for inclusion in this study; 47 eyes of 47 patients were excluded due to different considerations, including CDVA worse than 20/30 (n = 21), high intraocular pressure (n = 10), macular edema (n = 8), or postoperative corneal astigmatism higher than 1.60 D (n = 8).
In accordance with Hoffer’s recommendations, only one eye of each patient was included in the study.33 When bilateral cataract surgery was performed, only the right eye was enrolled in analysis. After surgery, all patients were examined at 8–12 weeks postoperative by one of the authors (OVV). Uncorrected and corrected distance visual acuity measurement, tonometry, automatic kerato-refractometry, and ophthalmoscopy were performed.
Postoperative refraction (PO) was first assessed by an automatic kerato-refractometer (RT-7000, Ver.1.7, Tomey, Japan). Then, the obtained value was used as the basis for PO subjective refraction, which was measured at 6 m.
All participants underwent preoperative biometric examination using the swept-source optical coherence tomography (SS-OCT) biometry instrument, the IOLMaster 700, with the Standard K value (software versions 1.70 and 1.88, Carl Zeiss Meditec AG, Jena, Germany). The actual IOL power was picked up based on the results of the Barrett Universal II and SRK/T formulas.
Postoperative IOL power calculation was performed using fifteen formulas: Barrett Universal II (BUII), Haigis, Hoffer Q, Hoffer QST, Holladay 1, Cooke K6, Kane, Norrby RT, Olsen (OLCR), Olsen (standalone), Pearl-DGS, SRK/T, VRF, VRF CMAL, and VRT (Supplementary material, part 1).
Optimization of the formulas was performed as previously described by the authors.10,35 The lens constant was optimized to achieve a mean zero prediction error (PE), that is, a zero mean difference between the predicted and the PO refraction. Optimization of the Hoffer Q, Holladay 1, SRK/T, VRF, and VRF CMAL formulas was performed using the Goal Seek function in the Excel menu, as previously recommended.10 With the Haigis formula, triple optimization was carried out. Optimization of the Norrby RT formula was performed using the Goal Seek function as the author recommended, with the determination of refraction value at 6 m.6 Optimization of the VRT formula was performed in the same manner, with the determination of refraction value at 6 m. The optimized ACD constant and C constant values for the Olsen (standalone) (PhacoOptics software, version 1.10.100.2029; IOL Innovations Aps, Aarhus, Denmark) and Olsen (OLCR) (version i8.0.0.0, Haag-Streit AG, Switzerland) formulas were 4.96 and 0.46, respectively. For the Hoffer QST (www.HofferQST.com), the available Excel file (Research section) was used for constant optimization. For the Barrett, the value of the optimized A-constant was empirically derived by reiteration until a zero mean PE was obtained. Optimization and data analysis for contemporary or unpublished formulas were performed for us by their respective authors via personal communication (Kane J, Cooke DL, Debellemanière G). For each technique, the main goal was to obtain the constant leading to a mean PE near zero (0.000). In this condition, the terms for a comparative analysis were equal for all formulas.
When constant optimization was performed for the tested dataset, the mean PE, its standard deviation (SD), root-mean-square absolute error (RMSAE), and absolute errors (MedAE and MAE) were calculated. As a secondary outcome, we assessed the percentage of eyes achieving a PE within ±0.50 D.36
Subgroup analysis was performed on short eyes (AL ≤ 22.0 mm, n = 47), medium eyes (AL between 22.01 and 25.99 mm, n = 435), and long eyes (AL ≥ 26.0 mm, n = 45).
Statistical Analysis
R software 4.4.1 (R language and Environment for Statistical Computing, https://www.Rproject.org/) and SPSS (version 23.0, IBM Inc, Chicago, Illinois, USA) were used for statistical parsing.37 The Shapiro–Wilk test was applied to check for normal Gaussian distributions. According to this test, neither the PE nor its absolute values were normally distributed (P < 0.001). The Wilcox-Holladay-Wang-Koch (WHWK) statistics package for R was implemented as described by Holladay et al, with the SD of the PEs as a parameter to evaluate formula performance.38 The Holm p-value sequential correction was applied for multiple comparisons. A p-value less than 0.05 was considered statistically significant. The RMSAEs were compared using a bootstrap test with Holm’s correction. A nonparametric McNemar’s Chi-squared test with continuity correction was used to determine P values for every pair of formulas, and the adjusted P values using Holm’s correction were used to compare the percentage of eyes with a PE within ±0.50 D.
A minimum sample size of 387 eyes was calculated using a priori power analysis of the Wilcoxon signed-rank test (G*Power 3.1.9.4, Heinrich Heine University Duesseldorf, Germany), with a Cohen’s effect size of 0.15, a power level of 0.95, and an alpha level of 0.05.39 A post hoc analysis based on the same non-parametric statistical model of the test data set (n = 527), with the highest SD of 0.472 and a lowest SD of 0.358, with a calculated actual effect size of 0.10, and two tails, yielded a power of 0.801 for an alpha level of 0.05.
Results
Investigation of the Formula
Essentially, ray-tracing involves tracing a ray of light through a system of surfaces by calculating the angle of refraction/reflection at each surface. Paraxial ray tracing involves small ray angles and heights and tracing the rays that are close to the optical axis, thereby simplifying the system with the following approximations.

Ray-tracing involves two primary equations (ray height – y and ray angle – u) in addition to the one for calculating power.


The indices of refraction (n’) and thickness (t’) are additional parameters used for ray-tracing calculations. In contrast to exact ray tracing, in the paraxial system, there are no aberrations, and an object at a single point produces an image at a single point. Depending on the lens model (thin or thick), a different number of surfaces, such as virtual principal planes or true refractive surfaces, can be involved. In 2004, Norrby developed thick and thin-lens ray-tracing formulas based on data from 44 cases using Tecnis ZA9003 aspheric IOL.6 Because curvatures, thickness, refractive index, and other IOL parameters must be obtained from the manufacturers, and are usually hidden, we followed Norrbys’ conception of the paraxial ray-tracing thin lens assumption. In this way, despite simplification, the formula can be easily implemented in clinical practice and scientific research without requiring the manufacturers to provide the underlying specification of IOL data.
The thin lens methodology is widely used by authors, and many IOL power calculation formulas are based on it.5,13–16 Thin lenses are represented by a system with the assumption that the thickness of the lenses is zero, and a thin refracting surface is introduced at the main plane of the IOL. The proposed formula is a system of three refracting surfaces: the spectacle, the cornea, and the IOL. Usually, authors provide this as a spreadsheet, but we describe it in the equation’s closed form.
Similar to paraxial ray-tracing formulas, this method can, in principle, be divided into two main parts: geometrical back focal distance (GBFD) and optical back focal distance (OBFD). The system is in focus if the OBFD is equal to the GBFD, and the refractive error (Rx) can be found through the condition that the difference between OBFD and GBFD is exactly zero. All equations related to the presented formula are described in detail in the section “Supplementary material, part 2”.
Investigation of ELP
The estimated lens position (ELP) algorithm was adopted from the VRF formula and described in detail in the corresponding article.40 It is empirical and based on the data of the preoperative parameters of the eye (AL, K, ACDpre, CD), values of the optical power of the implanted two different types of IOLs, and the received postoperative manifest refraction. The Cooke modified axial length (CMAL) correction, using the LT value, was implemented for AL correction (Supplementary material, part 2). As a constant, it uses the so-called optical constant of the anterior chamber depth (Optical CACD). Because we used an ELP that was theoretically derived (ELPt) and does not reflect the actual position of the posterior surface of the thick lens IOL, the IOL offset = 0, and can be omitted in the calculations (Supplementary material, part 2). After the adoption of the ELPt, the new paraxial ray-tracing model was tested on the first (develop) subgroup of patients (489 eyes, Tecnis 1 ZCB00, Johnson & Johnson Vision, Jacksonville, FL, USA).
The ELPt is a pivotal part of the GBFD equation:
GBFD=ALtru-ELPt+RCF+IOLo;
where
ALtru - true axial length;
ELPt - theoretically derived estimated lens position;
RCF - retina correction factor;
IOLo - IOL offset;
ALtru = (AL(CMAL)+RT);
where
AL(CMAL) - Cooke modified axial length;
RT – retina thickness; RT = +0.20;
AL(CMAL)=(1.23853+0.95855*ALo-0.05467*LT);
where
ALo - AL optical;
LT – lens thickness;
ELPt = f (CACD; AL(CMAL); K; ACDpre; LT; CD);
ELPt = (((CACD*0.051)-0.006)*(1.23853+0.95855*ALo-0.05467*LT))+(((CACD*0.019)-0.008) *(337.5/Ra))+(((CACD*0.053)+0.005)*ACDpre)-(((CACD*0.013)-0.003)*CD)-((CACD*0.959)-0.013);
Optical CACD constant=(Optical A-constant*0.62467)-68.82;
ELPt corneal power K = 337.5/Ra;
ACDpre – preoperative anterior chamber depth, mm;
CD – horizontal corneal diameter (HWTW), mm;
RCF = retina correction factor;
Depending on the ALo the RCF was set as:
if ALo ≤ 22.00 mm, RCF = −0.04;
if 22.01 mm ≤ ALo ≤ 24.49 mm, RCF = +0.025;
if ALo ≥ 24.5 mm, RCF = +0.022;
IOLo = IOL offset = 0;
The second and main part of the formula is an OBFD that incorporates tracing calculations involving height and slope within three refracting surfaces: the spectacle, the cornea, and the IOL. Additionally, a fourth refracting surface called a corrector was used. The factor of the thick lens (Fc constant or corrector) was used as a second constant that reflects the bias related to the conversion of the second principal plane of the actual thick lens to the theoretically derived main principal plane of the thin lens. This constant is similar to the Norrbys N constant and the Olsen C constant, and typically ranges from 0.25 to 0.45 for the average biconvex IOL. By default, this value is equal to 0.3. Thus, two constants (CACD and Fc) were used in the proposed method. The vertex distance (VD) was set as 12 mm from the anterior cornea. The refraction (Rx) was determined with the chart at 6 m. The cornea was placed at its second principal plane, which is 0.06 mm anterior to the cornea for the Le Grand model cornea (Corneal offset = 0.06). The corneal power was calculated as 331.5/Ra, where Ra is the measured anterior corneal radius of curvature. The ray height value was set to 2.5 mm. All parameters were set according to recommendations by Norrby.6 The estimated lens position as a theoretical main principle plane of the IOL (ELPt) was calculated with the equation described above. The thin refracting surface was introduced at the theoretically derived main principle plane of the average biconvex IOL. The system is in focus if the OBFВ (mm) is equal to the GBFВ (mm) (Supplementary material, part 2).
If the formulas are programmed in the Excel spreadsheet, its Goal Seek function can be used to find the Rx by the condition that the difference between OBFD and GBFD is zero. Additionally, due to the complexity of the novel formula, all presented equations were programmed into an Excel spreadsheet and were adopted for multiple calculations up to 3000 cases. These can be conveniently used by researchers in future clinical and theoretical trials (Supplementary material, VRF Suite 1.1). Moreover, the VRF and VRF CMAL formulas were added to the same spreadsheet, extending possibilities for future refinement and additional testing (VRF Suite 1.1 Excel sheet).
Evaluation of the VRT Formula
The VRT formula uses five parameters: the axial length of the eye (ALo), the corneal power (K), the preoperative anterior chamber depth (epithelium to lens; ACDpre), the lens thickness (LT), and the horizontal corneal diameter (CD). After evaluating the novel method in the first (developed) group, the second (tested) group (527 eyes) was used to assess its performance against other formulas.
The SD values of the fifteen evaluated formulas ranged from 0.358 D (VRT) to 0.472 D (Hoffer Q). The obtained results are presented in Table 2. The SDs of all formulas are presented in Figure 1. It is worth noting that for the entire AL group, the VRT formula demonstrated the highest accuracy (SD 0.358 D), ranked first, and outperformed all traditional (Haigis, Hoffer Q, Holladay 1, and SRK/T), modern thin lens (VRF), and some ray-tracing (Norrby RT, Olsen (OLCR), and Olsen (standalone)) formulas (P < 0.05). On the other hand, the novel formula had accuracy comparable to that of modern methods such as BUII, Hoffer QST, Cooke K6, Kane, and Pearl-DGS (P > 0.05). Overall, the developed method (VRT) ranked first (SD 0.358 D) and achieved a PE within ±0.50 D more than 88% (88.24%, respectively). Moreover, in comparison with the most popular BUII formula, the VRT formula showed better refractive (SD 0.358 vs. SD 0.377 D) and clinical results (PE within ±0.50 D = 0.88.24% vs. 84.44%), but without statistically significant superiority (P = 0.771).
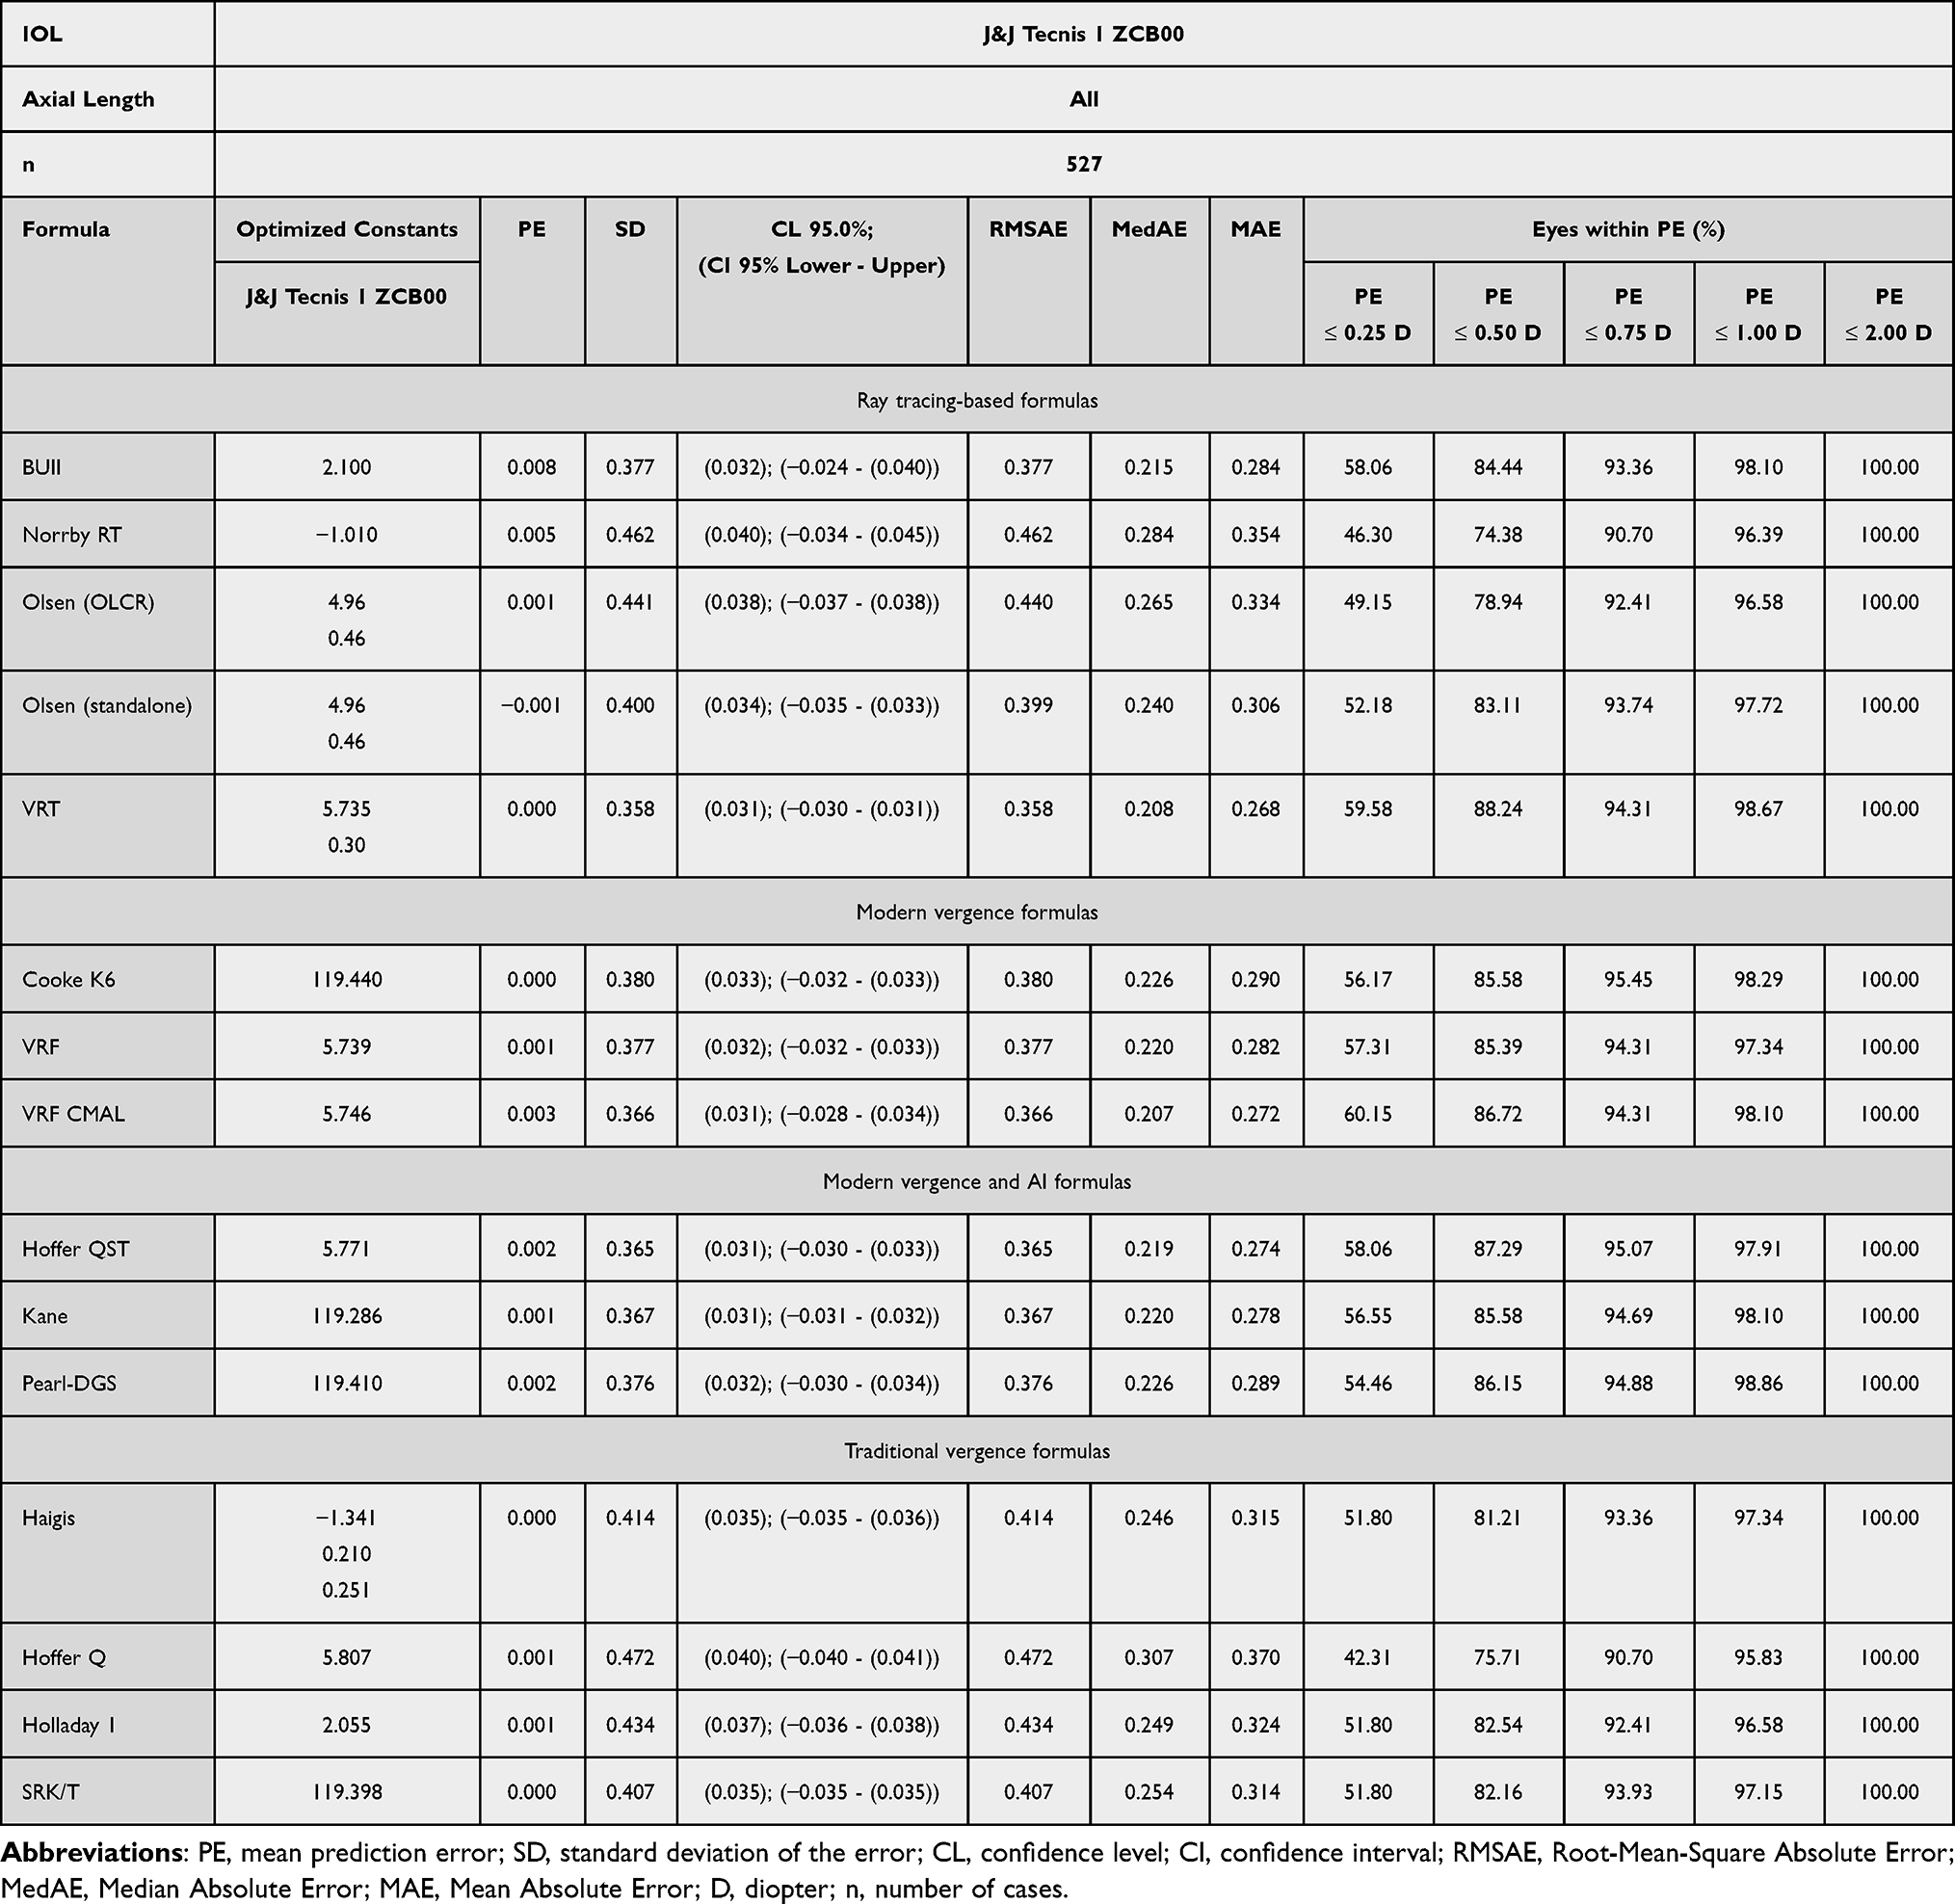 |
Table 2 Refractive Outcomes and Optimized Constants Obtained by Each Formula in 527 Eyes. The Mean Prediction Error, Standard Deviation of Errors, Root-Mean-Square Absolute Error, Median Absolute Error, Mean Absolute Error, Optimized Constants, and Percentage of Eyes with Refractive Prediction Errors Within ±0.25 D, ±0.50 D, ±0.75 D ±1.00 D, and ±2.00 D for Each of the 15 Formulas. The Best Standard Deviation of Errors (SD) Were Found for VRT (0.358 D), Hoffer QST (0.365 D), VRF CMAL (0.366 D), and Kane (0.367 D) Formulas, the Worst Result Was Produced by the Hoffer Q (0.472 D) Formula. |
 |
Figure 1 Formulas ranking based on the standard deviation (SD) of the prediction error (PE) in the whole sample. |
It is of note that the VRT formula yielded significantly lower SDs compared to traditional methods and most of the remaining ray-tracing-based formulas (Table 2). Additionally, in the short AL subgroup (n = 47), VRT ranked third (RMSAE 0.466 D), outperforming most of the other formulas, with Kane (RMSAE 0.446 D) and Pearl-DGS (RMSAE 0.450 D) as exceptions (Table 3). In the medium AL subgroup (n = 435), VRT demonstrated the highest accuracy (RMSAE 0.343 D), performing better than the BUII (RMSAE 0.352 D), Hoffer QST (RMSAE 0.353 D), Cooke K6 (RMSAE 0.366 D), Kane (RMSAE 0.361 D), and Pearl-DGS (RMSAE 0.371 D) formulas (Table 3). In the long AL subgroup (n = 45), VRT ranked first (RMSAE 0.334 D), outperforming all traditional, contemporary, and ray-tracing-based formulas (Table 3).
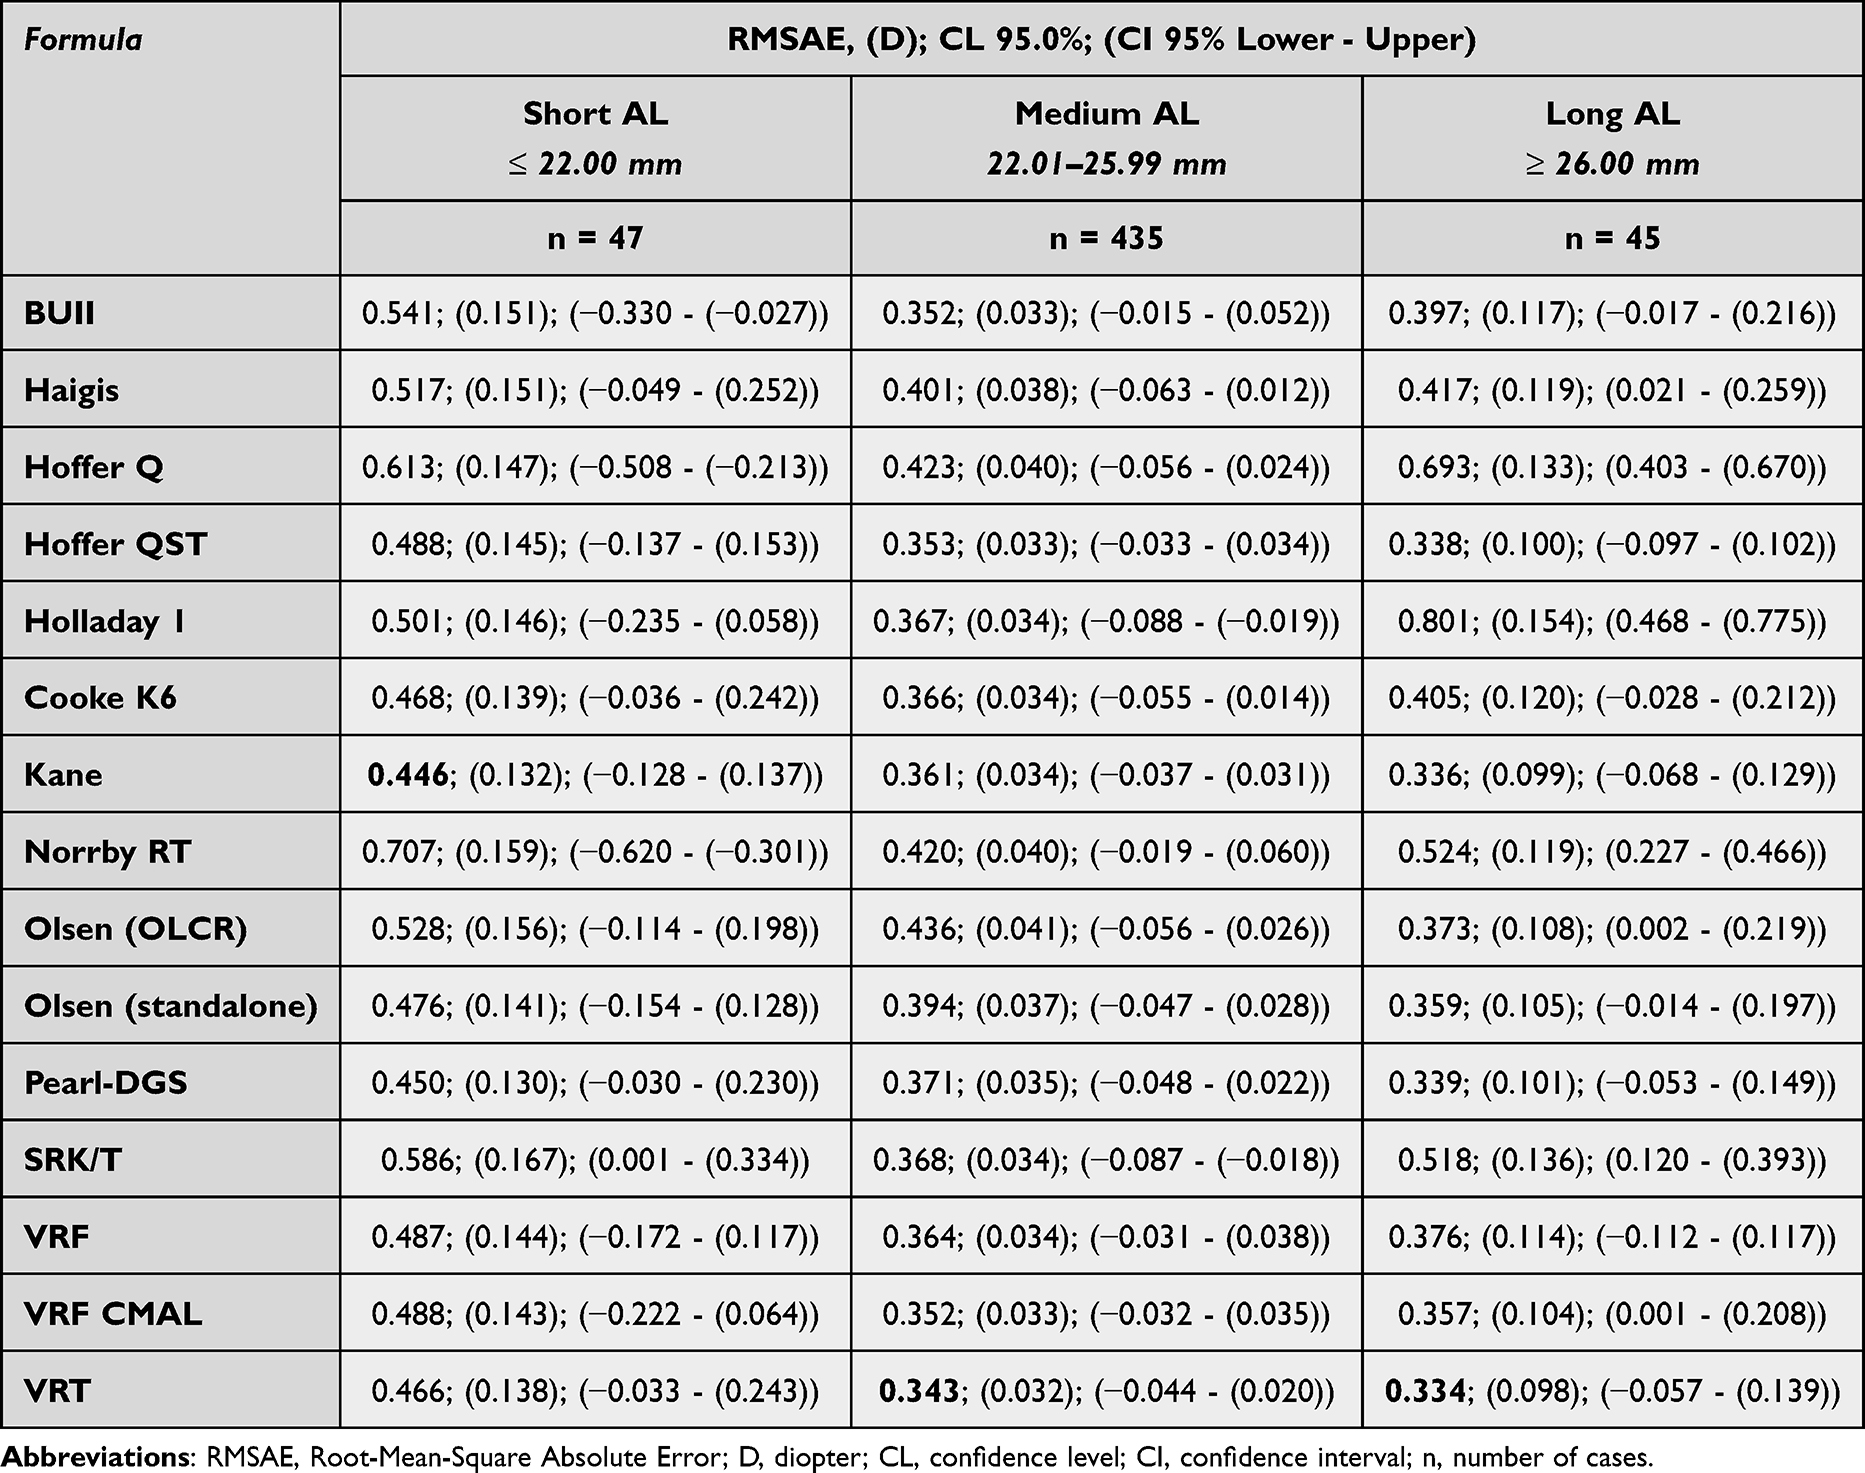 |
Table 3 Root-Mean-Square Absolute Error (RMSAE) of Each Formula by Axial Length Group. The Best Root-Mean-Square Absolute Error Values (RMSAE) in Short AL Were Found for Kane (0.446 D); the Worst Result Was Produced by the Norrby RT Formula (0.707 D). The Best Root-Mean-Square Absolute Error (RMSAE) in Medium AL Were Found for VRT (0.343 D); the Worst Result Was Produced by the Olsen (OLCR) Formula (0.436 D). The Best Root-Mean-Square Absolute Error Values (RMSAE) in Long AL Were Found for VRT (0.334 D); the Worst Result Was Produced by the Holladay 1 Formula (0.801 D). |
As secondary outcomes, we assessed the percentage of eyes achieving a PE within ±0.50 D. In the whole group, 80.0% of the eyes had a PE within ±0.50 D with all formulas, with the Olsen (OLCR; 78.94%), Hoffer Q (75.71%), and Norrby RT (74.38%) as exceptions. Two formulas obtained a percentage of eyes with a PE within ±0.50 D higher than 87% (Hoffer QST (87.29%) and VRT (88.24%)), and two formulas obtained PEs within ±0.50 D higher than 86% (VRF CMAL (86.72%) and Pearl-DGS (86.15%)). In turn, the percentage of eyes with PEs within ±0.25 D ranged from 60.15% (VRF CMAL) to 42.31% (Hoffer Q), as shown in Figure 2. Statistically significant differences between the formulas with a PE within ±0.50 D are shown in Table 4.
 |
Table 4 Multiple Comparisons of the Formulas According to the Percentage of Eyes Within ± 0.50 D of the Predicted Refraction According to McNemar’s Chi-Squared Test with Continuity Correction to Determine P values for Every Pair of Formulas and the Adjusted P values Using Holm’s Correction. (P < 0.05). |
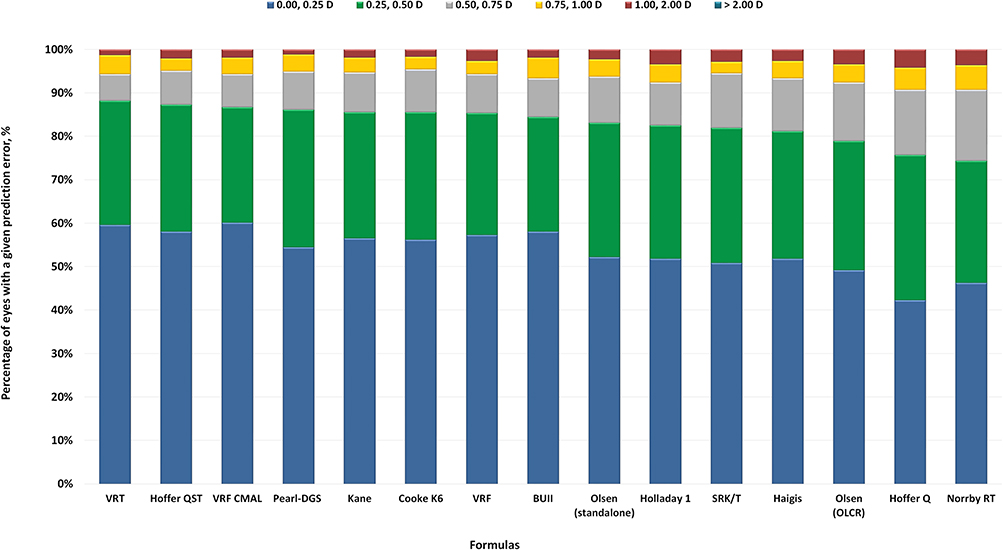 |
Figure 2 Stacked histogram comparing the percentage of eyes with a given prediction error. |
There were no statistically significant differences between the formulas for short eyes (P > 0.05, bootstrap test), medium eyes (P > 0.05, bootstrap test), and long eyes (P > 0.05, bootstrap test). For the tested cohort (527 eyes), statistically significant differences were found for the BUII (P < 0.01, HC-test), Haigis (P < 0.05, HC-test), Hoffer Q (P < 0.01, HC-test), Hoffer QST (P < 0.001, HC-test), Holladay 1 (P < 0.05, HC-test), Cooke K6 (P < 0.05, HC-test), Kane (P < 0.05, HC-test), Norrby RT (P < 0.05, HC-test), Olsen (OLCR; P < 0.001, HC-test), Olsen (standalone; P < 0.05, HC-test), Pearl-DGS (P < 0.05, HC-test), VRF (P < 0.05, HC-test), VRF CMAL (P < 0.01, HC-test), and SRK/T (P < 0.05, HC-test) formulas (Table 5).
 |
Table 5 Statistical Comparison of the Standard Deviation Values (SD) According to the Heteroscedastic Method (HC) of the 15 Formulas for the All Eyes (the Holm-Bonferroni Correction Was Applied and P values Less Than 0.05 Were Considered Statistically Significant). Statistically Significant Differences Were Found for the VRT Formula with Haigis (P < 0.001), Hoffer Q (P < 0.001), Holladay 1 (P < 0.001), Norrby RT (P < 0.001), Olsen (OLCR) (P < 0.001), Olsen (Standalone) (P < 0.01), SRK/T (P < 0.001), and VRF (P < 0.05) Formulas. Additionally, Statistically Significant Differences Were Found for the BUII (P < 0.01), Haigis (P < 0.05), Hoffer Q (P < 0.01), Hoffer QST (P < 0.001), Holladay 1 (P < 0.05), Cooke K6 (P < 0.05), Kane (P < 0.05), Norrby RT (P < 0.05), Olsen (OLCR) (P < 0.001), Olsen (Standalone) (P < 0.05), Pearl-DGS (P < 0.05), VRF (P < 0.05), VRF CMAL (P < 0.01), and SRK/T (P < 0.05) Formulas. |
Discussion
This study aimed to investigate the refractive and clinical accuracy of the newly developed ray-tracing formula (VRT) based on the thin lens assumption and compare its accuracy with existing ray-tracing-based formulas (BUII, Norrby RT, Olsen (OLCR), and Olsen (standalone), traditional (Haigis, Hoffer Q, Holladay 1, and SRK/T), and modern vergence formulas (Hoffer QST, Cooke K6, Kane, Pearl-DGS, VRF, and VRF CMAL)) in 527 Caucasian eyes with one type of IOL.
Recently, the idea of using AI to calculate IOL power has become widespread, and several authors have introduced formulas using this approach.3,4,41–43 Despite this, the traditional vergence-based and ray-tracing methodologies still exist, and novel (non-AI) methods have appeared.5–8,32 Still, there is no consensus on which formulas are most accurate among the traditional, ray-tracing, or AI-based approaches.3,10–12,23,35 The objective of this study was to investigate the accuracy of existing modern and well-known methods and compare their accuracy with the newly developed formula.
One of the methods analyzed in the current study (VRT) has not been previously investigated, and, therefore, a comparison to findings reported by other authors is not possible. However, our data are in agreement with those previously published for formulas whose accuracy had already been estimated.
In the study by Goto and Maeda, the O formula, which is based on ray-tracing without using common parameters such as ultrasound-compatible axial length, keratometry readings, and the A-constant, was used to calculate IOL power.30 The results were compared using SD values and the percentages of patients with refractive prediction errors within ±0.50 D and ±1.00 D. The results with the O formula are as follows: SD = 0.426 D, with 75.4% of eyes within ±0.50 D and 98.6% within ±1.00 D. Heteroscedastic tests showed that the SD of the O formula (0.426 D) was significantly lower than that of the BUII formula (0.464 D, P =0.037), but not significantly different from the Kane formula (0.433 D, P =0.607). In our study, the SD of the VRT formula (0.358 D) was not significantly lower (P = 0.771) than that of the BUII (0.377 D) and Kane (0.367 D) formulas, but it was significantly lower (P < 0.05) than Haigis (0.414 D), Hoffer Q (0.472 D), Holladay 1 (0.434 D), Norrby RT (0.462 D), Olsen (OLCR) (0.441 D), Olsen (standalone) (0.400 D), SRK/T (0.407 D), and VRF (0.377 D). This discrepancy is likely due to the different types of IOL and population in their data set.
Melles and Holladay made a comparative study of seven formulas in two large databases.44 The lowest SD was demonstrated with the BUII (0.404 D) and the Olsen (0.424 D) formulas, and the highest was demonstrated with the Hoffer Q (0.473 D). Additionally, in an update for this study, the Kane was the most accurate formula and had the lowest SD (0.384 D) in all AL ranges.23 In our research, the Kane formula ranked third (SD 0.367), whereas BUII (SD 0.377 D), Olsen (standalone) (SD 0.400 D), and Olsen (OLCR) (SD 0.441 D) were less predictable. Notably, the VRT formula outperformed these methods with an SD value of 0.358 D.
Hipólito-Fernandes et al8 explored the accuracy of the 13 formulas in a set of 828 eyes with one type of lens; the lowest SDs were demonstrated with the Kane (0.418 D), EVO 2.0 (0.419 D), and VRF-G (0.423). The Haigis (SD 0.459 D), Holladay 1 (SD 0.461 D), and Hoffer Q (SD 0.489 D) were less accurate. We did not include EVO 2.0 and VRF-G formulas in our study, but Kane (SD 0.367 D) showed similar results and achieved the best rank.
The results from our research confirm the outstanding accuracy of the Hoffer QST (0.365 D) and Pearl-DGS (0.376 D) formulas, but not the Olsen (standalone; 0.400 D) and Olsen (OLCR; 0.441 D) methods. Additionally, the VRT (SD 0.358) was more precise than most existing methods.
Wang and Burwinkel evaluated three formulas in 10,838 eyes.34 Compared with ZEISS AI, BUII produced significantly greater SDs in the whole group and short eyes, and the Kane had greater SDs in short eyes (all adjusted P < 0.05). The BUII had significantly lower percentages of eyes within ±0.50 D of PEs in the whole group (80.0% vs 81.2%) and in short eyes (71.3% vs 76.1%), and the Kane had lower percentage of eyes within ±0.50 D of PEs in short eyes (71.9% vs 76.1%; all adjusted P < 0.05). The results from our study confirm that the Kane (SD 0.367 D) and VRT (SD 0.358 D) are some of the most accurate formulas for the whole sample, while the BUII (SD 0.377 D) formula was less accurate.
In the comparison by Voytsekhivskyy et al,35 36 formulas were investigated in the Caucasian population. For the Tecnis 1 ZCB00, three modern formulas (VRF-G, EVO 2.0, and Kane) showed the lowest SDs (0.353 D, 0.362 D, and 0.366 D), whereas the traditional Haigis and SRK/T showed the highest SDs (0.418 D and 0.414 D, respectively). In a subsequent analysis, the Norrby RT, Olsen (OLCR), and BUII formulas were less predictable and had the largest SDs (0.467 D, 0.434, and 0.374, respectively). Our results confirmed that contemporary methods are superior to traditional ones.
Notably, in the entire cohort, the VRT (SD 0.358 D) showed better accuracy compared to the VRF (SD 0.377 D) and VRF CMAL (SD 0.366 D), and outperformed other ray-tracing-based formulas, including the widely used BUII (SD 0.377 D), but without statistically significant superiority (P = 0.771).
The primary objective of this study was to develop a simple and highly compact paraxial ray-tracing formula based on the thin lens assumption, enabling the formula’s use without the requirement of IOL geometry information. The proposed method cannot claim maximum accuracy, and modern formulas based on vergence and AI are likely to demonstrate better IOL calculation accuracy. However, we would like to emphasize that we sought to create a formula that is as compact and universal as possible, while remaining sufficiently accurate compared to other ray-tracing-based formulas. Our method demonstrated superiority in the SD and percentage of eyes within ±0.50 D compared to other ray-tracing-based formulas and traditional methods, and was comparable to contemporary vergence-based and AI formulas.
Compared with other ray-tracing formulas, our method is simpler and more convenient. There is no need to use information on IOL geometry, which is often hidden by manufacturers. For example, the formula proposed by Barrett in 2015 is one of the most accurate, but it remains unpublished, making its investigation and application somewhat difficult.28,29 The main disadvantages of the Olsen formula are that it is only available in software, and information on lens geometry is often unavailable, especially for novel IOLs.6,7
Our study limitations are retrospective formalism, the use of only Caucasian eyes, the limited sample size of the tested group (n = 527), the inclusion of one type of IOL that assumes internal consistency, the lack of other modern formulas (EVO 2.0, Eom, CSO, O formula, OKULIX, VRF-G, ZEISS-AI), and the use of data derived from SIM K values.45,46 The sample size of the subgroups of short and long eyes was insufficient for a full-fledged statistical analysis and was shown for informational purposes only. The poor formula accuracy for short eyes requires future validation on a large dataset with other types of IOLs. The disadvantages of the proposed method include the simplified concept of a thin lens, the regression model used to predict the effective lens position, and the use of the two constants (Optical CACD and Fc-constants) instead of the more common and widely accepted A constant. It is important to remember that any formula performs best with the data on which it is based, so the accuracy of this algorithm in Asian or Western regions remains questionable. It is also crucial to keep in mind the so-called surgeon factor and the individual value of the constant for each specific IOL type.
Conclusion
The novel formula (VRT) exhibited promising outcomes and was comparable to modern and traditional IOL power calculation methods. This method, thus, needs further refinement and additional testing, especially in distinct ethnic groups, other types of IOL’s, and eyes with prior corneal refractive surgery.
Declaration of Generative AI and AI-Assisted Technologies in the Writing Process
During the preparation of this work, the author did not use any artificial intelligence (AI) tool to write or prepare this manuscript or any of its parts.
Data Sharing Statement
The data underlying this study are available in the published article and its online supplementary materials.
Funding
This research did not receive any specific grant from funding agencies in the public, commercial, or not-for-profit sectors.
Disclosure
Dr. Voytsekhivskyy is the inventor and sole owner of the VRF, VRF-G, and VRT formulas and has a patent on the method of estimation of postoperative lens position (ELP) and the calculation of optical power, and is the author and copyright holder of a computer program, VRF Suite V2.0. Dr. Voytsekhivskyy is the inventor and sole owner of the VRF Suite 1.1 Excel sheet. All content of this file is the intellectual property of Dr. Voytsekhivskyy. This file is intended solely for scientific and research purposes; any commercial use without the author’s permission is strictly prohibited. I have disclosed these interests fully to the journal and have in place an approved plan for managing any potential conflicts arising from this arrangement.
References
1. Azor JA, Vega F, Armengol J, Millan MS. Optical assessment and expected visual quality of four extended range of vision intraocular lenses. J Refrac Surg. 2022;38(11):688–14. doi:10.3928/1081597X-20220926-01
2. Jeon S, Taroni L, Lupardi E, et al. Accuracy of nine formulas to calculate the powers of an extended depth-of-focus IOL using two ss-oct biometers. J Refract Surg. 2023;39(3):158–164. doi:10.3928/1081597X-20221221-03
3. Taroni L, Hoffer KJ, Pellegrini M, Lupardi E, Savini G. Comparison of the new Hoffer QST with 4 modern accurate formulas. J Cataract Refract Surg. 2023;49(4):378–384. doi:10.1097/j.jcrs.0000000000001126
4. Debellemaniere G, Dubois M, Gauvin M, et al. The PEARL-DGS formula: the development of an open-source machine learning-based thick IOL calculation formula. Am J Ophthalmol. 2021;232:58–69. doi:10.1016/j.ajo.2021.05.004
5. Voytsekhivskyy OV. Accuracy of the VRF and VRF-G intraocular lens power calculation formulas using swept-source optical coherence tomography biometry. Clin Ophthalmol. 2023;17:3663–3672. doi:10.2147/OPTH.S439287
6. Norrby S. Norrby formulas for IOL power calculation. In: Aramberri J, Hoffer KJ, Olsen T, Savini G, Shammas HJ editors. Intraocular Lens Calculations. Essentials in Ophthalmology. Springer Cham; 2024:705–715. doi:10.1007/978-3-031-50666-6_48
7. Olsen T, Hoffmann P. C constant: new concept for ray-tracing–assisted intraocular lens power calculation. J Cataract Refract Surg. 2014;40(5):764–773. doi:10.1016/j.jcrs.2013.10.037
8. Hipólito-Fernandes D, Luís ME, Gil P, et al. VRF-G, a new intraocular lens power calculation formula: a 13-formulas comparison study. Clin Ophthalmol. 2020;14:4395–4402. doi:10.2147/OPTH.S290125
9. Savini G, Hoffer KJ, Kohnen T. IOL power formula classifications. J Cataract Refract Surg. 2024;50(2):105–107. doi:10.1097/j.jcrs.0000000000001378
10. Voytsekhivskyy OV, Hoffer KJ, Tutchenko L, Cooke DL, Savini G. Accuracy of 24 IOL power calculation methods. J Refract Surg. 2023;39(4):249–256. doi:10.3928/1081597X-20230131-01
11. Stopyra W, Voytsekhivskyy O, Grzybowski A. Accuracy of 20 intraocular lens power calculation formulas in medium-long eyes. Ophthalmol Ther. 2024;13(7):1893–1907. doi:10.1007/s40123-024-00954-7
12. Stopyra W, Voytsekhivskyy O, Grzybowski A. Comparison of the accuracy of twenty intraocular lens power calculation formulas in long eyes. Asia Pac J Ophthalmol. 2025;14(3):100198. doi:10.1016/j.apjo.2025.100198
13. Haigis W, Lege B, Miller N, Schneider B. Comparison of immersion ultrasound biometry and partial coherence interferometry for IOL calculation according to Haigis. Graefes Arch Clin Exp Ophthalmol. 2000;238(9):765–773. doi:10.1007/s004170000188
14. Hoffer KJ. The Hoffer Q formula: a comparison of theoretic and regression formulas. J Cataract Refract Surg. 1993;19(6):700–712. Errata 1994: 20:677 and 2007;33(1):2–3. doi:10.1016/j.jcrs.2006.08.054
15. Holladay JT, Prager TC, Chandler TY, Musgrove KH, Lewis JW, Ruiz RS. A three-part system for refining intraocular lens power calculations. J Cataract Refract Surg. 1988;14(1):17–24. doi:10.1016/s0886-3350(88)80059-2
16. Retzlaff JA, Sanders DR, Kraff MC. Development of the SRK/T intraocular lens implant power calculation formula. J Cataract Refract Surg. 1990;16(3):333–340. Erratum: 1990 Jul;16(4):528. doi:10.1016/S0886-3350(13)80820-6
17. Hoffmann P, Langenbucher A. The Castrop IOL Formula. In: Aramberri J, Hoffer KJ, Olsen T, Savini G, Shammas HJ editors. Intraocular Lens Calculations. Essentials in Ophthalmology. Springer Cham; 2024:593–601. doi:10.1007/978-3-031-50666-6_38
18. Næser K, Savini G. Accuracy of thick-lens intraocular lens power calculation based on cutting-card or calculated data for lens architecture. J Cataract Refract Surg. 2019;45(10):1422–1429. doi:10.1016/j.jcrs.2019.05.021
19. Sheard RM, Smith GT, Cooke DL. Improving the prediction accuracy of the SRK/T formula: the T2 formula. J Cataract Refract Surg. 2010;36(11):1829–1834. doi:10.1016/j.jcrs.2010.05.031
20. Kim JW, Eom Y, Yoon EG, et al. Algorithmic intraocular lens power calculation formula selection by keratometry, anterior chamber depth and axial length. Acta Ophthalmol. 2022;100(3):e701–e709. doi:10.1111/aos.14956
21. Yeo TK. Emmetropia verifying optical (EVO) formula. In: Aramberri J, Hoffer KJ, Olsen T, Savini G, Shammas HJ editors. Intraocular Lens Calculations. Essentials in Ophthalmology. Springer Cham; 2024:617–623. doi:10.1007/978-3-031-50666-6_40
22. Cooke DL, Cooke TL. Approximating sum-of-segments axial length from a traditional optical low-coherence reflectometry measurement. J Cataract Refract Surg. 2019;45(3):351–354. doi:10.1016/j.jcrs.2018.12.026
23. Melles RB, Kane JX, Olsen T, Chang WJ. Update on intraocular lens power calculation formulas. Ophthalmology. 2019;126(9):1334–1335. doi:10.1016/j.ophtha.2019.04.011
24. González DC, Bautista CP. Accuracy of a new intraocular lens power calculation method based on artificial intelligence. Eye. 2021;35(2):517–522. doi:10.1038/s41433-020-0883-3
25. Ladas JG, Siddiqui AA, Devgan U, Jun AS. A 3-D “super surface” combining modern intraocular lens formulas to generate a “super formula” and maximize accuracy. JAMA Ophthalmol. 2015;133(12):1431–1436. doi:10.1001/jamaophthalmol.2015.3832
26. Flikier D. Panacea IOL Calculator. In: Aramberri J, Hoffer KJ, Olsen T, Savini G, Shammas HJ editors. Intraocular Lens Calculations. Essentials in Ophthalmology. Springer Cham; 2024:741–755. doi:10.1007/978-3-031-50666-6_51
27. Voytsekhivskyy OV. The VRF and VRF-G formulas. In: Aramberri J, Hoffer KJ, Olsen T, Savini G, Shammas HJ editors. Intraocular Lens Calculations. Essentials in Ophthalmology. Springer Cham; 2024:783–794. doi:10.1007/978-3-031-50666-6_55
28. Barrett G. Barrett universal II formula. Singapore, Asia-Pacific association of cataract and refractive surgeons. Available from: http://calc.apacrs.org/barrett_universal2105/.
29. Barret GD. An improved universal theoretical formula for intraocular lens power prediction. J Cataract Refract Surg. 1993;19(6):713–720. doi:10.1016/s0886-3350(13)80339-2
30. Goto S, Maeda N, Ohnuma K, et al. Preliminary demonstration of a novel intraocular lens power calculation: the O formula. J Cataract Refract Surg. 2022;48(11):1305–1311. doi:10.1097/j.jcrs.0000000000000983
31. Mo ER, Chen Z, Feng KE, et al. Accuracy of modern intraocular lens formulas in highly myopic eyes implanted with plate-haptic intraocular lenses. Am J Ophthalmol. 2024;265:105–116. doi:10.1016/j.ajo.2024.04.017
32. Savini G, Hoffer KJ, Ribeiro FJ, et al. Intraocular lens power calculation with ray tracing based on AS-OCT and adjusted axial length after myopic excimer laser surgery. J Cataract Refract Surg. 2022;48(8):947–953. doi:10.1097/j.jcrs.0000000000000902
33. Preussner PR, Wahl J, Lahdo H, Dick B, Findl O. Ray tracing for intraocular lens calculation. J Cataract Refract Surg. 2002;28(8):1412–1419. doi:10.1016/s0886-3350(01)01346-3
34. Wang L, Burwinkel H, Bensaid N, Koch DD. Evaluation of an artificial intelligence-based intraocular lens calculator: AI-based IOL-optimized formula. J Cataract Refract Surg. 2024;51(4):332–336. doi:10.1097/j.jcrs.0000000000001603
35. Voytsekhivskyy OV, Hoffer KJ, Cooke DL, Savini G. IOL power calculation project: accuracy of 36 formulas. Am J Ophthalmol. 2025;277:45–56. doi:10.1016/j.ajo.2025.05.004
36. Hoffer KJ, Savini G. Update on intraocular lens power calculation study protocols: the better way to design and report clinical trials. Ophthalmol. 2021;128(11):e115–e120. doi:10.1016/j.ophtha.2020.07.005
37. R Core Team. R: a language and environment for statistical computing. R foundation for statistical computing. 2024. Available from: https://www.R-project.org.
38. Holladay JT, Wilcox RR, Koch DD, Wang L. Review and recommendations for univariate statistical analysis of spherical equivalent prediction error for intraocular lens power calculations. J Cataract Refract Surg. 2021;47(1):65–77. doi:10.1097/j.jcrs.0000000000000370
39. Cohen J. Statistical Power Analysis for the Behavioral Sciences. New York, NY: Academic Press; 1969.
40. Voytsekhivskyy OV. Development and clinical accuracy of a new intraocular lens power formula (VRF) compared to other formulas. Am J Ophthalmol. 2018;185:56–67. doi:10.1016/j.ajo.2017.10.020
41. Stopyra W, Voytsekhivskyy O, Grzybowski A, Wang L, Koch DD. Prediction of 9 artificial intelligence-based intraocular lens power calculation formulas in long Caucasian eyes. Am J Ophthalmol. 2026. doi:10.1016/j.ajo.2026.02.017
42. Stopyra W, Voytsekhivskyy O, Grzybowski A. Prediction of seven artificial intelligence-based intraocular lens power calculation formulas in medium-long caucasian eyes. Life. 2025;15(1):45. doi:10.3390/life15010045
43. Stopyra W, Voytsekhivskyy O, Grzybowski A. Accuracy of 7 artificial intelligence-based intraocular lens power calculation formulas in medium-long eyes: 2-center study. Can J Ophthalmol. 2025;60(4):200–207. doi:10.1016/j.jcjo.2025.01.020
44. Melles RB, Holladay JT, Chang WJ. Accuracy of intraocular lens calculation formulas. Ophthalmol. 2018;125(2):169–178. doi:10.1016/j.ophtha.2017.08.027
45. Eom Y, Yang SK, Woo M, et al. Accuracy of intraocular lens power calculation based on distance from haptic to principal object plane. J Cataract Refract Surg. 2025. doi:10.1097/j.jcrs.0000000000001611
46. Savini G, Taroni L, Schiano-Lomoriello D, Hoffer KJ. Repeatability of total keratometry and standard keratometry by the IOLMaster 700 and comparison to total corneal astigmatism by scheimpflug imaging. Eye. 2021;35(1):307–315. doi:10.1038/s41433-020-01245-8
 © 2026 The Author(s). This work is published and licensed by Dove Medical Press Limited. The
full terms of this license are available at https://www.dovepress.com/terms
and incorporate the Creative Commons Attribution
- Non Commercial (unported, 4.0) License.
By accessing the work you hereby accept the Terms. Non-commercial uses of the work are permitted
without any further permission from Dove Medical Press Limited, provided the work is properly
attributed. For permission for commercial use of this work, please see paragraphs 4.2 and 5 of our Terms.
© 2026 The Author(s). This work is published and licensed by Dove Medical Press Limited. The
full terms of this license are available at https://www.dovepress.com/terms
and incorporate the Creative Commons Attribution
- Non Commercial (unported, 4.0) License.
By accessing the work you hereby accept the Terms. Non-commercial uses of the work are permitted
without any further permission from Dove Medical Press Limited, provided the work is properly
attributed. For permission for commercial use of this work, please see paragraphs 4.2 and 5 of our Terms.
Recommended articles
Accuracy of the VRF and VRF-G Intraocular Lens Power Calculation Formulas Using Swept-Source Optical Coherence Tomography Biometry
Voytsekhivskyy OV
Clinical Ophthalmology 2023, 17:3663-3672
Published Date: 29 November 2023
Biometric Factors in the VRF-G Formula for IOL Power Calculation
Voytsekhivskyy OV, Biran A, Achiron A, Yahalomi T, Vega Y, Elbaz U, Levinger E,
Clinical Ophthalmology 2025, 19:2521-2528
Published Date: 31 July 2025