")
Back to Journals » Clinical Ophthalmology » Volume 17
Accuracy of the VRF and VRF-G Intraocular Lens Power Calculation Formulas Using Swept-Source Optical Coherence Tomography Biometry
Authors Voytsekhivskyy OV
Received 21 October 2023
Accepted for publication 15 November 2023
Published 29 November 2023 Volume 2023:17 Pages 3663—3672
DOI https://doi.org/10.2147/OPTH.S439287
Checked for plagiarism Yes
Review by Single anonymous peer review
Peer reviewer comments 2
Editor who approved publication: Dr Scott Fraser
Oleksiy V Voytsekhivskyy
Kyiv Clinical Ophthalmology Hospital Eye Microsurgery Center, Komarov Ave. 3, Medical City, 03680, Kyiv, Ukraine
Correspondence: Oleksiy V Voytsekhivskyy, Kyiv Clinical Ophthalmology Hospital Eye Microsurgery Center, Komarov Ave. 3, Medical City, 03680, Kyiv, Ukraine, Tel +38067-584-28-11, Email [email protected]
Purpose: To collate the accuracy of two recently introduced intraocular lens (IOL) formulas (VRF and VRF-G) in cataract patients using a swept-source optical coherence tomography (SS-OCT) biometry (IOL Master 700, Carl Zeiss Meditec AG, Jena, Germany).
Patients and Methods: Data records of 295 eyes from 295 patients were included in this scrutiny. The IOLMaster 700 SS-OCT biometer was used for biometric measurements. The VRF and VRF-G formulas were compared with seven 3rd and 4th generation thin and thick-lens formulas: Haigis, Hoffer Q, Holladay 1, Holladay 2, SRK/T, T2, and Barrett Universal II. With optimized lens constants, the mean prediction error (PE) and its standard deviation (SD), the median absolute error (MedAE), the mean absolute error (MAE), and the percentage of eyes with PEs within ± 0.25 D, ± 0.50 D, ± 0.75 D, ± 1.00 D, and <± 2.00 D were analyzed.
Results: Statistically significant differences were found between formulas in the whole group (Friedman test, P = 0.000). The VRF-G and Haigis formulas showed the lowest SD values (0.464 D and 0.466 D respectively). The VRF and Barrett Universal II formulas were less predictable (SD 0.471 D and SD 0.474 D respectively). The biggest proportion of eyes within ± 0.50 D was found with VRF-G (76.27%), Haigis (75.59%), VRF (74.92%), and Barrett Universal II (74.92%) formulas.
Conclusion: Based on data achieved from the SS-OCT biometry, the VRF-G and Haigis methods were the more precise predictors of postoperative refraction with the biggest proportion of eyes within ± 0.50 D.
Keywords: IOL power, VRF formula, calculation, formulas, IOLMaster, axial length
Introduction
Despite the diversity of contemporary intraocular lens power calculation methods appearing in the last decade, the 3rd and 4th generation formulas still remain a “gold standard” that is widely used in clinical practice. The Haigis1, Hoffer Q2, Holladay 13, and SRK/T4 demonstrate an acceptable level of accuracy with the simplicity of using them. Additionally, the Holladay 2 and T2 formulas were represented as updated and more accurate versions of Holladay 1 and SRK/T formulas, which were supported by recent studies.5–7 The Barrett Universal II (hereafter Barrett) method was introduced as a paraxial thick-lens formula.8 This approach has become widely popular in the last decade, and it is believed to be the most precise. Present investigations have shown these formulas to have the lowest standard deviation and absolute error in other recent methods.9–11
The IOL Master 700 (Carl Zeiss Meditec AG, Jena, Germany) is the first commercially available optical biometer based on swept-source optical coherence tomography (SS-OCT) which was introduced in 2015.12 It became widely popular as the new standard for IOL power calculation. The swept-source optical coherence tomography (SS-OCT) is a new variation of technology of Fourier domain OCT that uses a sweep generator with a longer wavelength (1050 nm) and enables OCT imaging and visualization across the entire length of the eye. It provides a full-length OCT image and allows the identification of unusual features of ocular geometry, such as the decentration or tilt of the crystalline lens or the IOL. This is a relatively new technique enabling better penetration and providing additional measurements such as total corneal power (including posterior corneal surface), lens thickness, and central corneal thickness and provides higher resolution than traditional partial coherence interferometry (PCI).13 This possibility allowed the implementation of new recently developed and more sophisticated formulas that incorporated many variables for precise IOL power selection. The new Barrett, Holladay 2, Haigis-T, and Barrett Tru-K formulas are available in the appropriate software for this device and can help clinicians in their daily practice.
The main goal of this scrutiny is to evaluate and compare the predictive accuracy of the Barrett formula and traditional vergence-based thin-lens formulas: Haigis, Hoffer Q, Holladay 1, Holladay 2, SRK/T and T2, with new methods, that recently were presented by the author (VRF6 and VRF-G7 formulas) in data group derived from SS-OCT biometry (IOL Master 700, Carl Zeiss Meditec AG, Jena, Germany).
Materials and Methods
Data records of patients operated in a state municipal eye hospital between January 2019 and February 2022 were retrospectively enrolled. The research was approved by the local ethics committee (Institutional Review Board of Center Microsurgery of Eye №20205-Ethics) and informed agreement was obtained from each patient. The current study adhered to the Helsinki Declaration on Human Participation in Biomedical Research.
The patients who studied in this research were patients from the daily practice. The scrutiny includes participants with a diagnosis of immature and posterior subcapsular cataracts (Grade 1–2) without comorbidity with an-in-The-bag IOL implantation with a postoperative follow-up of 1–2 months. All patients underwent uneventful phacoemulsification under drop anesthesia (Oxybuprocaine hydrochloride 0.4% solution) and implantation of a one-piece hydrophobic acrylic posterior chamber IOL AcrySof IQ SN60WF (295 eyes) (Alcon Labs, Fort Worth, TX, USA) by the same surgeon (Larysa Tutchenko, MD, PhD). As a standard technique for lens removal, we used the “phaco-chop” technique with a temporal tunnel incision of 2.2 mm. A randomly selected eye was included in the study if a participant had bilateral IOL surgery.
Of the 312 data records of patients 17 eyes were excluded due to different reasons. The criteria for exclusion were the absence of any biometry data or postoperative refraction, wet form of macula degenerative changes, any stage of glaucoma, planned or unplanned sulcus IOL implantation, eyes with mature or traumatic cataract, chronic uveitis, corneal astigmatism greater than 1.50 diopter, and previous corneal refractive surgery. Refractive surgery causes inaccurate measurement of anterior keratometry and the variation of keratometric index, which causes inaccurate estimation of IOL power, and using specially developed intraocular lens power calculation methods.14
The IOL Master 700, software version 1.88 (Carl Zeiss Meditec AG, Jena, Germany), was used for preoperative biometry. The SRK/T method was selected as the actual IOL power formula for preoperative calculation.
The following methods were used for preoperative IOL power calculation:
Initially, we used optimized constants from the User Group for Laser Interference Biometry (ULIB) website (www.ocusoft.de/ulib/c1.htm, accessed on January 4th, 2023). After that, the lens constants were optimized to achieve a mean zero prediction error (PE), ie, a zero mean difference between the predicted and the postoperative refraction. For the Barrett Universal II formula, the value of the optimized A-constant and Lens Factor (LF) was empirically derived by reiteration with multiple attempts until a zero mean prediction error (PE) was achieved. Subsequently, the optimized IOL constant for each formula was calculated as the average of all individual constants that achieved a zero PE.15
After surgery, all participants were examined at 4–8 weeks. Uncorrected and corrected distance visual acuity measurement, tonometry, automatic kerato-refractometry, and indirect ophthalmoscopy were performed by the author (OV). Patients who have postoperative corrected distance visual acuity less than 20/30 were excluded from the study. Initially, refraction was assessed by an automatic kerato-refractometer (RT-7000, Ver.1.7, Tomey, Japan). Using a Jackson cross-cylinder set at ±0.25 D, we then verified the automatic refractometry data, first according to the cylinder axis, then by its power and spherical equivalent (SE). The red-green duochrome test was used at the end of the subjective refraction to refine the SE. The obtained value was used as the basis for postoperative manifest refraction, which was measured at 6 m, as recommended by Simpson and Charman.16
The prediction error (PE), standard deviation (SD), median absolute error (MedAE), and percentages of eyes that had a prediction error of <±0.25 D, <±0.50 D, <±0.75 D, <±1.00 D, and <±2.00 D were calculated and analyzed.17
Statistical Analysis
IBM SPSS Statistics for Windows, Version 23.0 (IBM Corp., Armonk, NY, USA), and GraphPad InStat software, Version 3.10 (GraphPad Software, Boston, MA, USA), were used for the statistical analysis of the data. The Shapiro–Wilk test was used to verify the normality of the data. The data were normally distributed for the mean predicted errors (P > 0.05), but not for their absolute values (P < 0.05). The ANOVA test was applied for comparing variables with normal distribution and Friedman test was used for data that were not normally distributed. For paired analysis, Dunn’s post hoc test was applied. The Cochran Q test with the McNemar post hoc test was used to analyze the percentage of eyes with a prediction error within ±0.50 D. A p-value of less than 0.05 was considered statistically significant. The Holm-Bonferroni correction was implemented for the post hoc tests.
Sample size calculations recommended a minimum of 169 eyes to be comprised in the data set. A post hoc analysis (G*Power 3.1) of the full data set with n=295, highest SD=0.537 and lowest SD=0.464, and two tails yield a power of 0.71 for an alpha level of 0.05.17
Results
The investigation comprised 295 eyes of 295 patients (185 women; mean age, 65.76 ± 11.92 years) with one type of hydrophobic lens AcrySof IQ SN60WF (Alcon Labs, Fort Worth, TX, USA). The mean AL was 23.70 ± 1.81 mm (range: 20.60–32.51). Table 1 shows the study population characteristics. The mean power of the implanted IOLs was 21.19 ± 4.91 D (range: 6.0 to 30.0), and the average postoperative manifest refraction was −0.27 ± 0.38 D (range: –4.50 to +1.75). Table 2 shows the mean predicted error (PE), standard deviation (SD), median (MedAE), and mean (MAE) absolute errors of the formulas and the percentage of eyes with a PE within ± 0.25 D, ± 0.50 D, ± 0.75 D, ± 1.0 D, and ± 2.0 D for the entire AL group.
 |
Table 1 Demographics of Study Subjects |
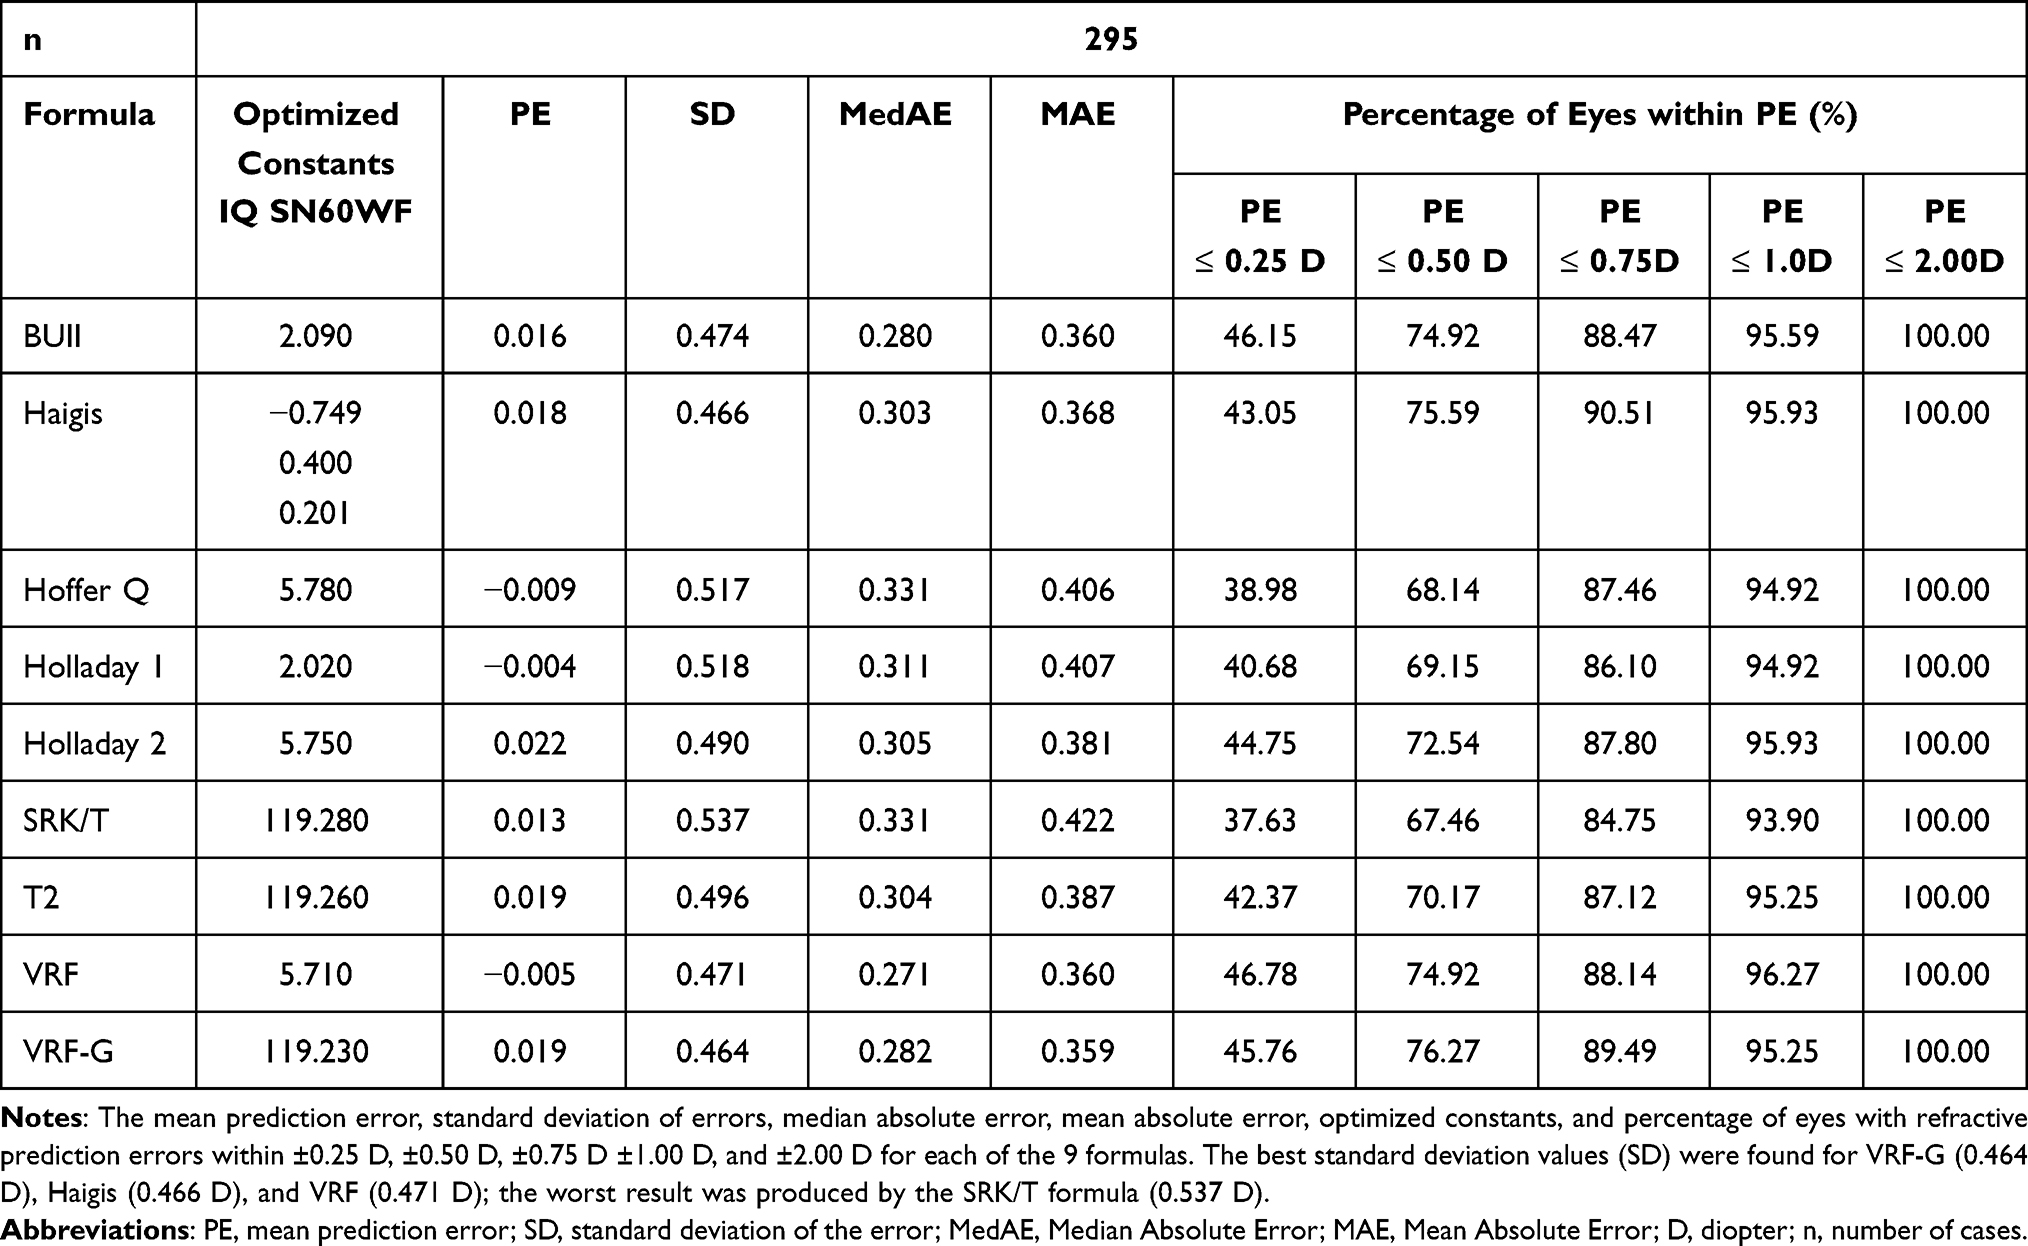 |
Table 2 Refractive Outcomes and Optimized Constants Obtained by Each Formula in All Eyes |
The lowest SD values were achieved by the VRF-G (0.464 D), Haigis (0.466 D), and VRF (0.471 D) formulas, whereas the highest SD was achieved by the Holladay 1 (0.518 D) and SRK/T (0.537 D) formulas.
Comparison of the absolute errors between different formulas showed the significant superiority of one formula over another (Friedman’s ANOVA, P = 0.000). Dunn’s post-hoc test revealed statistically significant differences between Barrett, VRF, and VRF-G formulas with Hoffer Q, Holladay 1, and SRK/T formulas (P < 0.006).
For the absolute errors, the lowest values were achieved with VRF (MedAE 0.271 D), Barrett (MedAE 0.280 D), and VRF-G (MedAE 0.282 D) formulas. Figure 1 demonstrates the box-and-whisker plots and the distribution around the MedAE for the investigated formulas.
 |
Figure 1 Distribution of the absolute prediction errors. Formulas are ranked according to the median absolute error, increasing from left to right. |
The percentage of eyes with a PE within ±0.50 D ranged from 76.27% (VRF-G) to 67.46% (SRK/T) (Figure 2). The four formulas achieved the highest values: VRF-G (76.27%), Haigis (75.59%), VRF (74.92%), and Barrett (74.92%), the worst result was demonstrated SRK/T (67.46%) formula. Only three formulas demonstrated results of 45.0% or more: VRF (46.78%), Barrett (46.15%), and VRF-G (45.76%).
 |
Figure 2 Stacked histogram comparing the percentage of cases with a given prediction error. Formulas are ranked according to the higher percentage for the prediction error within ≤0.50 D. |
Analyzing MAE, the best results were obtained with the VRF-G (MAE 0.359 D), VRF (MAE 0.360 D), and Barrett (MAE 0.360 D), with the top formulas remaining the same.
Table 3 shows the median absolute error (MedAE) of each formula by axial length group. The best median absolute error values (MedAE) in short AL were found for VRF (0.243 D); the worst result was produced by the SRK/T formula (0.389 D). The best median absolute error values (MedAE) in medium AL were found for Haigis (0.271 D) and VRF (0.272 D); the worst result was produced by the SRK/T formula (0.327 D). The best median absolute error values (MedAE) in long AL were found for VRF-G (0.311 D) and Haigis (0.312 D); the worst result was produced by the Hoffer Q formula (0.548 D).
 |
Table 3 Median Absolute Error (MedAE) of Each Formula by Axial Length Group |
All methods showed acceptable accuracy, with the highest outliers occurring with the Holladay 1 and SRK/T formulas. Note that some of the traditional thin-lens formulas (Haigis) outperformed the new, recently developed formulas (Barrett) and exhibited high accuracy and reproducibility. So, Haigis (SD 0.466 D) had better accuracy than Barrett (SD 0.474 D) and VRF (SD 0.471 D) and outperformed all other methods with the exception of the VRF-G (SD 0.464 D).
Discussion
The focus of this study was to estimate and compare the accuracy of recently introduced formulas (VRF and VRF-G) in 295 Caucasian eyes with one type of hydrophobic lens based on data derived from SS-OCT biometry. Our research results demonstrated that the VRF and VRF-G methods together with the IOLMaster 700 swept-source optical biometer performed better or were comparable to other third and fourth-generation formulas.
In this scrutiny, the VRF and VRF-G had the lowest absolute errors when the analysis included subgroups and all ALs. There were significant differences (Friedman’s ANOVA, P = 0.000) between the Barrett, VRF, and VRF-G and other third-generation formulas (Hoffer Q, Holladay 1, and SRK/T, p < 0.006), but not Haigis, Holladay 2, and T2 formulas (p > 0.05).
The good outcomes of the VRF-G method may be because this formula uses eight predictors for the calculation of the optical power of the lens as compared to the traditional thin-lens formulas, which usually incorporate only two parameters. The only fourth-generation Barrett and Holladay 2 formulas are close and incorporate five and seven predictors for the estimation of the lens position. Despite the similarity and incorporation of ACD and LT, the accuracy of these formulas was not similar, and VRF-G overcomes it.
This investigation supports results that were previously published in studies related to the accuracy of these two methods.6,7,18,19
Melles et al10 analyzed the results of modern formulas in two large databases, where the number of eyes was 13 301 for the SN60WF IOL and 5200 for the SA60AT IOL. Overall, in the entire AL ranges for the SN60WF IOL the Barrett (SD 0.404), Olsen (0.424 D) and Haigis (SD 0.437 D) were the more precise formulas, as they achieved mean PEs closer to zero, whereas the Hoffer Q (SD 0.473 D) achieved a mean myopic PE. These formulas provided the highest value percentage of eyes with a PE within ±0.50 D (Barrett 80.8%, Olsen 78.7%, and Haigis 77.1%). Their findings are in good agreement with our data where Barrett (74.92%) and Haigis (75.59%) had the highest values. In our study, the Haigis (SD 0.466 D) and Barrett (SD 0.474 D) were the second and fourth accurate methods ranking to SD with the VRF (SD 0.471 D) and VRF-G (0.464 D) as an exception.
Voytsekhivskyy et al6 investigated 7 formulas in 823 eyes. They adjusted the mean predicted error to zero and found a statistically significant difference among the absolute errors of the Holladay 2 (P < 0.005) and SRK/T (P < 0.005) formulas. The lowest SD was obtained with the Holladay 1 (0.494 D) and VRF (0.500 D) formulas and the highest with the Holladay 2 formula (0.523 D). However, in terms of the median absolute error (MedAE), the best scores were demonstrated by the VRF (0.305 D) and T2 (0.321 D) formulas. In our investigation, the VRF formula (SD 0.471 D and MedAE 0.271 D), was one of the most accurate, with statistically significant differences concerning the Hoffer Q (p < 0.004), Holladay 1 (p < 0.003), and SRK/T (p = 0.000). The T2 (SD 0.496 and MedAE 0.304 D) and Holladay 2 (SD 0.490 D and MedAE 0.305 D) were less accurate.
Recently, Hipólito-Fernandes et al7 scrutinized 13 formulas on a large sample (n = 828) of eyes with the same type of IOL (IQ SN60WF). Overall, in all eyes, the Kane (SD 0.418 D), EVO 2.0 (SD 0.419 D) and VRF-G (SD 0.423 D), were the more precise methods, as they demonstrated mean PEs closer to zero, whereas the Barrett (SD 0.429 D), Haigis (SD 0.459 D), and VRF (SD 0.440) were less accurate. In our investigation, the VRF-G (SD 0.464 D) and VRF (SD 0.471 D) exhibited better results and outperformed all other methods. The Barrett (SD 0.474 D) was less accurate, with the Haigis (SD 0.466 D) formula being more precise. This contradiction is likely due to the other optical biometer being used (OLCR). The VRF-G had the highest value percentage of eyes with a PE within ±0.50 D (79.50%), which coincides with our study (76.27%).
Savini et al20 compared the 13 formulas in 150 eyes with the same type of IOL (IQ SN60WF) and showed the higher accuracy of the EVO (SD 0.306 D) and Barrett (SD 0.323 D). The worst result was demonstrated by Holladay 2 (SD 0.417 D). The VRF (SD 0.340 D) outperformed Haigis (SD 0.400 D), Hoffer Q (SD 0.395 D), Holladay 1 (SD 0.407 D), Holladay 2 (SD 0.417 D), and SRK/T (SD 0.344 D), with T2 (SD 0.328 D) as an exception. They found statistically significant differences between formulas: EVO vs Haigis (p < 0.005), EVO vs Hoffer Q (p < 0.005), and RBF vs Haigis (p < 0.005). In a subgroup of long eyes, the EVO and VRF had the lowest MedAE (0.168 D and 0.196 D respectively). In our investigation, Barrett had one of the best SD (0.474 D) and MedAE (0.282 D) values compared to other traditional formulas. Haigis (SD 0.466 D) was the second accurate method with respect to other formulas with VRF-G (SD 0.464 D) as an exception. In long eyes the Haigis had one of the lowest MedAE (0.312 D) outperformed other formulas including Barrett (0.335 D), VRF (0.321 D), and T2 (0.347 D).
Darcy et al21 conducted a large comparative study of 10 930 eyes. For the entire axial length group, the lowest SD values were demonstrated by the Kane, Hill, and Olsen formulas (0.490 D, 0.501 D, and 0.501 D, respectively). The Barrett (SD 0.505 D) and Haigis (SD 0.521 D) were less accurate. But, in terms of the median absolute error (MedAE), the best scores were demonstrated by the Kane (0.302 D) and Olsen (0.309 D) formulas. The Holladay 2 (MedAE 0.312 D) outperformed Barrett (MedAE 0.314 D) and Haigis (MedAE 0.327 D). This discrepancy is likely due to the partial coherence interferometry (PCI) biometry and four different types of IOLs were used. The percentage of eyes with a PE within ±0.50 D ranged from 72.00% (Kane) to 68.1% (Hoffer Q). The authors did not find a statistically significant difference between the formulas.
Cooke et al22 studied the prediction errors of six IOL power formulas applied to 1 IOL using 2 biometers (PCI, IOL Master 500, and OLCR, Lenstar LS 900). They had 1079 eyes of 1079 patients and used SD and MAE to measure the accuracy of predictions. The Olsen formula performed the best on standalone and pre-installed in the OLCR device (MAE 0.296 D and SD 0.378 D). The PCI MAE values were 0.319 D, 0.326 D, 0.341 D, 0.346 D, and 0.348 D for Haigis, Holladay 1, Hoffer Q, SRK/T, and T2, respectively. The OLCR MAE values were 0.296 D, 0.314 D, 0.320 D, 0.340 D, 0.342 D, and 0.483 D for Olsen (OLCR), Haigis, Holladay 1, Hoffer Q, SRK/T, and SRKII, respectively. They showed that the OLCR device outperformed the PCI device using the Olsen formula. The Olsen (OLCR) method also ranked first for short eyes. Our data are in good accordance with their data where Haigis (SD 0.466 D and MAE 0.368 D) was one of the most precise formulas and outperformed other traditional formulas. The SRK/T was less accurate (SD 0.537 D and MAE 0.422 D).
Voytsekhivskyy et al23 investigated 24 formulas in 300 eyes of 300 patients with one type of IOL. The VRF-G, Hoffer QST, and Barrett Universal II were the most accurate methods ranked to SD values (0.387 D, 0.404 D, and 0.405 D). The Haigis (SD 0.457 D) outperformed the Hoffer Q (SD 0.498 D) and Holladay 2 (SD 0.504 D) but was less predictable than Holladay 1 (SD 0.456 D), SRK/T (SD 0.440 D), and T2 (SD 0.423 D). Across the entire AL range, the VRF-G and Barrett formulas resulted in the lowest MedAE (0.209 D and 0.225 D) and the highest percentage of eyes with postoperative refraction within ±0.50 D (VRF-G 84.33%, and Barrett 81.33%) of predicted. In our study, Haigis, VRF, and Barrett Universal II had the lowest SD (0.466 D, 0.471 D, and 0.474 D), among other formulas, with the VRF-G (0.464 D) as an exception.
A potential limitation of our scrutiny is that we did not estimate the other modern IOL power calculation methods like Castrop,24 Kane,9 Naeser 2,25 OKULIX,26 and Pearl-DGS.27 Another limitation is the influence of another type of IOL on the formula accuracy.28 Moreover, using other biometry devices can affect the accuracy of the formulas, PCI or OLCR biometry can change the accuracy of the formulas that were supported by many studies.29–31
Additionally, differences between axial lengths calculated using a single refractive index and multiple refractive indices (sum-of-segments biometry) had some effect on IOL power calculation especially in the short and long eyes and should be taken into account in future developments.11,32
The strength of our study is the presence of only one eye for each patient and the sample size calculation.33 These are two important features of a reliable study about IOL power calculation accuracy and in the case of bilateral eyes, smaller p-values could be obtained when they are evaluated in the same group. Specific statistical methods such as the mixed linear models, the Bootstrap or generalized estimating equations (GEE) should be executed to have valid results in these cases.34
Our study revealed that VRF, VRF-G, Haigis, and Barrett formulas had the lowest SD, MedAE, MAE, and percentage of eyes within ±0.50 D predicted refraction values and may therefore be the most accurate. On the other hand, Hoffer Q, Holladay 1, and SRK/T had significantly larger absolute errors and thus should not be recommended when calculating the intraocular lens power. The fourth-generation Haigis and Holladay 2 formulas demonstrated acceptable accuracy and outperformed 3rd generation formulas across all AL ranges with short eyes as an exception, whereas Hoffer Q was the third more precise formula and outperformed all formulas with VRF and VRF-G as an exception. In medium and long eyes, Haigis demonstrated promising results among other methods.
Conclusion
In summary, our study showed that the accuracy of the VRF and VRF-G IOL power formulas together with SS-OCT biometry demonstrated promising results and was comparable with traditional formulas for IOL power calculation in a population of Caucasian eyes.
Disclosure
Dr. Voytsekhivskyy is the inventor and sole owner of the VRF and VRF-G formulas and has patents (PU№101404 and PU№109842) on the method of estimation of postoperative lens position (ELP) and the calculation of optical power and is the author and copyright holder of a computer program VRF Suite V1.3. The author reports no other conflicts of interest in this work.
References
1. Haigis W, Lege B, Miller N, Schneider B. Comparison of immersion ultrasound biometry and partial coherence interferometry for IOL calculation according to Haigis. Graefes Arch Clin Exp Ophthalmol. 2000;238(9):765–773. doi:10.1007/s004170000188
2. Hoffer KJ. The Hoffer Q formula: a comparison of theoretic and regression formulas. J Cataract Refract Surg. 1993;19(6):700–712. errata 1994: 20:677 and 2007;33(1):2-3. doi:10.1016/s0886-3350(13)80338-0. doi:10.1016/S0886-3350(13)80338-0
3. Holladay JT, Prager TC, Chandler TY, Musgrove KH, Lewis JW, Ruiz RS. A three-part system for refining intraocular lens power calculations. J Cataract Refract Surg. 1988;14(1):17–24. doi:10.1016/s0886-3350(88)80059-2
4. Retzlaff JA, Sanders DR, Kraff MC. Development of the SRK/T intraocular lens implant power calculation formula. J Cataract Refract Surg. 1990;16(3):333–340. erratum 1990 Jul;16(4):528. doi:10.1016/s0886-3350(13)80705-5
5. Sheard RM, Smith GT, Cooke DL. Improving the prediction accuracy of the SRK/T formula: the T2 formula. J Cataract Refract Surg. 2010;36(11):1829–1834. doi:10.1016/j.jcrs.2010.05.031
6. Voytsekhivskyy O. Development and clinical accuracy of a new intraocular lens power formula (VRF) compared to other formulas. Am J Ophthalmol. 2018;185:56–67. doi:10.1016/j.ajo.2017.10.020
7. Hipólito-Fernandes D, Luís ME, Gil P, et al. VRF-G, a new intraocular lens power calculation formula: a 13-formulas comparison study. Clin Ophthalmol. 2020;14:4395–4402. doi:10.2147/OPTH.S290125
8. Barret GD. An improved universal theoretical formula for intraocular lens power prediction. J Cataract Refract Surg. 1993;19(6):713–720. doi:10.1016/s0886-3350(13)80339-2
9. Melles RB, Kane JX, Olsen T, Chang WJ. Update on intraocular lens power calculation formulas. Ophthalmology. 2019;126(9):1334–1335. doi:10.1016/j.ophtha.2019.04.011
10. Melles RB, Holladay JT, Chang WJ. Accuracy of intraocular lens calculation formulas. Ophthalmology. 2018;125(2):169–178. doi:10.1016/j.ophtha.2017.08.027
11. Shammas J, Taroni L, Pellegrini M, Shammas M, Jivrajka R. Accuracy of newer IOL power formulas in short and long eyes using sum-of-segments biometry. J Cataract Refract Surg. 2022;48(10):1113–1120. doi:10.1097/j.jcrs.0000000000000958
12. Savini G, Hoffer KJ, Shammas HJ, Aramberri J, Huang J, Barboni P. Accuracy of a new swept-source optical coherence tomography biometer for IOL power calculation and comparison to IOLMaster. J Refract Surg. 2017;33(1):690–695. doi:10.3928/1081597X-20170721-05
13. Hoffer KJ, Hoffmann PC, Savini G. Comparison of a new optical biometer using swept-source optical coherence tomography and a biometer using optical low-coherence reflectometry. J Cataract Refract Surg. 2016;42(8):1165–1172. doi:10.1016/j.jcrs.2016.07.013
14. Cione F, De Bernardo M, Gioia M, et al. A No-History Multi-Formula Approach to Improve the IOL Power Calculation after Laser Refractive Surgery: preliminary Results. J Clin Med. 2023;12(8):2890. doi:10.3390/jcm12082890
15. Wang L, Koch DD, Hill W, Abulafia A. Pursuing perfection in intraocular lens calculations: III. Criteria for analyzing outcomes. J Cataract Refract Surg. 2017;43(8):999–1002. doi:10.1016/j.jcrs.2017.08.003
16. Simpson MJ, Charman WN. The effect of testing distance on intraocular lens power calculation. J Refract Surg. 2014;30(11):726. doi:10.3928/1081597X-20141021-01
17. Hoffer KJ, Savini G. Update on intraocular lens power calculation study protocols: the better way to design and report clinical trials. Ophthalmology. 2021;128(11):e115–e120. doi:10.1016/j.ophtha.2020.07.005
18. Voytsekhivskyy O, Hoffer KJ, Savini G, Tutchenko L, Hipólito-Fernandes D. Clinical Accuracy of 18 IOL power formulas in 241 short eyes. Curr Eye Res. 2021;46(12):1832–1843. doi:10.1080/02713683.2021.1933056
19. Voytsekhivskyy O, Tutchenko L, Hipólito-Fernandes D. Comparison of the Barrett Universal II, Kane and VRF-G formulas with existing intraocular lens calculation formulas in eyes with short axial lengths. Eye. 2022;37(1):120–126. doi:10.1038/s41433-021-01890-7
20. Savini G, Hoffer KJ, Balducci N, Barboni P, Schiano-Lomoriello D. Comparison of formula accuracy for intraocular lens power calculation based on measurements by a swept-source optical coherence tomography optical biometer. J Cataract Refract Surg. 2020;46(1):27–33. doi:10.1016/j.jcrs.2019.08.044
21. Darcy K, Gunn D, Tavassoli S, Sparrow J, Kane JX. Assessment of the accuracy of new and updated intraocular lens power calculation formulas in 10 930 eyes from the UK national health service. J Cataract Refract Surg. 2020;46(1):2–7. doi:10.1016/j.jcrs.2019.08.014
22. Cooke DL, Cooke TL. Prediction accuracy of preinstalled formulas on 2 optical biometers. J Cataract Refract Surg. 2016;42(3):358–362. doi:10.1016/j.jcrs.2015.11.040
23. Voytsekhivskyy O, Hoffer KJ, Tutchenko L, Cooke DL, Savini G. Accuracy of 24 IOL power calculation methods. J Refract Surg. 2023;39(4):249–256. doi:10.3928/1081597X-20230131-01
24. Wendelstein J, Hoffmann P, Hirnschall N, et al. Project hyperopic power prediction: accuracy of 13 concepts for intraocular lens calculation in short eyes. Br J Ophthalmol. 2021:1–7. doi:10.1136/bjophthalmol-2020-318272
25. Næser K, Savini G. Accuracy of thick-lens intraocular lens power calculation based on cutting-card or calculated data for lens architecture. J Cataract Refract Surg. 2019;45(10):1422–1429. doi:10.1016/j.jcrs.2019.05.021
26. Ghaffari R, Abdi P, Moghaddasi A, Heidarzadeh S, Ghahvhechian H, Kasiri M. Ray tracing versus thin-lens formulas for IOL power calculation using swept-source optical coherence tomography biometry. J Ophthalmic Vis Res. 2022;17(2):176–185. doi:10.18502/jovr.v17i2.10788
27. Debellemaniere G, Dubois M, Gauvin M, et al. The PEARL-DGS formula: the development of an open-source machine learning-based thick IOL calculation formula. Am J Ophthalmol. 2021;232:58–69. doi:10.1016/j.ajo.2021.05.004
28. Jiang CC, Hodson NM, Johnson DA, Kheirkhah A. Accuracy of IOL power calculation formulas for AcrySof SN60WF versus Tecnis ZCB00 intraocular lenses. J Ophthalmic Vis Res. 2022;17(3):344–352. doi:10.18502/jovr.v17i3.11571
29. Galzignato A, Lupardi E, Hoffer KJ, Barboni P, Schiano-Lomoriello D, Savini G. Repeatability of new optical biometer and agreement with 2 validated optical biometers, all based on SS-OCT. J Cataract Refract Surg. 2023;49(1):5–10. doi:10.1097/j.jcrs.0000000000001023
30. Pfaeffli OA, Weber A, Hoffer KJ, et al. Agreement of intraocular lens power calculation between 2 SS-OCT-based biometers. J Cataract Refract Surg. 2022;48(5):535–541. doi:10.1097/j.jcrs.0000000000000788
31. Kanclerz P, Hoffer KJ, Bazylczyk N, Wang X, Savini G. Optical biometry and IOL calculation in a commercially available optical coherence tomography device and comparison with Pentacam AXL. Am J Ophthalmol. 2023;246:236–241. doi:10.1016/j.ajo.2022.09.022
32. Shammas HJ, Shammas MC, Jivrajka RV, Cooke DL, Potvin R. Effects on IOL power calculation and expected clinical outcomes of axial length measurements based on multiple vs single refractive indices. Clin Ophthalmol. 2020;14:1511–1519. doi:10.2147/OPTH.S256851
33. Cione F, Gioia M, Pagliarulo S. Bias that should be avoided to obtain a reliable study of IOL power calculation after myopic refractive surgery. J Refract Surg. 2023;39(1):68. doi:10.3928/1081597X-20221122-02
34. De BM, Cione F, Rosa N. Re: Turnbull et al.: methods for intraocular lens power calculation in cataract surgery after radial keratotomy (Ophthalmology. Ophthalmology. 2020;127(45–51):e87. doi:10.1016/j.ophtha.2020.05.017
 © 2023 The Author(s). This work is published and licensed by Dove Medical Press Limited. The full terms of this license are available at https://www.dovepress.com/terms.php and incorporate the Creative Commons Attribution - Non Commercial (unported, v3.0) License.
By accessing the work you hereby accept the Terms. Non-commercial uses of the work are permitted without any further permission from Dove Medical Press Limited, provided the work is properly attributed. For permission for commercial use of this work, please see paragraphs 4.2 and 5 of our Terms.
© 2023 The Author(s). This work is published and licensed by Dove Medical Press Limited. The full terms of this license are available at https://www.dovepress.com/terms.php and incorporate the Creative Commons Attribution - Non Commercial (unported, v3.0) License.
By accessing the work you hereby accept the Terms. Non-commercial uses of the work are permitted without any further permission from Dove Medical Press Limited, provided the work is properly attributed. For permission for commercial use of this work, please see paragraphs 4.2 and 5 of our Terms.