Back to Journals » Nature and Science of Sleep » Volume 12
Determination of Inflammatory Markers, Hormonal Disturbances, and Sleepiness Associated with Sleep Bruxism Among Adults
Authors Michalek-Zrabkowska M, Wieckiewicz M ![]() , Smardz J
, Smardz J ![]() , Gac P
, Gac P ![]() , Poreba R, Wojakowska A, Mazur G
, Poreba R, Wojakowska A, Mazur G ![]() , Martynowicz H
, Martynowicz H ![]()
Received 19 June 2020
Accepted for publication 14 September 2020
Published 10 November 2020 Volume 2020:12 Pages 969—979
DOI https://doi.org/10.2147/NSS.S268470
Checked for plagiarism Yes
Review by Single anonymous peer review
Peer reviewer comments 2
Editor who approved publication: Dr Steven Shea
Monika Michalek-Zrabkowska,1 Mieszko Wieckiewicz,2 Joanna Smardz,2 Pawel Gac,3 Rafal Poreba,1 Anna Wojakowska,1 Grzegorz Mazur,1 Helena Martynowicz1
1Department of Internal Medicine, Occupational Diseases, Hypertension and Clinical Oncology, Wroclaw Medical University, Wroclaw 50-556, Poland; 2Department of Experimental Dentistry, Wroclaw Medical University, Wroclaw 50-425, Poland; 3Department of Hygiene, Wroclaw Medical University, Wroclaw 50-345, Poland
Correspondence: Mieszko Wieckiewicz
Department of Experimental Dentistry, Wroclaw Medical University, 26 Krakowska Street, Wroclaw 50-425, Poland
Tel + 48 660 47 87 59
Email [email protected]
Purpose: Sleep bruxism (SB) is characterized by repetitive phasic, tonic, or mixed masticatory muscle activity during sleep with multifactorial etiology. Previous studies have shown that the complex origin of SB can be related to the psychological features of the affected individual, consumption of caffeine and alcohol, smoking, obstructive sleep apnea, diabetes, increased body mass index, hypertension, thyroid diseases, and probable genetic vulnerability. This study aimed to investigate the inflammatory markers, hormonal disturbances, and sleepiness associated with SB, which have a potential effect on the total cardiovascular (CV) risk among relatively young and healthy patients.
Patients and Methods: A total of 74 individuals with probable SB were subjected to single-night polysomnography, followed by blood panel and 24-h urinary excretion tests. The level of daytime sleepiness was assessed in the participants using the Epworth Sleepiness Scale.
Results: SB was found in 78.4% of participants. The bruxism episode index (BEI) positively correlated with the concentrations of 17-hydroxycorticosteroids, C-reactive protein, and fibrinogen in the collected urine samples. A positive correlation was also found between phasic BEI and glucose concentration 2 h after the consumption of glucose solution. Sleep bruxers showed significantly increased sleepiness compared to nonbruxers (p = 0.02). The scores on sleepiness were positively correlated with mixed BEI, minimal oxygen saturation, and mean heart rate.
Conclusion: The results of this study revealed that participants with SB had metabolic and hormonal disturbances, probably due to stress and sympathetic activity. Moreover, it was found that young sleep bruxers potentially have a high CV risk due to the increased level of inflammatory and stress markers.
Keywords: sleep bruxism, obstructive sleep apnea, polysomnography, cardiovascular diseases, inflammatory markers
Introduction
Bruxism is a condition observed during sleep or wakefulness and has been estimated to be present in 8–31% of the population worldwide.1 A widely accepted international consensus by Lobbezoo et al proposed two separate definitions for this condition,2 which describes sleep bruxism (SB) as
“a masticatory muscles activity during sleep that is characterized as rhythmic (phasic) or nonrhythmic (tonic) and is not a movement disorder or a sleep disorder in otherwise healthy individuals“.2
The consensus also proposed a grading system for categorizing bruxism: “possible”—grade based on a positive interview, “probable”—grade based on a clinical examination with or without a positive interview, and “definite”—grade based on a positive instrumental examination with or without a positive interview and/or positive clinical inspection.2 SB is estimated to frequently occur in 13% of adults.2 The American Academy of Sleep Medicine (AASM) defined bruxism as “a repetitive jaw-muscle activity characterized by clenching or grinding of the teeth and/or by bracing or thrusting of the mandible.”3 The International Classification of Sleep Disorders (ICDS-3) subsequently proposed the following criteria for the classification of SB: (A) regular or frequent tooth grinding sounds produced during sleep and (B) presence of one or more of the clinical signs that are pertinent to the aforementioned reports of tooth grinding during sleep: (1) abnormal tooth wear and (2) transient jaw-muscle pain or fatigue in the morning and/or temporal headache and/or jaw locking upon awakening.4 The possible underlying causes of SB include dysfunction of the autonomic nervous system,5,6 autonomic response to arousal, and impaired airway patency.7 Lavigne et al reported that SB mostly occurs during cortical recovery associated with sympathetic activation manifested as an increased heart rate.8,9 The international consensus10 classified the causes of SB into three groups: biological, psychological, and external. The first group includes neurotransmission, cortical arousals, age, and genetic components of SB. The second group includes the important risk factors associated with the psychological features of the individual such as sensitivity to emotional stress11 or anxiety disorders. The third group or external factors are constituted by caffeine consumption, smoking, alcohol intake, and drug use.12 Furthermore, the multifactorial origin of bruxism involves medical conditions and disorders such as obstructive sleep apnea (OSA),13,14 diabetes,14 increased body mass index (BMI), hypertension,15,16 thyroid diseases, sleepiness, and snoring.17
The contraction of cardiovascular diseases (CVDs) increases with age among patients with an established CVD and those at an increased risk of developing a CVD. Lifetime management of cardiovascular (CV) risk is important for patients of all ages, especially young and healthy ones and those who already have acquired comorbidities.18 CVD prevention is described as a population-based strategy or targeted individual plan that focuses on eliminating or reducing CV morbidity and mortality as well as their related consequences.19 Overall CV risk is contributed by multiple risk factors that may occur together and are specific for each patient. Hence, the CVD prevention plan should be customized to individuals based on their CV risk. Clinicians can assess the CV risk in an individual using many diagnostic tools, laboratory tests, and estimation systems such as the recommended Systematic Coronary Risk Evaluation (SCORE) scale.20 These interventions can decrease the fatality of CVD.21 A Cochrane review of randomized controlled trials revealed that modifying the CV risk by counseling or educating the general population did not reduce the overall CV mortality, but this intervention was effective in a distinct group of hypertensives or diabetics.22 Psychosocial factors and chronic emotional stress are considered when assessing both the CV risk and SB etiology. In addition, depression and chronic stress affect homeostatic and autonomic functions and are associated with inflammatory processes and increased CV risk. The literature shows that sleep disturbances may be associated with increased CV risk.23 It was previously indicated that increased sympathetic activity leads to inflammatory process24 and is associated with SB.6 Therefore, we hypothesized that SB may increase the CV risk by inducing the inflammatory process. This study aimed to determine sleepiness, hormonal disturbances, and inflammatory markers in individuals with SB, which might have a potential effect on their overall CV risk.
Participants and Methods
This study was conducted in the Sleep Laboratory of the Department of Internal Medicine, Occupational Diseases, Hypertension and Clinical Oncology at the Wroclaw Medical University, Poland. Patients who were suspected with primary bruxism were examined by qualified dentists in the Clinic of Prosthetic Dentistry in the Department of Prosthetic Dentistry at the Wroclaw Medical University, Poland. All the examined individuals were diagnosed with probable SB2 based on a clinical investigation with or without a positive interview. Participants were recruited in the dental office, in accordance with the international consensus on the assessment of bruxism.2 A physical extra- and intraoral examination was also conducted for a complex assessment of the teeth and oral soft tissue for each individual. The observed clinical symptoms included abnormal tooth wear and damage to the dental hard tissues (ie, cracked teeth), hypertrophy of masseter and temporalis muscles, tongue and lip indentations, injury to the inner surface of the cheeks (linea alba), and repetitive damage of restorative work or prosthodontic constructions.2
Immature patients were excluded from the study group. In addition, the following exclusion criteria were applied: unwillingness to provide informed consent or undergo polysomnography; presence of secondary bruxism associated with neurological conditions; history of treatment with medications that can interfere with the functions of the nervous and muscular systems; presence of severe mental disorders, cognitive disability, or severe systemic diseases including active malignancy; presence of neurological disorders and/or neuropathic pain; coexistence of respiratory insufficiency or active inflammation; addiction to analgesics and/or drugs that can affect the muscles and breathing; or treatment with foregoing medications.
The protocol used for qualifying patients for the study is presented in Figure 1.
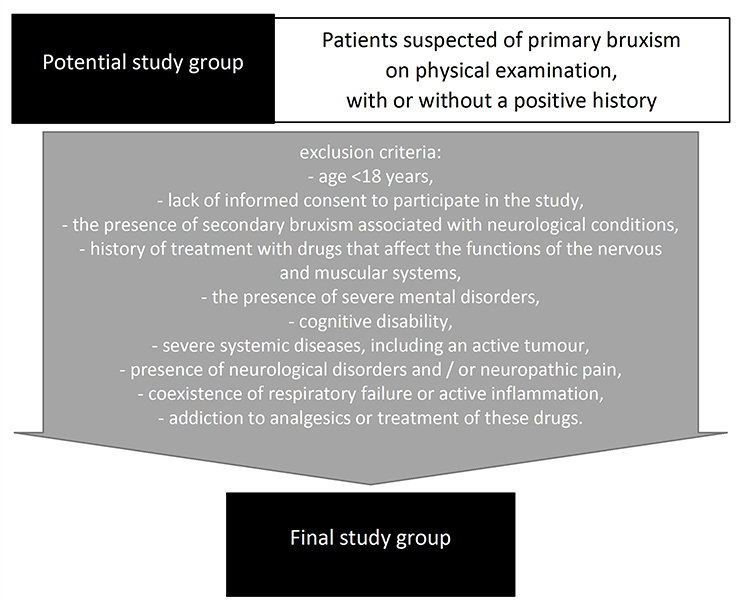 |
Figure 1 The protocol of qualifying patients for the study. |
Daytime sleepiness was assessed in participants using the Epworth Sleepiness Scale (ESS), which is a simple, self-administered questionnaire consisting of eight items that measure a subject’s habitual chance of dozing or falling asleep in common situations. The total score is obtained by adding up the scores of the individual items (rated on a scale of 0–3 for each item), and the maximum total score is 24. Scores above 10 were considered abnormal.25 In addition, the participants were asked a series of questions about their symptoms and comorbidities, weight and height, age, and gender, with which their BMI (calculated as weight in kilograms divided by the square of height in meters) was determined.
Blood samples were collected from the participants by venipuncture and analyzed at the hospital’s main laboratory at the University Clinical Hospital, Wroclaw, Poland. The levels of insulin and glucose in serum were determined after 12 h of overnight fasting. Insulin resistance (IR) was measured using the Homeostatic Model Assessment (HOMA) index. Based on fasting plasma levels of insulin and glucose, the HOMA index was calculated by dividing the values of fasting glucose (mmol/l) and fasting insulin (µU/l) by constant 22.5.
The polysomnographic examination was conducted at the Sleep Laboratory of the Department of Internal Medicine, Occupational Diseases, Hypertension and Clinical Oncology at the Wroclaw Medical University, Poland. All the patients were subjected to the standardized overnight, single-night polysomnography using the Nox-A1 (Nox Medical, Iceland) device. Polysomnograms (PSGs) were assessed in 30-s epochs. The outcomes of PSG included the following: sleep latency; total sleep time and sleep efficiency (%); the ratio of N1 (sleep stage 1), N2 (sleep stage 2), and N3 (sleep stage 3); and the stage of rapid eye movement sleep. Abnormal respiratory events were scored from the nasal pressure airflow signal. Apneas were defined as the absence of airflow for ≥10 s, while hypopneas were defined as a reduction in the breathing amplitude by ≥30% for ≥10 s with a ≥3% decline in blood oxygen saturation or followed by an arousal. Sleep scoring data and respiratory events were evaluated according to the standard criteria of the AASM 2013 Task Force.26
SB was assessed through the electromyographic (EMG) recordings of bilateral masseter muscle activity during sleep, supplemented by video and audio recordings. Following the AASM standards, the masticatory muscle activity events and bursts clustered in bruxism episodes were scored as phasic, tonic, or mixed. These standards recommend that the EMG outcome measures, such as peak amplitude, must be at least twice the basal EMG amplitude for confirming the diagnosis of SB. The interval between two EMG bursts should not be longer than 3 s to be considered as a part of the same episode. During the audiovisual scoring, a sustained burst in the EMG recording for a duration of 2 s was classified as tonic, three or more bursts or “twitches” for over 2 s were classified as phasic, and a mix of them was classified as a mixed episode. These episodes were summed up and expressed as bruxism events per hour of sleep or BEI (<2: irrelevant SB; 2–4: mild/moderate SB; >4: severe SB).27
Statistical analysis was performed using the statistical program “Dell Statistica 13” (Dell Inc., USA). For quantitative variables, arithmetic means and standard deviations in the studied groups were calculated. For quantitative independent variables with a normal distribution, the t-test or analysis of variance (ANOVA) was used for further statistical analysis. For quantitative independent variables with a distribution other than normal, the Mann–Whitney U-test or the nonparametric ANOVA Kruskal–Wallis test was used. The results for the qualitative variables are expressed as percentages. Chi-square test was used for further statistical analysis of independent qualitative variables. To determine the relationship between the studied variables, correlation and regression analyses were performed. For quantitative variables with a normal distribution, Pearson’s r correlation coefficients were determined, and for those with a distribution other than normal, Spearman’s r correlation coefficients were calculated. The model parameters in the regression analysis were estimated using the least-squares method. The results at the level of p ≤ 0.05 were considered statistically significant.
This study was approved by the Ethics Committee of the Wroclaw Medical University (no. KB-195/2017) and was conducted in accordance with the guidelines of the Declaration of Helsinki. All the included patients gave written informed consent. The study was also registered in the international database for clinical studies (clinical trial registration: NCT03083405, WMU1/2017, https://clinicaltrials.gov/ct2/show/NCT03083405).
Results
The study group consisted of 74 Caucasian patients with probable SB (54 women and 20 men, mean age 34.24 ± 10.65 years, range 18–63 years). According to the commonly accepted BMI ranges, 6.8% (n = 5) of patients were diagnosed as underweight (BMI <18.5 kg/m2), 63.5% (n = 47) had a normal weight (BMI 18.5–25 kg/m2), 20.3% (n = 15) were identified as overweight (BMI 25–30 kg/m2), and 6.8% (n = 5) were found as obese (BMI >30 kg/m2). The demographic characteristics of the study group are presented in Table 1.
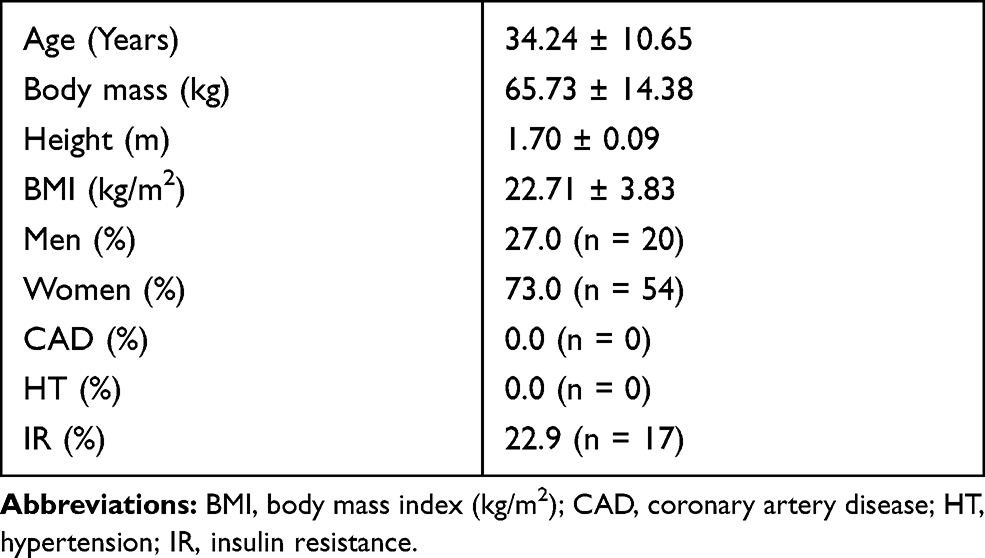 |
Table 1 Demographic Characteristics of the Study Group |
SB was diagnosed based on the polysomnographic findings. Almost three out of four (78.4%, n = 58) patients met the criteria required for the diagnosis of SB, while 36.5% were diagnosed with mild bruxism (n = 27) and 41.9% with severe bruxism (n = 31).
OSA was diagnosed in 23.0% (n = 17) of the examined patients. The condition was mild in 13.5% (n = 10), moderate in 5.4% (n = 4), and severe in 4.0% (n = 3). The results of the laboratory studies are presented in Table 2.
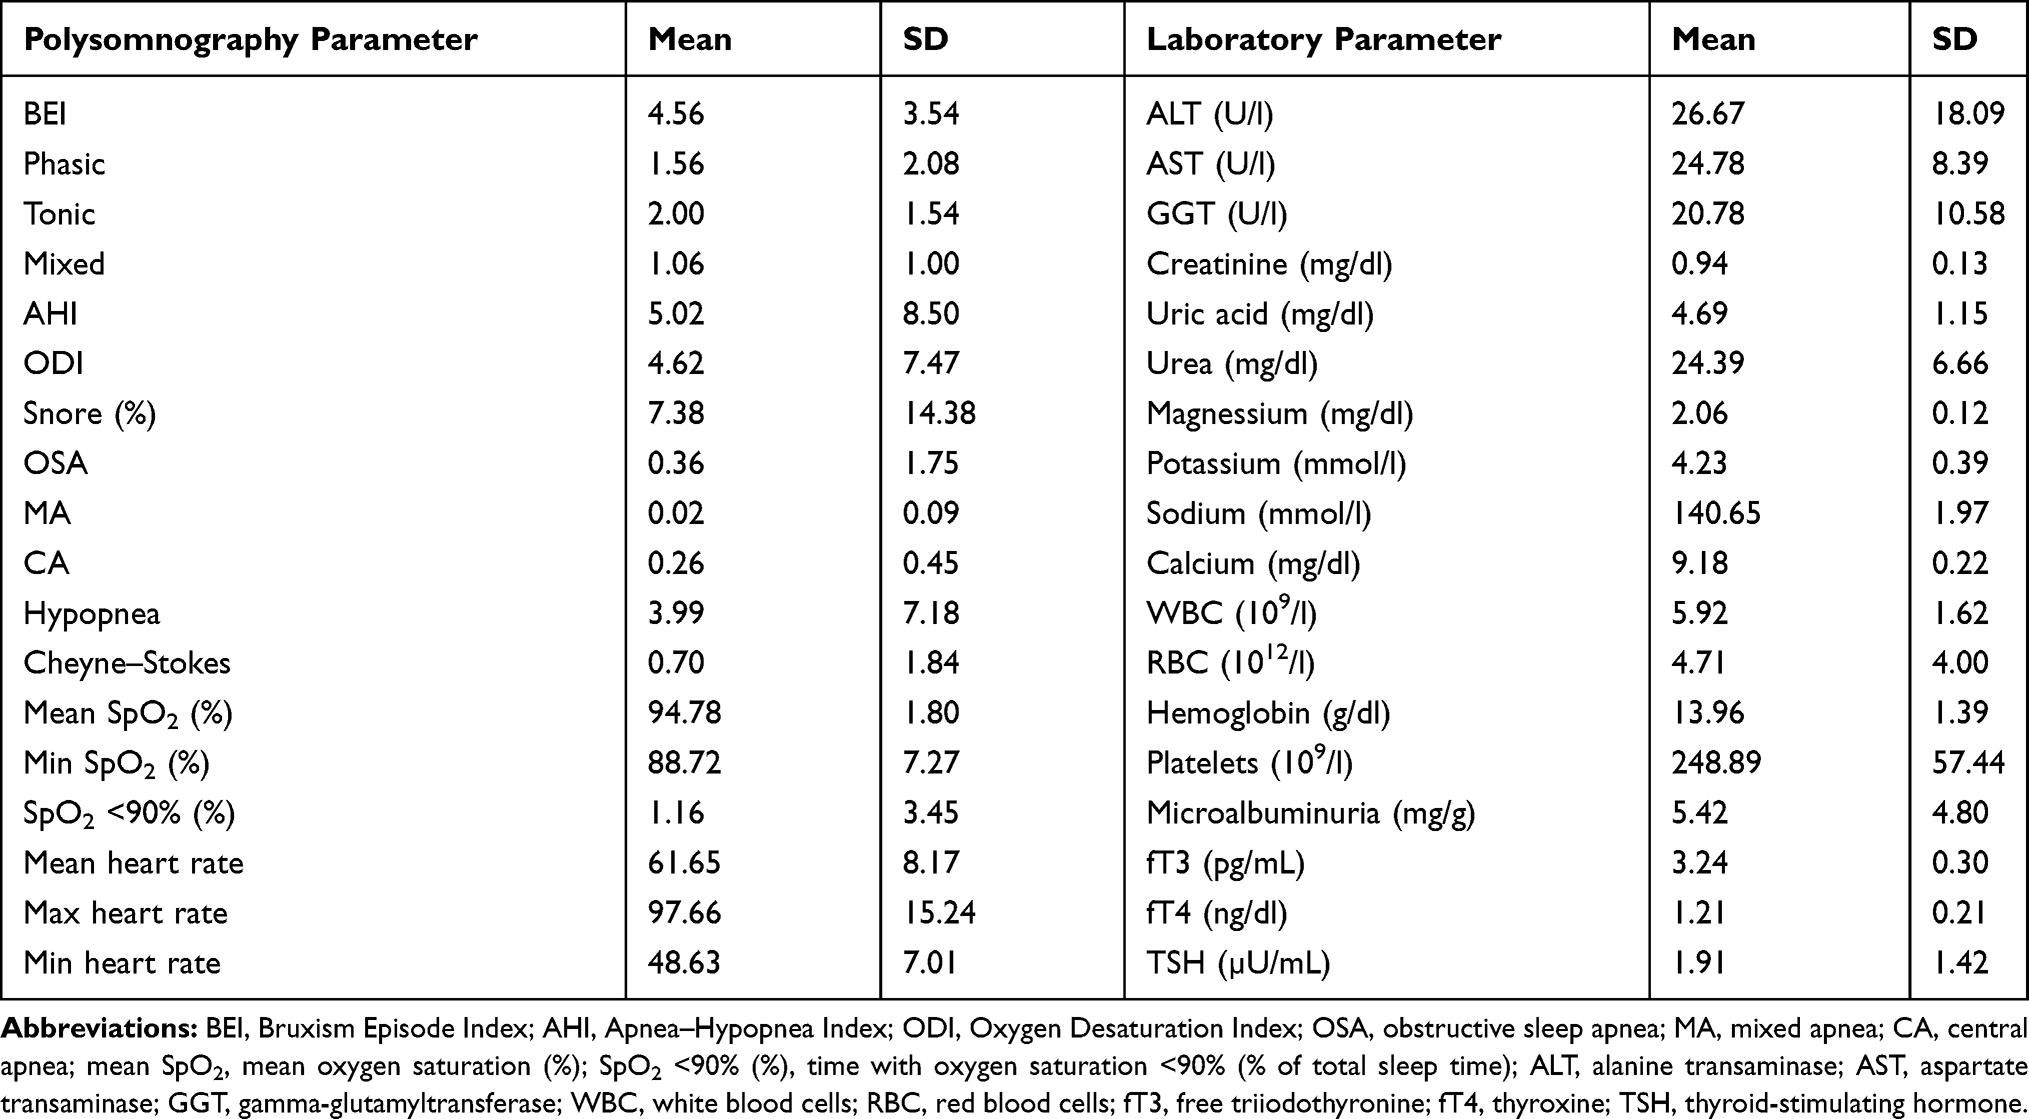 |
Table 2 Bruxism, Respiratory, and Laboratory Mean Indices in the Study Group |
Plasma lipid measurements included mean total cholesterol level (195.76 ± 39.10 mg/dl), mean triglyceride level (112.01 ± 53.82 mg/dl), mean concentration of low-density lipoprotein cholesterol (LDL-C; 113.51 ± 32.71 mg/dl), and mean concentration of high-density lipoprotein cholesterol (HDL-C; 60.19 ± 14.61 mg/dl). The total cholesterol level was elevated (>200 mg/dl) in 43.2% (n = 32) of the patients. Increased triglyceride levels (>150 mg/dl) were observed in 18.9% (n = 14) of the cases, whereas elevated LDL-C (>135 mg/dl) was found in 18.9% (n = 14). Low HDL-C, classified as <40 mg/dl, was found in 5.4% (n=4) of the tested patients. No statistically significant differences were noted in any of these measurements between patients without SB (BEI <2) and those with severe SB (BEI >4). The mean concentration of LDL-C in patients with OSA (apnea–hypopnea index (AHI) ≥5) was significantly greater than that in those without OSA (126.81 ± 40.47 mg/dl vs 109.77 ± 29.54 mg/dl, p = 0.047). An increased mean triglyceride value was found in patients with severe OSA (AHI >30) as compared to those with AHI ≤30 (176.00 ± 133.29 mg/dl vs 109.19 ± 48.01 mg/dl, p = 0.03).
The mean ESS score of the diagnosed patients was 9.90 ± 4.96. Daytime sleepiness, which was identified with a sleepiness score ≥10 in the ESS, was observed in 48.6% (n = 36) of the participants. A significant difference in the ESS scores was noted between patients with SB (BEI ≥2) and those without SB (10.62 ± 4.72 and 7.07 ± 5.03, respectively, p = 0.02). The sleepiness scores were positively correlated with the following indices: mixed bruxism episodes, minimal oxygen saturation, and mean heart rate (correlation coefficients: 0.33, 0.25, and 0.24, respectively, p < 0.05).
The comparison of bruxism and respiratory indices between patients who reported daytime sleepiness (ESS ≥10) and those without sleepiness (ESS <10) is presented in Table 3.
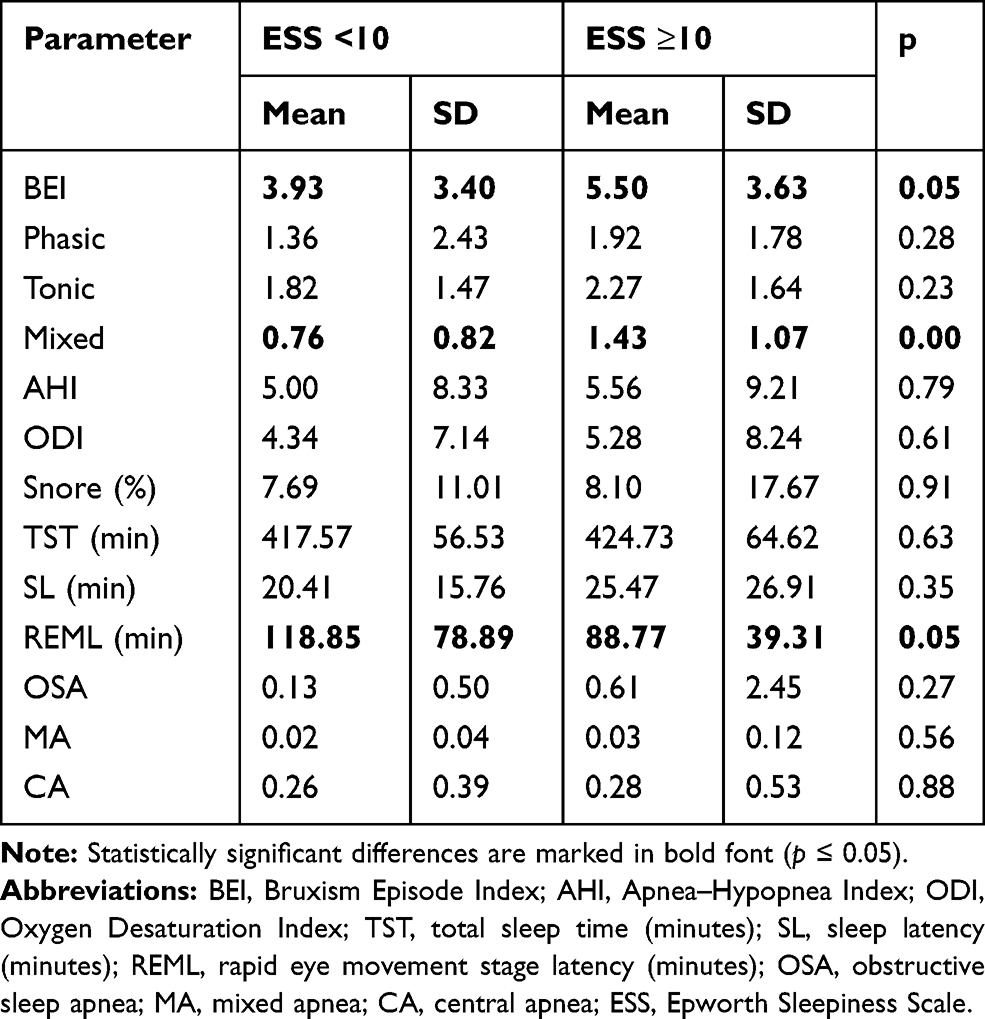 |
Table 3 Comparison of Bruxism and Respiratory Indices Based on the Sleepiness Scores |
The HOMA index was calculated based on the results obtained from the analysis of carbohydrate metabolism, the analysis of fasting glucose and insulin levels, and the analysis of glucose and insulin level 1 and 2 h after the intake of the glucose solution. In the entire study group, the mean levels of fasting glucose (mmol/l), glucose 2 h after consuming the glucose solution, fasting insulin (µU/mL), and insulin 1 and 2 h after consuming the glucose solution were determined as 5.10 ± 0.58 mmol/l, 4.90 ± 1.20 mmol/l, 8.04 ± 6.96 µU/mL, 51.77 ± 55.31 µU/mL, and 25.24 ± 28.98 µU/mL, respectively. An elevated level of fasting glucose (>5.5 mmol/l) was found in 12.2% (n = 9) of the examined patients. Based on the HOMA indices, 13.5% (n = 10) of patients were found to have early-stage IR (HOMA-IR >1.9), 9.5% (n = 7) had advanced IR (HOMA-IR >2.9), and 73.0% (n = 54) were normal. The levels of glucose measured 2 h after consuming the glucose solution were positively correlated with phasic bruxism episodes (r = 0.26, p < 0.05).
The 24-h urinary excretion rates of 17-hydroxycorticosteroids (17-OHCS) were higher in 12.2% (n = 9) of patients, whereas 62.2% (n = 46) had normal ranges and 13.5% (n = 10) showed lower rates. The estimated mean value was 5.86 ± 3.14 mg/24 h. In patients with severe SB (BEI >4), the level of 17-OHCS was found as 6.94 ± 3.76 mg/24 h, which was significantly higher than that in patients without SB (5.05 ± 2.31 mg/24 h, p = 0.02). Student’s t-test also revealed a statistically significant difference in the urinary levels of 17-OHCS between patients with OSA (AHI ≥5) and those without OSA (AHI <5) (8.36 ± 4.12 mg/24 h vs 5.18 ± 2.44 mg/dl, p = 0.01). Urinary 17-OHCS levels were positively correlated with the following indices: BEI, phasic bruxism episodes, oxygen desaturation index (ODI), snore, and hypopnea (correlation coefficients: 0.27, 0.26, 0.27, 0.35, and 0.25, respectively, p < 0.05) (Table 4).
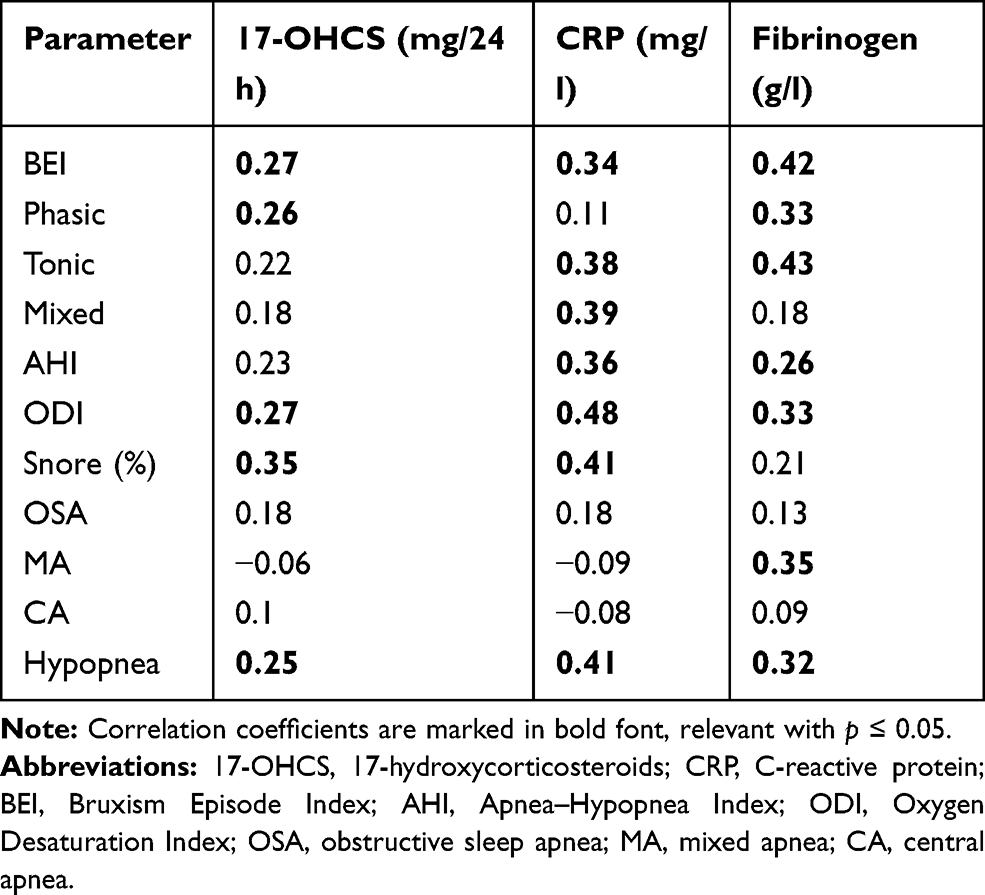 |
Table 4 Correlation of Bruxism and Respiratory Indices with Laboratory Findings: 17-OHCS, CRP, and Fibrinogen |
The mean concentration of CRP in the blood plasma of the examined patients was 2.28 ± 5.15 mg/l, which was increased by 6.8% (n = 5) of the patients. A statistically significant difference was observed in BEI between patients with normal CRP values and those with increased values (4.39 ± 3.43 mg/l vs 7.88 ± 4.43 mg/l, respectively, p = 0.042). Student’s t-test also revealed a significant difference between patients with severe OSA (AHI >30) and those with AHI ≤30 (15.57 ± 16.62 mg/l vs 1.69 ± 3.35 mg/l, respectively, p = 0.01). Patients with CRP values >5 mg/l exhibited a significantly increased level of tonic and mixed SB episodes compared to patients with normal CRP levels (3.70 ± 1.96 mg/l vs 1.88 ± 1.46 mg/l, respectively, p = 0.01 for tonic; 2.02 ± 1.49 mg/l vs 1.01 ± 0.94 mg/l, respectively, p = 0.03 for mixed). Plasma CRP levels were positively correlated with the following indices: BEI, tonic and mixed bruxism episodes, AHI, ODI, snore, and hypopnea (correlation coefficients: 0.34, 0.38, 0.39, 0.36, 0.48, 0.41, and 0.41, respectively, p < 0.05) (Table 4). In patients with elevated CRP values, sleep indicators such as AHI, ODI, snore percentage, hypopnea index, and mean desaturation drop were significantly higher as compared to those with a normal level of CRP (Table 5).
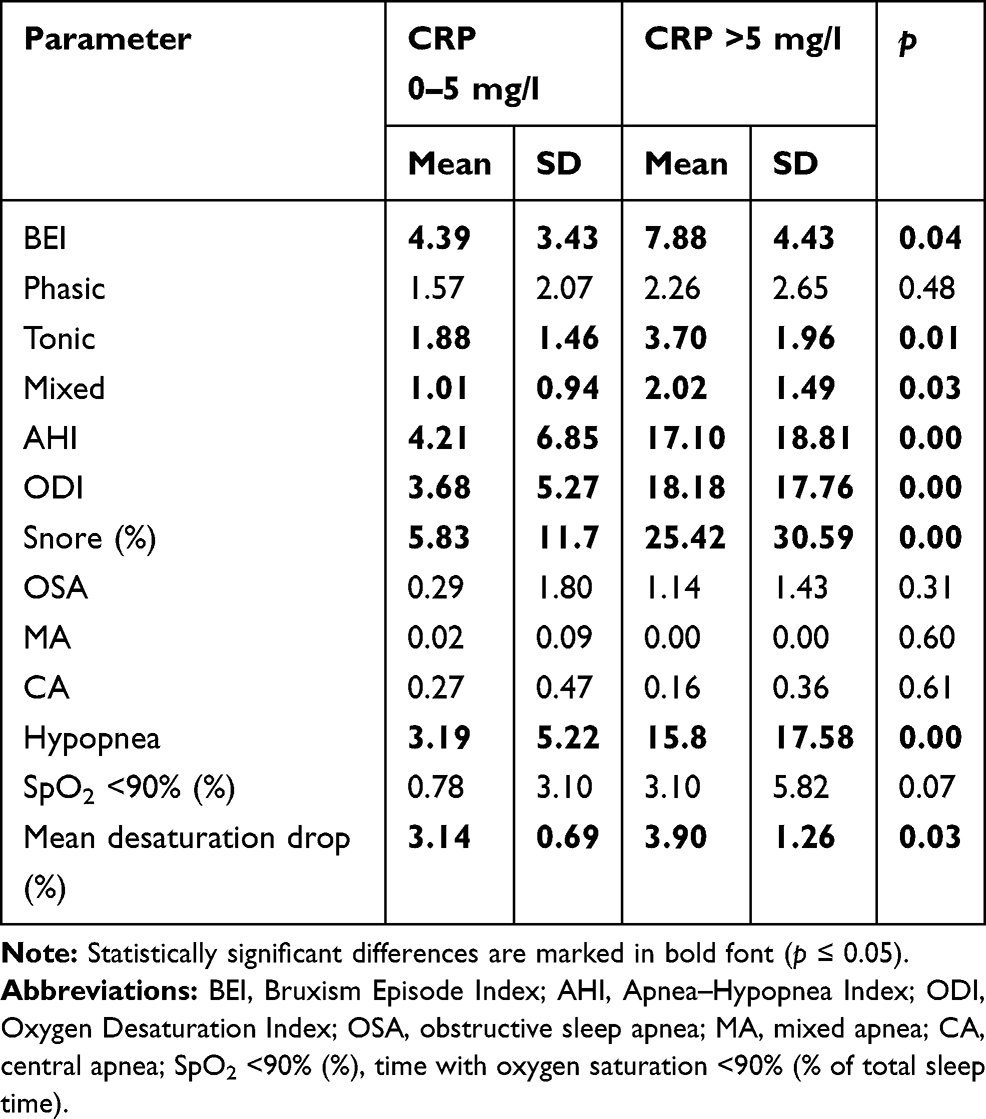 |
Table 5 Differences in Bruxism and Respiratory Indices Based on CRP Level |
The mean fibrinogen concentration in the blood serum of the patients was 2.69 ± 0.57 g/l. With the normal fibrinogen range being 1.8–3.5 g/l, 1.3% (n = 1) of the patients had a below-normal range and 5.4% (n = 4) showed an above-normal range, while 82.4% (n = 61) of the patients exhibited the normal range. Fibrinogen concentration in patients with severe SB (BEI >4) was significantly increased to 2.86 ± 0.69 g/l, compared to those without SB (2.58 ± 0.45 g/l; p = 0.046). Serum fibrinogen levels were positively correlated with the following indices: BEI, phasic and tonic bruxism episodes, AHI, ODI, mixed apnea, and hypopnea (correlation coefficients: 0.42, 0.33, 0.43, 0.26, 0.33, 0.35, and 0.32, respectively, p < 0.05) (Table 4).
The multivariate regression analysis showed that the relationships between BEI and 17-OHCS, BEI and CRP, as well as BEI and fibrinogen were independent of AHI and BMI (Table 6). A higher BEI and a higher BMI were independently associated with a higher level of 17-OHCS (mg/24 h), as well as with a higher level of fibrinogen (g/l). Higher BEI and higher AHI were identified as independent predictors of higher CRP (mg/l).
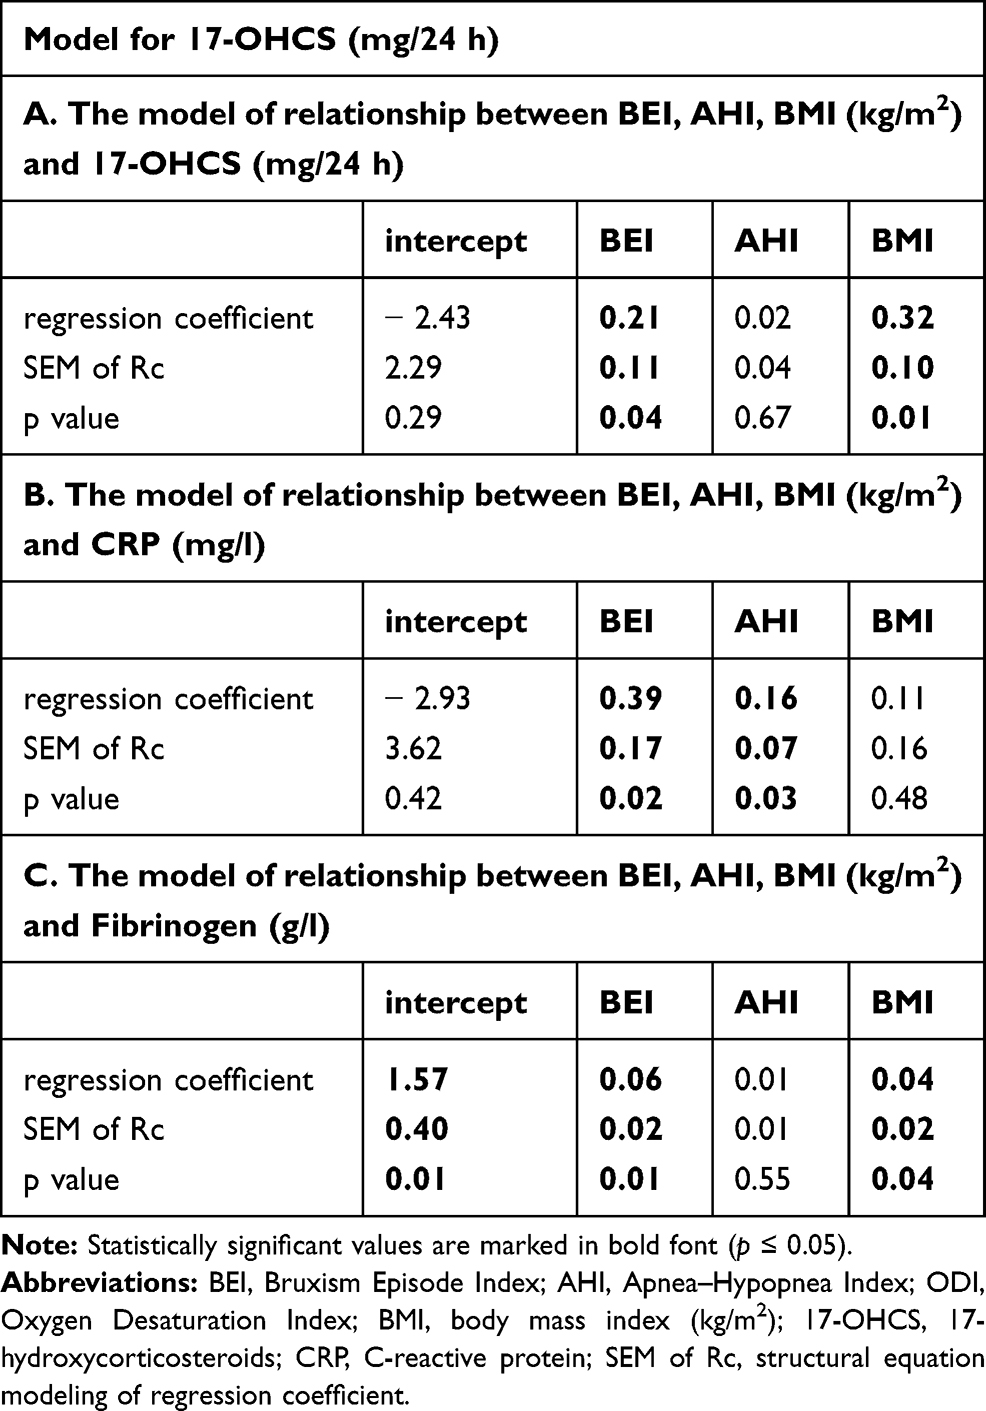 |
Table 6 Results of the Regression Analysis in the Studied Group |
Discussion
The positive correlation between the inflammatory parameters (CRP and fibrinogen) and BEI is one of the most interesting results, which has not been investigated by any study as shown by an extensive review of the available literature. Nevertheless, a large number of published studies have examined several risk factors for SB, including sensitivity to stress11 or anxiety disorders, consumption of caffeine and alcohol, smoking,12 OSA,13,14 diabetes,14 increased BMI, hypertension,15 thyroid diseases, sleepiness, and snoring.17 The association between many foregoing risk factors and inflammatory markers has been previously reported in the literature. However, to date, the association between SB and inflammation remains unclear, and hence, the present paper addresses the need for investigating the inflammatory features of SB in order to bridge the gaps in the scientific literature. The association between stress and inflammatory markers has been well documented,28 which suggests that SB, linked with psychoemotional components (such as emotional stress),11,29,30 may also have an inflammatory etiology.
Some authors have indicated that there is a lack of evidence on the association between SB and stress.31 For instance, a recent study by Ohlmann et al30 could not prove that SB is related to chronic stress and sleep quality. Instead, the available literature indicates that a high level of CRP is associated with an increased risk of adverse health outcomes such as diabetes and CVD.32 This implies that chronic SB is associated with inflammatory markers (as shown by the current study), which leads to increased CV risk. However, several questions about the role of inflammatory markers in SB remain unanswered.
Furthermore, an increased level of CRP was correlated with AHI and other respiratory indices, and the relationship between SB and AHI has been explored in earlier studies,14,33–35 but it is beyond the scope of the present study. A regression analysis was conducted in this study to compare between the SB and OSA subjects. Multivariate regression showed that the relationships between BEI and 17-OHCS, BEI and CRP, as well as BEI and fibrinogen were statistically significant, independent of AHI and BMI. A higher BEI and a higher BMI were independently associated with a higher level of 17-OHCS (mg/24 h), as well as a higher level of fibrinogen (g/l). Moreover, higher BEI and higher AHI were identified as independent predictors of higher CRP (mg/l).
In line with the previous studies,36 an increased concentration of 17-OHCS was found to be a probable response to stress in patients with severe SB, which has been widely discussed in the literature.30,35 In the study performed by Fluerașu et al, the levels of salivary cortisol were tested using the ELISA technique to investigate the impact of stress,35 which were found to be higher in subjects with SB. Smardz et al30 screened SB patients with Perceived Stress Scale-10 and reported that the intensity of SB was not statistically significantly correlated with self-reported perceived stress and depression. The present study was designed to test the urinary excretion rate of 17-OHCS in order to evaluate the stress response. The level of perceived stress reported by SB patients may contrast with the level of stress markers in the studied SB patients, which was confirmed by the results of the laboratory tests. In other words, misperceived stress does not mean a lack of metabolic stress.
This study also verified other potential CV risk factors such as the levels of HDL-C and LDL-C and glucose metabolism. The results showed no statistically significant differences in the plasma lipid measurements with respect to SB between the studied subjects. As relevant studies are not available in the literature, it can be assumed that SB does not affect these CV risk factors.
The analysis of the association between carbohydrate metabolism and SB revealed a positive correlation between phasic episodes and glucose concentration found 2 h after the glucose tolerance test. These results are an extension of the previous report of Martynowicz et al,14 which showed that higher AHI, male gender, and diabetes were independent predictors of increased BEI. However, there is limited evidence on the association between diabetes and bruxism. The results of this study shed new light on phasic SB, which is considered to be predominant,9,37,38 and diabetes. Previous research on the relationship between SB and OSA14 demonstrated the association between hypoxia and SB. One of the interesting questions arising from this finding is: does hypoxia control the blood glucose level? Several theories have been proposed on the association between hyperglycemia and hypoxia in human and animal models, with some focusing on the increased ratio of reduced and oxidized free cytosolic NADc37,39,40 and others analyzing the increased production of free radicals41,42 or the paradoxical protective effects of diabetes and brief periods of hypoxia preceding severe hypoxia in order to attenuate organ damage.43 Broox et al44 also explored this relationship in their study and showed that glucose concentration did not vary in response to acute hypoxia after several hours. An increase in the glucose level due to chronic hypoxia occurred about 3 days later,45 which returned to the normal level after acclimatization.
Another interesting result of the carbohydrate metabolism analysis is that IR (assessed based on the HOMA-IR factor) was diagnosed in 23% (n = 17) of the patients, whereas the mean BMI was normal (22.71 ± 3.83 kg/m2). The risk of IR is significant in patients with a BMI ≥25, which is the cutoff point for the risk of being overweight according to the World Health Organization (WHO).46 OSA, described as nocturnal intermittent hypoxia, has been associated with an increased risk of developing diabetes and IR. The recent study by Perantoni et al45 showed that the mean desaturation duration was significantly associated with IR (r = 0.289, p = 0.047) as well as the total duration of SpO2 desaturation (r = 0.322, p = 0.025). On the other hand, intermittent hypoxia/normoxia training was found to have a positive effect on the reduction of serum glucose concentration in prediabetic patients.47
There is no evidence on the association between SB, hypoxia, and glycemia, which requires additional studies. Apparently, IR is associated with respiratory indices other than SB.
Our results also demonstrated that sleep bruxers exhibited significantly increased sleepiness when assessed by ESS, which is considered as an independent prognostic factor of adverse outcome in patients with sleep disorders. Therefore, we considered this information significant for the assessment of CV risk. The findings observed are directly in line with previous research.48,49 Elevated ESS scores were positively correlated with mixed bruxism episodes, minimal oxygen saturation, and mean heart rate. These support the evidence on the association between SB and autonomic sympathetic activity expressed by tachycardia, which usually precedes a bruxism episode.5 The phasic SB, as a component of mixed episodes, was positively correlated with minimal SatO2 (blood oxygen saturation) in a previous study.14 Hypoxia has been potentially linked with the onset of a bruxism episode, and the relationship between excessive daytime sleepiness, OSA, and hypoxia is well known. According to one of the hypotheses associating SB with OSA, SB restores airway flow during a respiratory event by the protrusion of the mandible.50 As has been previously reported in the literature, patients with severe daytime sleepiness exhibited significantly lower baroreflex sensitivity and higher heart rate variability compared to those who did not show daytime sleepiness.49
Together, the results of this study revealed that daytime sleepiness is associated with an increased number of bruxism episodes and a higher heart rate. However, the extent to which SB can be attributed to autonomic sympathetic activity is unknown.
Overall CV risk is determined by many risk factors. Of these, genetics, family history, and comorbidity of atherosclerotic diseases are classified as modifiable, whereas smoking, high blood pressure, diabetes and IR, physical inactivity, emotional stress, being overweight, inflammatory markers, and high level of blood cholesterol are recognized as modifiable.
A lifetime approach to CVD prevention is to implement lifestyle changes and medical interventions. The associations between neuromodulatory pathways and SB etiology are not clearly described in the available literature, but a recent study by Wieckiewicz et al50 revealed the possible contribution of genes encoding dopamine and serotonin receptors to the etiology of SB. Moreover, the single-nucleotide polymorphism (SNP) that affects both SB and OSA was investigated (HTR2A serotonin receptor-encoding gene, rs2770304 SNP). From this standpoint, the probability of genetic vulnerability to SB and the study’s findings on inflammatory markers emphasize the role of SB in the etiology of unmodifiable and modifiable CV risk factors.
One of the limitations of the present study is the sex ratio. Firstly, there was no sex parity in the study group; women constituted 73% of the examined population. Secondly, to estimate the total CV risk, data on smoking and systolic blood pressure should be included, and a lack of these is an apparent limitation. In addition, children were not included in the study population. Therefore further research among children and adolescent population is needed. A third limitation of the study is that the findings are based only on single-night polysomnography.
However, it is worth mentioning that the study used polysomnography as a diagnostic tool, which is a gold standard for confirming the presence of SB. Moreover, this study is the first to analyze inflammatory markers in SB patients.
The findings of this study signal the need for additional research on the inflammatory features of SB. The aforementioned sympathetic modulatory activity of SB and the relatively young age of sleep bruxers indicate that it is necessary to explore the relationship between potentially increased CV risk and SB.
Conclusion
The present study showed that sleep bruxers exhibited increased sleepiness, as indicated by higher ESS scores. Moreover, patients with SB had metabolic and hormonal disturbances, which were manifested as increased levels of 17-OHCS, CRP, and fibrinogen, probably as a result of stress and sympathetic activity. Importantly, this is the first report to show the relationship between BEI and elevated inflammatory markers. Therefore, further research is needed to support the hypothesis that SB is associated with proinflammatory features or inflammatory etiology. The relationship between SB and disturbances in carbohydrate metabolism is still unclear. However, the results of this study indicated that young sleep bruxers potentially have an increased CV risk and therefore need special targeted prophylaxis and care.
Abbreviations
SB, sleep bruxism; CV risk, cardiovascular risk; BEI, Bruxism Episode Index; CRP, C-reactive protein; BMI, body mass index; CVD, cardiovascular disease; ESS, Epworth Sleepiness Scale; HOMA, Homeostatic Model Assessment; PSG, polysomnogram; EMG, electromyographic; CAD, coronary artery disease; HT, hypertension; IR, insulin resistance; AHI, Apnea–Hypopnea Index; ODI, Oxygen Desaturation Index; OSA, obstructive sleep apnea; MA, mixed apnea; CA, central apnea; SatO2, blood oxygen saturation; mean SpO2, mean oxygen saturation; SpO2 <90%, time with oxygen saturation <90%; TST, total sleep time; ALT, alanine transaminase; AST, aspartate transaminase; GGT, gamma-glutamyltransferase; WBC, white blood cells; RBC, red blood cells; fT3, free triiodothyronine; fT4, thyroxine; TSH, thyroid-stimulating hormone; SL, sleep latency; REML, rapid eye movement stage latency.
Data Sharing Statement
The data that support the findings of this study are available from the corresponding author (MW), upon reasonable request.
Author Contributions
All authors made substantial contributions to conception and design, acquisition of data, or analysis and interpretation of data; took part in drafting the article or revising it critically for important intellectual content; agreed on the journal to which the article will be submitted; gave final approval of the version to be published; and agree to be accountable for all aspects of the work.
Disclosure
The authors report no conflicts of interest in this work.
References
1. Manfredini D, Serra-Negra J, Carboncini F, Lobbezoo F. Current concepts of bruxism. Int J Prosthodont. 2017;30(5):437–438. doi:10.11607/ijp.5210
2. Lobbezoo F, Ahlberg J, Raphael KG, et al. International consensus on the assessment of bruxism: report of a work in progress. J Oral Rehabil. 2018;45(11):837–844. doi:10.1111/joor.12663
3. American Academy of Sleep Medicine. International Classification of Sleep Disorders.
4. Sateia MJ. International classification of sleep disorders-third edition highlights and modifications. Chest. 2014;146(5):1387–1394. doi:10.1378/chest.14-0970
5. Bader G, Lavigne G. Sleep bruxism; an overview of an oromandibular sleep movement disorder. Sleep Med Rev. 2000;4(1):27–43. doi:10.1053/smrv.1999.0070
6. Huynh N, Kato T, Rompré PH, et al. Sleep bruxism is associated to micro-arousals and an increase in cardiac sympathetic activity. J Sleep Res. 2006;15(3):339–346. doi:10.1111/j.1365-2869.2006.00536.x
7. Klasser GD, Rei N, Lavigne GJ. Sleep bruxism etiology: the evolution of a changing paradigm. J Can Dent Assoc (Tor). 2015;81.
8. Lavigne G, Manzini C, Huynh NT. Sleep bruxism. In: Kryger MH, Roth T, Dement WC, editors. Principles and Practice of Sleep Medicine.
9. Lavigne GJ, Kato T, Kolta A, Sessle BJ. Neurobiologicalmechanisms involved in sleep bruxism. Crit Rev Oral Biol Med. 2003;14(1):30–46. doi:10.1177/154411130301400104
10. Lobbezoo F, Ahlberg J, Glaros AG, et al. Bruxism defined and graded: an international consensus. J Oral Rehabil. 2013;40(1):2–4. doi:10.1111/joor.12011
11. Winocur E, Uziel N, Lisha T, Goldsmith C, Eli I. Self-reported bruxism associations with perceived stress, motivation for control, dental anxiety and gagging. J Oral Rehabil. 2011;38(1):3–11. doi:10.1111/j.1365-2842.2010.02118.x
12. Kuhn M, Türp JC. Risk factors for bruxism. Swiss Dent J. 2018;128(2):118–124.
13. Jokubauskas L, Baltrušaitytė A. Relationship between obstructive sleep apnoea syndrome and sleep bruxism: a systematic review. J Oral Rehabil. 2017;44(2):144–153. doi:10.1111/joor.12468
14. Martynowicz H, Gac P, Brzecka A, et al. The relationship between sleep bruxism and obstructive sleep apnea based on polysomnographic findings. J Clin Med. 2019;8(10):1653. doi:10.3390/jcm8101653
15. Martynowicz H, Dymczyk P, Dominiak M, et al. Evaluation of intensity of sleep bruxism in arterial hypertension. J Clin Med. 2018;7(10):327. doi:10.3390/jcm7100327
16. Nashed A, Lanfranchi P, Rompré P, et al. Sleep bruxism is associated with a rise in arterial blood pressure. Sleep. 2012;35(4):529–536. doi:10.5665/sleep.1740
17. Ohayon MM, Li KK, Guilleminault C. Risk factors for sleep bruxism in the general population. Chest. 2001;119(1):53–61. doi:10.1378/chest.119.1.53
18. Piepoli MF, Hoes AW, Agewall S, et al. 2016 European Guidelines on cardiovascular disease prevention in clinical practice. Eur Heart J. 2016;37(29):2315–2381. doi:10.1093/eurheartj/ehw106
19. Last JM, Spasoff RA, Harris SS, Eds. A Dictionary of Epidemiology, Fourth Edition. New York: Oxford University Press. 2001.
20. Conroy RM, Pyörälä K, Fitzgerald AP, et al. Estimation of ten-year risk of fatal cardiovascular disease in Europe: the SCORE project. Eur Heart J. 2003;24(11):987–1003. doi:10.1016/S0195-668X(03)00114-3
21. Si S, Moss JR, Sullivan TR, Newton SS, Stocks NP. Effectiveness of general practice-based health checks: a systematic review and meta-analysis. Br J Gen Pract. 2014;64:618. doi:10.3399/bjgp14X676456
22. Ebrahim S, Taylor F, Ward K, Beswick A, Burke M, Davey Smith G. Multiple risk factor interventions for primary prevention of coronary heart disease. Cochrane Database Syst Rev. 2011;1. doi:10.1002/14651858.CD001561.pub3.
23. Johns MW. A new method for measuring daytime sleepiness: the Epworth sleepiness scale. Sleep. 1991;14(6):540–545. doi:10.1093/sleep/14.6.540
24. Berry RB, Budhiraja R, Gottlieb DJ, et al. Rules for scoring respiratory events in sleep: update of the 2007 AASM manual for the scoring of sleep and associated events. J Clin Sleep Med. 2012;8(5):597–619. doi:10.5664/jcsm.2172
25. Carra MC, Huynh N, Fleury B, Lavigne G. Overview on sleep bruxism for sleep medicine clinicians. Sleep Med Clin. 2015;10(3):375–384. doi:10.1016/j.jsmc.2015.05.005
26. Wirtz PH, von Känel R. Psychological stress, inflammation, and coronary heart disease. Curr Cardiol Rep. 2017;19:11. doi:10.1007/s11886-017-0919-x
27. Abekura H, Tsuboi M, Okura T, Kagawa K, Sadamori S, Akagawa Y. Association between sleep bruxism and stress sensitivity in an experimental psychological stress task. Biomed Res. 2011;32(6):395–399. doi:10.2220/biomedres.32.395
28. Smardz J, Martynowicz H, Wojakowska A, Michalek-Zrabkowska M, Mazur G, Wieckiewicz M. Correlation between sleep bruxism, stress, and depression—a polysomnographic study. J Clin Med. 2019;8(9):1344. doi:10.3390/jcm8091344
29. Pierce CJ, Chrisman K, Bennett ME, Close JM. Stress, anticipatory stress, and psychologic measures related to sleep bruxism. J Orofac Pain. 1995;9(1):51–56.
30. Ohlmann B, Bömicke W, Habibi Y, Rammelsberg P, Schmitter M. Are there associations between sleep bruxism, chronic stress, and sleep quality? J Dent. 2018;74:101–106. doi:10.1016/j.jdent.2018.05.007
31. Patel SR, Zhu X, Storfer-Isser A, et al. Sleep duration and biomarkers of inflammation. Sleep. 2009;32(2):200–204. doi:10.1093/sleep/32.2.200.
32. Saito M, Yamaguchi T, Mikami S, et al. Weak association between sleep bruxism and obstructive sleep apnea. A sleep laboratory study. Sleep Breath. 2016;20(2):703–709. doi:10.1007/s11325-015-1284-x
33. Hosoya H, Kitaura H, Hashimoto T, et al. Relationship between sleep bruxism and sleep respiratory events in patients with obstructive sleep apnea syndrome. Sleep Breath. 2014;18(4):837–844. doi:10.1007/s11325-014-0953-5
34. Seraidarian P, Seraidarian PI, Das Neves Cavalcanti B, Marchini L, Claro Neves AC. Urinary levels of catecholamines among individuals with and without sleep bruxism. Sleep Breath. 2009;13(1):85–88. doi:10.1007/s11325-008-0193-7
35. Fluerașu MI, Bocsan IC, Buduru S, et al. The correlation between sleep bruxism, salivary cortisol, and psychological status in young, Caucasian healthy adults. CRANIO®. 2019:1–7. doi:10.1080/08869634.2019.1619250.
36. Yoshimi H, Sasaguri K, Tamaki K, Sato S. Identification of the occurrence and pattern of masseter muscle activities during sleep using EMG and accelerometer systems. Head Face Med. 2009;5:1. doi:10.1186/1746-160X-5-7
37. Obrosova IG, Stevens MJ, Lang HJ. Diabetes-induced changes in retinal NAD-redox status: pharmacological modulation and implications for pathogenesis of diabetic retinopathy. Pharmacology. 2001;62(3):172–180. doi:10.1159/000056091
38. Tilton RG, Baier LD, Harlow JE, Smith SR, Ostrow E, Williamson JR. Diabetes-induced glomerular dysfunction: links to a more reduced cytosolic ratio of NADH/NAD+. Kidney Int. 1992;41(4):778–788. doi:10.1038/ki.1992.121
39. Baynes JW, Thorpe SR. Role of oxidative stress in diabetic complications: a new perspective on an old paradigm. Diabetes. 1999;48(1):1–9. doi:10.2337/diabetes.48.1.1
40. Zanetti M, Zwacka RM, Engelhardt JF, Katusic ZS, O’Brien T. Superoxide anions and endothelial cell proliferation in normoglycemia and hyperglycemia. Arterioscler Thromb Vasc Biol. 2001;21(2):195–200. doi:10.1161/01.ATV.21.2.195
41. Williamson JR, Ido Y. The Vascular cellular consequences of hyperglycaemia. In: Tooke JE, editor. Diabetic Angiopathy. London: Arnold-Oxford University Press; 1999:161–185.
42. Brooks GA, Butterfield GE, Wolfe RR, et al. Increased dependence on blood glucose after acclimatization to 4300 m. J Appl Physiol. 1991;70(2):919–927. doi:10.1152/jappl.1991.70.2.919
43. Sawhney RC, Malhotra AS, Singh T. Glucoregulatory hormones in man at high altitude. Eur J Appl Physiol Occup Physiol. 1991;62(4):286–291. doi:10.1007/BF00571554
44. World Health Organization based in Geneva, Switzerland. Obesity: preventing and managing the global epidemic. Report of a WHO consultation. World Health Organ Tech Rep Ser. 2000;894:i–253.
45. Perantoni E, Filos D, Archontogeorgis K, Steiropoulos P, Chouvarda IC Pre-diabetic patients with severe obstructive sleep apnea: novel parameters of hypoxia during sleep correlate with insulin resistance.
46. Serebrovska TV, Grib ON, Portnichenko VI, Serebrovska ZO, Egorov E, Shatylo VB. Intermittent hypoxia/hyperoxia versus intermittent hypoxia/normoxia: comparative study in prediabetes. High Alt Med Biol. 2019;20(4):383–391. doi:10.1089/ham.2019.0053
47. Manfredini D, Guarda-Nardini L, Marchese-Ragona R, Lobbezoo F. Theories on possible temporal relationships between sleep bruxism and obstructive sleep apnea events. An expert opinion. Sleep Breath. 2015;19(4):1459–1465. doi:10.1007/s11325-015-1163-5
48. Câmara-Souza MB, de Figueredo OMC, Rodrigues Garcia RCM. Association of sleep bruxism with oral health-related quality of life and sleep quality. Clin Oral Investig. 2019;23(1):245–251. doi:10.1007/s00784-018-2431-0
49. Lombardi C, Parati G, Cortelli P, et al. Daytime sleepiness and neural cardiac modulation in sleep-related breathing disorders. J Sleep Res. 2008;17(3):263–270. doi:10.1111/j.1365-2869.2008.00659.x.
50. Wieckiewicz M, Bogunia-Kubik K, Mazur G, et al. Genetic basis of sleep bruxism and sleep apnea—response to a medical puzzle. Sci Rep. 2020;10(1):1–14. doi:10.1038/s41598-020-64615-y
 © 2020 The Author(s). This work is published and licensed by Dove Medical Press Limited. The
full terms of this license are available at https://www.dovepress.com/terms
and incorporate the Creative Commons Attribution
- Non Commercial (unported, 3.0) License.
By accessing the work you hereby accept the Terms. Non-commercial uses of the work are permitted
without any further permission from Dove Medical Press Limited, provided the work is properly
attributed. For permission for commercial use of this work, please see paragraphs 4.2 and 5 of our Terms.
© 2020 The Author(s). This work is published and licensed by Dove Medical Press Limited. The
full terms of this license are available at https://www.dovepress.com/terms
and incorporate the Creative Commons Attribution
- Non Commercial (unported, 3.0) License.
By accessing the work you hereby accept the Terms. Non-commercial uses of the work are permitted
without any further permission from Dove Medical Press Limited, provided the work is properly
attributed. For permission for commercial use of this work, please see paragraphs 4.2 and 5 of our Terms.