")
Back to Journals » Journal of Hepatocellular Carcinoma » Volume 10
Detection of sFas, sCD137, and IL-27 Cytokines as Potential Biomarkers for Hepatocellular Carcinoma Diagnosis
Authors Do XH, Le MT, Nguyen TH , Le TT, Nguyen XH, Mai TB , Hoang TMN, Than UTT
Received 22 February 2023
Accepted for publication 14 May 2023
Published 26 May 2023 Volume 2023:10 Pages 783—793
DOI https://doi.org/10.2147/JHC.S409649
Checked for plagiarism Yes
Review by Single anonymous peer review
Peer reviewer comments 2
Editor who approved publication: Dr Mohamed Shaker
Xuan-Hai Do,1 Mai Thi Le,2,3 Thu Huyen Nguyen,2 Thanh Thien Le,2 Xuan-Hung Nguyen,2,4 Thanh Binh Mai,5 Thi My Nhung Hoang,3 Uyen Thi Trang Than2
1Department of Practical and Experimental Surgery, Vietnam Military Medical University, Hanoi, Vietnam; 2Center of Applied Sciences, Regenerative Medicine and Advance Technologies, Vinmec Healthcare System, Hanoi, Vietnam; 3Faculty of Biology, VNU University of Science, Vietnam National University, Hanoi, Vietnam; 4College of Health Sciences, VinUniversity, Hanoi, Vietnam; 5Department of Gastroenterology, 108 Military Central Hospital, Hanoi, Vietnam
Correspondence: Uyen Thi Trang Than, 458 Minh Khai, Hai Ba Trung, Hanoi, Vietnam, Tel +84 85662355, Email [email protected]
Purpose: Hepatocellular carcinoma (HCC), a prevalent type of liver cancer, is mainly diagnosed in the advanced stage, leading to a high mortality rate. Recent advances have identified peripheral cytokines as a potential tool to predict disease outcomes and inform therapeutic decisions. Hence, in this study, we aim to build a predictive model for HCC based on serum levels of different cytokines.
Patients and Methods: We used immunoassay to quantify the concentrations of IL-27, MIP-1β, Perforin, sCD137, sFas, and TNF-α in the serum of 38 HCC patients and 15 healthy controls. Logistic regression was then used to construct classification models detecting HCC based on these cytokines. A nomogram of the best-performing model was generated to visualize HCC prediction.
Results: sFas and MIP-1β were found to be significantly higher in HCC patients compared to controls. Predictive models based on cytokine levels combining sFas, sCD137, and IL-27 performed the best in distinguishing HCC patients from healthy controls. This model has a bias-corrected area under the receiver operating characteristic (ROC) curve (AUC) of 0.948, a sensitivity of 92.11%, a specificity of 93.33%, and an accuracy of 0.925.
Conclusion: Our findings suggest that serum cytokines have the potential to be utilized in HCC screening to improve detection rates.
Keywords: hepatocellular carcinoma, cytokines, serum, biomarkers
Introduction
Liver cancer is a global health issue, with 905,700 new cases and 830,200 deaths reported in 2020.1 Hepatocellular carcinoma (HCC), which accounts for 90% of liver cancer cases, has a poor prognosis (5-year survival rate was estimated at 8.37%) due to late detection and a lack of effective treatment.2–4 Notably, the survival of HCC patients largely depends on the disease stage at diagnosis, with early-stage patients having better outcomes (5-year survival rates >70% if treated timely), while advanced-stage patients have limited survival rates (<12.5% after treatment).3–5 Ultrasound imaging is the current standard technology for HCC diagnosis due to its high availability, low cost, and non-invasive nature.6 However, this method is only practical if the tumor is visible, leading to a low HCC early detection rate (27.9%).3,7 Advanced imaging techniques, such as magnetic resonance imaging and computed tomography have been applied in cancer surveillance for high-risk patients, and while more sensitive than ultrasound,8 their widespread adoption remains challenging due to high costs and low sensitivity.6 Hence, developing tools for HCC detection is crucial to improve patient outcomes.
Recently, several molecules have been emerging as potential markers of HCC. For example, alpha-fetoprotein (AFP) is a promising biomarker for HCC due to its low cost, widespread availability, and ease of measurement.6 Additionally, the FDA has approved AFP-L3 (AFP isoform) and des-gamma carboxyprothrombin (DCP) for HCC diagnosis, thanks to their high sensitivity and specificity.3 Indeed, the breakthrough device GALAD using a scoring algorithm based on gender, age, AFP, AFP-L3, and DCP achieves better HCC detection compared to the current standard.9 However, future studies are still needed to evaluate the cost-effectiveness of GALAD before clinical application.10 Studies of protein expression suggest that other novel markers for HCC exist and may further improve HCC detection by providing better performance, shorter detection time, and more accessible assay.11
Particularly, cytokines have also been considered potential biomarkers for cancer diagnosis due to their involvement in different cancer types and stages.12,13 Inflammatory cytokines released by cancer and immune cells can be pro-tumor by inducing chronic inflammation and creating a microenvironment for tumor survival, angiogenesis, and metastasis.14 Meanwhile, anti-inflammatory cytokines inhibit the gene expression and cytokine synthesis of T cells and macrophages and thus are involved in the anti-tumor response.14 These characteristics make serum cytokines versatile biomarkers for cancer detection and treatment outcome prediction.13 A set of several cytokines could provide accurate and specific detection because different cells generate distinct pathogenic cytokines during disease progression.13 Thus, a cytokine-based assay is an attractive approach to developing non-invasive diagnostic tools for widespread screening programs. Indeed, several cytokines have been correlated with HCC progression: sFas, IL-27, and TNF-α are identified as risk factors for HCC,15–17 and MIP-1β is highly expressed in HCC patients.18 Other cytokines have also been suggested to play a role in HCC, as sCD137 is associated with hepatitis C virus (HCV) and alcohol-associated liver cirrhosis,19 and Perforin influences tumor growth and disease progression.20 However, the potential of these cytokines as biomarkers for HCC has not been investigated.
In this study, we measured the concentrations of six cytokines, including IL-27, MIP-1β, Perforin, sCD137, sFas, and TNF-α, in the sera of HCC and healthy subjects and evaluated their diagnostic potentials. A logistic regression model was used, with the combination sFas, sCD137, and IL-27 cytokines performing the best in detecting HCC. Our results demonstrated that these cytokines might serve as diagnostic biomarkers for HCC.
Materials and Methods
Study Design and Ethical Approval
The sample size was calculated using published tools with 5% type I error, 10% marginal error, and 90% sensitivity and specificity.21 The prevalence of disease was extracted from a previous study on the Vietnamese population.22 A total of 53 volunteers participated in this case–control study, with 38 diagnosed with HCC and 15 healthy donors without a medical history of cancer, diabetes, hepatitis, or other infectious diseases. The collection of blood samples and use of clinical data was approved by the Vinmec International General Hospital Joint Stock Company’s ethics committee (Ethical approval number: 120/2022/CN/HĐĐĐ VMEC). All participants provided written informed consent forms prior to the sample and data collection.
Samples Collection
Whole blood samples were collected and stored in a serum blood collection tube (No. 454095, Greiner Bio-One, North America). Samples were processed within eight hours after collection following previously published protocol.23 In brief, the blood was allowed to coagulate for 30 minutes at 37°C prior to being centrifugation at 1000 × g at 4°C for 10 minutes. The supernatant was immediately collected, aliquoted into 0.5 mL Eppendorf tubes, and stored at −80°C downstream cytokine analysis.
Cytokine Quantification
Levels of six cytokines, including IL-27, MIP-1β, Perforin, sFas, sCD137, and TNF-α, were measured using two custom kits HCD8MAG-15K and HTH17MAG-14K (MerckMillipore, Darmstadt, Germany) following manufacturer’s instructions. Briefly, all wells were incubated with beads coated with monoclonal antibodies of six analytes overnight at 4°C. After washing with buffer, a biotinylated secondary antibody was added for one hour, followed by streptavidin conjugated to phycoerythrin for 30 minutes. Unbound reagents were washed, and a reading buffer was added. Results were monitored using LuminexTM 100/200TM system with xPONENT 3.1 software (Minneapolis, MN, USA). The detection ranges for each analyte were sFas: 400–1,650,000 pg/mL, MIP-1β: 7–30,000 pg/mL, TNF-α: 0.5–2000 pg/mL, Perforin: 10–50,000 pg/mL, sCD137: 2–10000 pg/mL and IL-27: 61–250,000 pg/mL. A five-parameters logistic curve was generated using Mycurvefit add-in Excel to construct the standard curve. Samples with concentrations above or below the detection limit were assigned as the highest and lowest values in the concentration threshold, respectively.
Predictive Modeling
Spearman correlations of six cytokines were calculated and used as an orientation for model construction to detect possible multicollinearity. R software (v 4.2.2) was used to generate predictive models of HCC based on the level of cytokines in sera. Logistic regression was used to build classification models using the lrm function and stepwise strategy. In brief, the models were created by selecting a single cytokine as the predictor variable. To determine whether the predictive capability of cytokines could be improved by incorporating other cytokines, two-variable models and three-variable models were analyzed and considered if they had statistically significant with a p-value of all coefficients < 0.05. The diagnostic ability of the generated models was evaluated by the pROC package. ROC curves were created with the true-positive rate (sensitivity) plotted against the false-positive rate (1 – specificity) at different cut-off points.24 AUC values were calculated, with a higher AUC indicating a better discriminative ability. Models with an AUC of 0.7 or higher were considered acceptably predictive and subjected to bootstrap validation and calibration.
The optimal cut-off point value for each model is defined as the cut-off point with the highest accuracy. Each optimal cut-off point corresponds to each sensitivity and specificity value for that model.
Model Correction and Internal Validation
The bootstrap method was employed to create new models (bootstrap model) using resampled datasets. The performance of the bootstrap model was then evaluated on the original dataset, and the difference between the bootstrap and original model performance was calculated to determine the model optimism.25 This procedure was repeated to acquire an optimism-corrected performance estimate. The AUC value and coefficients of the final model were bias-corrected through 5000 bootstrap iterations.
A calibration plot was generated to show the agreement between the predicted values obtained from the model and the actual values observed in the data. Better calibrated models will be closer to the 45-degree line, with a minimum mean squared and absolute error close to 0.
Nomogram Generation
A nomogram is used to map the risk of HCC. The nomogram was generated based on the results of analyses obtained from the best-performing model using the rms package in R. The total points accumulated by the various variates correspond to the predicted probability of HCC for a patient.26
Statistical Analysis
Statistical analysis was performed using GraphPad Prism 8.4.3 (GraphPad, San Diego. CA, USA). The Mann–Whitney Utest was used to compare cytokine concentrations between patient and control groups, and the non-parametric Kruskal–Wallis test was used for comparisons of more than two groups. The p-value < 0.05 was considered statistically significant.
Results
Clinical Characteristics of HCC Patients
The clinical characteristics of 38 HCC patients and 15 controls are summarized in Table 1. The mean age is 63 ± 13.3 for the patient group, with more men (89.5%) than women (10.5%). Of that population, 15.8% were smokers, and 65.8% consumed alcohol. Hepatitis B virus (HBV) and HCV infection rates were 81.6% and 10.5%, respectively, while 7.9% were infected with both HBV and HCV. Regarding cancer stage, there are eight patients in stage A, 22 patients in stage B, six patients in stage C, and two patients in stage D. Among them, nine patients had metastases to spinal, lung, and lymph node metastasis. None of the healthy subjects in this study had either alcohol consumption or smoking, or virus infection. Additionally, the age ranges from 20 to 35, with more females (80%) than males (20%).
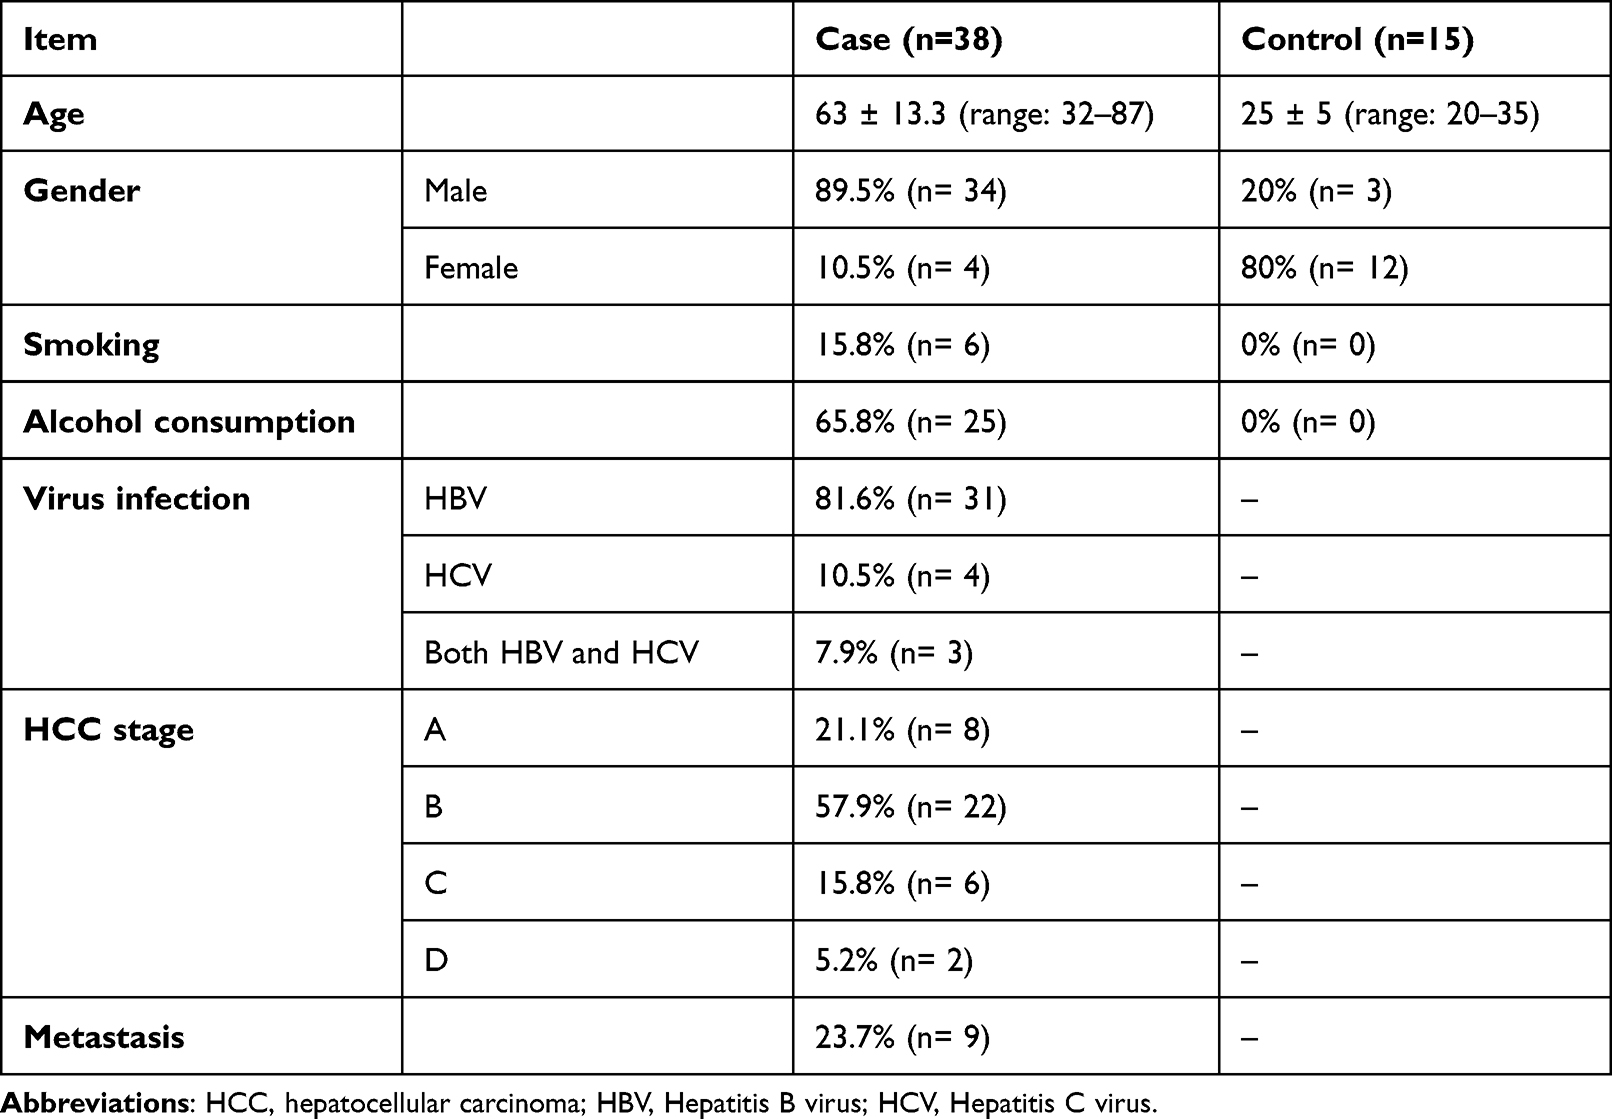 |
Table 1 Participant Characteristics in the Study |
The relationship between clinical parameters (age, gender, alcohol consumption, and smoking) and cytokine levels was examined using the Spearman correlation (Figure S1). In summary, alcohol consumption, age, and gender had a positive correlation with sFas serum levels (r = 0.49, p < 0.0001; r = 0.46, p < 0.001; and r = 0.65, p < 0.0001, respectively), whereas smoking was not found to be correlated with concentrations of all six cytokines (Figure S1). In conclusion, these clinical parameters had no effect on the cytokine concentrations detected in this study.
Cytokine Profiling of Enrolled Patients and Healthy Controls
The levels of six cytokines (IL-27, MIP-1β, Perforin, sFas, sCD137, and TNF-α) in the serum of HCC patients were measured using immunoassay (Figure 1A). All six cytokines were detected in both studied groups. Among them, levels of sFas, MIP1-β, sCD137, and TNF-α were significantly higher in the HCC patients compared to healthy individuals (p < 0.0001, p < 0.0001, p < 0.01, and p < 0.05, respectively). No significant differences were found in the concentrations of IL-27 and Perforin between the two groups. In the HCC patient cohort, sFas expressed the highest concentration (35,805.18 ± 15,606.47 pg/mL, range: 8507.28–76,853.16), followed by IL-27 (14,618.57 ± 56,322.06 pg/mL, range: 61.04–250,000), Perforin (9190.60 ± 6017.496 pg/mL, range: 1187.00–27,038.48), MIP-1β (236.60 ± 123.1485 pg/mL, range: 52.60–633.75), sCD137 (36.42 ± 106.7834 pg/mL, range: 2.44–519.89), and the lowest concentration belongs to TNF-α (26.65 ± 19.26099 pg/mL, range: 0.5–74.26). Notably, among all studied cytokines, sFas concentration was higher in HCC patients at all stages (stage A, stage B, and advanced stages C and D) when compared to healthy subjects (Figure S2).
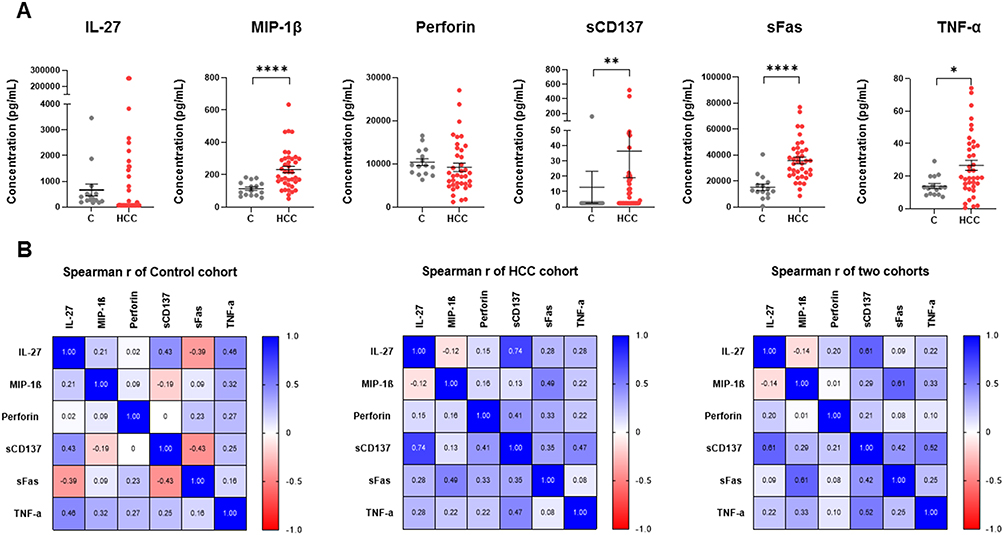 |
Figure 1 Cytokine quantification and Spearman correlation matrix of IL-27, MIP-1β, Perforin, sCD137, sFas, and TNF-α in patients and healthy controls. (A) Expression levels of IL-27, MIP-1β, Perforin, sCD137, sFas, and TNF-α in HCC (red color, n= 38) and healthy (grey color, n= 15) cohorts. Each dot represents an individual. Data were presented as mean ± SEM. *p<0.05, **p<0.01, and ****p<0.0001 (Mann–Whitney U-test). (B) Spearman correlation matrix of six cytokines in each control or HCC cohort and both cohorts. Spearman correlation coefficients (r) range from −1 to 1. The sign of the coefficient represents whether the relationship is positive (+) or negative (-) monotonic. Values closer to 1 (blue) and −1 (red) indicate a stronger correlation than values closer to 0 (white). Abbreviations: C, control; HCC, hepatocellular carcinoma. |
Analysis of Inter-Cytokine Correlation
Inter-cytokine correlation analysis was performed in control, patient and mixed cohorts (Figure 1B). In general, the association between cytokines was stronger in HCC patients compared to the healthy controls. In the control group, the Spearman correlation coefficients (r) of six cytokines were both negative and positive, while in the HCC cohort, most of the coefficients were positive, except for IL-27 and MIP-1β (r = −0.12, p = 0.478). Interestingly, the correlation coefficient between IL-27 and sCD137 was the highest in the HCC (r = 0.74, p < 0.0001). Notably, two HCC patients had the highest levels of both IL-27 and sCD137; both are in stage B, but only one has HBV, while the other is HBV- and HCV-free. This suggests that the elevation in these cytokines levels could be due to unknown factors.
Altogether, Spearman correlation analysis indicated that the concentration of six cytokines was independent of each other in the control and mixed groups, but a strong correlation was observed between sCD137 and IL-27 in the HCC patient group. The correlation results were then further used to select the appropriate regression model that would limit redundancy and potential collaboration between cytokines with similar biological effects.
Predictive Modeling for HCC Incidence and ROC Curve Analysis
In order to avoid bias from the large range of concentrations, we transformed the cytokine concentration to log10. As cytokines are independent of each other in the mixed cohort, a logistic regression was employed to construct the classification model. Firstly, models based on one cytokine were built to present their coefficient value and significance (Figure 2A). A regression coefficient indicates the size and direction of the relationship between a predictor and the response variable. Positive coefficients increase the probability of the event, while negative coefficients decrease it. We found that sFas, MIP-1β, sCD137, and TNF-α were associated positively, Perforin was associated negatively, and IL-27 was not associated with the HCC disease state. sFas was found to have the highest -log10(p-value) and coefficient among the six cytokines (3.30 and 7.92, respectively).
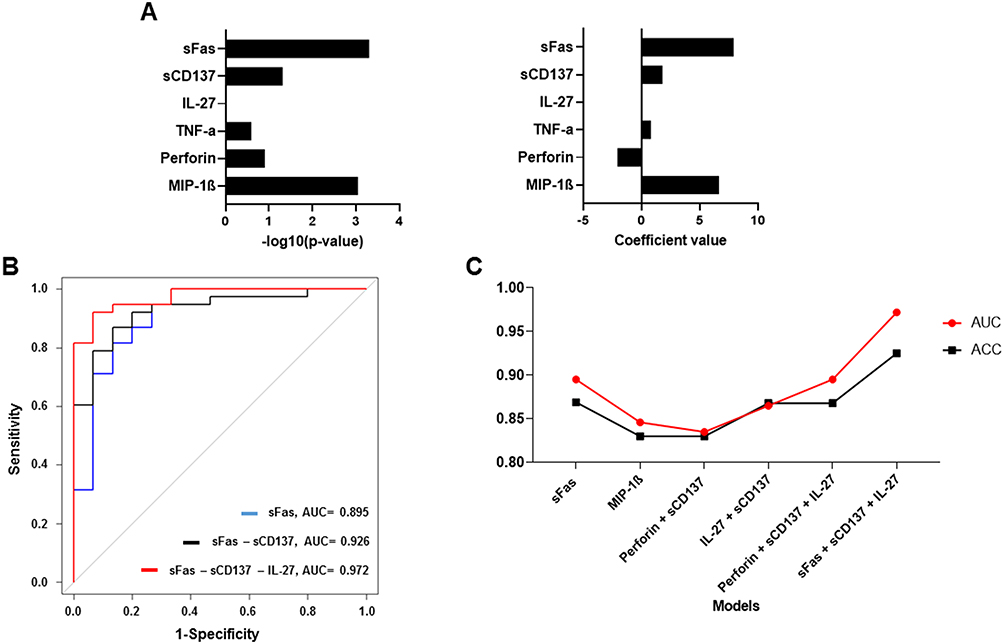 |
Figure 2 Selection of the best predictable model. (A) The bar chart of –log10 (p-value) and the coefficient of six models based on one cytokine. (B) Multiple ROC curves of three models: sFas (blue line), sFas – sCD137 (black line), and sFas – sCD137 – IL-27 (red line). (C) Line graph of ACC (black line) and AUC (red line) of the six statistically significant models. Abbreviations: AUC, area under the curve; ACC, accuracy. |
However, the models with four individual cytokines (which were statistically different between HCC and control groups) had insufficient AUC values (all were smaller than 0.9, Table S1). Thus, we decided to combine each of these cytokines with others to build a more powerful model. Spearman correlation results indicate that we could randomly combine all studied cytokines together without multicollinearity. We then screened through all the combinations and kept the ones with statistically significant coefficients and model tests (p < 0.05). Six models were selected, including sFas, MIP-1β, Perforin-sCD137, sCD137–IL-27, Perforin–sCD137–IL-27, and sFas–sCD137–IL-27 models (Table S2). The model based on three cytokines, sFas, sCD137, and IL-27, demonstrated a higher AUC value compared to the model that only employed sFas and the model that utilized both sFas and sCD137 (Figure 2B). Thus, the inclusion of multiple cytokines can significantly improve the ability to distinguish HCC from healthy individuals. The best-performing model is sFas–sCD137–IL-27, with the highest AUC = 0.972 (Figure 2C). Figure 3A plots logistic regression to estimate the probability of HCC based on sFas, sCD137, and IL-27 levels. With the best cut-off point defined at 0.7559, the model concludes the HCC condition with accuracy (ACC) = 0.925, sensitivity = 92.11%, and specificity = 93.33% (Figure 3A).
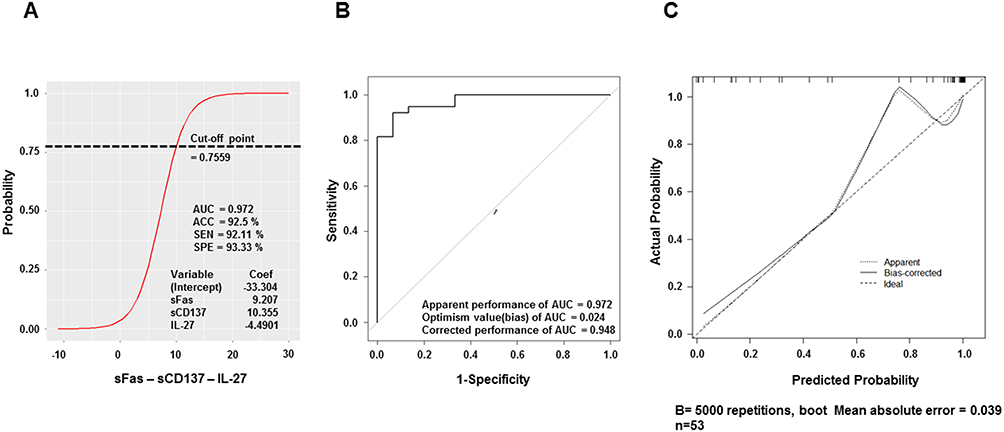 |
Figure 3 Features of the best-performing model: sFas – sCD137 – IL-27. (A) Logistic regression of the best-performing model. (B) ROC curve analysis with bias-corrected AUC of model sFas – sCD137 – IL-27. (C) Calibration plot of the best model. The 45-degree line (“ideal” line) represents a perfect fit between the predicted probability and the observed HCC rate, while the “apparent” line indicates the in-sample calibration. The ideal mean absolute error should be closer to 0 (0 would be perfectly indicating no error). |
Model Validation and Calibration
Although the model has good indexes, when building the model, over-fitting commonly happens, leading to an optimistic estimation of apparent model performance. To minimize this phenomenon, the coefficients of this model were adjusted by multiplying them by the Slope of corrected performance (0.596). After bootstrap validation, the AUC of sFas–sCD137–IL-27 was 0.948 (Figure 3B), still the highest AUC model among the six selected models (Figure S3). The calibration plot was then generated to evaluate how well the probabilistic predictions of a binary classifier were calibrated (Figure 3C). The calibration resulted in a mean absolute error of 0.039, mean squared error of 0.00362, and quantile of absolute error of 0.059, indicating superior calibration compared to the other five models evaluated (Figure S4). All in all, we demonstrated that the model based on serum cytokine levels of sFas, sCD137, and IL-27 could accurately predict HCC in our dataset.
Nomogram Maps the Predicted Probability of the Best-Performing Model
Nomograms are widely used for cancer prognosis due to their ability to condense statistical predictive models into a single numerical estimate of the probability of an event tailored to the individual patient’s profile.27 Nomogram allows integration and synthesis of the relative importance of clinical variables and provides a graphic representation of the odds ratios, p-values, and confidence intervals of logistic regression prediction models.27 The nomograms of HCC diagnosis models generated from sFas–sCD137–IL-27 models are presented in Figure 4. The total points accumulated by three predictors correspond to the anticipated probability of HCC, with higher points meaning a higher probability of cancer.
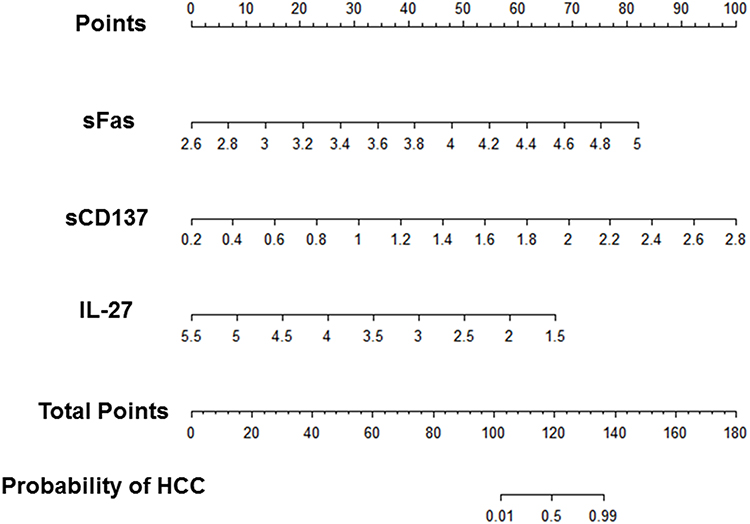 |
Figure 4 Diagnostic nomograms of the best-performing models predicting the probability of HCC. Log10 values of sFas, sCD137, and IL-27 cytokines concentration are equated to points by drawing a straight line to the Points axis. Total points were summed and located on the total point line. Then, a vertical line was projected from the total point line to the predicted probability scale to obtain the patient’s probability of HCC. Abbreviations: HCC, hepatocellular carcinoma. |
Discussion
In this study, serum levels of IL-27, MIP-1β, Perforin, sFas, sCD137, and TNF-α were measured in a cohort of 38 HCC patients and 15 healthy controls. Most cytokines were independent of one another, except for sCD137 and IL-27, which showed a strong correlation in the HCC cohort. From the result, sFas was the most significantly upregulated cytokine in HCC patients; we constructed a model based on the concentrations of sFas, sCD137, and IL-27 to predict HCC status. The model with excellent performance in our cohort (92.11% sensitivity, 93.33% specificity, and AUC of 0.972) was well calibrated and suffered minimal over-fitting. These findings highlight the predictive values of serum cytokines in HCC and implicate cytokine interactions in HCC.
Among the four cytokines that showed significant differences between HCC patients and healthy people, sFas and MIP-1β showed the highest degree of disease-associated elevation, indicating their potential as biomarkers for HCC. MIP-1β has been reported to promote tumor progression by recruiting regulatory T cells and pro-tumorigenic macrophages, facilitating cell proliferation.28 Additionally, elevated levels of MIP-1β were found in the serum of patients with HCC, oral squamous cell carcinoma, and melanoma.12,18,28 On the other hand, sFas, a soluble form of the Fas receptor, can inhibit Fas-mediated apoptosis by neutralizing its ligand.29 The concentration of sFas serves as a valuable tool to discriminate benign ovarian cancer patients and healthy female controls from breast cancer patients.30,31 Moreover, circulating sFas level reflects the severity of breast cancer invasion and is related to the future risk of liver cancer.17,31 In this study, while MIP-1β levels were only significantly higher in HCC stage B, sFas levels were higher at all stages of HCC, making it remarkable in HCC detection. Regarding IL-27, Yuan et al observed that the concentration of serum IL-27 in HCC was significantly higher than that in controls both in the Singapore Chinese Health Study and Shanghai Cohort Study.15 However, our study shows no significant difference in IL-27 levels between the disease and control groups. This discrepancy could be due to our small sample size and/or differences unique to the Vietnamese population. A larger sample size is required to verify the cytokine trends observed in our study.
Serum levels of sCD137 and IL-27 were found to be highly correlated in the HCC cohort. A previous study has demonstrated that agonist antibodies of CD137 on hepatocytes can cause hepatitis via activation and expansion of liver Kupffer cells and monocytes, which produce IL-27.32 In a different context, Glez-Vaz et al reported that anti-CD137 agonists led to an sCD137 increase in mice bearing syngeneic tumors.33 Taken together, serum levels of IL-27 and sCD137 could be synergistically elevated by activating the CD137 signaling pathway to trigger an inflammatory response in liver cancer. This mechanism may be the reason why IL-27 and sCD137 had a positive correlation in our study. However, in order to draw conclusions, further studies are required to investigate the relationship between IL-27 and sCD137 in cancer-related processes.
Next, we created models for HCC detection by incorporating one or combinations of cytokines. The model based on three cytokines sFas, sCD137, and IL-27, had the best performance in differentiating between people with and without HCC. The presence of sFas in the final model is consistent with our hypothesis when observing the high concentration of sFas in HCC patients. Interestingly, although sCD137 has not been previously demonstrated as a marker of liver cancer, sCD137 was secreted by HCC tumors under hypoxic conditions to prevent co-stimulation of T lymphocytes.34 Moreover, a high level of sCD137 was detected in the serum of HCV and alcohol-associated cirrhosis patients, suggesting that sCD137 does play a role in liver pathologies.19
The inclusion of IL-27 in the final model, despite the fact that this molecule was not different in the serum of patients compared to healthy people and that it was already correlated with sCD137 in HCC patients. IL-27 may have a complex and unique role in HCC, distinct from that of sCD137. Previously, IL-27 has been shown to be both pro-tumor and anti-tumor.35 IL-27 directly inhibits proliferation and enhances apoptosis of cancer cells or indirectly exerts anti-tumor effects by targeting the tumor microenvironment.35 On the other hand, reports have suggested that IL-27 can be immunosuppressive by promoting the growth and survival of Treg cells, which support cancer development.15 The results of our study indicate the need for deeper investigations into the roles of cytokines such as IL-27 in HCC. Multi-omics approaches enable the investigations of such mechanisms, where the overexpression of cytokines can be correlated with upstream genetic regulation and downstream functional pathways.36 Understanding the clear causal roles of cytokines in HCC is crucial in advancing our understanding of this disease and their potential application in clinical settings.
While numerous HCC predictive models have been published, most are based on genes rather than cytokines. For example, a diagnostic model based on two exosome-derived genes, MYL6B and THOC2, achieved an AUC of 0.8792 (76% sensitivity and 82% specificity) in The Cancer Genome Atlas cohort and an AUC of 0.9077 (76.95% sensitivity and 85.64% specificity) in International Cancer Genome Consortium cohort.37 Another study by Liu et al found that five apoptosis genes were associated with HCC prognosis, and the model built based on them had an AUC of 0.74.38 A predictive model using the 3 FDA-approved biomarkers (AFP, DCP, and AFP-L3) had an AUC of 0.940 (93.27% sensitivity and 75.93% specificity).39 Our model based on the serum cytokines level of sFas–sCD137–IL-27 performs comparably with an AUC of 0.948, 92.11% sensitivity, 93.33% specificity, and an accuracy of 0.925. However, the small sample size limits the robustness of our current model. Cytokine levels at different stages of HCC were also not evaluated due to insufficient numbers of patients at each stage. In addition, the broader cytokine panel should also be investigated to offer the best cytokine-based detection for HCC. Hence, future studies should aim to increase the sample size, consider a panel of cytokines, and develop more accurate HCC diagnosis models. Such results will support the implementation of cytokines-based detection in clinical settings to significantly improve patient survival and treatment outcomes.
Conclusion
In conclusion, six cytokines, including IL-27, MIP-1β, Perforin, sCD137, sFas, and TNF-α, have been quantified in the serum of Vietnamese HCC patients. MIP-1β and sFas exhibited the most notable increases in HCC patients and could serve as potential biomarkers for HCC diagnosis. The predictive model constructed from sFas, sCD137, and IL-27 showed high accuracy in detecting HCC, supporting the use of cytokines as novel biomarkers for liver cancer diagnosis. However, the study’s small sample size calls for further investigation with a larger patient population to validate the results and enhance the predictive models for clinical applications.
Ethical Approval
The study was conducted in compliance with the Declaration of Helsinki and approved by the Ethical Committee of Vinmec International General Hospital Joint Stock Company (Ethical approval number: 120/2022/CN/HĐĐĐ VMEC).
Informed Consent Statement
Informed consent was obtained from all subjects involved in the study.
Author Contributions
All authors made a significant contribution to the work reported, whether that is in the conception, study design, execution, acquisition of data, analysis and interpretation, or in all these areas; took part in drafting, revising or critically reviewing the article; gave final approval of the version to be published; have agreed on the journal to which the article has been submitted; and agree to be accountable for all aspects of the work.
Disclosure
The authors report no conflicts of interest in this work.
References
1. Rumgay H, Arnold M, Ferlay J, et al. Global burden of primary liver cancer in 2020 and predictions to 2040. J Hepatol. 2022;77(6):1598–1606. doi:10.1016/j.jhep.2022.08.021
2. Llovet J, Kelley R, Villanueva A, et al. Hepatocellular carcinoma. Nat Rev Dis Primers. 2021;7:6. doi:10.1038/s41572-020-00240-3
3. Wang W, Wei C. Advances in the early diagnosis of hepatocellular carcinoma. Genes Dis. 2020;7(3):308–319. doi:10.1016/j.gendis.2020.01.014
4. Sarveazad A, Agah S, Babahajian A, Amini N, Bahardoust M. Predictors of 5 year survival rate in hepatocellular carcinoma patients. J Res Med Sci. 2019;24:86. doi:10.4103/jrms.JRMS_1017_18
5. Tsuchiya N, Sawada Y, Endo I, Saito K, Uemura Y, Nakatsura T. Biomarkers for the early diagnosis of hepatocellular carcinoma. World J Gastroenterol. 2015;21(37):10573–10583. doi:10.3748/wjg.v21.i37.10573
6. Adeniji N, Dhanasekaran R. Current and Emerging Tools for Hepatocellular Carcinoma Surveillance. Hepatol Commun. 2021;5(12):1972–1986. doi:10.1002/hep4.1823
7. Kim SY, An J, Lim Y-S, et al. MRI with liver-specific contrast for surveillance of patients with cirrhosis at high risk of hepatocellular carcinoma. JAMA Oncol. 2017;3(4):456–463. doi:10.1001/jamaoncol.2016.3147
8. Liang Y, Xu F, Guo Y, et al. Diagnostic performance of LI-RADS for MRI and CT detection of HCC: a systematic review and diagnostic meta-analysis. Eur J Radiol. 2021;134:109404. doi:10.1016/j.ejrad.2020.109404
9. Best J, Bilgi H, Heider D, et al. The GALAD scoring algorithm based on AFP, AFP-L3, and DCP significantly improves detection of BCLC early stage hepatocellular carcinoma. Z Gastroenterol. 2016;54(12):1296–1305. doi:10.1055/s-0042-119529
10. Yang JD, Addissie BD, Mara KC, et al. GALAD score for hepatocellular carcinoma detection in comparison with liver ultrasound and proposal of GALADUS score. Cancer Epidemiol Biomarkers Prev. 2019;28(3):531–538. doi:10.1158/1055-9965.EPI-18-0281
11. Pan Y, Chen H, Yu J. Biomarkers in hepatocellular carcinoma: current status and future perspectives. Biomedicines. 2020;8(12):576. doi:10.3390/biomedicines8120576
12. Cesati M, Scatozza F, D’arcangelo D, et al. Investigating serum and tissue expression identified a cytokine/chemokine signature as a highly effective melanoma marker. Cancers. 2020;12(12):3680. doi:10.3390/cancers12123680
13. Kartikasari AER, Huertas CS, Mitchell A, Plebanski M. Tumor-induced inflammatory cytokines and the emerging diagnostic devices for cancer detection and prognosis. Front Oncol. 2021;11:692142. doi:10.3389/fonc.2021.692142
14. Esquivel-Velazquez M, Ostoa-Saloma P, Palacios-Arreola MI, Nava-Castro KE, Castro JI, Morales-Montor J. The role of cytokines in breast cancer development and progression. J Interferon Cytokine Res. 2015;35(1):1–16. doi:10.1089/jir.2014.0026
15. Yuan J-M, Wang Y, Wang R, et al. Serum IL27 in relation to risk of hepatocellular carcinoma in two nested case–control studiesIL27 and HCC. Cancer Epidemiol Biomarkers Prev. 2021;30(2):388–395. doi:10.1158/1055-9965.EPI-20-1081
16. Li H, Wang Y, Zhang M, Hu J, Li Z, Han BJ. The high expression of TNF-α and NF-κB in tumor microenvironment predicts good prognosis of patients with BCLC-0-B hepatocellular carcinoma. Transl Cancer Res. 2019;8(2):532. doi:10.21037/tcr.2019.03.09
17. Adachi Y, Nojima M, Mori M, et al. Serum soluble fas levels and incidence of liver cancer in nested case–control study. Cancer Epidemiol Biomarkers Prev. 2023:OF1–OF6. doi:10.1158/1055-9965.EPI-22-0902
18. Sadeghi M, Lahdou I, Oweira H, et al. Serum levels of chemokines CCL4 and CCL5 in cirrhotic patients indicate the presence of hepatocellular carcinoma. Br J Cancer. 2015;113(5):756–762. doi:10.1038/bjc.2015.227
19. Weigand K, Peschel G, Grimm J, et al. Soluble CD137 is a novel serum marker of liver cirrhosis in patients with hepatitis C and alcohol‐associated disease etiology. Eur J Immunol. 2022;52(4):633–645. doi:10.1002/eji.202149488
20. Rousalova I, Krepela E. Granzyme B-induced apoptosis in cancer cells and its regulation (review). Int J Oncol. 2010;37(6):1361–1378. doi:10.3892/ijo_00000788
21. Akoglu H. User’s guide to sample size estimation in diagnostic accuracy studies. Turk J Emerg Med. 2022;22(4):177–185. doi:10.4103/2452-2473.357348
22. Le VQ, Nguyen VH, Nguyen VH, et al. Epidemiological characteristics of advanced hepatocellular carcinoma in the northern region of Vietnam. Cancer Control. 2019;26(1):1073274819862793. doi:10.1177/1073274819862793
23. Hardy-Werbin M, Rocha P, Arpi O, et al. Serum cytokine levels as predictive biomarkers of benefit from ipilimumab in small cell lung cancer. Oncoimmunology. 2019;8(6):e1593810. doi:10.1080/2162402X.2019.1593810
24. Verbakel JY, Steyerberg EW, Uno H, et al. ROC curves for clinical prediction models part 1. ROC plots showed no added value above the AUC when evaluating the performance of clinical prediction models. Comp Stud. 2020;126:207–216. doi:10.1016/j.jclinepi.2020.01.028
25. Fernandez-Felix B, García-Esquinas E, Muriel A, Royuela A, Zamora JJ. Bootstrap internal validation command for predictive logistic regression models. Stata J. 2021;21(2):498–509. doi:10.1177/1536867X211025836
26. Tomas I, Arias-Bujanda N, Alonso-Sampedro M, et al. Cytokine-based predictive models to estimate the probability of chronic periodontitis: development of diagnostic nomograms. Sci Rep. 2017;7(1):11580. doi:10.1038/s41598-017-06674-2
27. Iasonos A, Schrag D, Raj GV, Panageas KS. How to build and interpret a nomogram for cancer prognosis. J Clin Oncol. 2008;26(8):1364–1370. doi:10.1200/JCO.2007.12.9791
28. Lien MY, Tsai HC, Chang AC, et al. Chemokine CCL4 induces vascular endothelial growth factor C expression and lymphangiogenesis by miR-195-3p in oral squamous cell carcinoma. Front Immunol. 2018;9:412. doi:10.3389/fimmu.2018.00412
29. Ueno T, Toi M, Tominaga T. Circulating soluble Fas concentration in breast cancer patients. Clin Cancer Res. 1999;5(11):3529–3533.
30. Vysotskii MM, Digaeva MA, Kushlinskii NE, et al. Serum sFas, leptin, and VEGF in patients with ovarian cancer and benign tumors. Bull Exp Biol Med. 2009;148(5):810–814. doi:10.1007/s10517-010-0823-5
31. Sheen-Chen SM, Chen HS, Eng HL, Chen WJ. Circulating soluble Fas in patients with breast cancer. World J Surg. 2003;27(1):10–13. doi:10.1007/s00268-002-6378-5
32. Bartkowiak T, Jaiswal AR, Ager CR, et al. Activation of 4-1BB on liver myeloid cells triggers hepatitis via an interleukin-27–dependent pathway. Clin Cancer Res. 2018;24(5):1138–1151. doi:10.1158/1078-0432.CCR-17-1847
33. Glez-Vaz J, Azpilikueta A, Olivera I, et al. Soluble CD137 as a dynamic biomarker to monitor agonist CD137 immunotherapies. J Immunother Cancer. 2022;82(12_Supplement):628. doi:10.1136/jitc-2021-003532
34. Labiano S, Palazón A, Bolanos E, et al. Hypoxia-induced soluble CD137 in malignant cells blocks CD137L-costimulation as an immune escape mechanism. Oncoimmunology. 2016;5(1):e1062967. doi:10.1080/2162402X.2015.1062967
35. Fabbi M, Carbotti G, Ferrini S. Dual Roles of IL-27 in Cancer Biology and Immunotherapy. Mediators Inflamm. 2017;2017:3958069. doi:10.1155/2017/3958069
36. Song Q, Zhu X, Jin L, Chen M, Zhang W, Su J. SMGR: a joint statistical method for integrative analysis of single-cell multi-omics data. NAR Genom Bioinform. 2022;4(3):lqac056. doi:10.1093/nargab/lqac056
37. Zhu J, Tang B, Gao Y, et al. Predictive models for HCC prognosis, recurrence risk, and immune infiltration based on two exosomal genes: MYL6B and THOC2. J Inflamm Res. 2021;14:4089–4109. doi:10.2147/JIR.S315957
38. Liu R, Wang G, Zhang C, Bai D. A prognostic model for hepatocellular carcinoma based on apoptosis-related genes. World J Surg Oncol. 2021;19(1):70. doi:10.1186/s12957-021-02175-9
39. Sato M, Morimoto K, Kajihara S, et al. Machine-learning approach for the development of a novel predictive model for the diagnosis of hepatocellular carcinoma. Sci Rep. 2019;9(1):7704. doi:10.1038/s41598-019-44022-8
 © 2023 The Author(s). This work is published and licensed by Dove Medical Press Limited. The full terms of this license are available at https://www.dovepress.com/terms.php and incorporate the Creative Commons Attribution - Non Commercial (unported, v3.0) License.
By accessing the work you hereby accept the Terms. Non-commercial uses of the work are permitted without any further permission from Dove Medical Press Limited, provided the work is properly attributed. For permission for commercial use of this work, please see paragraphs 4.2 and 5 of our Terms.
© 2023 The Author(s). This work is published and licensed by Dove Medical Press Limited. The full terms of this license are available at https://www.dovepress.com/terms.php and incorporate the Creative Commons Attribution - Non Commercial (unported, v3.0) License.
By accessing the work you hereby accept the Terms. Non-commercial uses of the work are permitted without any further permission from Dove Medical Press Limited, provided the work is properly attributed. For permission for commercial use of this work, please see paragraphs 4.2 and 5 of our Terms.