Back to Journals » International Journal of General Medicine » Volume 15
Detecting Preeclampsia Severity Using Maternal-Obstetrical Characteristics and Complete Blood Cell Counts
Received 17 October 2022
Accepted for publication 18 December 2022
Published 23 December 2022 Volume 2022:15 Pages 8715—8726
DOI https://doi.org/10.2147/IJGM.S392915
Checked for plagiarism Yes
Review by Single anonymous peer review
Peer reviewer comments 3
Editor who approved publication: Prof. Dr. Luca Testarelli
Hsiao-Wen Lu,1,2 Han-Shui Hsu2
1Department of Obstetrics and Gynecology, Cardinal Tien Hospital, New Taipei City, Taiwan; 2Institute of Emergency and Critical Care Medicine, School of Medicine, National Yang Ming Chiao Tung University, Taipei, Taiwan
Correspondence: Han-Shui Hsu, Institute of Emergency and Critical Care Medicine, School of Medicine, National Yang Ming Chiao Tung University, No. 155, Sec. 2, Linong St, Beitou Dist, Taipei, 112, Taiwan, Tel +886-2-22875-7546, Email [email protected]
Purpose: This study aimed to use the combination of maternal-obstetrical characteristics (MOCs) and complete blood cell counts (CBCs) with different red blood cell (RBC) indices as an alternative tool to detect preeclampsia (PE) severity immediately before delivery.
Patients and Methods: This retrospective study included all singleton pregnancies delivered after 24 weeks of gestation from April 2016 to April 2020. Patients were divided into four different groups: non-hypertensive (NH), gestational hypertension (GH), PE, and severe PE (SPE). Univariate and forward stepwise multivariate logistic regression analysis was conducted using MOCs, CBCs, and RBC indices. The calculation was performed between SPE and other non-hypertensive and hypertensive (GH, PE) groups. Moreover, the area under the curve (AUC) for the receiver operating characteristic curve, sensitivity, and specificity were estimated.
Results: The combined variables for differentiating SPE from NH were maternal age > 29.5 years, weight > 27.24, gestational age < 272 days at the time of blood withdrawal, platelet count < 217.5× 10³/μL, Srivastava indices < 6.35, and Siradah indices < 43.02 (AUC, 0.834; 95% confidence interval [CI], 0.773– 0.895). The combined variables for differentiating SPE from GH were maternal age > 29.5 years, body mass index > 25.28, gestational age < 268.5 days at the time of blood withdrawal, mean corpuscular volume < 78.85 fL, and platelet count < 234.5× 10³/μL (AUC, 0777; 95% CI, 0.703– 0.852). The combined variables for differentiating SPE from PE were maternal age > 32.5 years, mean corpuscular hemoglobin concentration > 34.55 g/dL, and Siradah indices < 40.05 (AUC, 0.745; 95% CI, 0.656– 0.833).
Conclusion: The combination of selected variables from MOCs and CBCs with RBC indices before delivery showed satisfactory results for detecting PE severity.
Keywords: hypertension, pregnancy, preeclampsia, preeclampsia severity, complete blood counts
Introduction
The progression of preeclampsia (PE) severity is subtle and unpredictable Severe features of the PE (SPE) may represent the most critical form of hypertension during pregnancy and can result in maternal and fetal complications or mortality if not immediately treated.1 Several methods focus on early trimester screening, such as those of angiogenic factors or biomarkers.2,3 However, the recent pandemic outbreaks and the isolation policies hindered blood pressure tracking throughout prenatal visits.4 Therefore, more emphasis has been placed on instant treatment or management protocols for the sudden incidence of previously undetected SPE.5 The urge to recognize SPE further emphasizes the importance of the Committee Opinion of the American College of Obstetricians and Gynecologists (ACOG) in 2019. The ACOG recommended that antihypertensive treatment be initiated within 30–60 min of systolic blood pressure (SBP) exceeding 160 mmHg or diastolic blood pressure (DBP) exceeding 110 mmHg.6
The current guideline for immediately diagnosing preeclampsia severity depends mainly on blood pressure levels and proteinuria,7 which wavered its accuracy. Several reasons support this apprehension of blood pressure assessment during pregnancy, including the measurement technique, maternal position, labor pain, wrong cuff size, food intake, white coat syndrome, and many other factors.8,9 Proteinuria accuracy may also be influenced by many factors, such as dehydration and stress during pregnancy.10 In this regard, alternative predictive tools have been designed to improve the accuracy of diagnosis of the severity of preeclampsia.11,12
Our study was focused on hypertensive pregnancies immediately before delivery that corresponds well with those without routine prenatal visits during the pandemic. In order to adapt to the recent change in ACOG treatment guidelines and the wavering blood pressure or proteinuria accuracy, we aimed to use an efficient alternative method of combining maternal-obstetrical characteristics (MOCs) and complete blood cell counts (CBCs) with different red blood cell (RBC) indices13 to evaluate and further confirm PE severity immediately.
Materials and Methods
Study Design and Setting
This retrospective cohort study was conducted at the Cardinal Tien Hospital, a regional teaching hospital in Taiwan. The corresponding data from April 1, 2016, to April 30, 2020, were retrieved from electronic medical records or delivery report books, manually recorded according to the patient chart identification number, and revised twice by two reviewers before being included. This study was conducted following the provisions outlined in the Declaration of Helsinki and was approved by the Institutional Review Board of the Cardinal Tien Hospital (approval number: CTH-109-3-5-019). Patient rights were protected during the collection of medical records, and all personal identifiers were anonymized prior to analysis.
Participants and Variables
The population comprised singleton pregnancies delivered at gestational age (GA) more than 24 weeks. The exclusion criteria were as follows: patients with precipitated labor, missing values, maternal body mass index (BMI) >40, maternal pre-existing hematological and oncological diseases that may affect the hematological profile, active infection or fever at the time of blood collection, blood transfusion within two weeks of current pregnancy, drug abuse, fetal anomaly, fetal death, and maternal death.
The total population was categorized into four different groups: non-hypertensive (NH), gestational hypertension (GH), PE, and SPE (Figure 1). The diagnosis of PE was based on the criteria of the ACOG guidelines for hypertension during pregnancy (Supplementary Table 1). Gestational hypertension is defined as SBP ≥140 mmHg or DBP ≥90 mmHg. Preeclampsia is defined as SBP ≥140 mmHg or DBP ≥90 mmHg with urinary protein ≥300 mg/24 h, protein-to-creatinine ratio ≥0.3, or dipstick ≥2+ or, in the absence of proteinuria with thrombocytopenia, renal insufficiency (creatinine >1.1 mg/dL or doubling), liver dysfunction (liver transaminase level twice that of the normal range), pulmonary edema, new-onset headache unresponsive to medication, or visual symptoms. Severe PE is defined as SBP ≥160 mmHg or DBP ≥110 mmHg, with symptoms similar to PE.7
 |
Figure 1 Flow diagram of the total population. |
Data Measurement and Study Size
The hematology tests, blood pressure, and urine protein are routinely performed in our hospital at the time of admission for delivery according to our hospital’s healthcare policy. Before recording the blood pressure, the delivery ward nurses measure the blood pressure twice with a 4-h interval if the blood pressure is higher than 140/90 mmHg (for either SBP or DBP). For severely elevated blood pressure (either SBP >160 mmHg or DBP >110 mmHg), measurements are performed twice within 30 min. All measurements are performed according to the ACOG guidelines.
The collection of MOCs included maternal age, weight, height, GA at delivery, the status of pregestational diabetes, previous uterine surgery, parity, the number of abortions, epidural analgesia use, delivery mode, and meconium staining after membrane rupture. In addition, newborn characteristics were recorded, including birth weight, height, 1-min APGAR score, 5-min APGAR score, and whether the newborn was admitted to the neonatal intensive care unit. The CBC included white blood cells, RBCs, hemoglobin, hematocrit, mean corpuscular volume (MCV), mean corpuscular hemoglobin, mean corpuscular hemoglobin concentration (MCHC), and platelet count. The different RBC indices were calculated according to individual formulas listed in Supplementary Table 2.13
Statistical Analyses
All statistical analyses were performed using IBM SPSS Statistics for Macintosh version 27.0 (IBM Corp., Armonk, NY, USA). Data normality was analyzed using the Kolmogorov–Smirnov test. For continuous data, the Kruskal–Wallis test and the Mann–Whitney U-test were used for multiple group comparison and binary group comparison for baseline characteristics, respectively. The calculation was analyzed between SPE and PE, GH, and NH, with all data presented as medians (interquartile ranges). Categorical data were analyzed using Pearson’s chi-squared test. All the statistical significance was set at p<0.05. Univariate and multivariate logistic regression models were used to test all variables in MOCs and CBCs with RBC indices to predict SPE based on NP, GH, and PE, respectively. The forward stepwise multivariate logistic regression analysis was calculated using univariate logistic models with p<0.10. The area under the curve (AUC) for the receiver operating characteristic curve was used to analyze the cut-off value selected by the Youden index for each variable of MOCs, CBCs, and RBC indices in each binary group comparison, with the sensitivity and specificity noted. The final predictive value combining all probabilities of significant variables from the MOCs, CBCs, and RBC indices was calculated with AUC and the sensitivity and specificity for each comparison group.
Results
The total number of participants was 1874 after the exclusion, including those with NH (n=1556), GH (n=188), PE (n=83), and SPE (n=47). The population, exclusion criteria, and sample size for each group are shown in Figure 1. The general MOCs and newborn characteristics with CBCs and RBC indices are presented in Table 1. Multiple group comparisons showed that the SPE group had significantly higher maternal age, BMI, and RBC levels than the other groups. On the other hand, the SPE group had a significantly lower GA at the time of blood withdrawal, Mentzer, Srivastava, and Ehsani RBC indices. The pairwise comparisons performed in each variable between SPE and other groups are also shown in Table 1. The result revealed that the NH and SPE groups show significant differences in pregestational diabetic status, APGAR score in the first minutes, the newborn’s weight, RBC, MCV, platelet counts, and all RBC indices except Shine and Lal. Comparison between the GH and SPE groups showed a significant difference in the MCV, platelet count, Mentzer, Siradah, and Ehsani RBC indices. The MCHC, platelet count, and Siradah RBC indices significantly differed between the PE and SPE groups (Table 1).
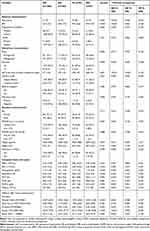 |
Table 1 Maternal-Obstetrical and Newborn Characteristics and Complete Blood Cell Counts |
SPE and NH
The univariate and forward stepwise multivariate logistic regression comparison results for the MOC, CBC, and RBC indices variables between SPE and NH are shown in Table 2. The forward stepwise multivariate logistic regression model showed that maternal age, BMI, GA at the time of blood withdrawal, platelet, Srivastava, and Siradah RBC indices were significant. However, the greatest odds ratio (OR) observed was for the Srivastava RBC indices before delivery (2.479; 95% CI, 1.214–5.062, p=0.013), and the smallest OR observed was for GA at the time of blood withdrawal (0.962; 95% CI, 0.940–0.985, p=0.002).
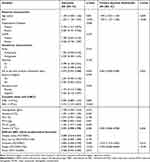 |
Table 2 Comparison of Maternal-Obstetrical Characteristics and Complete Blood Cell Indices Between Severe Preeclampsia and Non-Hypertensive Patients |
SPE and Hypertensive Pregnancy (GH and PE)
The forward stepwise multivariate logistic regression was performed between SPE and other hypertensive groups (GH and PE) for comparisons (Tables 3 and 4). The maternal age, BMI, GA at the time of blood withdrawal, MCV, and platelet count were significantly different between SPE and GH. Simultaneously, a comparison between SPE and PE showed that maternal age, MCHC, and Siradah RBC indices were significantly different. The greatest OR of 1.116 (95% CI, 1.026–1.213) was observed when comparing SPE to GH for maternal BMI and a lower OR of 0.928 (95% CI, 0.890–0.966) was observed with the same comparison for GA at the time of blood withdrawal. On the other hand, the highest OR of 1.568 (95% CI, 1.153–2.181) was for the MCHC level, and the lowest OR of 0.898 (95% CI, 0.837–0.964) was for Siradah RBC indices when comparing SPE to PE.
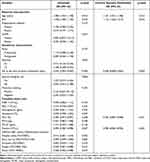 |
Table 3 Comparison of Maternal-Obstetrical Characteristics and Complete Blood Cell Indices Between Severe Preeclampsia and Gestational Hypertension |
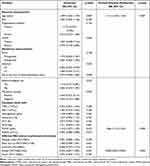 |
Table 4 Comparison of Maternal-Obstetrical Characteristics and Complete Blood Cell Indices Between Severe Preeclampsia and Preeclampsia |
Diagnostic Accuracy
The AUC which was performed on the significant variables (p<0.05) in the forward stepwise multivariate logistic regression analysis for each binary group comparison between SPE, and others is summarized in Table 5. The AUC for SPE prediction from NH was 0.834 (95% CI, 0.773–0.895) for the combined variables from MOCs, CBCs, and RBC indices. The AUC for the combined variables was 0.777 (95% CI, 0.703–0.852) for the prediction of SPE from GH and 0.745 (95% CI, 0.656–0.833) for the prediction of SPE from PE. The cut-off values for each significant variable of MOCs and CBCs are shown in Table 6.
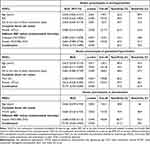 |
Table 5 The Area Under the Curve for Maternal-Fetal Characteristics and Complete Blood Cell Counts in Each Binary Group Comparison |
 |
Table 6 Cut-off Values from the Significant Variables in Maternal-Obstetrical Characteristics and Complete Blood Cell Counts for Each Severity Comparison Groups |
Discussion
Principal Findings
This study showed that combining MOCs, CBCs, and RBC indices can efficiently differentiate SPE from hypertension (PE and GH groups) and NH groups. An AUC value is considered acceptable when it is greater than 0.7, and values between 0.8 and 1.0 represent excellent diagnostic potential. The AUC values in our study for distinguishing SPE from NH, PE, and GH were 0.83, 0.78, and 0.75, respectively. Thus, combining certain variables from MOCs, CBCs, and RBC indices can effectively predict PE severity. The following metrics can be used:
- To differentiate between SPE and PE (sensitivity, 78.7%; specificity, 61.2%): maternal age >32.5 years, MCHC >34.55 g/dL, and Siradah index <40.5
- To differentiate between SPE and GH (sensitivity, 65.9%; specificity, 77%): maternal age >29.5 years, BMI>25.28, GA <268.5 days at blood withdrawal, MCV <78.85 fL, and platelet count <234.5×10³/μL
- To differentiate between SPE and NH (sensitivity, 70.5%; specificity, 84.3%): maternal age >29.5 years, BMI>27.24, GA <272 days at blood withdrawal, platelet count <217.5×10³/μL, Srivastava index <6.35, and Siradah index <43.02
Comparison with Other Studies in the Literature
Some studies have relied purely on CBCs to predict PE, such as Kirabas et al14 and Örgül et al,15 who mainly analyzed the early-trimester CBCs. Both studies differ from ours since we have compared the CBCs and RBC indices obtained just before delivery (late trimester). Jeon et al16 used modified CBCs from the late trimester to differentiate between PE and GH; however, our study was able to define metrics that differentiate SPE from PE, GH, or NH. Recently, Bulbul et al17 analyzed CBC metrics for differentiation between SPE and NH in each trimester. Similarly, they only compared NH with SPE, whereas our study also compared hypertension (PE and GH) with SPE. In addition, their CBC parameters are quite different from ours because they did not include RBC or MCV or different RBC indices, which were significant predictors of SPE in our study. Many studies have been conducted on the neutrophil-to-lymphocyte ratio, platelet-to-lymphocyte ratio, and platelet-to-neutrophil ratio in PE.18–20 Our study utilized pure CBCs and different RBC indices from calculation without differential counts because they may be affected by a calibration reference error or lipidemia.21,22 Maternal characteristics have also been used to predict PE alone or in combination with other serum markers.23,24 Overall, our study is the first to use different RBC indices in comparison. On the contrary, most studies used RBC or RBC volume distribution width (RDW) to detect PE. We used a combination of MOCs with CBCs and RBC indices to evaluate SPE from other groups.25,26
Clinical Implications
Blood pressure screening in the early trimester is critical in diagnosing preeclampsia and its severity. However, due to the recent pandemic outbreak, routine prenatal visits or regular blood pressure monitoring are impeded by quarantine or isolation policy.27 Concerning this, unpredicted hypertensive or preeclamptic pregnancy cases have emerged,28 implying that more alternative or adjunctive diagnostic methods are needed. Due to the recent guideline of immediate treatment for severe preeclampsia, a rapid and efficient method of detecting this is also crucial. All of the above can be answered by our study, which uses the simple method of combing the MOCs, CBCs, and RBC indices to detect preeclampsia severity. Furthermore, solely relying on blood pressure measurement to determine PE severity may be challenging and sometimes may bring about over or under-treatment.29 A recent expert review has stated that many factors would affect blood pressure during the peripartum period.9 Therefore, much other literature has brought about alternative predicting methods that use biomarkers and angiogenic factors that have shown promising results in predicting early trimester PE;30,31 however, each has shortcomings regarding clinical implications and availability. A fluorescence immunoassay device takes 7–14 days to process the diagnostic results for this test; therefore, it is neither simple nor efficient.32 Markers such as this can be used to screen for PE but are not rapid enough to detect sudden-onset late SPE. Our method of combining MOCs, CBCs, and RBC indices which are measured in the late trimester is easy to comprehend and interpret by almost all physicians in different specialties and allows multidisciplinary cooperation without delay. Moreover, it is much more cost-effective than other biomarkers or angiogenic factors. All the above statements support that our detection method addresses the clinical ambiguity on whether to continue antihypertensive agents or initiate magnesium sulfate during emergency treatment. Considering that several drugs have side effects on pregnancy, over-treatment or under-treatment should be avoided.33,34 The implication of using the combination of variables from MOCs, CBCs, and RBCs indices is also applicable and available in every healthcare institution.
Strengths and Limitations
The strength of our study is that we characterized PE severity based on the comparison of SPE with NH and hypertension (PE and GH). In contrast to previous studies that only used a single parameter to measure the accuracy of diagnosis, we combined the MOCs, CBCs, and RBC indices parameters to increase the diagnostic accuracy.
This study had some limitations. First, it was a retrospective study, and some missing data or maternal clinical symptoms could not be included or obtained. Second, this study only analyzed data from a single hospital. In the future, we may propose a prospective study to reduce the incidence of missing data, expand the research to include multiple hospitals, and include patients’ clinical features in the design.
Conclusion
Although all efforts are aimed at introducing alternative or adjunctive methods for predicting PE, there is a need for a simple and easily performed method. In an event of SPE crisis or emergency, time is the most crucial factor. We need the diagnostic studies that can instantly obtain results and are comprehensible by physicians in every field are vital. Our study revealed that complex biomarkers for assessing PE severity are unnecessary, as simple MOCs and blood cell parameters can easily achieve this.
Acknowledgments
We thank Dr. Lu Sung-Kuei for his valuable and constructive suggestions during the planning and development of this study. We also acknowledge the work of Tsai Yi-Chun, a nurse, for her assistance in the study.
Author Contributions
All authors made significant contributions to the work reported, whether that is in the conception, study design, execution, acquisition of data, analysis and interpretation, or in all these areas; took part in drafting, revising or critically reviewing the article, and gave final approval of the version to be published. Further, all authors have agreed on the journal to which the article has been submitted and agree to be accountable for all aspects of the work.
Funding
There is no funding to report.
Disclosure
The authors report no conflicts of interest in this work.
References
1. Carter EB, Conner SN, Cahill AG., et al. Impact of fetal growth on pregnancy outcomes in women with severe preeclampsia. Pregnancy Hypertens. 2017;8:21–25. doi:10.1016/j.preghy.2017.02.002
2. Lim S, Li W, Kemper J, et al. Biomarkers and the prediction of adverse outcomes in preeclampsia: a systematic review and meta-analysis. Obstet Gynecol. 2021;137(1):72–81. doi:10.1097/AOG.0000000000004149
3. Duhig KE, Myers J, Seed PT, et al. Placental growth factor testing to assess women with suspected pre-eclampsia: a multicentre, pragmatic, stepped-wedge cluster-randomised controlled trial. Lancet. 2019;393:1807–1818. doi:10.1016/S0140-6736(18)33212-4
4. Goyal M, Singh P, Singh K, et al. The effect of the COVID-19 pandemic on maternal health due to delay in seeking health care: experience from a tertiary center. Int J Gynaecol Obstet. 2021;152(2):231–235. doi:10.1002/ijgo.13457
5. Dymara-Konopka W, Laskowska M, Oleszczuk J. Preeclampsia – current management and future approach. Curr Pharm Biotechnol. 2018;19:786–796. doi:10.2174/1389201019666180925120109
6. ACOG Committee Opinion. No. 767: emergent therapy for acute-onset, severe hypertension during pregnancy and the postpartum period. Obstet Gynecol. 2019;133:e174–e180. doi:10.1097/AOG.0000000000003075
7. Practice Bulletin ACOG. No. 202: gestational hypertension and preeclampsia. Obstet Gynecol. 2019;133:485.
8. Saccò M, Meschi M, Regolisti G, et al. The relationship between blood pressure and pain. J Clin Hypertens. 2013;15(8):600–605. doi:10.1111/jch.12145
9. Hurrell A, Webster L, Chappell LC, Shennan AH. The assessment of blood pressure in pregnant women: pitfalls and novel approaches. Am J Obstet Gynecol. 2022;226(2S):S804–S818. doi:10.1016/j.ajog.2020.10.026
10. Carroll MF, Temte JL. Proteinuria in adults: a diagnostic approach. Am Fam Physician. 2000;62(6):1333–1340.
11. Jhee JH, Lee S, Park Y, et al. Prediction model development of late-onset preeclampsia using machine learning-based methods. PLoS One. 2019;14(8):e0221202. doi:10.1371/journal.pone.0221202
12. Snell KIE, Allotey J, Smuk M, et al. External validation of prognostic models predicting pre-eclampsia: individual participant data meta-analysis. BMC Med. 2020;18(1):302. doi:10.1186/s12916-020-01766-9
13. Vehapoglu A, Ozgurhan G, Demir AD, et al. Hematological indices for differential diagnosis of Beta thalassemia trait and iron deficiency anemia. Anemia. 2014:576738. doi:10.1155/2014/576738
14. Kirbas A, Ersoy AO, Daglar K, et al. Prediction of preeclampsia by first trimester combined test and simple complete blood count parameters. J Clin Diagn Res. 2015;9:QC20–QC23. doi:10.7860/JCDR/2015/15397.6833
15. Örgül G, Aydın Haklı D, Özten G, et al. First trimester complete blood cell indices in early and late onset preeclampsia. Turk J Obstet Gynecol. 2019;16:112–117. doi:10.4274/tjod.galenos.2019.93708
16. Jeon Y, Lee WI, Kang SY, et al. Modified complete blood count indices as predicting markers of preeclampsia from gestational hypertension: neutrophil to lymphocyte ratio, platelet to lymphocyte ratio, and platelet to neutrophil ratio. Clin Lab. 2017;63:1897–1902. doi:10.7754/Clin.Lab.2017.170705
17. Bulbul M, Uckardes F, Karacor T, et al. Can complete blood count parameters that change according to trimester in pregnancy be used to predict severe preeclampsia? J Obstet Gynaecol. 2021;41:1192–1198. doi:10.1080/01443615.2020.1854697
18. Yavuzcan A, Cağlar M, Ustün Y, et al. Mean platelet volume, neutrophil-lymphocyte ratio and platelet-lymphocyte ratio in severe preeclampsia. Ginekol Pol. 2014;85:197–203. doi:10.17772/gp/1713
19. Zheng WF, Zhan J, Chen A, et al. Diagnostic value of neutrophil-lymphocyte ratio in preeclampsia: a PRISMA-compliant systematic review and meta-analysis. Medicine. 2019;98:e18496. doi:10.1097/MD.0000000000018496
20. Wang Q, Ma J, Jiang Z, et al. Prognostic value of neutrophil-to-lymphocyte ratio and platelet-to-lymphocyte ratio in acute pulmonary embolism: a systematic review and meta-analysis. Int Angiol. 2018;37:4–11. doi:10.23736/S0392-9590.17.03848-2
21. Westengard J, Bull BS. Avoiding regression analysis pitfalls when calibrating white blood cell differential counters. Lab Hematol. 2004;10:137–143. doi:10.1532/LH96.04028
22. Er TK, Ginés MA, Chen YT, et al. Erroneous result of white blood cell differential count in a patient with mixed hyperlipidemia. Clin Chem Lab Med. 2008;46:1054–1055. doi:10.1515/CCLM.2008.193
23. Boutin A, Gasse C, Demers S, et al. Maternal characteristics for the prediction of preeclampsia in nulliparous women: the Great Obstetrical Syndromes (GOS) study. J Obstet Gynaecol Can. 2018;40(5):572–578. doi:10.1016/j.jogc.2017.07.025
24. Kim YR, Jung I, Heo SJ, et al. A preeclampsia risk prediction model based on maternal characteristics and serum markers in twin pregnancy. J Matern Fetal Neonatal Med. 2021;34(21):3623–3628. doi:10.1080/14767058.2019.1686757
25. Adam I, Mutabingwa TK, Malik EM. Red cell distribution width and preeclampsia: a systematic review and meta-analysis. Clin Hypertens. 2019;25(1):15. doi:10.1186/s40885-019-0119-7
26. Csiszar B, Galos G, Funke S, et al. Peripartum Investigation of Red Blood Cell Properties in Women Diagnosed with Early-Onset Preeclampsia. Cells. 2021;10(10):2714. doi:10.3390/cells10102714
27. Dawes M, Beerman S, Gelfer M, et al. The challenges of measuring blood pressure during COVID-19: how to integrate and support home blood pressure measurements. Can Fam Physician. 2021;67(2):112–113. doi:10.46747/cfp.6702112
28. Guida JP, Cecatti JG, Souza RT, et al. Preeclampsia among women with COVID-19 during pregnancy and its impact on maternal and perinatal outcomes: results from a national multicenter study on COVID in Brazil, the REBRACO initiative. Pregnancy Hypertens. 2022;28:168–173. doi:10.1016/j.preghy.2022.05.005
29. Kallioinen N, Hill A, Horswill MS, et al. Sources of inaccuracy in the measurement of adult patients’ resting blood pressure in clinical settings: a systematic review. J Hypertens. 2017;35:421–441. doi:10.1097/HJH.0000000000001197
30. Stepan H, Hund M, Andraczek T. Combining biomarkers to predict pregnancy complications and redefine preeclampsia: the angiogenic-placental syndrome. Hypertension. 2020;75(4):918–926. doi:10.1161/HYPERTENSIONAHA.119.13763
31. Verlohren S, Brennecke SP, Galindo A, et al. Clinical interpretation and implementation of the sFlt-1/PlGF ratio in the prediction, diagnosis and management of preeclampsia. Pregnancy Hypertens. 2022;27:42–50. doi:10.1016/j.preghy.2021.12.003
32. Frampton GK, Jones J, Rose M, et al. Placental growth factor (alone or in combination with soluble fms-like tyrosine kinase 1) as an aid to the assessment of women with suspected pre-eclampsia: systematic review and economic analysis. Health Technol Assess. 2016;20:1–160.
33. Khedun SM, Maharaj B, Moodley J. Effects of antihypertensive drugs on the unborn child: what is known, and how should this influence prescribing? Paediatr Drugs. 2000;2:419–436. doi:10.2165/00128072-200002060-00002
34. Smith JM, Lowe RF, Fullerton J, et al. An integrative review of the side effects related to the use of magnesium sulfate for pre-eclampsia and eclampsia management. BMC Pregnancy Childbirth. 2013;13(1):34. doi:10.1186/1471-2393-13-34
 © 2022 The Author(s). This work is published and licensed by Dove Medical Press Limited. The full terms of this license are available at https://www.dovepress.com/terms.php and incorporate the Creative Commons Attribution - Non Commercial (unported, v3.0) License.
By accessing the work you hereby accept the Terms. Non-commercial uses of the work are permitted without any further permission from Dove Medical Press Limited, provided the work is properly attributed. For permission for commercial use of this work, please see paragraphs 4.2 and 5 of our Terms.
