Back to Journals » Journal of Pain Research » Volume 15
Deciphering the Causal Relationships Between Low Back Pain Complications, Metabolic Factors, and Comorbidities
Authors Tarabeih N ![]() , Kalinkovich A, Shalata A, Cherny SS
, Kalinkovich A, Shalata A, Cherny SS ![]() , Livshits G
, Livshits G
Received 13 November 2021
Accepted for publication 23 December 2021
Published 29 January 2022 Volume 2022:15 Pages 215—227
DOI https://doi.org/10.2147/JPR.S349251
Checked for plagiarism Yes
Review by Single anonymous peer review
Peer reviewer comments 2
Editor who approved publication: Dr Houman Danesh
Nader Tarabeih,1,2 Alexander Kalinkovich,1 Adel Shalata,3 Stacey S Cherny,1 Gregory Livshits1,4
1Department of Anatomy and Anthropology, Sackler Faculty of Medicine, Tel-Aviv University, Tel-Aviv, Israel; 2Maale HaCarmel Mental Health Center, Affiliated to Rappaport Faculty of Medicine Technion, Israel Institute of Technology, Haifa, Israel; 3The Simon Winter Institute for Human Genetics, Bnai Zion Medical Center, The Ruth and Bruce Rappaport Faculty of Medicine, Technion, Haifa, Israel; 4Adelson School of Medicine, Ariel University, Ariel, Israel
Correspondence: Gregory Livshits
Department of Morphological Studies, Adelson School of Medicine, Ariel University, Ariel, 40700, Israel
, Tel +972-3-6409494
, Fax +972-3-6408287
, Email [email protected]
Purpose: Low back pain (LBP) is one of the major disabling health conditions in aging societies presenting significant cost burdens to health and social care systems. Its complications and associated disability are often accompanied by mental disorders, metabolic comorbidities, changed body composition, and inflammation. However, their mutual relationships in LBP-associated disability remain unclear.
Methods: In the present case-control study, a self-report validated questionnaire was used to collect LBP disability data in an ethnically homogeneous Israeli Arab sample (489 males and 589 females). Body composition parameters were assessed through bioelectrical impedance analysis and plasma levels of soluble markers by EISA. Comorbidity status was assessed in personal interview and from the individual medical files.
Results: Our mixed multiple regression analysis identified that GDF-15 (β = 0.160, p = 2.95× 10⁻⁸), vaspin (β = 0.085, p = 0.003), follistatin (β = 0.076, p = 0.001), extracellular water (β = 0.096, p = 0.001), waist hip ratio (β = 0.072, p = 0.009), mental disorders (β = 0.077, p = 0.001), and metabolic comorbidities (β = 0.059, p = 0.02) were significantly associated with LBP disability scores, when controlling for age and sex effects. Additive Bayesian network modelling further suggests that LBP disability appears to be directly influenced by age, sex, GDF-15, and extracellular water, and indirectly by mental and metabolic disorders, waist-hip ratio, and follistatin. LBP, in turn, seems to affect the vaspin levels directly.
Conclusion: Our data suggest the existence of a complex, age-associated, and probably hierarchical, relationship between LBP disability and mental and metabolic disorders, inflammation-related soluble markers, and body composition parameters.
Keywords: low back pain, disability, GDF-15, follistatin, vaspin, body composition, depression, comorbidities
Introduction
Chronic musculoskeletal pain (MSP) is a widespread degenerative condition that often causes physical disability, particularly in elderly.1 The rate of MSP in adult populations is frequently examined, with a focus on three commonly reported pain disorders: shoulder pain, low back pain (LBP) and fibromyalgia.2 LBP is among the most disabling musculoskeletal conditions,3 causing severe long-term pain and physical disability with lifetime prevalence reaching up to 80%, and has an annual prevalence ranging from 25% to 60% in different ethnic groups.4 The incidence and prevalence of LBP is higher in women and strongly increases with age.5
Accumulating evidence indicates that LBP severity and resulting disability are frequently associated with mental disorders, such as depression and schizophrenia.6–11 Although the reasons for this association are poorly understood, some somatic comorbidities, including metabolic disorders, such as obesity, type-2 diabetes (T2DM), hyperlipidemia, and cardiovascular diseases, especially hypertension, were repeatedly suggested as the factors linking mental and musculoskeletal pain conditions.12–15 Nevertheless, the causal relationships between mental disorders and somatic diseases, including musculoskeletal pain, remain unclear despite decades of research.16–18
LBP is a multifactorial condition, affected by a variety of intrinsic and extrinsic factors. For example, association of LBP with body composition parameters, in particular with fat mass, has been repeatedly reported.19–21 Numerous studies, including our own, demonstrated a close association of several soluble factors, mainly pro-inflammatory cytokines and adipokines, with LBP disability and body composition parameters.22–26 For example, we have recently reported that plasma levels of growth and differentiation factor 15 (GDF-15), a protein belonging to the transforming growth factor beta (TGFβ) superfamily of cytokines, are significantly associated with LBP-related phenotypes, independently of age, sex, and body composition.25 GDF-15 is involved in various inflammation-mediated conditions and metabolic diseases.24,27,28 Moreover, GDF-15 plasma levels were found to be elevated in psychosis and bipolar disorder.29–31 We also recently reported that circulating levels of visceral adipose tissue-derived serine protease inhibitor (vaspin) are significantly associated with LBP severity and disability.26 In human subjects, vaspin was previously found to be negatively associated with obesity, waist and hip circumferences, systolic and diastolic blood pressure, duration of diabetes, cardiovascular diseases, and bone loss, serving as a protective factor for all these conditions.32–34
Another molecule, which attracted our attention, is follistatin, a glycoprotein, known for its ability to antagonize actions of several members of the TGFβ molecules, such as myostatin and activin A.35 Follistatin promotes skeletal muscle hypertrophy,36 prevents cartilage formation, postnatal bone metabolism, and fracture healing,37,38 and participates in the development of metabolic disorders.39–41
The major aim of the present study was to evaluate the extent to which LBP-caused disability is associated with the combined effect of GDF-15, follistatin, and vaspin, and body composition characteristics, controlling for age. As progression of mental disorders is often associated with body composition changes and metabolic comorbidities, such as T2DM, hyperlipidemia, and hypertension, we were also interested in whether mental disorders and the metabolic comorbidities are associated with worsening of the LBP disability. Finally, bearing in mind the potential practical significance of the results obtained, we attempted to uncover the possible causal network underlying the relationships among all these variables.
Materials and Methods
Study Design and Population
This project was originally designed as a case-control, community-based, cross-sectional study. To both diminish the genetic heterogeneity of the sample and enrich the sample for familial LBP cases, LBP-affected (cases) and non-affected (control) individuals were the members of one of 98 nuclear and more complex three-generation families. The data were collected from 1078 individuals, with age ranging from 18 to 80 years old, in outpatient clinics located in the city of Sakhnin, Northern District, Israel, from January 2014 to January 2019, constituting an ethnically Arab population living for generations in this area. This population is characterized by a demographically stable structure with traditional relations between family members who share very similar ecologic, socio-economic, and lifestyle conditions, with access to modern medical facilities. The inclusion criteria were as follows: the families were selected via a proband (<45 years of age) who was previously diagnosed with LBP by a physician, confirmed by an orthopedist, and had at least one first-degree relative diagnosed with a similar LBP condition. The exclusion criteria included: (1) fracture or surgery in the spine within the past 2 years; (2) pregnancy; (3) severe heart problems; (4) and/or being under the age of 18. The unaffected members (with no LBP symptomatology) from the same family were considered as the control group.
Subjects were assessed by certified and experienced nurses in accordance with our detailed protocol. Each participating individual filled out the Roland–Morris Disability Questionnaire (RMDQ),42 described below, and provided basic demographic data. Blood samples, anthropometric measurements, and body composition measurements (using bioimpedance, BIA) were also taken from each individual. In addition, comorbidity status was assessed in personal interview and from the individual medical files. Blood samples were used to assay plasma concentrations of biochemical factors relevant to this study. All participants were informed about the aim and protocol of the study and gave written informed consent. This research was approved by the IRB-Helsinki Committee (Number: 042/2013K, Date: 04.11.2013) of the Meir Medical Center, Kfar Saba, Israel, and the Ethics Committee of Tel Aviv University, Tel Aviv, Israel.
Roland–Morris Low Back Pain and Disability Questionnaire (RMDQ) -Assessment
RMDQ is one of the most commonly used questionnaires designed to assess self-rated physical disability caused by LBP.43 This assessment generates a functional impairment score. The method yields reliable measures of disability and has been used in several studies of LBP.44,45 The RMDQ includes 24 items related to behaviors which can be affected by LBP. Each item is qualified with the phrase “because of my back pain” to ensure that the problem is due to back pain.45 The RMDQ score is calculated by as a simple sum of the number of items endorsed. The scores range from 0 to 24, with higher scores indicating greater levels of disability. The Arabic version of the RMDQ was validated.46 The original distribution of the disability scores in our sample deviated substantially from normality and therefore was log-transformed to diminish the extent of the deviation. This score was considered as an indicator of LBP disability in the present study, and was examined as a quantitative continuous phenotype.
Anthropometric and Body Composition Assessment
Anthropometric measurements included body height (cm), weight (kg), and waist and hip circumferences (cm). These measurements were used to calculate body mass index (BMI) in kg/m2 and waist-to-hip ratio (WHR). Body composition was assessed by the BIA method using the BIA101 device (Akern Bioresearch, Italy).47 BIA is a technique to estimate body compositions based on differences in electrical conductive properties of various tissues. It measures the impedance of oppositions to the flow of an electric current through body fluids contained mainly in lean body tissues. This analyzer measures body composition using a constant high-frequency current (50kHz, 90µA). Each pair of adhesive skin electrodes is placed on the hand and foot on one side, typically the right side of the body, and connected to the instrument by an electrode cable set, with the subject in supine position.48 BIA is a safe, reliable, simple, accurate, and inexpensive method to assess a variety of body composition parameters.49 Importantly, its accuracy is comparable to the DXA method, while avoiding exposure to any radiation.47 We used this device for evaluation of the following body composition parameters: fat mass (FM), skeletal muscle mass (SMM) in kilograms, and extracellular water (ECW) and intracellular water (ICW) in liters, which the BIA derives from the impedance vector. ECW and ICW were selected because of their fundamental physiological significance.50 As body mass components are strongly inter-correlated and depend on body weight, they were examined as ratios to body weight; ie, FM/W and SMM/W. Details on the BIA technology have been published recently elsewhere.25
Medical History and Mental Health Comorbidity
The comorbidities in the entire sample of 1078 individuals were captured in two ways. First, all subjects were asked to identify any medical conditions for which they received treatment in 2014–2016. Second, for those subjected who consented to provide us access to their medical records, we used that data as well. When differences in the patterns were found between the two sources, the data from the medical records were used in the analysis. In the present sample, 69 individuals were diagnosed with mental disorders, of which 59 individuals suffered from chronic depression/anxiety and 10 individuals had schizophrenia. Information on hyperlipidemia, hypertension, and T2DM was also available in the medical files. Metabolic comorbidity conditions were collapsed to five groups: those without any comorbidity, those with hyperlipidemia, those with hypertension, those with T2DM, and those with hyperlipidemia, hypertension, and T2DM as HLD+HTN+T2DM.
Soluble Biomarker Analysis
Plasma levels of GDF-15, follistatin, and vaspin were detected by ELISA using DuoSet kits (R&D Systems, Minneapolis, MN, USA), as previously described.25,26 Due to significant deviation of the respective distributions from normality assumptions, the original measurements were subjected to a log transformation and standardized prior to analysis.
Statistical Analysis
Statistical analysis of the data was conducted using Statistica 64 (TIBCO Software, Version 13.5), and R (R Foundation for Statistical Computing, Vienna, Austria, Version 4.0.2). The first stage of the analysis included identification of the major potential predictors from each group of variables, body composition, soluble markers, and comorbidity, using ANOVA/ANCOVA and correlation analyses, with adjustment for age and sex. Next, the best potential predictors of LBP disability scores were simultaneously examined in a linear mixed model, allowing for familial correlations based on degree of kinship. We used the kinship2 package for R to generate kinship matrices within families for use with the relmatLmer function for quantitative dependent variables in the R package lme4qtl.51,52 The mixed multiple regression analysis was conducted in two ways. First, each group of variables (soluble markers and body composition measurements, and comorbidity) was examined in separate analyses, simultaneously adjusting for age and sex differences. Second, the variables that were significant in this first set of analyses were then tested simultaneously in the final mixed multiple regression analysis.
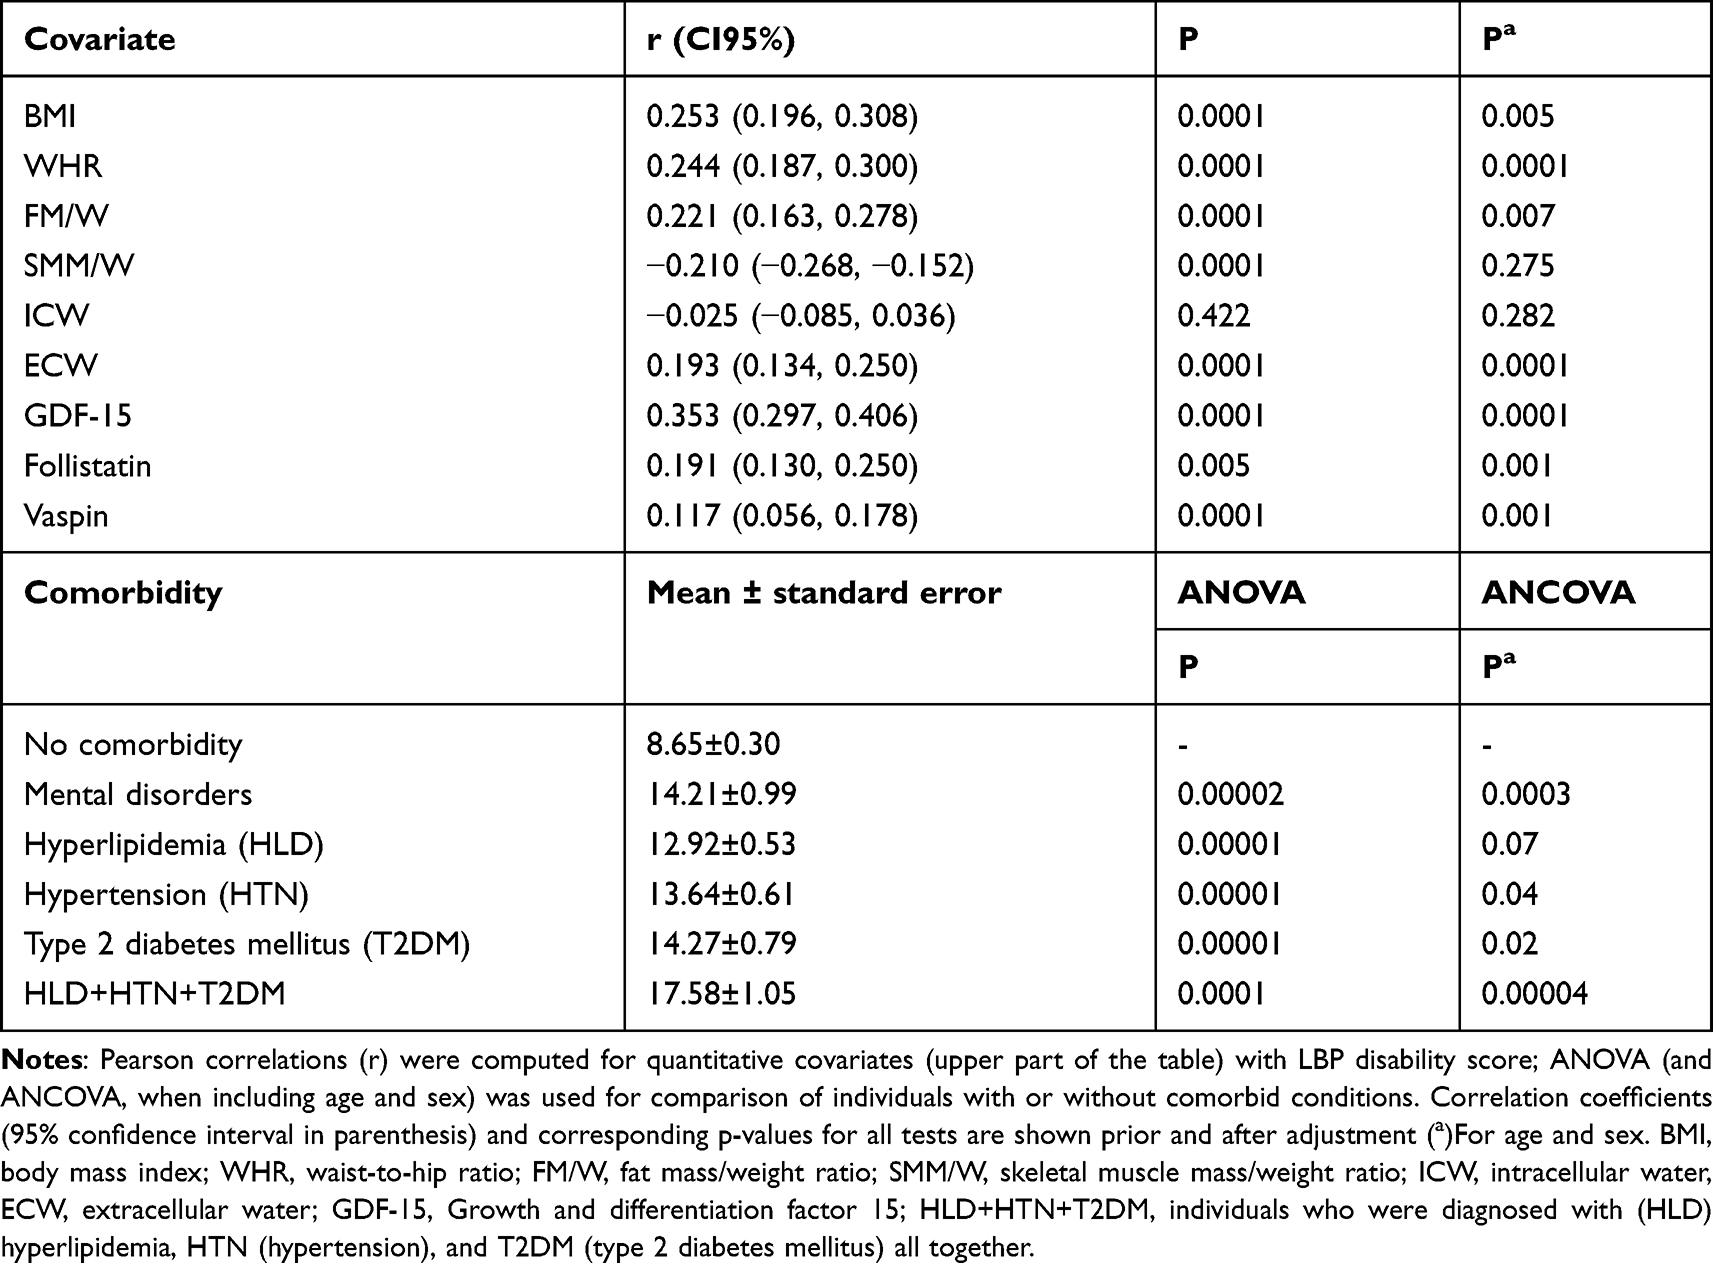 |
Table 1 Correlations with, and Analysis of Variance of, LBP Disability Scores |
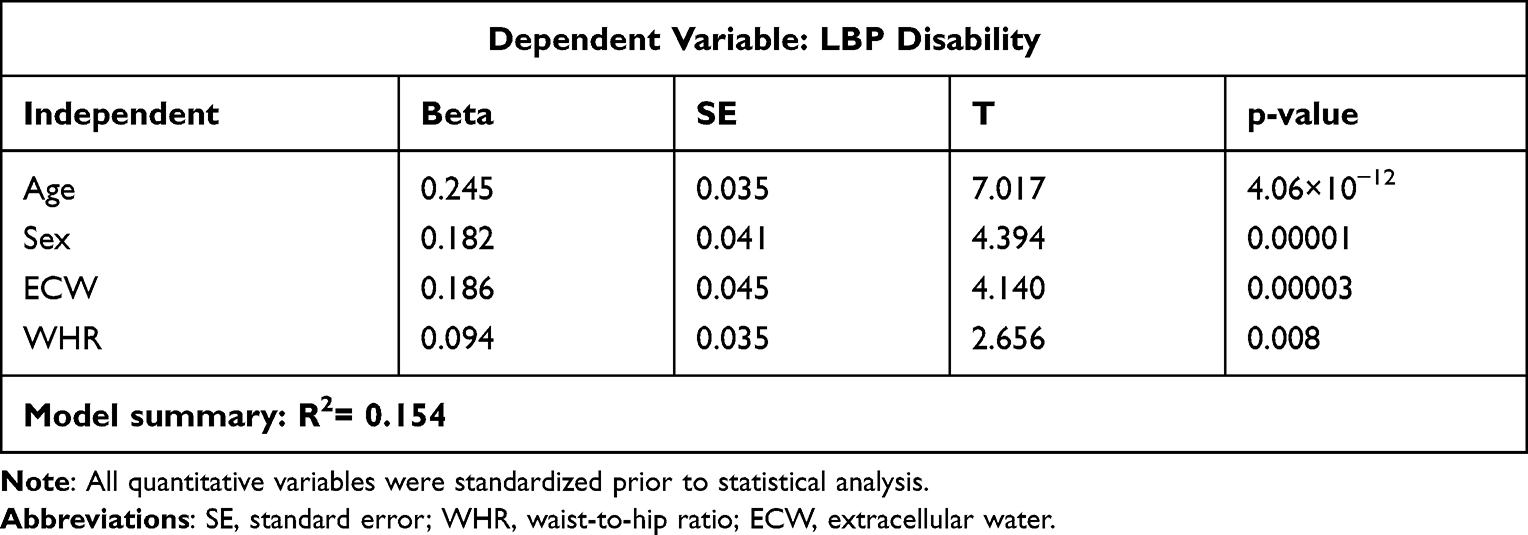 |
Table 2 Mixed-Model Linear Regression Analysis of Body Composition Measurements and LBP Disability |
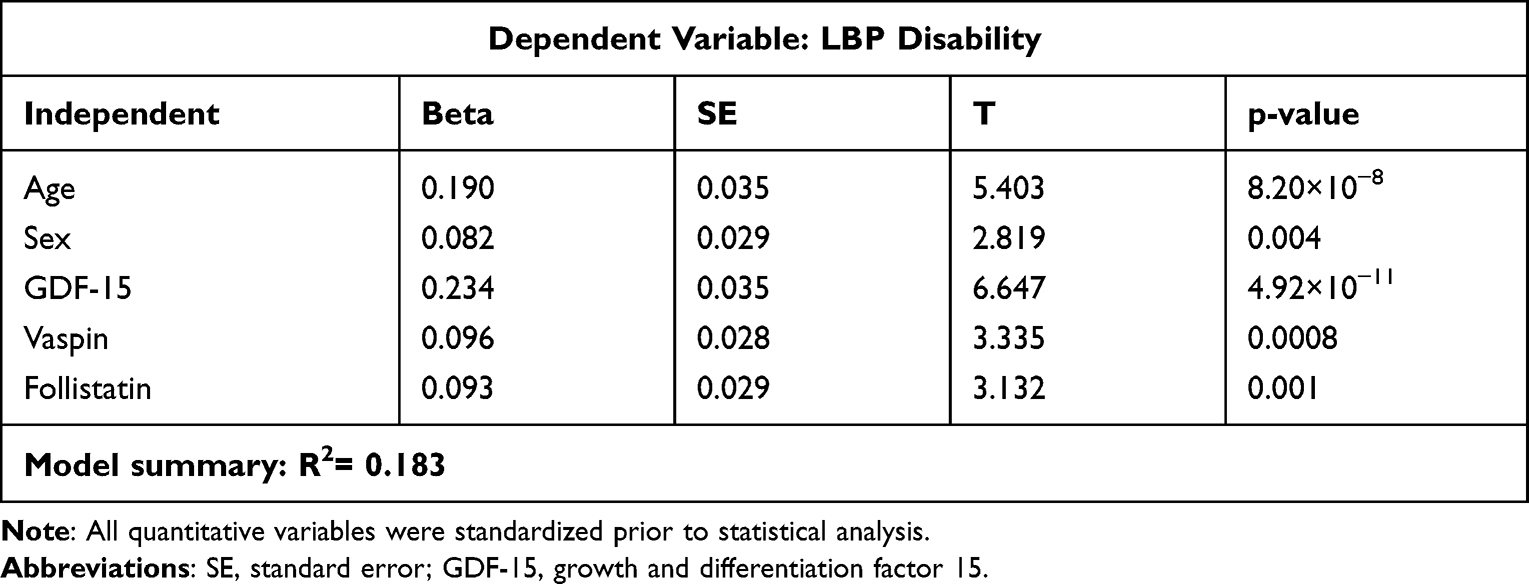 |
Table 3 Mixed-Model Linear Regression Analysis of Soluble Markers’ Plasma Levels and LBP Disability |
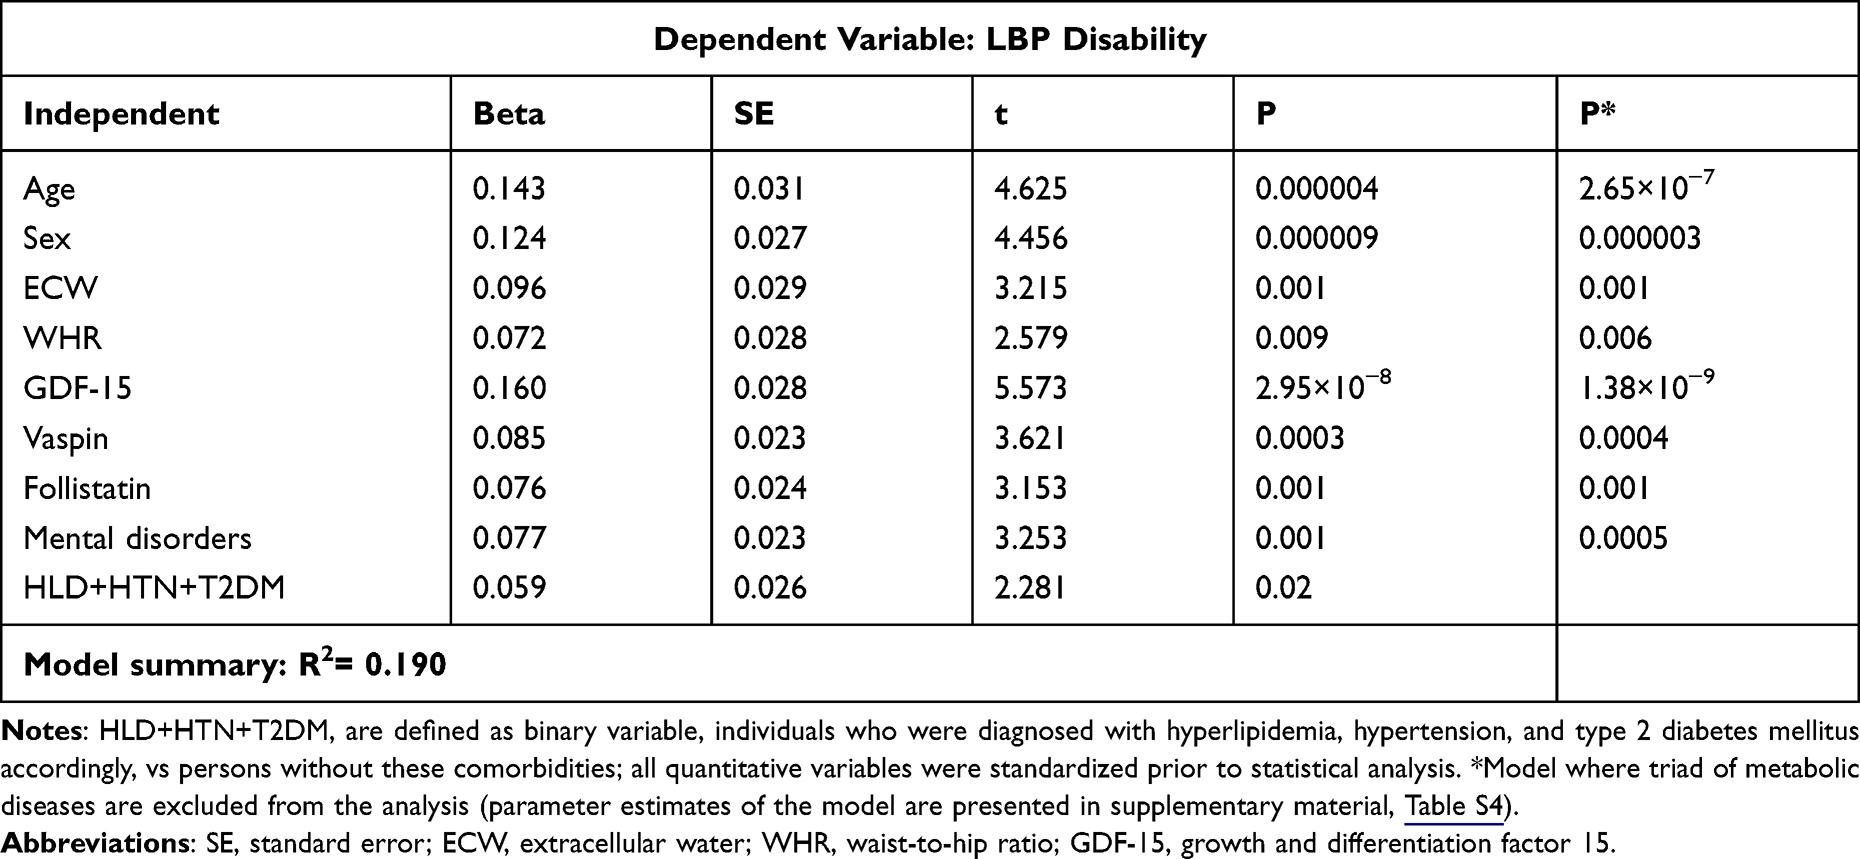 |
Table 4 Mixed-Model Linear Regression Analysis Exploring Relationships Between Significant Covariates and LBP Disability |
Finally, in an attempt to explore the underlying causal structure for the variables examined, we used additive Bayesian network models,53 as implemented in the R package ABN, version 2.3,54,55 with JAGS software, version 4.3.0 to simulate data for correcting for overfitting.56 ABN modelling is a data-driven, exploratory, statistical method for uncovering causation among a set of variables which are correlated and is ideally suited for hypothesis generation when there is little theoretical basis for predicting the causal structure. By effectively performing a search of all possible causal relationships linking a set of variables, provided they constitute a directed acyclic graph (DAG), where no causal loops are present, a model of the causal structure can be inferred without the need for making strong prior assumptions. This model shows which variables directly cause which other variables. These links are referred to as arcs in DAG terminology, and the parameter estimates corresponding to the arcs are analogous to coefficients in a multiple linear regression. While ABN modelling does not require making any causal assumptions, if there are strong theoretical reasons for making assumptions, they should be made and they will aid in finding the best model. We therefore did not permit causal arcs that were theoretically nonsensical. Our restrictions were: (1) sex was not permitted to be caused by any other variable, (2) age at testing could not be caused by any other variable except sex, (3) mental illness was not allowed to be caused by any variables other than age or sex, and (4) the outcome variable, LBP disability, was not allowed to cause any variable other than vaspin. In addition, we forced inclusion of a causal path (arc) from LBP disability to vaspin and from GDF-15 to LBP disability for theoretical reasons. We used a four-stage analysis pipeline to arrive at a final causal model that guards against overfitting, as previously described.57 Because it is theoretically possible that different causal structures could produce the same likelihood of the data,58,59 we caution that there are equivalent models with causal direction reversed, though this is not of major concern due to strong theoretical basis for the direction of some of the arcs.
Results
Sample Characteristics
Basic descriptive statistics of the study variables are presented in the supplementary material (Table S1). The sample included 489 males and 589 females, with non-significant (p = 0.65) age differences between the sexes (42.80±13.90 vs 43.20±13.70), of which 228 (46.62%) males vs 330 (56.01%) females suffered from diagnosed LBP (p = 0.0021). The comparisons of all the other variables were conducted with the adjustment for age and were all also significantly different between women and men, as expected (Table S1, Supplementary Material).
Table S2 provides comparison of the study variables between the control and the affected individuals. As expected, LBP disability scores were much higher in the affected group than in unaffected individuals (15.89±0.30 vs 3.89±0.09, p = 0.0001). The groups also differed on most other variables.
When the correlations of the LBP scores with all the potential covariates were examined in the entire sample, we observed that both age and sex were highly significantly and independently associated with LBP disability score in multiple regression analysis (βAGE = 0.157±0.030, p = 2.65×10⁻⁷ and βwomen = 0.131±0.027, p = 3.0×10⁻⁶). Subsequent analyses were therefore all conducted controlling for age and sex differences between the individuals (Table 1). As can be seen, most of the variables showed significant association with the disability score, before and after adjustment for age and sex. The correlations with SMM/W, ICW, and hyperlipidemia become nonsignificant after adjustment. Interestingly, compared to individuals without any comorbidity, LBP disability scores were significantly elevated in individuals diagnosed with mental disorders, hypertension, and T2DM, but in particular in those having HLD+HTN+T2DM (p = 0.00004, after adjustment, Table 1).
However, the variables used as covariates of LBP disability in this study were not independent from one another (Table S3). Body composition variables (BMI, SMM/W, and FM/W) were in particular highly inter-correlated (collinear) and also each moderately correlated with ECW, either positively or negatively (absolute r ranged from 0.46 to 0.49, p < 0.001); therefore, to avoid redundancy and multicollinearity, in subsequent multiple regression analyses we used only ECW.
Figure 1 illustrates the gradual increase in LBP disability rates with age and separately with the elevation of circulating levels of each of the three studied soluble factors. Due to the substantial increase in LBP scores with age overshadowing other effects, the multiple R’s in all three regression analyses were very similar in magnitude and significance. However, despite the significant contribution of age to these relationships, the partial correlations with each of the soluble factors survived adjustment for age (and sex) and remained statistically significant (Figure 1).
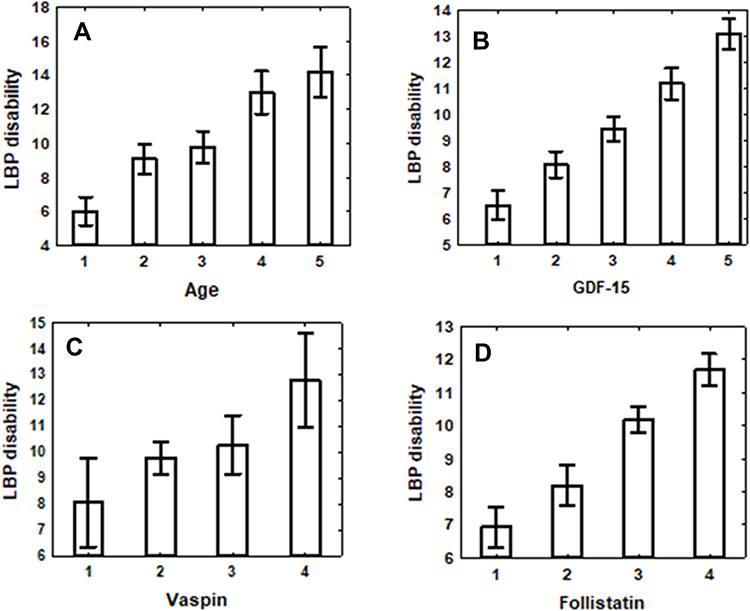 |
Figure 1 Plots of LBP disability scores (mean ± SE) changes by soluble factor levels. (A) Age categories 1 through 5 correspond to values falling in the following ranges in years: [18≥ and <30), [30≥ and <40), [40≥ and <50), [50≥ and <60) [≥60 years). Ptrend =0.000001. (B) GDF-15 level categories 1 through 5 correspond to values falling in the following ranges in pg/mL: (<1.70 levels), [1.70≥ and <1.75), [1.75≥ and <1.80), [1.80≥ and <1.85), [≥1.85 levels). Ptrend before adjustment for age and sex p=1.22×10⁻¹⁵, after adjustment P=0.002. (C) Vaspin level categories 1 through 4 correspond to values falling in the following ranges in pg/mL: (<5.0 levels), [5.0≥ and <5.9), [5.9≥ and <6.9), [6.9≥). Ptrend before adjustment for age and sex p<0.0001, after adjustment P=0.001. (D) Follistatin level categories 1 through 4 correspond to values falling in the following ranges in pg/mL: (<4.5 levels), [4.5≥ and <5.5), [5.5≥ and <6.5), [6.5≥). Ptrend before adjustment for age and sex p=3.62×10⁻⁸, after adjustment p=0.001. The best equations predicting LBP- disability score were: = −6.2619+6.074*GDF-15; = 3.754+0.148*Vaspin; =2.9657+0.2795*Follistatin. |
Multivariable Analyses
At this stage, all variables that were significantly associated with LBP-related phenotypes in univariate models (Table 1) were analyzed using a mixed-model logistic regression to simultaneously test the extent of the associations of the body composition measurements and plasma levels of soluble markers. Since our sample was composed of nuclear families and complex pedigrees, we used a mixed model that takes into account familial composition of the sample. In order to avoid a risk of collinearity and redundancy of the covariates, the analysis was carried out in three stages. First, body composition variables and soluble markers were examined in two separate analyses, with age and sex included in each of them. Next, the retained significant covariates in combination with comorbidity, age, and sex were tested.
Table 2 clearly shows that both tested body composition variables, WHR and especially ECW, were highly associated with LBP disability (p = 0.008 and p = 0.00003, respectively). The analysis of soluble factors revealed that plasma levels of GDF-15, vaspin, and follistatin were significantly and independently (Table 3) associated with LBP disability scores. In both analyses, age and sex were significantly related to LBP disability (Tables 2 and 3).
At the final stage, significant body composition variables and the levels of soluble markers, together with comorbidity factors and age and sex were examined (Table 4). Importantly, all the variables significant in the prior analyses (Tables 2 and 3) remained significant also in the final analysis. Among the comorbidity categories, only mental disorders and combined HLD+HTN+T2DM conditions were significantly associated with LBP disability scores (Table 4). Interestingly, if the combined HLD+HTN+T2DM category is not included in the analysis, the betas for almost all of the other variables increased (a full model is presented in Table S4), likely due to the collinearity of the variables.
Additive Bayesian Network Modelling
The initial search for the maximum number of parents in the ABN model resulted in a maximum of four causal variables for any dependent variable. The initial DAG included 23 arcs and all arcs were retained after the simulation process using JAGS. The final DAG is presented in Figure 2. Model parameter estimates, along with their corresponding 95% credible intervals, are displayed adjoining the corresponding arc in the diagram, which shows a rather complex relationship among the tested variables. As seen, not only LBP disability, but the levels of almost all the other variables in the study (exception vaspin and mental disorders onset) were significantly dependent on age. In addition to age, the most important links were the direct connections found between GDF-15 and ECW with LBP disability scores, and between the latter and vaspin (all consistently positive). Interestingly, the effects of follistatin and mental disorders, significantly associated with LBP disability in regression analysis, appear only indirectly linked through multiple variables. Thus, mental disorders were directly linked to hyperlipidemia, which was directly linked to T2DM and hypertension. Follistatin levels were also linked to hypertension, which was in turn linked to ECW, while T2DM was directly linked to GDF-15.
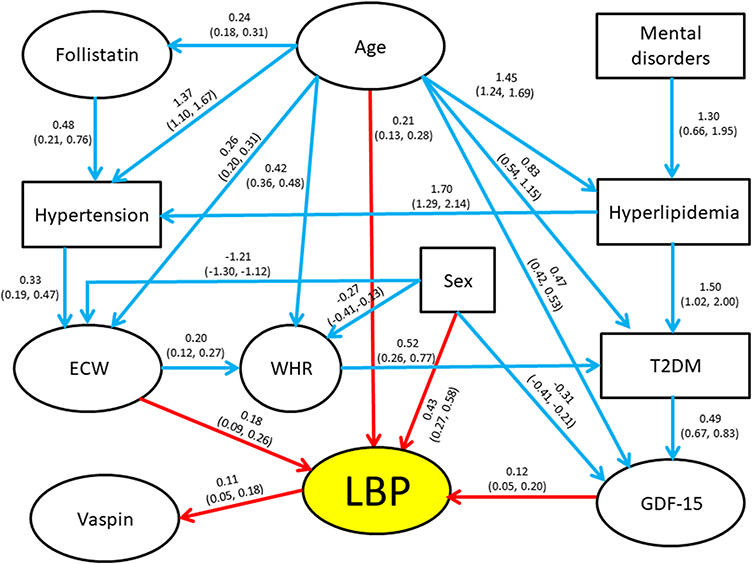 |
Figure 2 Path diagram (Bayesian network modelling, ABN) exploring complex relationships between LBP-disability, age and significantly associated covariates. Directed acyclic graph among study measures. Binary variables appear in rectangles and continuous variables in ovals. All quantitative variables were standardized prior to analysis. Coefficients on the arcs (paths) between “parents” (independent variables) and “children” (dependent variables) are the modes obtained from the posterior distributions resulting from the Bayesian modeling, with the corresponding 95% credible intervals presented below in parentheses. These coefficients are analogous to regression coefficients from logistic or multiple regression models, depending on variables examined. Red arrows denote direct influences on LBP and blue arrows indicate direct influences on the other variables. |
Discussion
As the average lifespan in developed countries continues to increase dramatically,60 the burden of chronic, age-dependent, degenerative diseases, including LBP-related disability, increases as well. Yet, LBP assessment continues to be challenging due to poorly understood etiology and pathogenesis, the absence of effective therapies, and the lack of reliable mechanistic biomarkers.61 Validation of such biomarkers would allow clinicians to objectively identify biochemical derangement driving the development or worsening of LBP symptoms and allow for novel, safe, and non-analgesic therapies aimed at correcting specific biochemical and metabolic pathways to alleviate pain and improve function. Biomarker monitoring would also allow for longitudinal evaluation of the efficacy of modulating therapies.
The present study in an ethnically and culturally homogenous population suggests a number of intrinsic factors independently affecting, or at least associated with, LBP disability severity (Table 4). Importantly, some of these factors, namely ECW and GDF-15 levels, appear as directly causal of disease, while others – follistatin levels and mental disorders – probably exert their effect indirectly, contributing to a risk of other comorbidities, such as hypertension, hyperlipidemia, and T2DM, which in turn affect ECW and GDF-15 (Figure 2). These observations, if confirmed, may have a critical significance in the understanding of the pathogenesis of LBP-associated disability and the strategy of medical treatment. Although a network analysis as the present one has not been done previously, several aspects of these results could be confirmed by the published data. Despite the obviously dominating role of aging, a significant and independent association of LBP disability with mental disorders is in line with previous findings.62–65 For example, a 50% prevalence of chronic pain (including LBP) has been observed in patients whose primary diagnosis is depression.66 It also has been found that the rate of major depression is increased in a linear fashion with chronic back pain severity, and that the combination of chronic back pain and depression was associated with greater disability than either depression or chronic back pain alone.67 Moreover, chronic LBP is found to be a strong predictor of depression severity and vice versa.68,69 Collectively, these observations suggest the existence of a bidirectional relationship between the presence and severity of LBP and mental disorders.
Our network analysis suggests that the effect of mental illness on LBP disability is likely indirect and mediated via, and supported by, hyperlipidemia, hypertension, and T2DM. Although causal relationships between these conditions remain unproven, genetic analyses, including Mendelian randomization, have indicated that obesity could be a casual factor for depression,70,71 hypertension,72 T2DM,73,74 and LBP.75 Longitudinal studies revealed that about half of obese individuals were likely to develop depression and vice versa.76 In addition, antidepressants and most antipsychotics are found to induce weight gain.70,77 Obesity measures, especially anthropometrical measurements, eg, BMI and WHR, have been repeatedly associated with LBP.78 However, these associations have been questioned,79 and lack detailed investigations,80 in particular for ECW levels. Our univariate multiple regression analysis showed that both WHR, and ECW adjusted for age and sex, were significantly associated with LBP-disability scores.
Changes in ECW osmolarity occur in various disturbed hemodynamic conditions, including hypertension.81 However, the role of ECW in LBP pathogenesis is not understood. Nevertheless, water leakage from the nucleus pulposus of the intervertebral disc was found to be associated with enhanced production of some pro-inflammatory cytokines and activation of proteases, thus leading to extracellular matrix damage and pain sensitization that characterizes intervertebral disc degradation and LBP.82 In the present study, ECW showed highly significant and independent association with LBP disability scores, suggesting that ECW levels might serve as an important and relevant biomarker for LBP-related disability, while their prognostic significance demands to be studied. Our network analysis suggests that ECW levels directly regulate WHR, which affects LBP via T2DM (Figure 2). Existing evidence suggests that WHR is a predictor of T2DM,83 and T2DM patients with a high WHR were more likely to be hypertensive as compared to those with normal WHR.84 Recent studies demonstrated that GDF-15 is a key regulator of body weight in animals, mainly through suppression of food intake and is also linked to inflammation,24,28,85 cardiovascular disease,86 and metabolic and mental disorders.27,29,30 These and other studies suggest the protective role of GDF-15 in various disorders. It is therefore plausible to assume that elevated GDF-15 blood levels observed in our study may represent a component of a similar adaptive/protective response to LBP-induced inflammation acting as a mediator of tissue tolerance.87
We also found a significant and independent correlation of plasma follistatin and vaspin levels with LBP disability. Elevated circulating levels of follistatin are observed in obese patients with T2DM accompanied by insulin resistance.41,88 Follistatin was shown to ameliorate fibrosis and improve kidney function in chronic kidney disease,89 suggesting its application in disorders accompanied by elevated blood pressure, such as chronic kidney disease, obesity, and T2DM.90 In our ABN analysis, elevated follistatin plasma levels contribute to hypertension development, which affects ECW levels, and thus indirectly correlates with LBP disability (Figure 2). However, whether this pathway is protective or detrimental remains unclear. A similar situation is found with the circulating vaspin. Recent data reported its possible protective role in various harmful, mainly inflammatory conditions,91–93 suggesting that vaspin’s elevated levels may reflect its protective role in LBP. As for GDF-15 and ECW, longitudinal studies are necessary to define whether follistatin and vaspin could serve as novel therapeutic targets for prevention and/or treatment of LBP.
The case-control cross-sectional study design introduces some important limitations, as it restricts drawing conclusions about the causality of the associations found. Obviously, longitudinal studies are required to better evaluate the casual or predictive nature of the variables studied. Moreover, intervertebral disk specimens for measurement of LBP biomarkers would be preferable, but not realistically obtainable in general population studies. However, determination of serum/plasma concentrations of several cytokines and other soluble molecules has been used successfully for monitoring the initiation, intensity, and progression of human LBP,25,26,94–96 and our data are in agreement with these results. There is potential for residual confounding that we unfortunately cannot address. For example, lifestyle variables such as stress, physical activity, food intake, sleep duration, and quality of life were not collected. In addition, a family-based community study includes the affected and non-affected (control) individuals as members of the same families, which can introduce bias caused by non-independence of the studied individuals. To overcome this problem, we implemented mixed multiple regression models with a flexible kinship covariance structure to address this potential concern. However, this sample composition has also some advantages, as it decreases both environmental and genetic heterogeneity between the case and control individuals, and thus indirectly increases the power of analysis.
Conclusion
This is the first study providing evidence that LBP disability is significantly and independently associated with circulating levels of multiple biochemical factors and body composition parameters and is aggravated by mental disorders and metabolic comorbidities. These associations, however, are complex and can be hierarchical, as illustrated by the ABN analysis. The data obtained indicate that chronic LBP-disabled patients display systemically impaired, inflammation-related, profiles (elevated plasma levels of GDF-15, follistatin and vaspin) that presumably affect or are affected by ECW and obesity (WHR), in concert with mental disorders (mainly, depression) and T2DM, hypertension, and hyperlipidemia. This also suggests that assessing multiple pathways is necessary to characterize LBP disability, hopefully convincing clinicians to include this complex evaluation for LBP patients. An additional clinically important point is the finding that GDF-15, follistatin, and vaspin plasma levels, as well as ECW and WHR, exhibited large differences between non-LBP and LBP disability groups. While each of these biomarkers reflects pathways that can impact the perception, development, and/or worsening of LBP, they are also linked to mental disorders and metabolic comorbidities. This provides a mechanistic insight into the potential role of deranged inflammatory-associated factors and mental and metabolic status in LBP disability. Moreover, disturbed biochemical and body composition characteristics can be corrected with appropriate low-cost therapies and supplementation, thus potentially avoiding analgesic (opioid) medications in severe LBP disability. The present results and suggestions highlight the need for larger longitudinal studies to better determine the causal relationships between LBP disability and studied parameters.
Ethical Approval
This study was conducted in accordance with the Declaration of Helsinki.
Acknowledgments
Research submitted by Nader Tarabeih, in partial fulfillment of the requirements for a PhD degree in Anatomy and Anthropology, Sackler Faculty of Medicine, Tel Aviv University. The authors thank Dr. Ida Malkin for the discussion concerning the statistical analysis of the data, and Dr. Svetlana Trofimov for laboratory technical assistance.
Author Contributions
All authors made a significant contribution to the work reported, whether that is in the conception, study design, execution, acquisition of data, analysis and interpretation, or in all these areas; took part in drafting, revising or critically reviewing the article; gave final approval of the version to be published; have agreed on the journal to which the article has been submitted; and agree to be accountable for all aspects of the work.
Funding
This research was funded by the Israel Science Foundation, grant number 2054/19, and also supported by Ariel University Research & Development Department, grant number RA2000000457.
Disclosure
The authors report no conflicts of interest in this work.
References
1. Blyth FM, Noguchi N. Chronic musculoskeletal pain and its impact on older people. Best Pract Res Clin Rheumatol. 2017;31(2):160–168. doi:10.1016/J.BERH.2017.10.004
2. McBeth J, Jones K. Epidemiology of chronic musculoskeletal pain. Best Pract Res Clin Rheumatol. 2007;21(3):403–425. doi:10.1016/J.BERH.2007.03.003
3. Briggs AM, Woolf AD, Dreinhöfer K, et al. Reducing the global burden of musculoskeletal conditions. Bull World Health Organ. 2018;96(5):366–368. doi:10.2471/BLT.17.204891
4. Foster NE, Anema JR, Cherkin D, et al. Prevention and treatment of low back pain: evidence, challenges, and promising directions. Lancet (London, England). 2018;391(10137):2368–2383. doi:10.1016/S0140-6736(18)30489-6
5. Wu A, March L, Zheng X. Global low back pain prevalence and years lived with disability from 1990 to 2017: estimates from the Global Burden of Disease Study 2017. Ann Transl Med. 2020;8(6):299. doi:10.21037/ATM.2020.02.175
6. Birgenheir DG, Ilgen MA, Bohnert ASB, et al. Pain conditions among veterans with schizophrenia or bipolar disorder. Gen Hosp Psychiatr. 2013;35(5):480–484. doi:10.1016/j.genhosppsych.2013.03.019
7. de Almeida JG, Braga PE, Neto FL, de Pimenta CAM. Chronic pain and quality of life in schizophrenic patients. Rev Bras Psiquiatr. 2013;35(1):13–20. doi:10.1016/j.rbp.2011.11.003
8. Baek JH, Kim YS, Yi KH. Relationship between comorbid health problems and musculoskeletal disorders resulting in musculoskeletal complaints and musculoskeletal sickness absence among employees in Korea. Saf Health Work. 2015;6(2):128–133. doi:10.1016/j.shaw.2015.03.002
9. Amin NA, Quek KF, Oxley JA, Noah R, Nordin R. Emotional distress as a predictor of work-related musculoskeletal disorders in Malaysian nursing professionals. Int J Occup Environ Med. 2018;9(2):69–78. doi:10.15171/ijoem.2018.1158
10. Demyttenaere K, Bruffaerts R, Lee S, et al. Mental disorders among persons with chronic back or neck pain: results from the world mental health surveys. Pain. 2007;129(3):332–342. doi:10.1016/j.pain.2007.01.022
11. Sullivan MJL, Reesor K, Mikail S, Fisher R. The treatment of depression in chronic low back pain: review and recommendations. Pain. 1992;50(1):5–13. doi:10.1016/0304-3959(92)90107-M
12. Steffen A, Nübel J, Jacobi F, Bätzing J, Holstiege J. Mental and somatic comorbidity of depression: a comprehensive cross-sectional analysis of 202 diagnosis groups using German nationwide ambulatory claims data. BMC Psychiatr. 2020;20(1). doi:10.1186/s12888-020-02546-8
13. Penninx BW, Lange SMM. Metabolic syndrome in psychiatric patients: overview, mechanisms, and implications. Dialogues Clin Neurosci. 2018;20(1):63–73. doi:10.31887/dcns.2018.20.1/bpenninx
14. IsHak WW, Wen RY, Naghdechi L, et al. Pain and depression: a systematic review. Harv Rev Psychiatr. 2018;26(6):352–363. doi:10.1097/HRP.0000000000000198
15. Penninx BW. Depression and cardiovascular disease: epidemiological evidence on their linking mechanisms. Neurosci Biobehav Rev. 2017;74(Pt B):277–286. doi:10.1016/j.neubiorev.2016.07.003
16. Leboeuf-Yde C. Body weight and low back pain. A systematic literature review of 56 journal articles reporting on 65 epidemiologic studies. Spine (Phila Pa 1976). 2000;25(2):226–237. doi:10.1097/00007632-200001150-00015
17. Bekhuis E, Boschloo L, Rosmalen JGM, Schoevers RA. Differential associations of specific depressive and anxiety disorders with somatic symptoms. J Psychosom Res. 2015;78(2):116–122. doi:10.1016/j.jpsychores.2014.11.007
18. Roest AM, de Jonge P. The heart of the matter: in search of causal effects of depression on somatic diseases. BMC Med. 2018;16(1). doi:10.1186/s12916-018-1144-1
19. Brady SRE, Urquhart DM, Hussain SM, et al. High baseline fat mass, but not lean tissue mass, is associated with high intensity low back pain and disability in community-based adults. Arthritis Res Ther. 2019;21(1):165. doi:10.1186/s13075-019-1953-4
20. Zhang -T-T, Liu Z, Liu Y-L, Zhao -J-J, Liu D-W, Tian Q-B. Obesity as a risk factor for low back pain: a meta-analysis. Clin Spine Surg. 2018;31(1):22–27. doi:10.1097/BSD.0000000000000468
21. Okamoto CS, Dunn AS, Green BN, Formolo LR, Chicoine D. Correlation of body composition and low back pain severity in a cross-section of US veterans. J Manipulative Physiol Ther. 2017;40(5):358–364. doi:10.1016/j.jmpt.2017.03.003
22. Khan AN, Jacobsen HE, Khan J, et al. Inflammatory biomarkers of low back pain and disc degeneration: a review. Ann N Y Acad Sci. 2017;1410:68–84. doi:10.1111/nyas.13551
23. van den Berg R, Jongbloed EM, de Schepper EIT, Bierma-Zeinstra SMA, Koes BW, Luijsterburg PAJ. The association between pro-inflammatory biomarkers and nonspecific low back pain: a systematic review. Spine J. 2018;18(11):2140–2151. doi:10.1016/j.spinee.2018.06.349
24. Wischhusen J, Melero I, Fridman WH. Growth/differentiation factor-15 (GDF-15): from biomarker to novel targetable immune checkpoint. Front Immunol. 2020;11. doi:10.3389/fimmu.2020.00951
25. Tarabeih N, Shalata A, Trofimov S, Kalinkovich A, Livshits G. Growth and differentiation factor 15 is a biomarker for low back pain-associated disability. Cytokine. 2019;117:8–14. doi:10.1016/j.cyto.2019.01.011
26. Tarabeih N, Kalinkovich A, Shalata A, Livshits G. Circulating levels of visceral adipose tissue-derived serine protease inhibitor (vaspin) appear as a marker of musculoskeletal pain disability. Diagnostics. 2020;10(10):797. doi:10.3390/diagnostics10100797
27. Hale C, Véniant MM. Growth differentiation factor 15 as a potential therapeutic for treating obesity. Mol Metab. 2020;46:101117. doi:10.1016/j.molmet.2020.101117
28. Desmedt S, Desmedt V, De Vos L, Delanghe JR, Speeckaert R, Speeckaert MM. Growth differentiation factor 15: a novel biomarker with high clinical potential. Crit Rev Clin Lab Sci. 2019;56(5):333–350. doi:10.1080/10408363.2019.1615034
29. Frye MA, Nassan M, Jenkins GD, et al. Feasibility of investigating differential proteomic expression in depression: implications for biomarker development in mood disorders. Transl Psychiatr. 2015;5(12):e689–e689. doi:10.1038/tp.2015.185
30. Maetzler W, Deleersnijder W, Hanssens V, et al. GDF15/MIC1 and MMP9 cerebrospinal fluid levels in Parkinson’s disease and Lewy body dementia. PLoS One. 2016;11(3):e0149349. doi:10.1371/journal.pone.0149349
31. Yang F, Barbosa IG, Vieira EL, Bauer ME, Rocha NP, Teixeira AL. Further evidence of accelerated aging in bipolar disorder: focus on GDF-15. Transl Neurosci. 2018;9(1):17–21. doi:10.1515/tnsci-2018-0004
32. Lin Y, Zhuang J, Li H, et al. Vaspin attenuates the progression of atherosclerosis by inhibiting ER stress-induced macrophage apoptosis in apoE-/- mice. Mol Med Rep. 2016;13(2):1509–1516. doi:10.3892/mmr.2015.4708
33. Nicholson T, Church C, Tsintzas K, et al. Vaspin promotes insulin sensitivity in elderly muscle and is upregulated in obesity. J Endocrinol. 2019;241(1):31–43. doi:10.1530/JOE-18-0528
34. Feng R, Li Y, Wang C, et al. Higher vaspin levels in subjects with obesity and type 2 diabetes mellitus: a meta-analysis. Diabetes Res Clin Pract. 2014;106(1):88–94. doi:10.1016/j.diabres.2014.07.026
35. Pervin S, Nyah W, Reddy S, Singh R. Novel aspects of follistatin/transforming growth factor-β (TGF-β) signaling in adipose tissue metabolism: implications in metabolic health. In Adipose Tissue - an Update. IntechOpen; 2019. doi10.5772/intechopen.88294
36. Han X, Møller LLV, De Groote E, et al. Mechanisms involved in follistatin‐induced hypertrophy and increased insulin action in skeletal muscle. J Cachexia Sarcopenia Muscle. 2019;10(6):1241–1257. doi:10.1002/jcsm.12474
37. Canalis E, Economides AN, Gazzerro E. Bone morphogenetic proteins, their antagonists, and the skeleton. Endocr Rev. 2003;24(2):218–235. doi:10.1210/er.2002-0023
38. May RD, Frauchiger DA, Albers CE, et al. Application of cytokines of the bone morphogenetic protein (BMP) family in spinal fusion - effects on the bone, intervertebral disc and mesenchymal stromal cells. Curr Stem Cell Res Ther. 2019;14(8):618–643. doi:10.2174/1574888x14666190628103528
39. Singh R, Braga M, Pervin S. Regulation of brown adipocyte metabolism by myostatin/follistatin signaling. Front Cell Dev Biol. 2014;2. doi:10.3389/fcell.2014.00060
40. Pervin S, Singh V, Tucker A, Collazo J, Singh R. Modulation of transforming growth factor-β/follistatin signaling and white adipose browning: therapeutic implications for obesity related disorders. Horm Mol Biol Clin Investig. 2017;31(2). doi:10.1515/hmbci-2017-0036
41. Perakakis N, Kokkinos A, Peradze N, et al. Follistatins in glucose regulation in healthy and obese individuals. Diabetes Obes Metab. 2019;21(3):683–690. doi:10.1111/dom.13572
42. Chiarotto A, Maxwell LJ, Terwee CB, Wells GA, Tugwell P, Ostelo RW. Roland-Morris disability questionnaire and Oswestry disability index: which has better measurement properties for measuring physical functioning in nonspecific low back pain? Systematic review and meta-analysis. Phys Ther. 2016;96(10):1620–1637. doi:10.2522/ptj.20150420
43. Smeets R, Köke A, Lin CW, Ferreira M, Demoulin C. Measures of function in low back pain/disorders: Low Back Pain Rating Scale (LBPRS), Oswestry Disability Index (ODI), Progressive Isoinertial Lifting Evaluation (PILE), Quebec Back Pain Disability Scale (QBPDS), and Roland-Morris Disability Questionnaire (RDQ). Arthritis Care Res. 2011;63(SUPPL. 11). doi:10.1002/acr.20542
44. Ko S, Chae S. Correlations between the SF-36, the Oswestry-disability index and Roland-Morris disability questionnaire in patients undergoing lumbar decompression according to types of spine origin pain. Clin Spine Surg. 2017;30(6):E804–E808. doi:10.1097/BSD.0000000000000438
45. Roland M, Fairbank J. The Roland-Morris disability questionnaire and the Oswestry disability questionnaire. Spine (Phila Pa 1976). 2000;25(24):3115–3124. doi:10.1097/00007632-200012150-00006
46. Maki D, Rajab E, Watson PJ, Critchley DJ. Cross-cultural translation, adaptation, and psychometric testing of the Roland-Morris disability questionnaire into modern standard Arabic. Spine (Phila Pa 1976). 2014;39(25):E1537–E1544. doi:10.1097/BRS.0000000000000632
47. Achamrah N, Colange G, Delay J, et al. Comparison of body composition assessment by DXA and BIA according to the body mass index: a retrospective study on 3655 measures. PLoS One. 2018;13(7):e0200465. doi:10.1371/journal.pone.0200465
48. Kyle UG, Bosaeus I, De Lorenzo AD, et al. Bioelectrical impedance analysis–part I: review of principles and methods. Clin Nutr. 2004;23(5):1226–1243. doi:10.1016/J.CLNU.2004.06.004
49. Iizuka Y, Iizuka H, Mieda T, et al. Association between neck and shoulder pain, back pain, low back pain and body composition parameters among the Japanese general population. BMC Musculoskelet Disord. 2015;16(1):333. doi:10.1186/s12891-015-0759-z
50. McManus ML, Churchwell KB, Strange K, Epstein FH. Regulation of cell volume in health and disease. N Engl J Med. 1995;333(19):1260–1266. doi:10.1056/NEJM199511093331906
51. Ziyatdinov A, Vázquez-Santiago M, Brunel H, Martinez-Perez A, Aschard H, Soria JM. lme4qtl: linear mixed models with flexible covariance structure for genetic studies of related individuals. BMC Bioinform. 2018;19(1):68. doi:10.1186/s12859-018-2057-x
52. (PDF) Package Kinship 2.Available from: https://cran.r-project.org/web/packages/kinship2/kinship2.pdf.
53. Kratzer G, Lewis FI, Comin A, Pittavino M, Furrer R. Additive Bayesian network modelling with the R package Abn. Available from: https://cran.r-project.org/package=abn.
54. Lewis FI, Ward MP. Improving epidemiologic data analyses through multivariate regression modelling. Emerg Themes Epidemiol. 2013;10(1):4. doi:10.1186/1742-7622-10-4
55. (PDF) abn: an R package for modelling multivariate data using additive Bayesian networks. Available from: https://www.researchgate.net/publication/303371852_abn_an_R_package_for_modelling_multivariate_data_using_additive_Bayesian_networks.
56. Hornik K, Leisch F, Zeileis A, Plummer M. JAGS: a program for analysis of bayesian graphical models using Gibbs sampling. Available from: http://www.ci.tuwien.ac.at/Conferences/DSC-2003/.
57. Cherny SS, Nevo D, Baraz A, et al. Revealing antibiotic cross-resistance patterns in hospitalized patients through Bayesian network modelling. J Antimicrob Chemother. 2021;76(1):239–248. doi:10.1093/JAC/DKAA408
58. Hidano A, Yamamoto T, Hayama Y, et al. Unraveling antimicrobial resistance genes and phenotype patterns among enterococcus faecalis isolated from retail chicken products in Japan. PLoS One. 2015;10(3):e0121189. doi:10.1371/journal.pone.0121189
59. Lewis FI, McCormick BJJ. Revealing the complexity of health determinants in resource-poor settings. Am J Epidemiol. 2012;176(11):1051–1059. doi:10.1093/aje/kws183
60. Aburto JM, van Raalte A. Lifespan dispersion in times of life expectancy fluctuation: the case of Central and Eastern Europe. Demography. 2018;55(6):2071–2096. doi:10.1007/S13524-018-0729-9
61. Hartvigsen J, Hancock MJ, Kongsted A, et al. What low back pain is and why we need to pay attention. Lancet (London, England). 2018;391(10137):2356–2367. doi:10.1016/S0140-6736(18)30480-X
62. Park S-M, Kim H-J, Jang S, et al. Depression is closely associated with chronic low back pain in patients over 50 years of age. Spine (Phila Pa 1976). 2018;43(18):1281–1288. doi:10.1097/BRS.0000000000002595
63. Tsuji T, Matsudaira K, Sato H, Vietri J. The impact of depression among chronic low back pain patients in Japan. BMC Musculoskelet Disord. 2016;17(1):1–9. doi:10.1186/s12891-016-1304-4
64. Robertson D, Kumbhare D, Nolet P, Srbely J, Newton G. Associations between low back pain and depression and somatization in a Canadian emerging adult population. J Can Chiropr Assoc. 2017;61(2):96–105.
65. Ranger TA, Cicuttini FM, Jensen TS, Manniche C, Heritier S, Urquhart DM. Catastrophization, fear of movement, anxiety, and depression are associated with persistent, severe low back pain and disability. Spine J. 2020;20(6):857–865. doi:10.1016/j.spinee.2020.02.002
66. Crofford LJ. Psychological aspects of chronic musculoskeletal pain. Best Pract Res Clin Rheumatol. 2015;29(1):147–155. doi:10.1016/j.berh.2015.04.027
67. Currie SR, Wang JL. Chronic back pain and major depression in the general Canadian population. Pain. 2004;107(1–2):54–60. doi:10.1016/j.pain.2003.09.015
68. Kroenke K, Wu J, Bair MJ, Krebs EE, Damush TM, Tu W. Reciprocal relationship between pain and depression: a 12-month longitudinal analysis in primary care. J Pain. 2011;12(9):964–973. doi:10.1016/j.jpain.2011.03.003
69. Pinheiro MB, Ferreira ML, Refshauge K, et al. Symptoms of depression as a prognostic factor for low back pain: a systematic review. Spine J. 2016;16(1):105–116. doi:10.1016/j.spinee.2015.10.037
70. Woo YS, Seo HJ, McIntyre RS, Bahk WM. Obesity and its potential effects on antidepressant treatment outcomes in patients with depressive disorders: a literature review. Int J Mol Sci. 2016;17(1):80. doi:10.3390/ijms17010080
71. Tyrrell J, Mulugeta A, Wood AR, et al. Using genetics to understand the causal influence of higher BMI on depression. Int J Epidemiol. 2019;48(3):834–848. doi:10.1093/ije/dyy223
72. Lee MR, Lim YH, Hong YC. Causal association of body mass index with hypertension using a Mendelian randomization design. Med (United States). 2018;97(30). doi:10.1097/MD.0000000000011252
73. Bellou V, Belbasis L, Tzoulaki I, Evangelou E, Nerurkar PV. Risk factors for type 2 diabetes mellitus: an exposure-wide umbrella review of meta-analyses. PLoS One. 2018;13(3):e0194127. doi:10.1371/journal.pone.0194127
74. Yuan S, Larsson SC. An atlas on risk factors for type 2 diabetes: a wide-angled Mendelian randomisation study. Diabetologia. 2020;63(11):2359–2371. doi:10.1007/s00125-020-05253-x
75. Elgaeva EE, Tsepilov Y, Freidin MB, Williams FMK, Aulchenko Y, Suri P. ISSLS Prize in Clinical Science 2020. Examining causal effects of body mass index on back pain: a Mendelian randomization study. Eur Spine J. 2020;29(4):686–691. doi:10.1007/s00586-019-06224-6
76. Luppino FS, De Wit LM, Bouvy PF, et al. Overweight, obesity, and depression: a systematic review and meta-analysis of longitudinal studies. Arch Gen Psychiatr. 2010;67(3):220–229. doi:10.1001/archgenpsychiatry.2010.2
77. Lee SH, Paz-Filho G, Mastronardi C, Licinio J, Wong ML. Is increased antidepressant exposure a contributory factor to the obesity pandemic? Transl Psychiatr. 2016;6(3):e759–e759. doi:10.1038/tp.2016.25
78. Livshits G, Popham M, Malkin I, et al. Lumbar disc degeneration and genetic factors are the main risk factors for low back pain in women: the UK Twin Spine Study. Ann Rheum Dis. 2011;70(10):1740–1745. doi:10.1136/ARD.2010.137836
79. Abadi FH, Sankaravel M, Zainuddin FF, Elumalai G, Razli AI. The effect of aquatic exercise program on low-back pain disability in obese women. J Exerc Rehabil. 2019;15(6):855–860. doi:10.12965/jer.1938688.344
80. Dario AB, Ferreira ML, Refshauge KM, Lima TS, Ordoñana JR, Ferreira PH. The relationship between obesity, low back pain, and lumbar disc degeneration when genetics and the environment are considered: a systematic review of twin studies. Spine J. 2015;15(5):1106–1117. doi:10.1016/j.spinee.2015.02.001
81. Tarazi RC. Hemodynamic role of extracellular fluid in hypertension. Circ Res. 1976;38(6sup2):72–83. doi:10.1161/01.res.38.6.73
82. Vergroesen -P-PA, Kingma I, Emanuel KS, et al. Mechanics and biology in intervertebral disc degeneration: a vicious circle. Osteoarthr Cartil. 2015;23(7):1057–1070. doi:10.1016/j.joca.2015.03.028
83. Han TS, Feskens EJM, Lean MEJ, Seidell JC. Associations of body composition with Type 2 diabetes mellitus. Diabet Med. 1998;15(2):129–135. doi:10.1002/(SICI)1096-9136(199802)15:2<129::AID-DIA535>3.0.CO;2-2
84. Chaudhary GMD, Tameez Ud Din A, Chaudhary FMD, et al. Association of obesity indicators with hypertension in type 2 diabetes mellitus patients. Cureus. 2019;11(7). doi:10.7759/cureus.5050
85. Cheung CL, Tan KCB, Au PCM, Li GHY, Cheung BMY. Evaluation of GDF15 as a therapeutic target of cardiometabolic diseases in human: a Mendelian randomization study. EBioMedicine. 2019;41:85–90. doi:10.1016/j.ebiom.2019.02.021
86. Wollert KC, Kempf T, Wallentin L. Growth differentiation factor 15 as a biomarker in cardiovascular disease. Clin Chem. 2017;63(1):140–151. doi:10.1373/clinchem.2016.255174
87. Luan HH, Wang A, Hilliard BK, et al. GDF15 is an inflammation-induced central mediator of tissue tolerance. Cell. 2019;178(5):1231–1244.e11. doi:10.1016/j.cell.2019.07.033
88. Sylow L, Vind BF, Kruse R, et al. Circulating follistatin and activin A and their regulation by insulin in obesity and type 2 diabetes. J Clin Endocrinol Metab. 2020;105(5):1343–1354. doi:10.1210/clinem/dgaa090
89. Mehta N, Gava AL, Zhang D, Gao B, Krepinsky JC. Follistatin protects against glomerular mesangial cell apoptosis and oxidative stress to ameliorate chronic kidney disease. Antioxidants Redox Signal. 2019;31(8):551–571. doi:10.1089/ars.2018.7684
90. Bozkurt B, Aguilar D, Deswal A, et al. Contributory risk and management of comorbidities of hypertension, obesity, diabetes mellitus, hyperlipidemia, and metabolic syndrome in chronic heart failure: a scientific statement from the American Heart Association. Circulation. 2016;134(23):e535–e578. doi:10.1161/CIR.0000000000000450
91. Flehmig G, Scholz M, Klöting N, et al. Identification of adipokine clusters related to parameters of fat mass, insulin sensitivity and inflammation. PLoS One. 2014;9(6):e99785. doi:10.1371/journal.pone.0099785
92. Teshigawara S, Wada J, Hida K, et al. Serum vaspin concentrations are closely related to insulin resistance, and rs77060950 at SERPINA12 genetically defines distinct group with higher serum levels in Japanese population. J Clin Endocrinol Metab. 2012;97(7):E1202–E1207. doi:10.1210/jc.2011-3297
93. Weiner J, Zieger K, Pippel J, Heiker JT. Molecular mechanisms of vaspin action – from adipose tissue to skin and bone, from blood vessels to the brain. In: Advances in Experimental Medicine and Biology. Vol. 1111. Springer;2019:159–188. doi:10.1007/5584_2018_241
94. Brady SRE, Mousa A, Naderpoor N, de Courten MPJ, Cicuttini F, de Courten B. Adipsin concentrations are associated with back pain independently of adiposity in overweight or obese adults. Front Physiol. 2018;9. doi:10.3389/fphys.2018.00093
95. Weber KT, Satoh S, Alipui DO, et al. Exploratory study for identifying systemic biomarkers that correlate with pain response in patients with intervertebral disc disorders. Immunol Res. 2015;63(1–3):170–180. doi:10.1007/s12026-015-8709-2
96. Lippi G, Dagostino C, Buonocore R, et al. The serum concentrations of leptin and MCP-1 independently predict low back pain duration. Clin Chem Lab Med. 2017;55(9):1368–1374. doi:10.1515/cclm-2016-0942
 © 2022 The Author(s). This work is published and licensed by Dove Medical Press Limited. The
full terms of this license are available at https://www.dovepress.com/terms
and incorporate the Creative Commons Attribution
- Non Commercial (unported, 3.0) License.
By accessing the work you hereby accept the Terms. Non-commercial uses of the work are permitted
without any further permission from Dove Medical Press Limited, provided the work is properly
attributed. For permission for commercial use of this work, please see paragraphs 4.2 and 5 of our Terms.
© 2022 The Author(s). This work is published and licensed by Dove Medical Press Limited. The
full terms of this license are available at https://www.dovepress.com/terms
and incorporate the Creative Commons Attribution
- Non Commercial (unported, 3.0) License.
By accessing the work you hereby accept the Terms. Non-commercial uses of the work are permitted
without any further permission from Dove Medical Press Limited, provided the work is properly
attributed. For permission for commercial use of this work, please see paragraphs 4.2 and 5 of our Terms.