")
Back to Journals » OncoTargets and Therapy » Volume 14
CPNE1 Enhances Colorectal Cancer Cell Growth, Glycolysis, and Drug Resistance Through Regulating the AKT-GLUT1/HK2 Pathway
Authors Wang Y, Pan S, He X, Wang Y, Huang H, Chen J, Zhang Y, Zhang Z, Qin X
Received 29 September 2020
Accepted for publication 4 December 2020
Published 27 January 2021 Volume 2021:14 Pages 699—710
DOI https://doi.org/10.2147/OTT.S284211
Checked for plagiarism Yes
Review by Single anonymous peer review
Peer reviewer comments 2
Editor who approved publication: Dr Arseniy Yuzhalin
Yuexia Wang,1,* Shengli Pan,2,* Xinhong He,3 Ying Wang,3 Haozhe Huang,3 Junxiang Chen,3 Yuhao Zhang,2 Zhijin Zhang,2 Xianju Qin2
1Department of General Surgery, Shanghai Eighth People’s Hospital, Jiangsu University, Shanghai, People’s Republic of China; 2Department of General Surgery, Shanghai Eighth People’s Hospital, Shanghai, People’s Republic of China; 3Department of Radiation Oncology, Fudan University Shanghai Cancer Center, Shanghai, People’s Republic of China
*These authors contributed equally to this work
Correspondence: Shengli Pan; Xianju Qin
Department of General Surgery, Shanghai Eighth People’s Hospital, Caobao Road No. 8, Shanghai 200232, People’s Republic of China
Tel +86-21-34284588
Email [email protected]; [email protected]
Introduction: Colorectal cancer (CRC) is a major cause of cancer-related mortality worldwide. Copines-1 (CPNE1) has been shown to be overexpressed in various cancers; however, the role of CPNE1 in CRC remains unknown. Therefore, it is of great importance to elucidate the role of CPNE1 in CRC and its underlying mechanism of action.
Methods: CPNE1 expression in CRC tissues was measured by quantitative real-time PCR and immunohistochemical (IHC) staining. CPNE1 was knocked down (KD) or overexpressed using small inferring RNAs or lentiviral transduction in CRC cells. The proliferation, apoptosis, glycolysis, and mitochondrial respiration of CRC cells were assessed by cell counting kit-8, flow cytometry, and Xfe24 extracellular flux analyzer assays, respectively. The role of CPNE1 in tumor growth and chemoresistance was further confirmed in xenograft and patient-derived tumor xenograft models, respectively.
Results: CPNE1 mRNA and protein were upregulated in CRC tissues. CPNE1 promoted proliferation, inhibited apoptosis, increased mitochondrial respiration, enhanced aerobic glycolysis by activating AKT signaling, upregulated glucose transporter 1 (GLUT1) and hexokinase 2 (HK2), and downregulated the production of cleaved Caspase-3 (c-Caspase 3). CPNE1 also contributed to chemoresistance in CRC cells. CPNE1 KD inhibited tumor growth and increased the sensitivity of tumors to oxaliplatin in vivo.
Conclusion: CPNE1 promotes CRC progression by activating the AKT-GLUT1/HK2 cascade and enhances chemoresistance.
Keywords: copines-1, colorectal cancer, aerobic glycolysis, mitochondrial respiration
Introduction
Colorectal cancer (CRC), which develops in the colon or rectum, is a major cause of cancer-related mortality worldwide.1 The lifetime risk of CRC for an average American is approximately 5%.2 Unfortunately, about one-fifth of CRC cases are diagnosed at an advanced stage.3 The risk factors for CRC include inflammatory bowel disease, family history of first-degree relatives with CRC, obesity, red meat intake, smoking, lack of physical activity, and low vegetable/fruit consumption.2 Currently, the standard treatment for CRC includes surgery and chemotherapy, which are associated with physical complications, systemic toxicity, and resistance.4 Although significant advances have been made in the development of new treatments for CRC patients, the overall long-term outcome for patients curatively resected has not significantly improved over the last decade.5 Therefore, it is important to elucidate the underlying pathological processes to identify new targets for CRC treatment.
Copines are a family of evolutionally conserved, calcium-dependent membrane-binding proteins that were first isolated from Paramecium tetraurelia.6 Copine-1 (CPNE1) is identified as an oncogene in certain human tumors. It has been shown that CPNE1 is overexpressed in human lung cancer and prostate cancer and enhanced expression of CPNE1 promotes lung cancer cell growth and metastasis.7,8 CPNE1 knockdown (KD) has been shown to significantly inhibit the proliferation and migration of human osteosarcoma cells.9 CPNE1 also activates the AKT signaling pathways which plays a central role in glucose homeostasis and cellular energy metabolism by regulating glucose 6-phosphate and glycogen synthase kinase 3.10,11 Nevertheless, the manner in which CPNE1 contributes to CRC development, progression, and chemoresistance is unclear.
Tumor cells, including CRC cells, rely heavily on aerobic glycolysis for ATP generation.12 The AKT signaling pathway has been shown to promote the expression of GLUT1 in CRC.13 Moreover, the AKT-glucose transporter 1 (GLUT1)-hexokinase 2 (HK2) pathway has been implicated in regulating the glycolytic process in various cancer cells including CRC cells.14–16 Park et al showed that CPNE1 activates AKT to promote neuronal progenitor cell differentiation.17 However, whether CPNE1 can regulate the AKT-GLUT1/HK2 pathway in CRC remains to be determined. Therefore, we studied the role of CPNE1 in CRC cell growth and energy metabolism and investigated whether the activation of AKT-GLUT1/HK2 is involved.
Materials and Methods
Cell Culture
Cell lines were purchased from the ATCC (Manassas, VA, USA) and included CACO2, HT29, LOVO, and HEK293-T. The culture media contained 10% FBS, 2 mM l-glutamine, and 1% penicillin/streptomycin (Solarbio, Beijing, P.R. China). CACO2 cells were cultured in MEM medium (SH30024.01B, Hyclone. USA), whereas the others were cultured in RPMI-1640 medium (SH30809.01B, Hyclone. USA). The cells were maintained at 37°C in a 5% CO2 atmosphere.
Cell Proliferation
The Cell Counting Kit −8 (CCK-8) was obtained from BioVision (Exton, PA). Cells were seeded into 96-well plates and incubated for 24 hours in a humidified incubator. Afterwards, CCK-8 working solution plus serum-free culture medium (1:10) was added to the plates (100 µL/well) and incubated for 0, 12, 24, and 48 h. The plate was incubated for 1 hour in the incubator. The optical density 450 nm (OD 450) was measured using a microplate reader (Molecular Devices, San Jose, CA, USA).
CPNE1 Silencing
Online software from Invitrogen (Carlsbad, CA) was used to design CPNE1-specific small interfering RNA (siRNA) sequences which are shown in Table 1. Oligonucleotides were annealed and ligated into the pLKO.1 plasmid vector (OriGene, Rockville, MD). The plasmids were then amplified in competent Escherichia coli DH5α cells and purified using the PureYieldTM Plasmid Miniprep System (Promega, San Luis Obispo, CA). Sequence confirmation of the inserted siRNAs was done by Sangon (Shanghai, China). The recombinant pLKO.1 vector, psPAX2 and pMD2G, were transfected into HEK293-T cells using Turbofectin 8.0™ (OriGene, Rockville, MD) to produce lentiviruses, which were used to infect CACO2 and HT29 cells (siCPNE1).9 Cells infected with viruses containing scrambled siRNA were designated nonsilencing control cells (siNC).
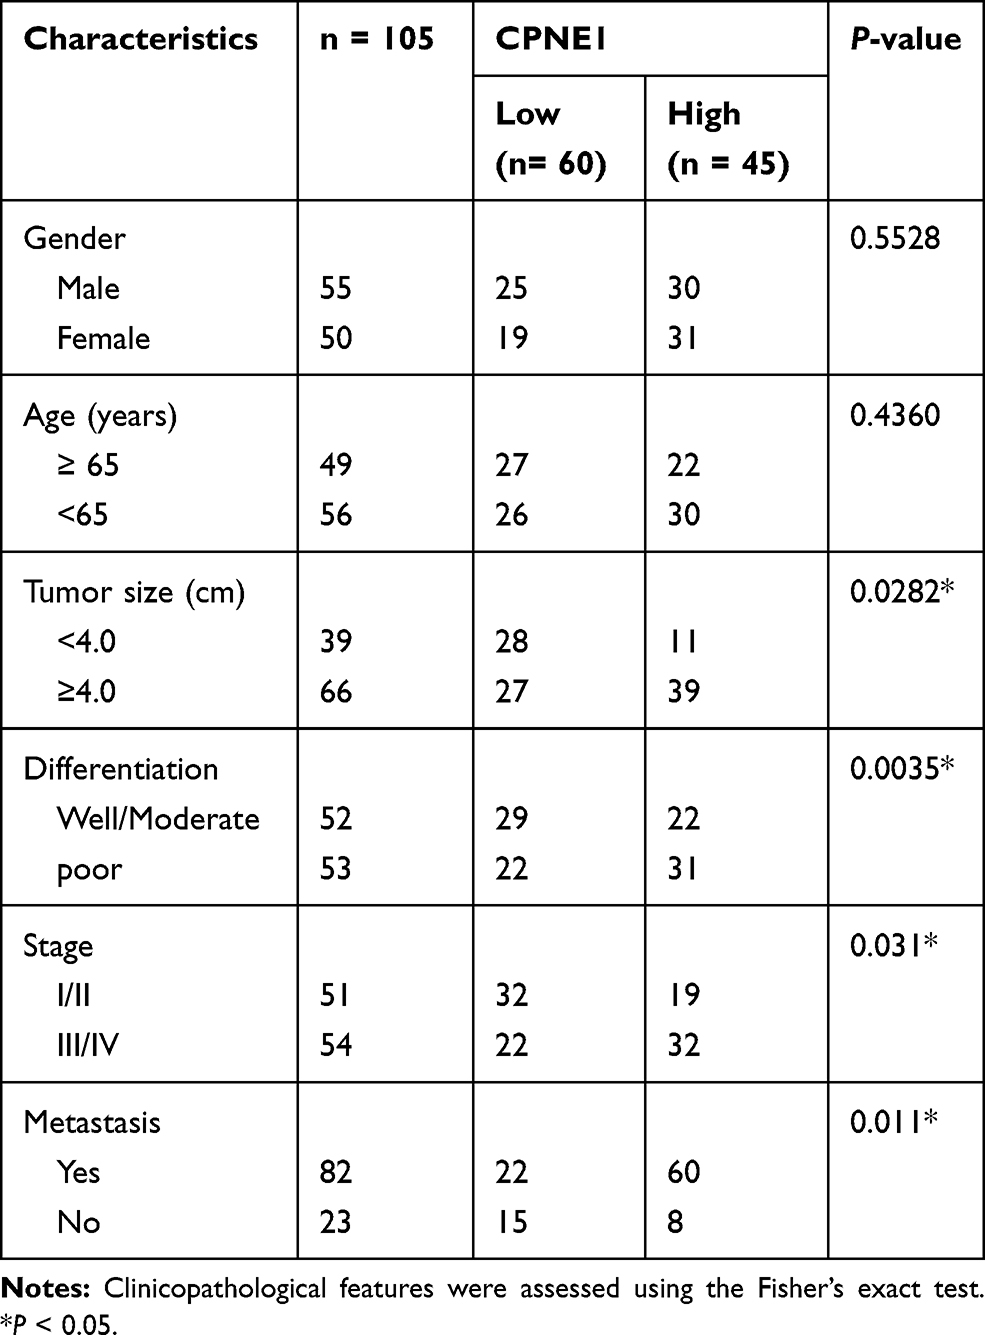 |
Table 1 The Correlations Between CPNE1 Expression and Clinic Pathological Features (Sex, Age, Tumor Size Differentiation, Metastasis and WHO Grade) in Patients with CRC |
CPNE1 Overexpression
CPNE1 plasmids were obtained from OriGene (Rockville, MD). The CPNE1 coding sequence was amplified with the following primers: CPNE1-F 5′-CGGAATTCATGGC CCACT GCGTGACC-3′ (EcoRI) and CPNE1-R 5′-CGGGATCCCTAGGCCTGGGGGGCC −3′ (BamHI). Amplified CPNE1 cDNA was cloned into the EcoRI and BamHI sites (underlined) of the pLVX-Puro vector. The resulting pLVX-Puro-CPNE1 plasmids were packaged into lentiviruses using 293T cells along with psPAX2 and pMD2G (Addgene, Watertown, MA) using the protocol described above. Lentiviruses carrying CPNE1 (oeCPNE1) or empty vectors (vector) were used to infect LOVO CRC cells.
Quantitative Real-Time PCR (qRT-PCR)
RNA was isolated using TRIzol (Sigma-Aldrich, Shanghai). Complementary DNA was synthesized using the RevertAid First Stand cDNA Synthesis kit (Thermofisher, Bridgewater Township, NJ, USA) following the manufacturer’s instructions. Fifty nanograms of cDNA was amplified using the CFX96 system (BIO-RAD, Philadelphia, PA) using EvaGreen Mix (Biotium, Fremont, CA). The PCR primer pairs used were as follows: CPNE1, 5′-CGTGTCAAGATTTGTCGGGTAG-3′ (sense) and 5′-GGGAGTCAGGTGA GGAGGG-3′ (antisense); GAPDH, 5′-AATCCCATCACCATCTTC-3′ (sense) and 5′-AGGCTGTTGTCATACTTC-3′ (antisense). GAPDH was used as a reference gene for normalization.
Western Blot Analysis
Total protein extracts were prepared from CRC cells or tumor tissues using RIPA buffer and were quantified by the BCA protein assay kit (Thermofisher, Bridgewater Township, NJ, USA). Proteins were separated by SDS-PAGE and transferred to PVDF membranes. After blocking, the membranes were incubated with anti-CPNE1, anti-GLUT1, anti-HK2, anti-cleaved Caspase 3 (Abcam, Cambridge, MA), anti-AKT, anti-p-AKT, or anti-GAPDH antibodies (Santa Cruz, Santa Cruz, CA) at 4°C overnight. Bands were visualized using an ECL kit (BioVision, Exton, PA) with an LAS-400 image analyzer (FujiFilm Medical Systems, Stamford, CT).
Immunohistochemistry (IHC) Assay
Colorectal tumor tissue sections (4 to 7-μm thick) were rehydrated and incubated overnight at 4°C with anti-CPNE1 antibody (ab155675, Abcam, Cambridge, MA) followed by incubation with a horseradish peroxidase-conjugated secondary antibody (Thermofisher, Bridgewater Township, NJ, USA) at 25°C for 30 mins. Diaminobenzidine (DAB) (Thermofisher, Bridgewater Township, NJ, USA) was used as the HRP substrate.
Flow Cytometry
The Annexin V-FITC Apoptosis Kit (BioVision, Milpitas, CA) was used to measure cell viability. Cells were seeded into 6-well plates (5.0 × 10⁴ cells/well) and cultured overnight. After 24 hours of treatment, the cells were pelleted at 1000 g for 5 minutes at 4°C and incubated sequentially with annexin V-FITC and propidium iodide. The proportion of apoptotic cells was determined using FACScan (Becton Dickinson, Franklin Lakes, NJ) analysis.
Apoptosis Assay
Apoptosis was detected using an FITC Apoptosis Detection kit (Abcam, Cambridge, MA). The tumor tissue sections were dewaxed, incubated with 3% hydrogen peroxide, washed, briefly dried, and incubated with reaction mix for 45 minutes at 37°C in a dark humidified incubator. The slides were then incubated with DAPI for 15 min at room temperature to stain cell nuclei.
Glycolysis and Mitochondrial Respiration Assay
The extracellular acidification rate (ECAR) and oxygen consumption rate (OCR) of LOVO, Caco2 and HT29 cells were determined using an XFe24 Extracellular Flux Analyzer (Seahorse Bioscience, Billerica, MA). Cells were seeded into 24-well plates. For the ECAR assay, the cells were washed and cultured in 500 μL XF Base Medium with L-glutamine (2 mM) and glucose (25 mM, the main substrate in aerobic glycolysis).
Mitochondrial function was analyzed by sequential injection of oligomycin and 2-deoxy-D-glucose (2-DG) (Shsolarbio, Shanghai, China). For the OCR assay, the cells were maintained in XF Base Medium followed by the sequential addition of oligomycin, FCCP, and Antimycin A/Rotenone (Sigma, Shanghai).18,19
Xenograft Model
Twenty-four 28 to 42-day-old female nude mice were purchased from the Institute of Laboratory Animals Science (Beijing, China) and separated into siNC and si-CPNE1 groups. HT29 cells were transfected with scrambled siRNA or CPNE1 siRNA (7 × 10⁶ cells, 100 μL) and subcutaneously inoculated into the right flank of each mouse of the siNC or si-CPNE1 group. Tumor growth was measured using a Vernier caliper and length × (width2/2) was used to calculate tumor size (mm3). Mice were sacrificed on day 33. Procedures involving animals and their care were approved by the ethics committee of the Shanghai Eighth People Hospital, Shanghai, China and conducted in compliance with guidelines by the International Council for Laboratory Animal Science and the institutional guidelines established for the Department of Laboratory Animal Research Facility at Shanghai Eighth People Hospital, Shanghai, China.
Patient-Derived Xenograft (PDX) Model
Fresh tumor samples and adjacent paracancerous tissues from CRC patients were collected into sterile tubes containing cold culture medium. All patients provided written informed consent. All procedures performed in studies involving human participants were in accordance with the ethical standards the Ethics Committee of Shanghai Eighth People Hospital, Shanghai, China and with the 1964 Helsinki declaration and its later amendments or comparable ethical standards.
Tumor samples were cut into small pieces (1–2 mm3) and injected subcutaneously into the right dorsal flank of NSG mice (Biocytogen, Haimen, Jiangsu). Tumor sizes were measured every 3 days. Mice with successfully established PDXs were denoted F0. When tumors reached approximately 600 mm3, the tumor tissues were collected, cut into small pieces (1–2 mm3), and re-implanted subcutaneously into other NSG mice to establish the next generation (F1). Mice with F2 tumors were used to evaluate the efficacy of oxaliplatin (L-OHP).
Statistical Analysis
GraphPad Prism software Version 7.0 (La Jolla CA, USA) was utilized for statistical analyses. All results were displayed as the mean ± SD for at least three samples. Comparisons between two groups were analyzed using a t-test, whereas comparisons among multiple groups were analyzed using a one-way analysis of with Tukey’s post hoc test. The statistical difference in patient survival was analyzed by using Log-rank (Mantel-Cox) test. A P-value < 0.05 indicated statistical significance.
Results
CPNE1 is Associated with Poor Survival in Patients with CRC
Quantitative RT-PCR was used to measure CPNE1 expression in both tumor tissue and adjacent normal tissue from CRC patients (Figure 1A). The results indicated that CPNE1 expression was sharply upregulated in tumors compared to that of adjacent tissues. Next, IHC staining results showed that the CPNE1 protein level was significantly higher in CRC tumor specimens as determined using a human CRC tissue array (Figure 1B). A data mining analysis for CPNE1 expression using Cancer Genome Atlas (TCGA) datasets and GEO datasets indicated that CPNE1 mRNA was markedly elevated in tumor tissues compared with non-tumor tissues (Figure 1C and D). Moreover, we have examined the prognostic role of CPNE1 in CRC using Kaplan-Meier analysis. As shown in Figure 1E, our results showed that the high level of CPNE1 was negatively associated with the survival rate of CRC patients (p < 0.001). Furthermore, CPNE1 expression correlated with tumor size, differentiation, metastasis, and WHO tumor grade (P = 0.0282, 0.0035, 0.011, 0.031, respectively) (Table 1).
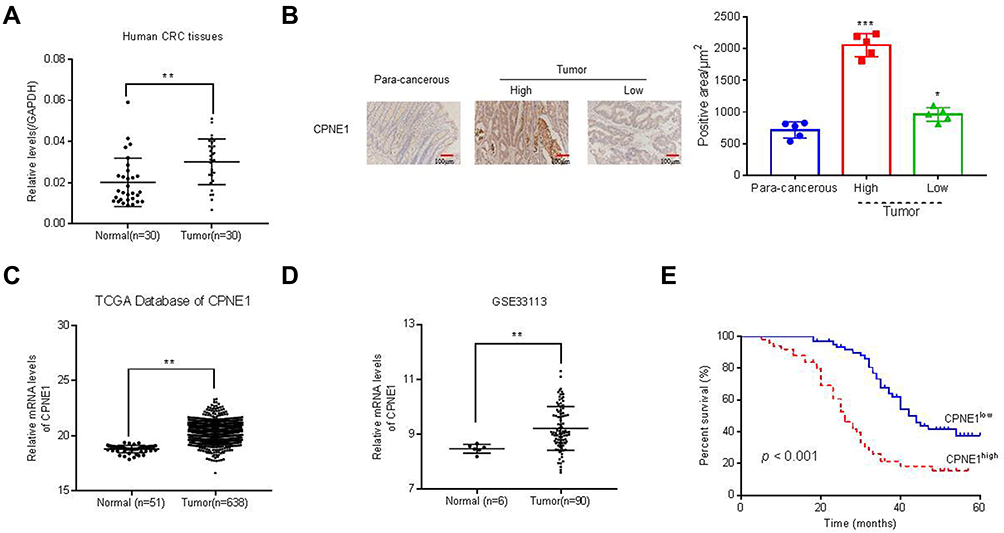 |
Figure 1 Expression of CPNE1 was enhanced in CRC tissues. (A) CPNE1 mRNA in tumor and normal tissues from CRC patients.**p < 0.01 vs normal. (B) IHC assay of CPNE1 protein levels in CRC tissue arrays including adjacent normal tissues (n=5) and CRC tissues (n = 105). *p < 0.05 vs para-cancerous, ***p < 0.001 vs para-cancerous. Correlation analyses between CPNE1 expression and survival of CRC patients. (C and D) mRNA level of CPNE1 from TCGA dataset (CRC: n = 638; healthy control: n = 51) and GEO dataset with accession number GSE33113 (CRC: n = 90, healthy control= 6). **p < 0.01 vs normal. (E) Kaplan–Meier survival curves showing the difference of survival time between patients with low and high expression of CPNE1 on CRC samples from 105 patients. ***p < 0.001. |
CPNE1 Promotes Proliferation, Inhibits Apoptosis, and Enhances Aerobic Glycolysis in CRC Cells
Small inferring RNAs (siRNA) specific to CPNE1 were used to knock down CPNE1 in Caco2 and HT29 cells and lentiviruses carrying CPNE1 were used to overexpress CPNE1 in LOVO cells. The overexpression or knockdown of CPNE1 was successful as confirmed by both qRT-PCR and Western blot analysis (Supplementary Figure 1). The CCK-8 kit was used to measure the proliferation of siNC, siCPNE1, vector control, and oeCPNE1 cells. The results indicated that CPNE1 KD remarkably inhibited the proliferation of Caco2 and HT29 compared with siNC. CPNE1 overexpression significantly increased the proliferation of LOVO CRC cells (Figure 2A). Flow cytometry revealed that CPNE1 KD promoted CRC cell apoptosis, whereas oeCPNE1 inhibited CRC apoptosis (Figure 2B). As shown in Figure 2C, the mitochondrial respiration of Caco2 and HT29 cells was inhibited by siCPNE1 as evidenced by reduced basal respiration, ATP-linked respiration, and maximal respiration. In contrast, respiration of LOVO cells was significantly enhanced by oeCPNE1 as evidenced by increased basal respiration, ATP-linked respiration, and maximal respiration. The ECAR results indicated that glycolytic flux and glycolytic capacity were significantly decreased by CPNE1 KD in Caco2 and HT29 cells, but significantly increased by oeCPNE1 in LOVO cells (Figure 2D).
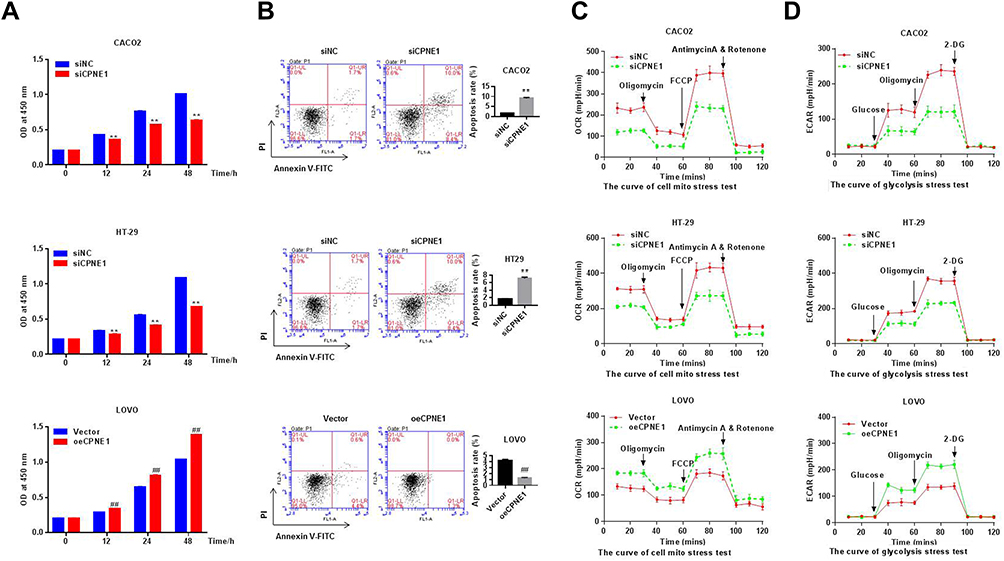 |
Figure 2 CPNE1 promoted proliferation, inhibited apoptosis and enhanced aerobic glycolysis in CRC cells. (A) CCK-8 analysis showed that CPNE1 KD inhibited CRC cell proliferation and oeCPNE1 promoted CRC cell proliferation. **p < 0.01 vs siNC; ##p < 0.01 vs Vector. (B) Flow cytometry results showed that siCPNE1 suppressed CRC cell proliferation but promoted CRC cell apoptosis. In contrast, oeCPNE1 inhibited CRC cell apoptosis. **p < 0.01 vs siNC; ##p < 0.01 vs Vector. (C) OCR results showed that CPNE1 KD compromised mitochondrial respiration capacity while overexpression of CPNE1 enhanced CRC cell mitochondrial respiration capacity. (D) siCPNE1 significantly decreased glycolytic capacity, while oeCPNE1 significantly increased glycolytic flux and glycolytic capacity in CRC cells. |
CPNE1 Activates the AKT-GLUT1/HK2 Pathway
As mentioned above, the AKT-GLUT1/HK2 pathway plays an important role in glycolysis. Thus, we examined whether CPNE1 expression affects the AKT-GLUT1/HK2 pathway. Western blot results indicated that CPNE1 KD caused a significant decrease in the levels of GLUT1, HK2, and phosphorylated AKT (p-AKT) proteins and a significant increase in cleaved Caspase 3 (c-Caspase 3) compared with siNC in both Caco2 (Figure 3A) and HT29 (Figure 3B) cells. CPNE1 overexpression in LOVO cells resulted in a significant increase in GLUT1, HK2, and p-AKT and a significant decrease in c-Caspase3 compared with the vector control (Figure 3C).
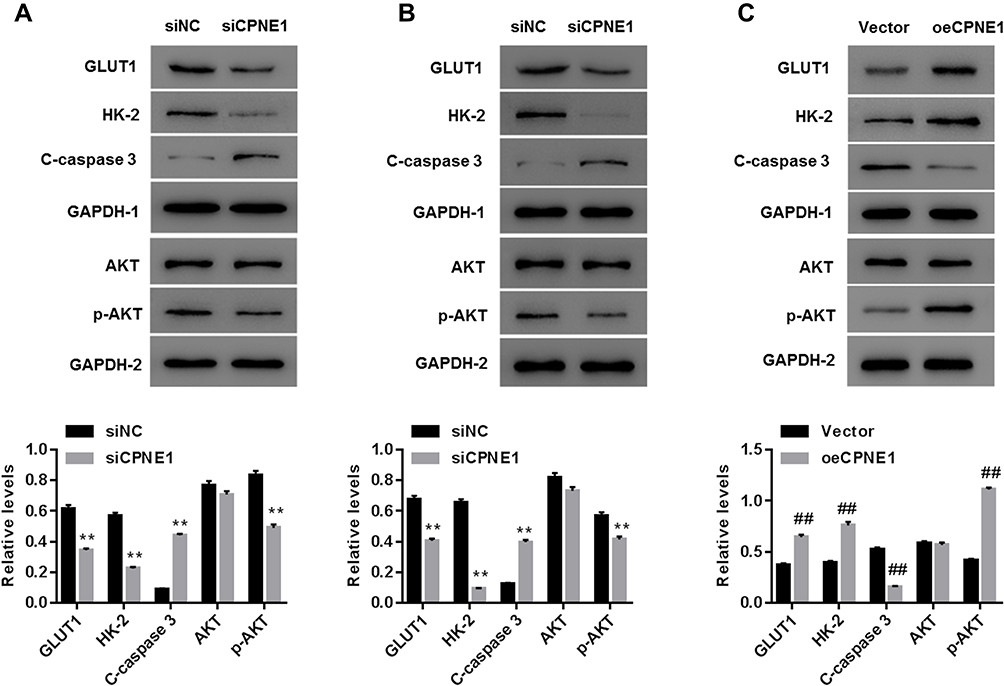 |
Figure 3 CPNE1 activated the AKT-GLUT1/HK2 pathway. Effect of CPNE1 KD on protein levels of AKT, p-AKT, GLUT1, HK2, c-Caspase 3 and GAPDH in Caco2 cells (A) and HT29 cells (B). **p < 0.01 vs siNC. Effect of CPNE1 overexpression on protein levels of AKT, p-AKT, GLUT1, HK2, and c-Caspase 3 in LOVO cells (C). A representative experiment out of three is shown here. ##p < 0.01 vs Vector. |
The PI3K/AKT Inhibitor LY294002 Abolishes the Function of CPNE1 in CRC Cells
To further assess the connection between CPNE1 and AKT in CRC cells, a PI3K/AKT inhibitor (LY294002) was used to silence the activity of AKT in oeNC or oeCPNE1 transfected cells.
As shown in Figure 4A, the proliferation of oeCPNE1 transfected cells was much higher compared with that of oeNC transfected cells, whereas LY294002 significantly suppressed this effect. Moreover, apoptosis of oeCPNE1 transfected cells was significantly upregulated in the presence of LY294002 (Figure 4B). Importantly, both the ORC and ECAR values in oeCPNE1 transfected cells were sharply decreased after coculturing with LY294002 (Figure 4C and D). Furthermore, LY294002 inhibited p-AKT protein in oeNC or oeCPNE1 transfected cells and did not affect the expression of the CPNE1 protein. Interestingly, both the GLUT1 and HK2 protein levels were significantly suppressed in oeNC or oeCPNE1 transfected cells in the presence of LY294002, which was in contrast to the levels of cleaved Caspase-3 (Figure 4E). Collectively, these results indicate that the PI3K/AKT inhibitor, LY294002, disrupts the function of CPNE1 in CRC cells.
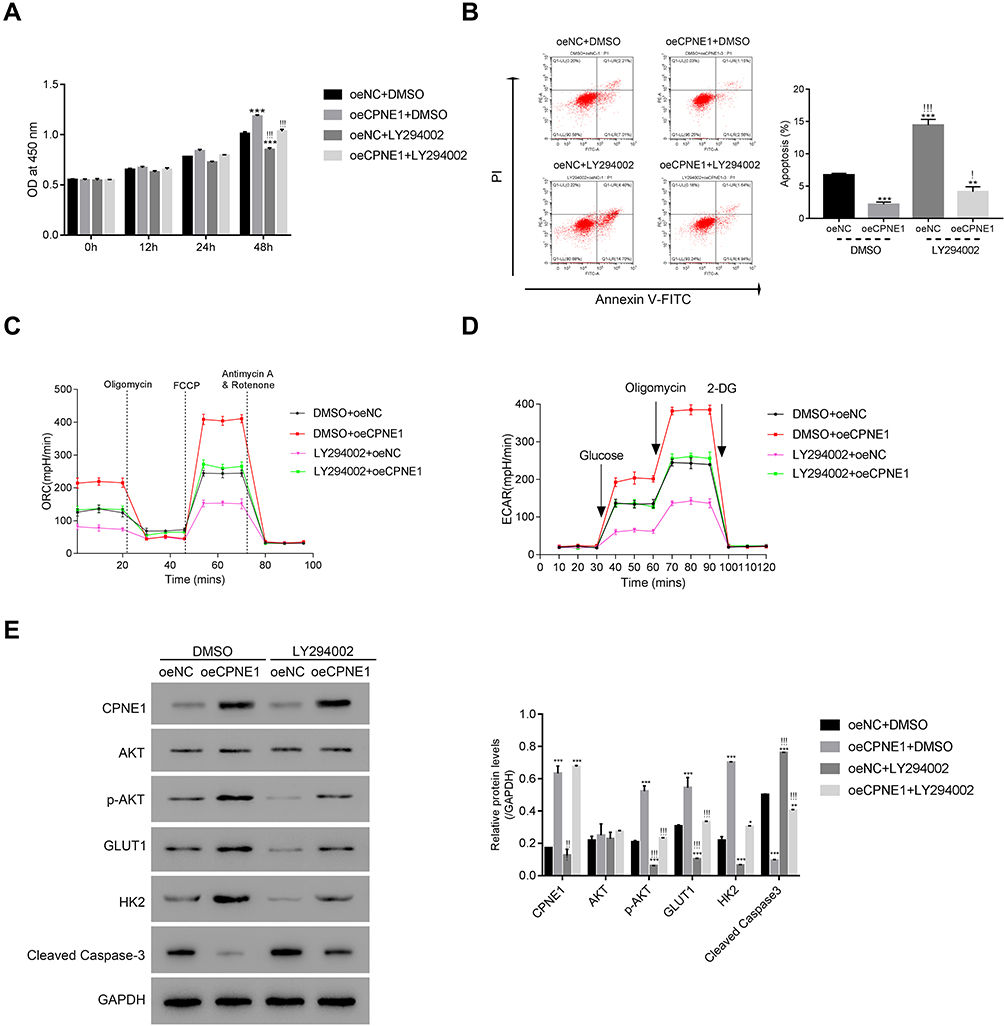 |
Figure 4 The PI3K/AKT inhibitor LY294002 abolished the function of CPNE1 in CRC cells. (A and B) CCK-8 assay and flow cytometer were used to examine the proliferation of oeNC or oeCPNE1 transfected cells with or without the treatment of the PI3K/AKT inhibitor LY294002. **p < 0.01 vs oeNC + DMSO, ***p < 0.001 vs oeNC + DMSO; !p < 0.05 vs oeCPNE1+DMSO, !!!p < 0.001 vs oeCPNE1+DMSO. (C and D) Glycolysis and mitochondrial respiration were quantified by examining the values of OCR and ECAR values in cells as indicated above. (E) Western blot was used to determine the protein contents of CPNE1, AKT, p-AKT, GLUT1, HK2 and Cleaved Caspase-3 in different cells as indicated. *p <0.05 vs oeNC + DMSO, **p<0.01 vs oeNC + DMSO, ***p < 0.001 vs oeNC + DMSO; !!p < 0.01 vs oeCPNE1+DMSO, !!!p < 0.001 vs oeCPNE1+DMSO. |
A total of 30 pairs of CRC tumor and adjacent paracancerous tissues were used to examine the relative expression of CPNE1 and AKT mRNA. Both genes were upregulated in CRC tumor tissues compared with normal tissues (Figure 5A). A correlation analysis revealed a positive correlation between CPNE1 and AKT expression in CRC tissues (Figure 5B). These results suggest that CPNE1 is involved in the same pathway as AKT in CRC cells.
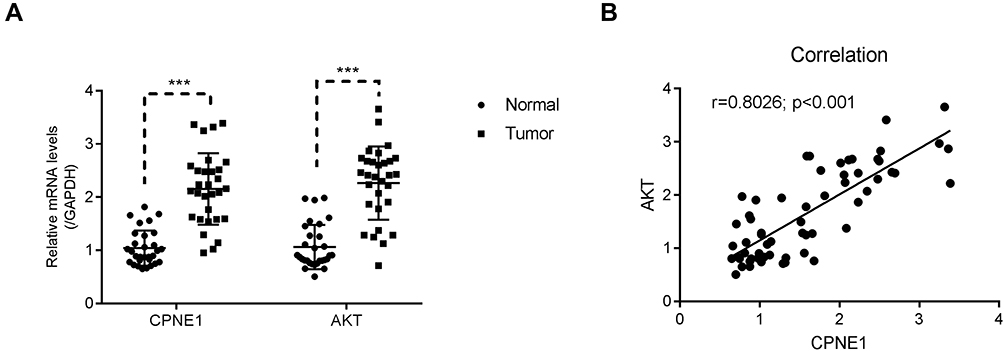 |
Figure 5 CPNE1 was positively correlated with AKT in human CRC tissues. (A) qRT-PCR was used to examine the relative mRNA levels of CPNE1 and AKT in human CRC tissues and adjacent precancerous tissues (n = 30 for each group), ***p < 0.001 vs Normal. (B) Correlation analyses between CPNE1 and AKT in human CRC tissues. |
CPNE1 Knockdown Reduces Tumor Growth by Inhibition Through the AKT-GLUT1/HK2 Pathway
The role of CPNE1 in tumor growth in vivo was evaluated using a mouse xenograft model. As shown in Figure 4A, CPNE1 KD markedly inhibited tumor growth in mice. All mice injected with siNC HT29 cells developed visibly larger tumors compared with those implanted with siCPNE1 HT29 cells (Figure 6A). The average tumor mass in control mice was approximately three times larger compared with those from mice implanted with siCPNE1 HT29 cells (Figure 6B). A TUNEL assay revealed that tumors from mice inoculated with siCPNE1 HT29 cells exhibited a significantly higher proportion of apoptotic cells compared with tumors from mice inoculated with siNC HT29 cells (Figure 6C). Proteins extracts were prepared from the tumor tissues and used to measure the levels of CPNE1, AKT, p-AKT, GLUT1, HK2 and C-Caspase3 protein by Western blot analysis. As shown in Figure 6D, siCPNE1 resulted in a significant decrease in the levels of CPNE1, GLUT1, HK2, and p-AKT protein and a marked increase in c-Caspase 3 compared with the siNC group.
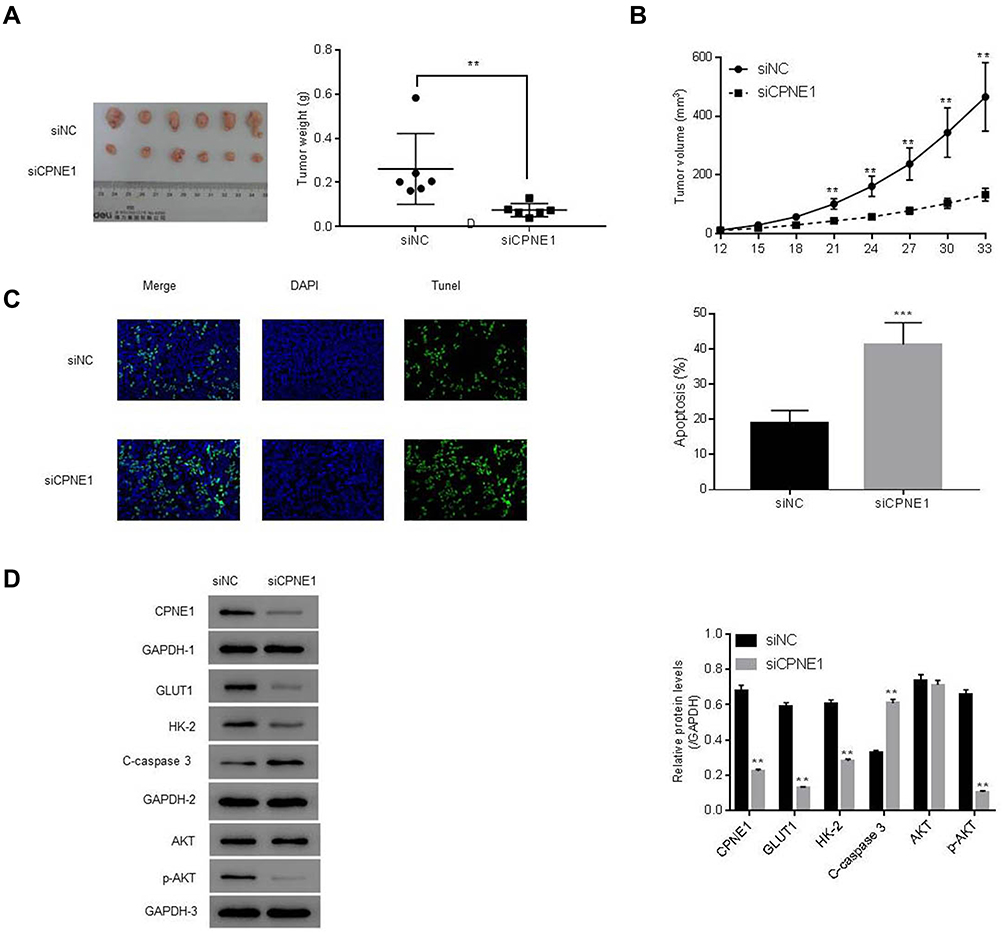 |
Figure 6 CPNE1 KD inhibited tumorigenesis via suppression of the AKT-GLUT1/HK2 pathway. Animals were inoculated with HT29 cells carrying siNC or siCPNE1 (7 × 10⁷ cells). (A) Tumors in each group on day 33. **p < 0.01 vs siNC. (B) Weight of tumors (gram) at day 33 and tumor volume (mm3) from day 12 to day 33, **p < 0.01 vs siNC. (C) Analysis of apoptosis in tumor tissues. ***p < 0.01 vs siNC. (D) Protein levels of CPNE1, AKT, p-AKT, GLUT1, HK2 and C-Caspase3 in tumor tissues. **p < 0.01 vs siNC. |
CPNE1 Regulates Chemosensitivity in CRC
CPNE1 levels in 10 colorectal tumors were measured by Western blot analysis (Figure 7A). To establish a PDX model, the 10 CRC tissues were separated into two groups based on protein expression: a low-CPNE1 [CPNE1(L)] and a high-CPNE1 group [CPNE1(H)]. The mice were then treated with oxaliplatin (L-OHP) at a dose of 5 mg/kg/d for 21 successive days. Tumor volumes and weights were recorded. As shown in Figure 7B–D, compared with CPNE1(L), CPNE1(H) exhibited larger tumors. Tumor volume and weight were inhibited, whereas tumor apoptosis was enhanced in the CPNE1(L) + L-OHP group when compared with that in the CPNE1(H) + L-OHP group. Moreover, the level of CPNE1 protein was significantly decreased by L-OHP in CPNE1(L) and CPNE1(H) tumors. The phosphorylation of AKT was also downregulated in the presence of L-OHP. Importantly, L-OHP also significantly decreased GLUT1 and HK2 protein expression in CPNE1(L) and CPNE1(H) tumors, whereas the expression of cleaved Caspase-3 increased (Figure 7E). HT29-siNC, HT29-siCPNE1, LOVO-vector, and LOVO-oeCPNE1 cells were treated with either a low (L, 64 μM) or high (H, 128 μM) dose of L-OHP. Flow cytometry revealed that CPNE1 KD increased the sensitivity of CRC cells to L-OHP, whereas oeCPNE1 decreased CRC cell sensitivity to L-OHP (Supplementary Figure 2).
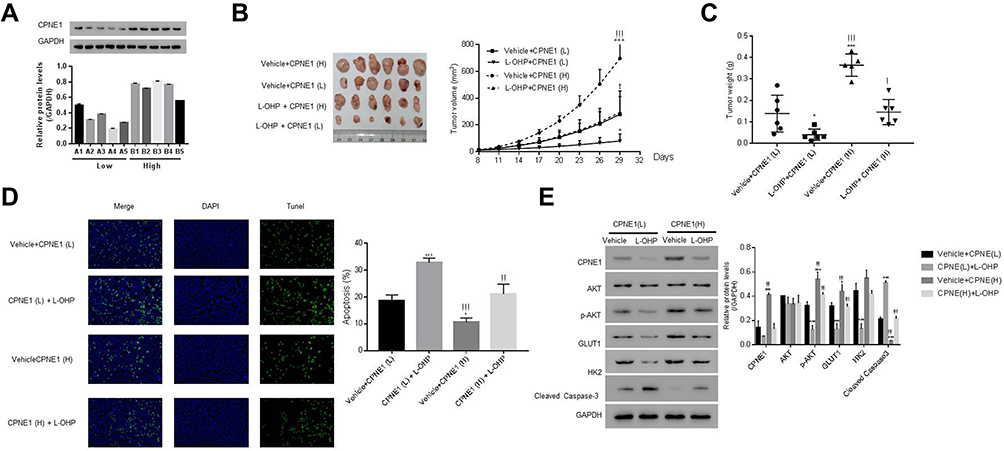 |
Figure 7 CPNE1 confers CRC chemo-resistance and CPNE1 knockdown enhanced the sensitivity of CRC cells to oxaliplatin. (A) Protein levels of CPNE1 in 10 CRC tumor tissues. NSG mice were subcutaneously injected with tumors having low CPNE1 expression [CPNE1 (L), n = 5, A1-A5] and tumors having high CPNE1 expression [CPNE1 (H), n = 5, B1-B5]. All mice received L-OHP (5 mg/kg/d) one week after inoculation for 21 successive days. (B) Tumor formation on day 29; *p < 0.05 vs Vehicle + CPNE(L), ***p < 0.001 vs Vehicle + CPNE(L); !p < 0.05 vs L-OHP + CPNE(L), !!!p<0.001 vs L-OHP + CPNE(L). (C) Tumor weight (g) on day 29 and tumor volume (mm3) from day 8 to day 29. *p < 0.05 vs Vehicle + CPNE(L), ***p < 0.001 vs Vehicle + CPNE(L); !p < 0.05 vs L-OHP + CPNE(L), !!!p < 0.001 vs L-OHP + CPNE(L). (D) TUNEL analysis of apoptosis in tumor tissues. *p < 0.05 vs Vehicle + CPNE(L), ***p<0.001 vs Vehicle + CPNE(L), !!p < 0.001 vs L-OHP + CPNE(L), !!!p < 0.001 vs L-OHP + CPNE(L). (E) Protein levels of CPNE1, AKT, p-AKT, GLUT1, HK2, Cleaved Caspase-3 in different tumors as indicated above. *p < 0.05 vs Vehicle + CPNE(L), ***p < 0.001 vs Vehicle + CPNE(L), !!!p < 0.001 vs L-OHP + CPNE(L). |
Discussion
CPNE1 is an evolutionarily highly-conserved protein that exhibits a broad tissue distribution, including expression in the lung, heart, liver, kidney, and colorectum.6,7,20–23 CPNE1 expression is significantly upregulated in various cancers including lung carcinoma, prostatic adenocarcinoma, mammary carcinoma, and osteosarcoma. CPNE1 also regulates tumorigenesis and correlates with the survival of lung and prostate cancer patients.7–9,24,25 However, its role in CRC is unclear. The present study showed that CPNE1 was overexpressed in CRC tissues and promoted CRC progression. This not only provided insight into the role of CPNE1 in cancer, but also broadened our understanding of CRC biology.
It has been reported that glucose uptake and glycolysis are increased in cancer cells26 because cancer cells metabolize glucose via glycolysis, but not mitochondrial oxidative phosphorylation, even in the presence of sufficient oxygen.27,28 GLUT1, a high-affinity glucose transporter found in almost every tissue, regulates glucose transmembrane transport which is a rate-limiting step in glycolysis.29,30 Another enzyme, HK2, controls the glycolysis pathway by adding a phosphate group to glucose31,32 to regulate glucose flux within cells, which is tightly associated with tumor initiation and maintenance.33 Studies also showed that AKT signaling is a key pathway that not only controls the metabolism of hexose by HK2, but also regulates cellular growth via GLUT1.34–37 Interestingly, CPNE1 has been shown to activate AKT signaling by phosphorylating residue 473 of AKT and subsequent AKT activation inhibits apoptosis in cancer cells.11,38 In this study, we showed that silencing of CPNE1 suppressed glycolysis by downregulating p-AKT, GLUT1, and HK2, leading to decreased proliferation and enhanced apoptosis of CRC cells. Our data reveal a new role for CPNE1 in CRC by showing that CPNE1 silencing-induced inhibition of AKT signaling not only caused downregulation of GLUT1 to control cellular glucose uptake, but also decreased the expression of HK2 to limit glucose capture, resulting in the inhibition of glycolysis. Because glycolysis is increased in cancer cells and glucose is mainly metabolized by glycolysis in cancer cells, these findings are of significant importance in identifying new treatments for CRC through the regulation of cancer cell metabolism. Although most of this study was performed with cells, verification of these findings using clinical specimens will provide a better understanding of the CPNE1/AKT-GLUT1/HK2 axis in CRC.
Chemotherapeutic agents such as capecitabine, 5-fluorouracil (5-FU), oxaliplatin (FOLFOX), and irinotecan (FOLFIRI) have been used for CRC treatment over the last few decades.39,40 Although chemotherapy provides numerous therapeutic benefits, it is limited by the occurrence of chemoresistance. Elevated glycolysis of cancer cells has been shown to be involved in chemo- and radio-therapy resistance.41 Furthermore, the promotion of aerobic glycolysis by Akt signaling renders cancer cells resistant to irradiation.42 Our findings revealed that tumors with low levels of CPNE1 are more sensitive to L-OHP treatment. Because cancer chemotherapeutic drug resistance is a major limitation to the success of cancer therapy,43 our results may lead to the development of new therapeutics for chemoresistant CRC. They also suggest that inhibiting CPNE1 expression represents an effective strategy to enhance the chemosensitivity of CRC cells. Although further investigations are needed, this study identifies a potential approach for enhancing the chemosensitivity of CRC cells.
Conclusions
Taken together, the findings of the present study indicate for the first time that CPNE1 promotes CRC progression by activating the AKT/GLUT1/HK2 cascade to enhance chemoresistance.
Acknowledgments
Co-first authors: Yuexia Wang and Shengli Pan. Co-corresponding author: Shengli Pan.
Funding
This research was financially supported by the Medical Science and Technology Project of Xuhui District (NO.SHXH201704) and Shanghai municipal commission of health and family planning (No.201740229).
Disclosure
The authors report no conflicts of interest for this work.
References
1. Torre LA, Bray F, Siegel RL, Ferlay J, Lortet-Tieulent J, Jemal A. Global cancer statistics, 2012. CA Cancer J Clin. 2015;65(2):87–108. doi:10.3322/caac.21262
2. Johnson CM, Wei C, Ensor JE, et al. Meta-analyses of colorectal cancer risk factors. Cancer Causes Control. 2013;24(6):1207–1222. doi:10.1007/s10552-013-0201-5
3. Yu IS, Cheung WY. Metastatic colorectal cancer in the era of personalized medicine: a more tailored approach to systemic therapy. Can J Gastroenterol Hepatol. 2018;2018:9450754. doi:10.1155/2018/9450754
4. Xie YH, Chen YX, Fang JY. Comprehensive review of targeted therapy for colorectal cancer. Signal Transduct Target Ther. 2020;5(1):22.
5. Moghimi-Dehkordi B, Safaee A. An overview of colorectal cancer survival rates and prognosis in Asia. World J Gastrointest Oncol. 2012;4(4):71–75. doi:10.4251/wjgo.v4.i4.71
6. Creutz CE, Tomsig JL, Snyder SL, et al. The copines, a novel class of C2 domain-containing, calcium-dependent, phospholipid-binding proteins conserved from Paramecium to humans. J Biol Chem. 1998;273(3):1393–1402. doi:10.1074/jbc.273.3.1393
7. Liu S, Tang H, Zhu J, et al. High expression of Copine 1 promotes cell growth and metastasis in human lung adenocarcinoma. Int J Oncol. 2018;53(6):2369–2378. doi:10.3892/ijo.2018.4558
8. Liang J, Zhang J, Ruan J, et al. CPNE1 is a useful prognostic marker and is associated with TNF receptor-associated factor 2 (TRAF2) expression in prostate cancer. Med Sci Monitor. 2017;23:5504–5514. doi:10.12659/MSM.904720
9. Jiang Z, Jiang J, Zhao B, et al. CPNE1 silencing inhibits the proliferation, invasion and migration of human osteosarcoma cells. Oncol Rep. 2018;39(2):643–650. doi:10.3892/or.2017.6128
10. Robey RB, Hay N. Is Akt the “Warburg kinase”?-Akt-energy metabolism interactions and oncogenesis. Semin Cancer Biol. 2009;19(1):25–31. doi:10.1016/j.semcancer.2008.11.010
11. Park N, Yoo JC, Lee YS, et al. Copine1 C2 domains have a critical calcium-independent role in the neuronal differentiation of hippocampal progenitor HiB5 cells. Biochem Biophys Res Commun. 2014;454(1):228–233. doi:10.1016/j.bbrc.2014.10.075
12. Abdel-Wahab AF, Mahmoud W, Al-Harizy RM. Targeting glucose metabolism to suppress cancer progression: prospective of anti-glycolytic cancer therapy. Pharmacol Res. 2019;150:104511. doi:10.1016/j.phrs.2019.104511
13. Li H, Lan J, Wang G, et al. KDM4B facilitates colorectal cancer growth and glucose metabolism by stimulating TRAF6-mediated AKT activation. J Exp Clini Cancer Res. 2020;39(1):12. doi:10.1186/s13046-020-1522-3
14. Zhao X, Lu C, Chu W, et al. MicroRNA-124 suppresses proliferation and glycolysis in non-small cell lung cancer cells by targeting AKT-GLUT1/HKII. Tumour Biol. 2017;39(5):1010428317706215.
15. Yoon SO, Jeon TJ, Park JS, et al. Analysis of the roles of glucose transporter 1 and hexokinase 2 in the metabolism of glucose by extrahepatic bile duct cancer cells. Clin Nucl Med. 2015;40(3):e178–182. doi:10.1097/RLU.0000000000000640
16. Weng ML, Chen WK, Chen XY, et al. Fasting inhibits aerobic glycolysis and proliferation in colorectal cancer via the Fdft1-mediated AKT/mTOR/HIF1alpha pathway suppression. Nat Commun. 2020;11(1):1869. doi:10.1038/s41467-020-15795-8
17. Park N, Yoo JC, Ryu J, Hong SG, Hwang EM, Park JY. Copine1 enhances neuronal differentiation of the hippocampal progenitor HiB5 cells. Mol Cells. 2012;34(6):549–554. doi:10.1007/s10059-012-0235-7
18. Decleer M, Jovanovic J, Vakula A, et al. Oxygen consumption rate analysis of mitochondrial dysfunction caused by bacillus cereus cereulide in Caco-2 and HepG2 cells. Toxins. 2018;10(7):266. doi:10.3390/toxins10070266
19. Pike Winer LS, Wu M, Sobol RW. Rapid analysis of glycolytic and oxidative substrate flux of cancer cells in a microplate. PLoS One. 2014;9(10):e109916. doi:10.1371/journal.pone.0109916
20. Yang W, Ng P, Zhao M, Wong TK, Yiu SM, Lau YL. Promoter-sharing by different genes in human genome–CPNE1 and RBM12 gene pair as an example. BMC Genom. 2008;9:456. doi:10.1186/1471-2164-9-456
21. Cowland JB, Carter D, Bjerregaard MD, Johnsen AH, Borregaard N, Lollike K. Tissue expression of copines and isolation of copines I and III from the cytosol of human neutrophils. J Leukoc Biol. 2003;74(3):379–388. doi:10.1189/jlb.0203083
22. Tomsig JL, Creutz CE. Biochemical characterization of copine: a ubiquitous Ca2+-dependent, phospholipid-binding protein. Biochemistry. 2000;39(51):16163–16175. doi:10.1021/bi0019949
23. Rospo G, Lorenzato A, Amirouchene-Angelozzi N, et al. Evolving neoantigen profiles in colorectal cancers with DNA repair defects. Genome Med. 2019;11(1):42. doi:10.1186/s13073-019-0654-6
24. Shao Z, Ma X, Zhang Y, et al. CPNE1 predicts poor prognosis and promotes tumorigenesis and radioresistance via the AKT singling pathway in triple-negative breast cancer. Mol Carcinog. 2020;59(5):533–544. doi:10.1002/mc.23177
25. Tang H, Zhu J, Du W, et al. CPNE1 is a target of miR-335-5p and plays an important role in the pathogenesis of non-small cell lung cancer. J Exp Clini Cancer Res. 2018;37(1):131. doi:10.1186/s13046-018-0811-6
26. Chen Y, Zhao J, Li D, et al. TRIM56 suppresses multiple myeloma progression by activating TLR3/TRIF signaling. Yonsei Med J. 2018;59(1):43–50. doi:10.3349/ymj.2018.59.1.43
27. Zheng J. Energy metabolism of cancer: glycolysis versus oxidative phosphorylation (Review). Oncol Lett. 2012;4(6):1151–1157. doi:10.3892/ol.2012.928
28. Akram M. Mini-review on glycolysis and cancer. J Cancer Educ. 2013;28(3):454–457. doi:10.1007/s13187-013-0486-9
29. Fan R, Hou WJ, Zhao YJ, et al. Overexpression of HPV16 E6/E7 mediated HIF-1alpha upregulation of GLUT1 expression in lung cancer cells. Tumour Biol. 2016;37(4):4655–4663. doi:10.1007/s13277-015-4221-5
30. Sasaki H, Shitara M, Yokota K, et al. Overexpression of GLUT1 correlates with Kras mutations in lung carcinomas. Mol Med Rep. 2012;5(3):599–602. doi:10.3892/mmr.2011.736
31. Lv X, Yao L, Zhang J, Han P, Li C. Inhibition of microRNA-155 sensitizes lung cancer cells to irradiation via suppression of HK2-modulated glucose metabolism. Mol Med Rep. 2016;14(2):1332–1338. doi:10.3892/mmr.2016.5394
32. Fang R, Xiao T, Fang Z, et al. MicroRNA-143 (miR-143) regulates cancer glycolysis via targeting hexokinase 2 gene. J Biol Chem. 2012;287(27):23227–23235. doi:10.1074/jbc.M112.373084
33. Vander Heiden MG, Cantley LC, Thompson CB. Understanding the Warburg effect: the metabolic requirements of cell proliferation. Science. 2009;324(5930):1029–1033. doi:10.1126/science.1160809
34. Allen KT, Chin-Sinex H, DeLuca T, et al. Dichloroacetate alters Warburg metabolism, inhibits cell growth, and increases the X-ray sensitivity of human A549 and H1299 NSC lung cancer cells. Free Radic Biol Med. 2015;89:263–273. doi:10.1016/j.freeradbiomed.2015.08.006
35. Mandai M, Amano Y, Yamaguchi K, Matsumura N, Baba T, Konishi I. Ovarian clear cell carcinoma meets metabolism; HNF-1beta confers survival benefits through the Warburg effect and ROS reduction. Oncotarget. 2015;6(31):30704–30714. doi:10.18632/oncotarget.5228
36. Hou X, Liu Y, Liu H, et al. PERK silence inhibits glioma cell growth under low glucose stress by blockage of p-AKT and subsequent HK2’s mitochondria translocation. Sci Rep. 2015;5:9065. doi:10.1038/srep09065
37. Neary CL, Pastorino JG. Akt inhibition promotes hexokinase 2 redistribution and glucose uptake in cancer cells. J Cell Physiol. 2013;228(9):1943–1948. doi:10.1002/jcp.24361
38. Lewinska A, Adamczyk-Grochala J, Kwasniewicz E, Deregowska A, Wnuk M. Ursolic acid-mediated changes in glycolytic pathway promote cytotoxic autophagy and apoptosis in phenotypically different breast cancer cells. Apoptosis. 2017;22(6):800–815. doi:10.1007/s10495-017-1353-7
39. Cortejoso L, Lopez-Fernandez LA. Pharmacogenetic markers of toxicity for chemotherapy in colorectal cancer patients. Pharmacogenomics. 2012;13(10):1173–1191. doi:10.2217/pgs.12.95
40. Kelly H, Goldberg RM. Systemic therapy for metastatic colorectal cancer: current options, current evidence. J Clin Oncol. 2005;23(20):4553–4560. doi:10.1200/JCO.2005.17.749
41. Zhao Y, Butler EB, Tan M. Targeting cellular metabolism to improve cancer therapeutics. Cell Death Dis. 2013;4:e532. doi:10.1038/cddis.2013.60
42. Shimura T, Noma N, Sano Y, et al. AKT-mediated enhanced aerobic glycolysis causes acquired radioresistance by human tumor cells. Radiother Oncol. 2014;112(2):302–307. doi:10.1016/j.radonc.2014.07.015
43. Alfarouk KO, Stock CM, Taylor S, et al. Resistance to cancer chemotherapy: failure in drug response from ADME to P-gp. Cancer Cell Int. 2015;15:71.
 © 2021 The Author(s). This work is published and licensed by Dove Medical Press Limited. The full terms of this license are available at https://www.dovepress.com/terms.php and incorporate the Creative Commons Attribution - Non Commercial (unported, v3.0) License.
By accessing the work you hereby accept the Terms. Non-commercial uses of the work are permitted without any further permission from Dove Medical Press Limited, provided the work is properly attributed. For permission for commercial use of this work, please see paragraphs 4.2 and 5 of our Terms.
© 2021 The Author(s). This work is published and licensed by Dove Medical Press Limited. The full terms of this license are available at https://www.dovepress.com/terms.php and incorporate the Creative Commons Attribution - Non Commercial (unported, v3.0) License.
By accessing the work you hereby accept the Terms. Non-commercial uses of the work are permitted without any further permission from Dove Medical Press Limited, provided the work is properly attributed. For permission for commercial use of this work, please see paragraphs 4.2 and 5 of our Terms.