Back to Journals » Diabetes, Metabolic Syndrome and Obesity » Volume 17
Correlation Between Serum Vitamin E and HOMA-IR in Patients with T2DM
Authors Zhang J, Hou Y, Zhang Z, Shi Y, Wang Z, Song G
Received 5 December 2023
Accepted for publication 27 March 2024
Published 23 April 2024 Volume 2024:17 Pages 1833—1843
DOI https://doi.org/10.2147/DMSO.S450738
Checked for plagiarism Yes
Review by Single anonymous peer review
Peer reviewer comments 4
Editor who approved publication: Dr Konstantinos Tziomalos
Jing Zhang,1,2 Yilin Hou,1 Zhaozi Zhang,1 Yihe Shi,1 Zhimin Wang,1 Guangyao Song1,2
1Department of Internal Medicine, Graduate School of Hebei Medical University, Shijiazhuang, Hebei, People’s Republic of China; 2Department of Endocrinology, Hebei General Hospital, Shijiazhuang, Hebei, People’s Republic of China
Correspondence: Guangyao Song; Jing Zhang, Email [email protected]; [email protected]
Background: Peroxidation is one of the important causes of insulin resistance (IR), and vitamin E is a natural antioxidant, and there may be some correlation between serum vitamin E levels and insulin resistance.
Purpose: The correlation between serum vitamin E and insulin resistance in type 2 diabetes mellitus (T2DM) population.
Methods: Two hundred and forty-two people (119 with T2DM) were included. One hundred and nineteen patients with T2DM were selected as the case group, and 123 people with non-T2DM were selected as the control group. People insulin resistance was detected by the homeostasis model assessment method (HOMA-IR) greater than 2.69 were included in the diabetic insulin resistance group, and those with HOMA-IR less than 2.69 were included in the diabetic non-insulin resistance group. Record the general body indicators, biochemical indicators, hepatic function indicators, vitamin E, and other indicators. Correlation analysis, logistic regression, trend analysis, and restricted cubic spline (RCS) were performed using SPSS 25.0 and R 4.1.1 software. Correlation analysis, logistic regression, trend analysis, restricted cubic spline (RCS) analysis were conducted on general body indicators, biochemical indicators, hepatic function indicators, vitamin E, and other indicators.
Results: The logistic regression results showed that after adjusting for confounding factors, vitamin E was an independent influencing factor for insulin resistance in T2DM patients (P < 0.001). The trend analysis results show that with the decrease of serum vitamin E levels, the risk of insulin resistance in T2DM patients gradually increases. The RCS results showed that the risk of insulin resistance was significantly increased when the serum vitamin E level was lower than 10,575.23 ng/mL.
Conclusion: Serum vitamin E levels are lower in T2DM patients than in healthy populations; Vitamin E is an independent influencing factor for HOMA-IR in T2DM patients. The risk of insulin resistance gradually increases in T2DM patients as serum vitamin E levels decrease. Vitamin E is a risk factor for insulin resistance at serum vitamin E levels below 10,575.23 ng/mL. At higher serum vitamin E levels than 10,575.23 ng/mL, vitamin E is a protective factor for insulin resistance.
Keywords: Vitamin E, type 2 diabetes mellitus, insulin resistance, oxidative stress
A Letter to the Editor has been published for this article.
Introduction
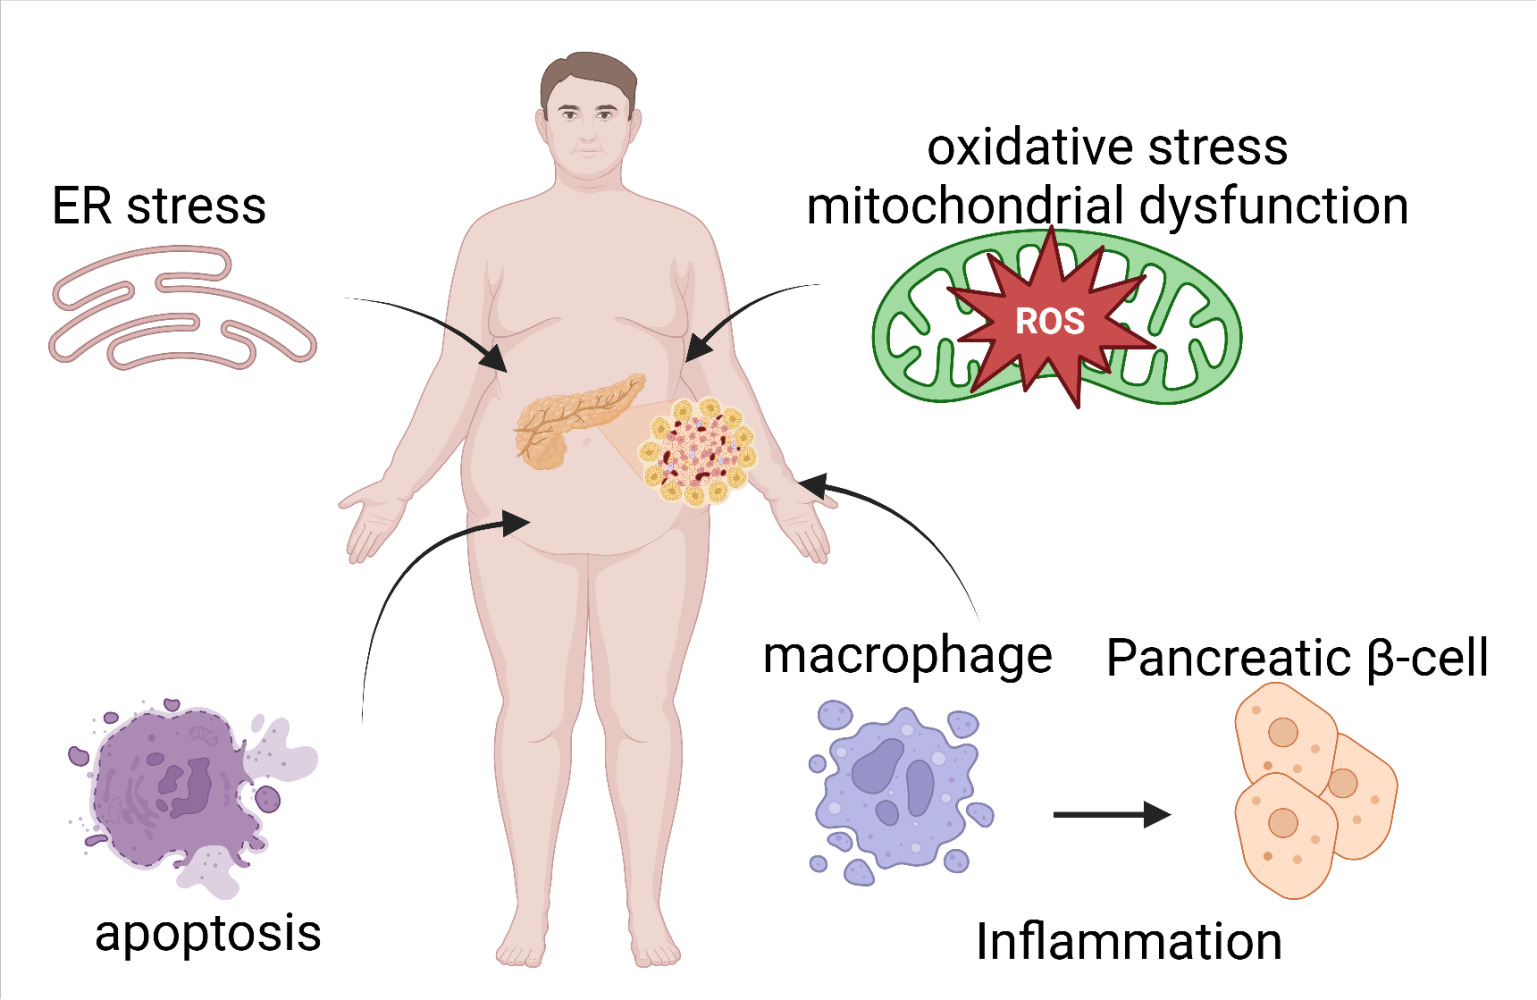
At present, the number of people with diabetes in the world is about 468 million.1 By 2030, there will be 643 million people suffering from diabetes in the world, and it will increase to 783 million by 2045. Diabetes has become a serious public health problem.2 T2DM is the most prevalent metabolic disorder and is associated with an increased3–5 risk of cardiovascular disease (CVD), chronic kidney disease, retinopathy, and mortality. It is characterized by chronic hyperglycemia and an inadequate response of peripheral tissues to circulating insulin, leading to insulin resistance.6,7 Insulin resistance has a complex pathophysiology, and it is contributed by multiple factors, including oxidative stress. Oxidative stress refers to the imbalance between free radical production and antioxidant systems, which leads to decreased peripheral insulin sensitivity, produces insulin resistance, and promotes the development8–10 of T2DM through a variety of molecular mechanisms. Vitamin E is a potent antioxidant composed of two classes of compounds: tocopherols and tocotrienols, which protect cells and tissues from oxidative damage.11–15 Since oxidative stress is a key factor in insulin resistance, the antioxidant capacity of vitamin E improves the level of insulin resistance, which in turn affects blood glucose levels.16–20 This article analyzed the serum vitamin E level in patients with T2DM and explored the correlation between serum vitamin E and insulin resistance in T2DM patients.
Materials and Methods
Study Population
A total of 242 patients in the wards and physical examination center of Hebei General Hospital were selected. Among them, 119 patients with T2DM in the endocrinology ward were selected as the case group, and 123 patients without T2DM in the physical examination center were selected as the control group. The basic information and serum vitamin E levels of the included subjects were recorded.
The diagnostic criteria of type 2 diabetes mellitus, according to the Chinese Guidelines for the Prevention and Treatment of Type 2 diabetes mellitus (2020):
① Typical diabetic symptoms (polydipsia, polyuria, polyphagia, unexplained weight loss);
② random blood glucose ≥11.1 mmol/L; Or OGTT2h blood glucose ≥11.1 mmol/L;
③ or fasting blood glucose ≥7.0 mmol/L;
④ or HbA1c ≥ 6.5%;
⑤ Patients without typical symptoms of diabetes should be rechecked another day.
Random blood glucose refers to blood glucose at any time of the day regardless of the last meal time. It cannot be used to diagnose impaired fasting glucose or impaired glucose tolerance. A fasting state is defined as at least 8 hours without eating calories.
Inclusion Criteria
- Adults aged 18–75 years with normal communication ability.
- those who met the diagnostic criteria for T2DM.
Exclusion Criteria
- Patients with serious cardiac, liver, kidney, and other complications or combined with other serious primary diseases or mental patients.
- patients with acute complications, such as diabetic ketoacidosis, coma, and lactic acidosis in the past 1 month.
- pregnant and lactating women.
- type 1 or other types of diabetes.
Compliance with any of the above can be excluded.
Clinical Assessment and Biochemical Measurements
All subjects included in this experiment were fasted for 8–12 hours, and venous blood was taken in the morning. Blood samples were stored in refrigerated containers, centrifuged within 1 hour after collection, and determined by HitWChi 7600 automatic biochemical analyzer from Hitachi. The detection indicators include FBG, fasting insulin (FINS), glycosylated hemoglobin (HbA1c), glualanine transaminase (ALT), glutenase transaminase (AST), total cholirubin (TBIL), direct bilirubin (DBIL), indirect bilirubin (IBIL), glomerular filtration rate (GFR), serum creatinine (Scr), serum total protein (TP), serum albumin (ALB), total cholesterol (TC), triglyceride (TG), high-density lipoprotein cholesterol (HDL), low-density lipoprotein cholesterol (LDL), and vitamin E. Human serum vitamin E level was measured by liquid chromatography tandem mass spectrometry (LC-MS/MS).
Calculation of Parameter


Statistical Analysis
SPSS statistical software was used to process the data. First, the data were checked to see if they were normally distributed. If the data did not conform to the normal distribution, the rank sum test was used.
The factors with P < 0.05 in the results of rank sum test or t-test were further correlated with vitamin E to explore the correlation between multiple indicators. Linear correlation was used if the data conformed to normal distribution. If the data did not conform to the normal distribution, rank correlation analysis was used. If Sig (two-tailed) was less than 0.05, it was considered to be related to vitamin E.
The value of Sig (two-tailed) <0.05 in the correlation analysis of vitamin E and SIG (two-tailed) was used as the covariate, and insulin resistance (HOMA-IR > 2.69) was used as the dependent variable. Binary multivariate Logistic regression analysis was performed, and P < 0.05 was considered statistically significant.
Trend test was used to analyze whether insulin resistance changes with the change of vitamin E level in T2DM patients. Vitamin E levels were divided into quartiles, and the trend test was conducted between vitamin E and insulin resistance levels.
The restricted cubic spline curve of vitamin E level and insulin resistance were drawn to further evaluate whether the trend of insulin resistance changes with the change of vitamin E level in T2DM patients.
Results
Comparison of Baseline Data Between T2DM Group and Non-T2DM Group
A total of 242 patients were included in this study, with a median age of 53. A total of 112 women and 130 men were enrolled, all of whom were Chinese. The T2DM group vitamin E level was significantly lower than that in the non-T2DM group (11,659.03[9154.44,13,254.9] vs 10,575.23[8357.94,12,187.77], P < 0.001). Comparison of the data between the non-T2DM group and the T2DM group showed that the body weight, BMI, abdominal circumference, total protein, albumin, direct bilirubin, bilirubin, glutamate, ALT, glutamyltransferase, alkaline phosphatase, creatinine, glomerular filtration rate, triglycerides, HDL, and fasting blood glucose were less than 0.05. There were no significant differences between gender, age, height, systolic blood pressure (SBP), diastolic blood pressure (DBP), globulin, total bilirubin, indirect bilirubin, urea, uric acid, total cholesterol, and LDL groups (P > 0.05), as shown in Table 1.
 |
Table 1 Comparison of Baseline Data Between T2DM Group and Non-T2DM Group |
Comparison of Baseline Indicators Between IR and Non IR Group
Baseline comparison showed that age, weight, BMI, SBP, direct bilirubin, total cholesterol, triglycerides, LDL, HbA1c, fasting blood glucose, fasting insulin, fasting C-peptide, and vitamin E in IR (P < 0.05). Disease course, gender, height, diastolic blood pressure, total protein, albumin, globulin, total bilirubin, indirect bilirubin, glutaminase, transglutaminase, glutamyltransferase, alkaline phosphatase, urea, creatinine, uric acid, glomerular filtration rate, and high-density lipoprotein (P > 0.05), as shown in Table 2.
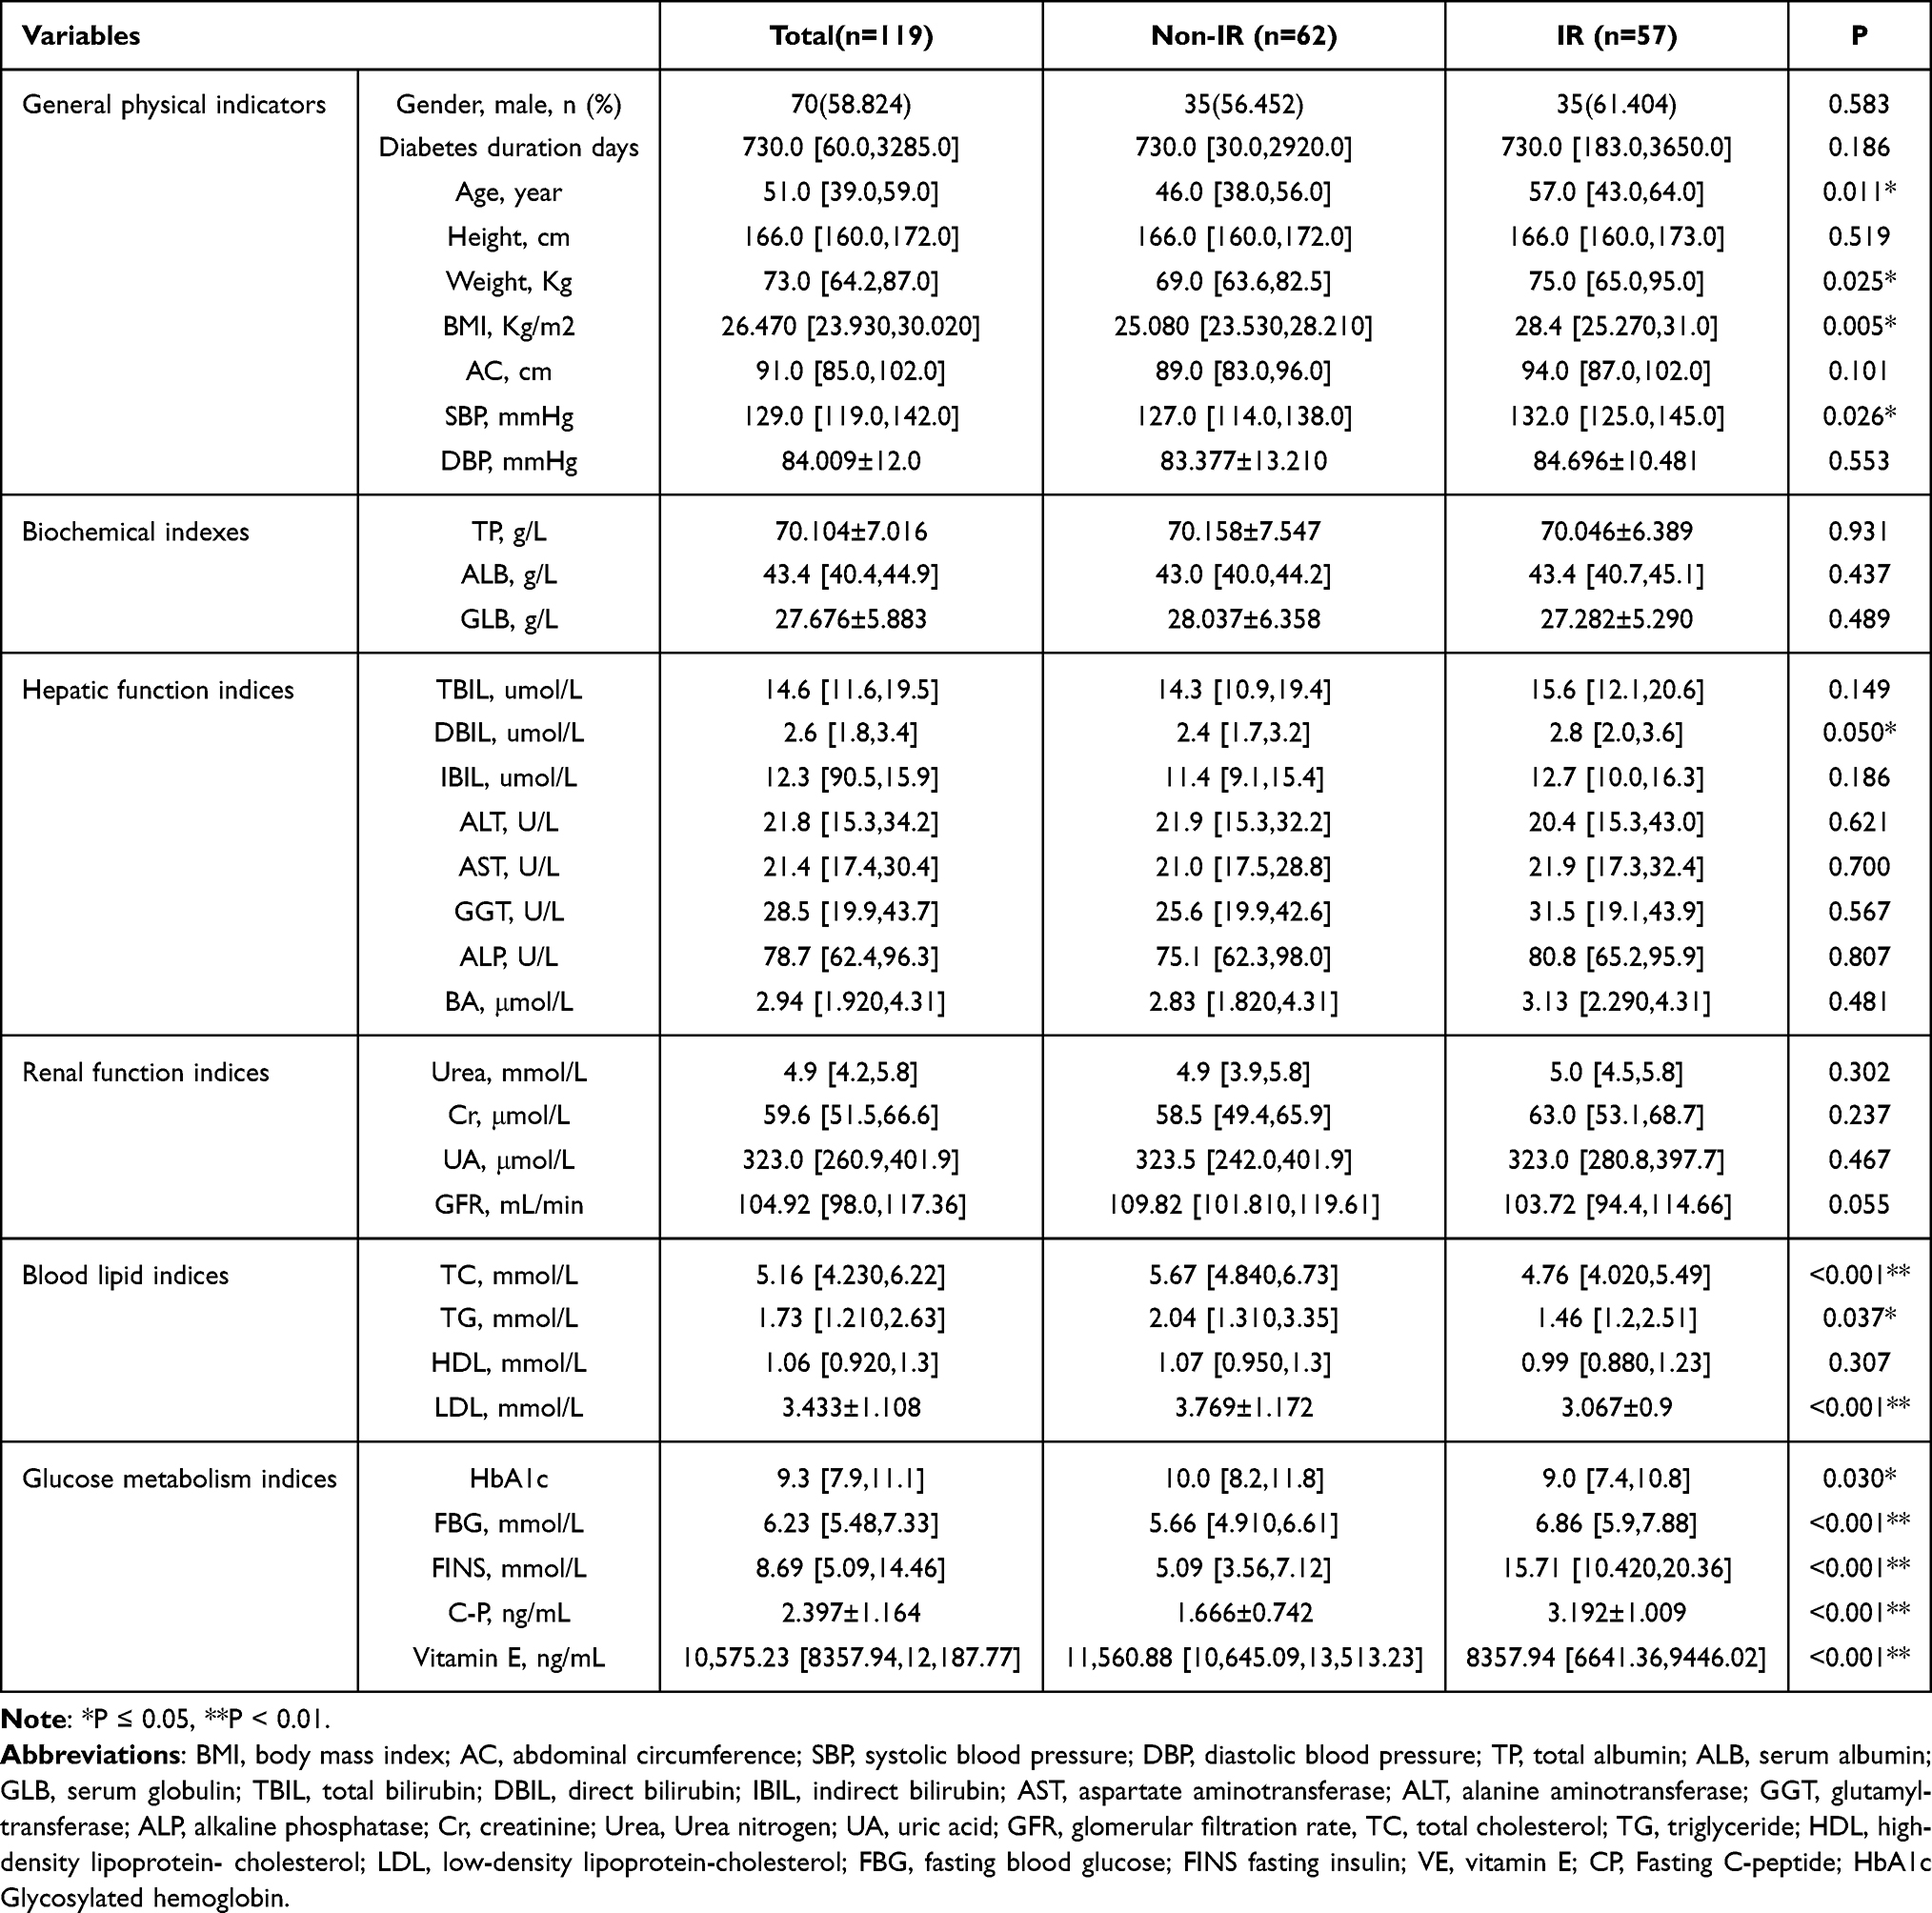 |
Table 2 Comparison of Baseline Indicators Between IR and Non-IR Group |
Correlation Analysis Between Vitamin E and Other Indicators
Spearman correlation coefficient was used to study the correlation between serum Vitamin E level and other indicators. The results showed that vitamin E was negatively correlated with direct bilirubin, fasting blood glucose, fasting insulin, and fasting C-peptide (r = −0.246, −0.282, −0.504, −0.513, P values were 0.008, 0.002, <0.001, <0.001, respectively). Vitamin E was positively correlated with total cholesterol, triglyceride, low-density lipoprotein (r = 0.452, 0.333, 0.368, respectively, P values were <0.001, <0.001, <0.001). There was no significant correlation between other indicators, as shown in Table 3. The heat map of vitamin E and correlation is shown in Figure 1.
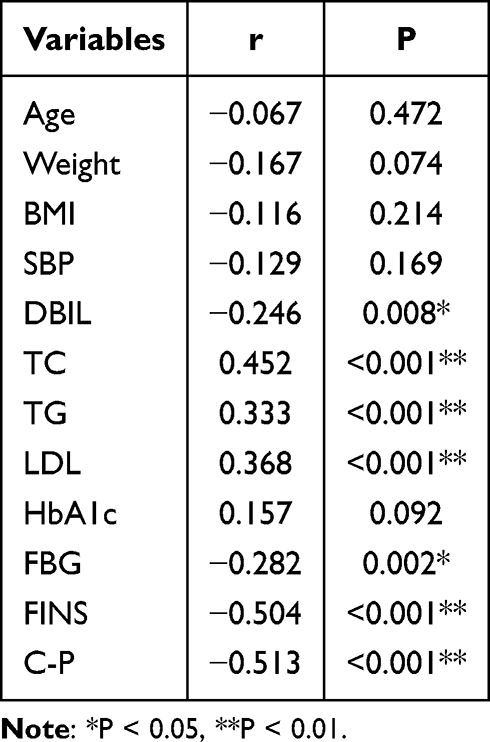 |
Table 3 Correlation Analysis Between Vitamin E and Other Indicators |
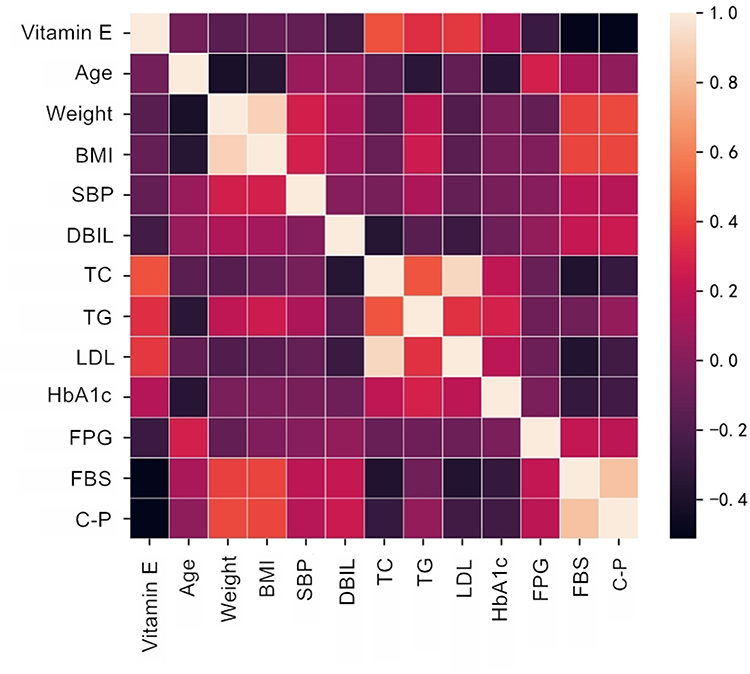 |
Figure 1 Correlation Analysis Heat Map. Note: AUC=0.953 (95% CI 0.914–0.993). |
Logistic Regression of HOMA-IR and Vitamin E
Multivariate logistic regression was used to evaluate the effects of vitamin E, direct bilirubin, total cholesterol, triglyceride, low-density lipoprotein, and fasting C-peptide on insulin resistance. The AUC in the model was 0.953, and the prediction effect of the model was good, as shown in Figure 2. Binary multivariate logistic regression analysis showed that vitamin E, total cholesterol, triglyceride, low-density lipoprotein, and fasting C-peptide were independent influencing factors of insulin resistance in T2DM patients (P < 0.05). The other indicators were not independent influencing factors of insulin resistance in T2DM patients (P > 0.05), as shown in Table 4.
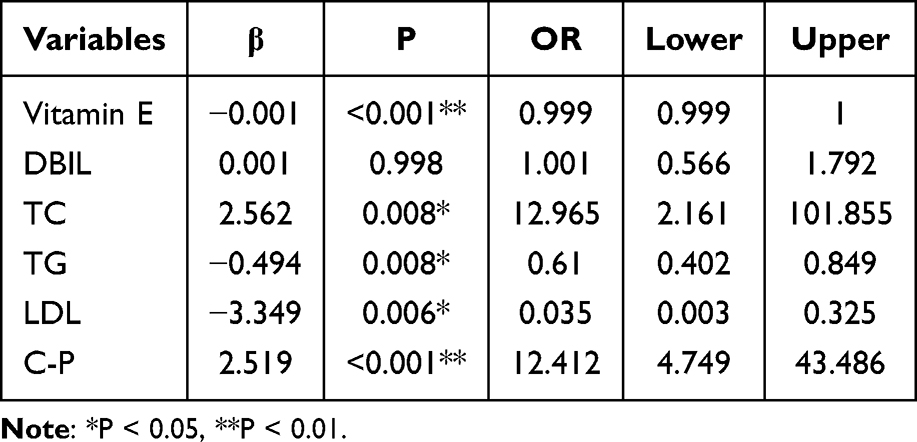 |
Table 4 Logistic Regression Result |
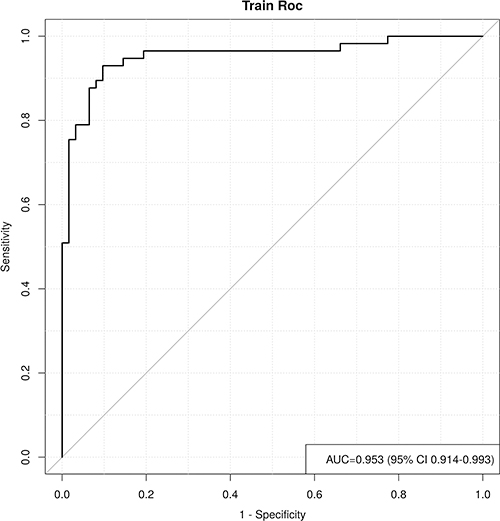 |
Figure 2 ROC curve. |
Trend Testing Analysis
The IR and non-IR groups were grouped by quartiles of serum vitamin E concentration, and the median of that group was assigned to each group. Then, with insulin resistance as the dependent variable and vitamin E as the independent variable, the trend analysis was carried out, P < 0.05, showing that there was a statistically significant difference in the trend. With the change of vitamin E concentration, the trend of insulin resistance changed.
The covariates of Model 1 adjusted model in trend test were duration of disease, age, height, weight, BMI, systolic blood pressure, diastolic blood pressure, and gender, P < 0.001. The covariates of Model 2 adjusted model were duration of disease, gender, age, height, weight, BMI, systolic blood pressure, diastolic blood pressure, total cholesterol, low-density lipoprotein, very low-density lipoprotein, fasting C-peptide, P = 0.001. P values were less than 0.05, indicating that the trend was statistically significant, and insulin resistance changed with the change of vitamin E concentration. The results are shown in Table 5:
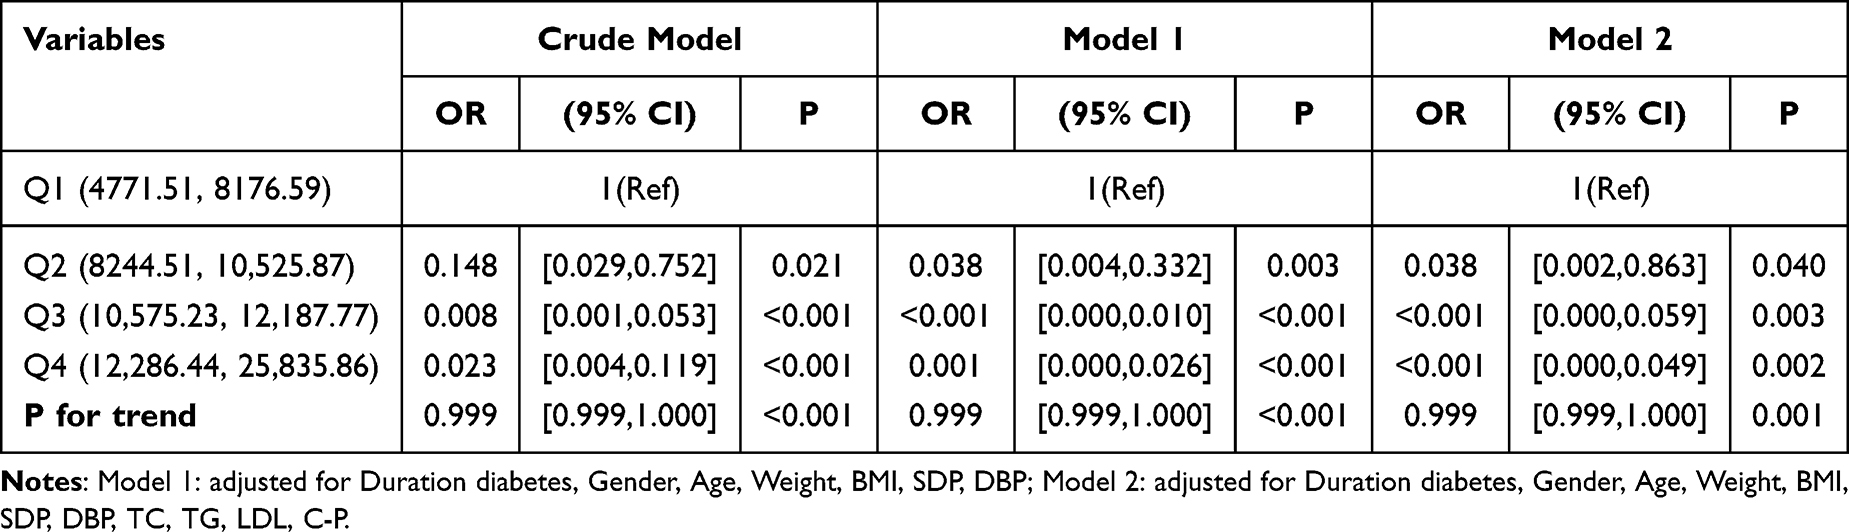 |
Table 5 Trend Testing Analysis Result |
Cubic Spline Regression Analysis of the Relationship of Vitamin E and HOMA-IR
To further evaluate the trend of insulin resistance with vitamin E, ROC curves were plotted with insulin resistance as the dependent variable and serum vitamin E as the independent variable. The P-nonlinear value of the model was 0.002, indicating that there was a nonlinear relationship between vitamin E and insulin resistance in T2DM patients. The reference point (OR = 1) was 10,575.23 ng/mL. When serum vitamin E level was lower than 10,575.23 ng/mL, vitamin E was a risk factor for insulin resistance in T2DM patients (OR > 1), and when serum vitamin E level was higher than 10,575.23 ng/mL, vitamin E was a protective factor for insulin resistance in T2DM patients (OR < 1), as shown in Figure 3.
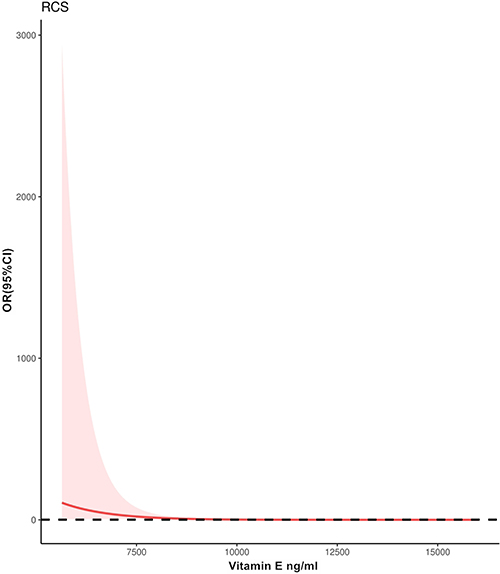 |
Figure 3 Cubic spline regression analysis of the relationship of VE and HOMA-IR. |
Discussion
Lipid oversupply, chronic inflammation, and oxidative stress are fundamental causes21,22 of the development and worsening of insulin resistance.23,24 Oxidative stress is not only associated25–28 with insulin resistance, but also with a variety of complications of diabetes.29–35 When glucose and free fatty acids (FFA) are increased, they cause oxidative stress while activating stress-sensitive signaling pathways. Activation of these pathways in turn worsens insulin action and secretion, leading to pronounced insulin resistance. Reducing the degree of oxidative stress and activating oxidative stress signaling pathways can be used as part of the treatment regimen for patients36 with T2DM.
The mechanism of vitamin E reducing oxygen free radicals is related to the structure of vitamin E itself. In the molecular structure of vitamin E, there is a phenylpropylene dihydropyran ring, and the hydrogen on the phenylpropylene dihydropyran ring combines with oxygen free radicals to form reproductive quinone and is excreted from the body. Vitamin E can also prevent the chain reactions of lipid peroxidation by reducing the production of oxygen free radicals, thereby preventing the peroxidation of polyunsaturated fatty acids in the cell membrane. Vitamin E not only reduces the damage caused by oxidative stress, but also prevents the harmful biological effects caused by lipid peroxidation products.37
In this study, patients were divided into T2DM group and non-T2DM group. The vitamin E level in the T2DM group was significantly lower than that in the non-T2DM group (P < 0.05). To further investigate the correlation between serum vitamin E level and the mechanism of insulin resistance in T2DM patients, we divided T2DM patients into IR group and Non-IR group, and the results showed that the vitamin E level in IR group was significantly lower than that in non-IR group.
Logistic regression analysis also showed that serum vitamin E level was an independent risk factor for insulin resistance. Therefore, our data suggest that vitamin E plays an important role in the development of insulin resistance in T2DM patients and may be an independent predictor of insulin resistance risk.
We divided the subjects into four groups, Q1, Q2, Q3, and Q4, according to their serum vitamin E levels from high to low. In the test of the correlation between serum vitamin E levels and the risk of insulin resistance in patients with type 2 diabetes, we found that as vitamin E levels increased, the differences between the original model, model 1 and model 2 were statistically significant (p < 0.05). Compared with the Q1 group, the risk of the Q2 group reduced by 85.2% times, the Q3 group increased by 0.008 times, and the Q4 group reduced by 97.7%.
Previous studies have demonstrated a possible mechanistic link between vitamin E and insulin sensitivity. It is suggested that the up-regulation of α-tocopherol and γ-tocopherol is involved in the activation of the endogenous ligand of PPARγ, and PPARγ plays an important role38 in the up-regulation. Studies have also shown that high doses of vitamin E (>1300 mg/day) not only have hypoglycemic effects, but also may have adverse effects39–42 on the body. There is evidence that relatively high doses of vitamin E supplementation do not inhibit oxidative stress processes43 involved in hemoglobin glycation. Thus, low-dose vitamin E supplementation appears to be more effective than high-dose supplementation in patients with diabetes.
Overall, as no known side effects of vitamin E supplements have been reported, and vitamin E can be used as supplemental therapy in these patients. However, this recommendation should be implemented with caution for patients with T1DM and those with diabetic nephropathy and/or neuropathy, as there are few studies in this area. Further, randomized controlled trials, especially those with low risk of bias, are needed to evaluate the effects of vitamin E supplementation on biochemical parameters in patients with T1DM and diabetic nephropathy and/or neuropathy.
At present, there are more and more studies on the antioxidant effect of serum vitamin E at home and abroad, but there are relatively few domestic studies on the relationship between serum vitamin E and insulin resistance in type 2 diabetes, especially the clinical research on the relationship between serum vitamin E and HOMA-IR in type 2 diabetes. Therefore, the results of this article will provide more evidence for clinical treatment. There are also some limitations in this study, including small sample size and cross-sectional control study, which may lead to bias. It is necessary to collect large sample data to verify the results of this study. In addition, a comparison of insulin resistance levels after vitamin E supplementation was not performed in this study. Recently, TyG and Tgy-BMI are also considered as the insulin resistance parameters, and further analysis is needed to investigate the association of vitamin E levels with other insulin resistance indices is warranted.44
In conclusion, there is a risk correlation between serum vitamin E and insulin resistance in patients with type 2 diabetes. With the decrease of serum vitamin E level, the risk of insulin resistance in patients with type 2 diabetes increases gradually. However, the mechanism of vitamin E and insulin resistance is still unclear, and relevant prospective studies are needed to further prove it in the future.
Conclusion
Serum vitamin E levels are lower in T2DM patients than in healthy populations; Vitamin E is an independent influencing factor for HOMA-IR in T2DM patients. The risk of insulin resistance gradually increases in T2DM patients as serum vitamin E levels decrease. Vitamin E is a risk factor for insulin resistance at serum vitamin E levels below 10,575.23 ng/mL. At higher serum vitamin E levels than 10,575.23 ng/mL, vitamin E is a protective factor for insulin resistance.
Declaration and Terms
This study complies with the Declaration of Helsinki and the relevant laws and regulations.
Institutional Review Board Statement
Approved by the Medical Ethics Committee of Hebei General Hospital.
Data Sharing Statement
The data that support the findings of the study are available from the first author, upon reasonable request.
Informed Consent Statement
Consent was obtained from all people. In the population of hospitalization or physical examination, select the patients who meet the protocol admission criteria according to the protocol, introduce the content, risks and benefits of the clinical trial to the patients and their families, and invite the patients to participate in the study.
Disclosure
The authors report no conflicts of interest in this work.
References
1. Khan MAB, Hashim MJ, King JK. et al. Epidemiology of type 2 diabetes–global burden of disease and forecasted trends. J Epidemiol Glob Health. 2020;10(1):107. doi:10.2991/jegh.k.191028.001
2. Kumar A, Gangwar R, Zargar A, et al. Prevalence of diabetes in India: a review of IDF Diabetes Atlas 10th edition. Current Diabetes Rev. 2023;2:1.
3. American Diabetes Association. Diagnosis and classification of diabetes mellitus. Diabetes Care. 2010;33(Supplement_1):S62–S69. doi:10.2337/dc10-S062
4. Kerner W, Bruckel J. Definition, classification and diagnosis of diabetes mellitus. Exp Clin Endocrinol Diabetes. 2014;122(07):384–386. doi:10.1055/s-0034-1366278
5. Chua GHI, Phang SCW, Wong YO, et al. Vitamin E levels in ethnic communities in Malaysia and its relation to glucose tolerance, insulin resistance and advanced glycation end products: a cross-sectional study. Nutrients. 2020;12(12):3659. doi:10.3390/nu12123659
6. Reaven GM. Insulin Resistance and Its Consequences: Type 2 Diabetes Mellitus and Coronary Heart Disease. Diabetes Mellitus: A Fundamental and Clinical Text. Vol. 604. Philadelphia: Lippincott Williams & Wilkins; 2000:615.
7. Defronzo RA. Pathogenesis of type 2 diabetes: metabolic and molecular implications for identifying diabetes genes. Diabetes Rev. 1997;5:177–269.
8. Yaribeygi H, Sathyapalan T, Atkin SL, et al. Molecular mechanisms linking oxidative stress and diabetes mellitus. Oxidative medicine and cellular longevity; 2020.
9. Schwingshackl L, Lampousi AM, Portillo MP, et al. Olive oil in the prevention and management of type 2 diabetes mellitus: a systematic review and meta-analysis of cohort studies and intervention trials. Nut Diabetes. 2017;7(4):e262–e262. doi:10.1038/nutd.2017.12
10. Fito M, Estruch R, Salas‐ Salvado J, et al. Effect of the Mediterranean diet on heart failure biomarkers: a randomized sample from the PREDIMED trial. Euro J Heart Failu. 2014;16(5):543–550. doi:10.1002/ejhf.61
11. Institute of Medicine (US) Standing Committee on the Scientific Evaluation of Dietary Reference Intakes. Dietary reference intakes: proposed definition and plan for review of dietary antioxidants and related compounds; 1998.
12. Costacou T, Ma B, King IB, et al. Plasma and dietary vitamin E in relation to insulin secretion and sensitivity. Diabetes Obesity Metab. 2008;10(3):223–228. doi:10.1111/j.1463-1326.2006.00683.x
13. Fang F, Kang Z, Wong C. Vitamin E tocotrienols improve insulin sensitivity through activating peroxisome proliferator‐activated receptors. Mol Nutr Food Res. 2010;54(3):345–352. doi:10.1002/mnfr.200900119
14. Minter BE, Lowes DA, Webster NR, et al. Differential effects of MitoVitE, α-tocopherol and trolox on oxidative stress, mitochondrial function and inflammatory signalling pathways in endothelial cells cultured under conditions mimicking sepsis. Antioxidants. 2020;9(3):195. doi:10.3390/antiox9030195
15. Bavani NG, Saneei P, Keshteli AH, et al. Magnesium intake, insulin resistance and markers of endothelial function among women. Public Health Nutri. 2021;24(17):5777–5785. doi:10.1017/S1368980021001063
16. Balbaa M, Abdulmalek SA, Khalil S, Holscher C. Oxidative stress and expression of insulin signaling proteins in the brain of diabetic rats: role of Nigella sativa oil and antidiabetic drugs. PLoS One. 2017;12(5):e0172429. doi:10.1371/journal.pone.0172429
17. Asih PR, Tegg ML, Sohrabi H, et al. Multiple mechanisms linking type 2 diabetes and Alzheimer’s disease: testosterone as a modifier. J Alzheimers Dis. 2017;59(2):445–466. doi:10.3233/JAD-161259
18. Abd El-Aal A, Abd El-Ghffar EA, Ghali AA, et al. The effect of vitamin C and/or E supplementations on type 2 diabetic adult males under metformin treatment: a single-blinded randomized controlled clinical trial. Diabetes Metab Syndr. 2018;12(4):483–489. doi:10.1016/j.dsx.2018.03.013
19. Rafraf M, Bazyun B, Sarabchian MA, et al. Vitamin E improves serum paraoxonase-1 activity and some metabolic factors in patients with type 2 diabetes: no effects on nitrite/nitrate levels. J Am Coll Nutr. 2016;35(6):521–528. doi:10.1080/07315724.2015.1116896
20. Keihan GS, Gharib MH, Momeni A, et al. A comparison between the effect of cuminum cyminum and vitamin E on the level of leptin, paraoxonase 1, Hba1c and oxidized LDL in diabetic patients. Int J Mole Cell Med. 2016;5(4):229.
21. Evans JL, Youngren JF, Goldfine ID. Effective treatments for insulin resistance: trim the fat and douse the fire. Trends Endocrinol Metab. 2004;15(9):425–431. doi:10.1016/j.tem.2004.09.005
22. Xu H, Barnes GT, Yang Q, et al. Chronic inflammation in fat plays a crucial role in the development of obesity-related insulin resistance. J Clin Invest. 2003;112(12):1821–1830. doi:10.1172/JCI200319451
23. Mocanu V, Zhang Z, Deehan EC, et al. Fecal microbial transplantation and fiber supplementation in patients with severe obesity and metabolic syndrome: a randomized double-blind, placebo-controlled Phase 2 trial. NAT MED. 2021;27(7):1272–1279. doi:10.1038/s41591-021-01399-2
24. Zhang S, Mwiberi S, Pickford R, et al. Longitudinal associations between ambient air pollution and insulin sensitivity: results from the KORA cohort study. Lancet Planet Health. 2021;5(1):e39–e49. doi:10.1016/S2542-5196(20)30275-8
25. Rosen P, Nawroth PP, King G, et al. The role of oxidative stress in the onset and progression of diabetes and its complications: a summary of a Congress Series sponsored byUNESCO‐MCBN, the American Diabetes Association and the German Diabetes Society. Diabetes Metab Res Rev. 2001;17(3):189–212. doi:10.1002/dmrr.196
26. West IC. Radicals and oxidative stress in diabetes. Diabetic Med. 2000;17(3):171–180. doi:10.1046/j.1464-5491.2000.00259.x
27. Nishikawa T, Edelstein D, Brownlee M. The missing link: a single unifying mechanism for diabetic complications. Kidney Int. 2000;58:S26–S30. doi:10.1046/j.1523-1755.2000.07705.x
28. Rahimi R, Nikfar S, Larijani B, et al. A review on the role of antioxidants in the management of diabetes and its complications. Biomed Pharmacother. 2005;59(7):365–373. doi:10.1016/j.biopha.2005.07.002
29. Evans JL, Goldfine ID, Maddux BA, et al. Are oxidative stress− activated signaling pathways mediators of insulin resistance and β-cell dysfunction? Diabetes. 2003;52(1):1–8. doi:10.2337/diabetes.52.1.1
30. Evans JL, Goldfine ID, Maddux BA, et al. Oxidative stress and stress-activated signaling pathways: a unifying hypothesis of type 2 diabetes. Endocrine Rev. 2002;23(5):599–622. doi:10.1210/er.2001-0039
31. Evans JL, Maddux BA, Goldfine ID. The molecular basis for oxidative stress-induced insulin resistance. Antioxid Redox Signal. 2005;7(7–8):1040–1052. doi:10.1089/ars.2005.7.1040
32. Maddux BA, See W, Lawrence JC, et al. Protection against oxidative stress—induced insulin resistance in rat L6 muscle cells by micromolar concentrations of α-lipoic acid. Diabetes. 2001;50(2):404–410. doi:10.2337/diabetes.50.2.404
33. Paolisso G, D’Amore A, Volpe C, et al. Evidence for a relationship between oxidative stress and insulin action in non-insulin-dependent (type II) diabetic patients. Metabolism. 1994;43(11):1426–1429. doi:10.1016/0026-0495(94)90039-6
34. Paolisso G, Giugliano D. Oxidative stress and insulin action: is there a relationship? Diabetologia. 1996;39(3):357–363. doi:10.1007/BF00418354
35. Ceriello A. Oxidative stress and glycemic regulation. Metabolism. 2000;49(2):27–29. doi:10.1016/S0026-0495(00)80082-7
36. Evans JL. Antioxidants: do they have a role in the treatment of insulin resistance? Indian J Med Res. 2007;125(3):355–372.
37. Böhm V. Vitamin E. Antioxidants. 2018;7(3):44. doi:10.3390/antiox7030044
38. Gray B, Swick J, Ronnenberg AG. Vitamin E and adiponectin: proposed mechanism for vitamin E‐induced improvement in insulin sensitivity. Nutr Rev. 2011;69(3):155–161. doi:10.1111/j.1753-4887.2011.00377.x
39. Asbaghi O, Nazarian B, Yousefi M, et al. Effect of vitamin E intake on glycemic control and insulin resistance in diabetic patients: an updated systematic review and meta-analysis of randomized controlled trials. Nutr J. 2023;22(1):1–22. doi:10.1186/s12937-023-00840-1
40. Ble-Castillo JL, Carmona-Diaz E, Mendez JD, et al. Effect of α-tocopherol on the metabolic control and oxidative stress in female type 2 diabetics. Biomed Pharmacother. 2005;59(6):290–295. doi:10.1016/j.biopha.2005.05.002
41. Hashemi SB, Sarbolouki S, Djalali M, et al. Adiponectin and glycemic profiles in type 2 diabetes patients on eicosapentaenoic acid with or without vitamin E. Acta Endo. 2014;10(1):84–96. doi:10.4183/aeb.2014.84
42. Xu R, Zhang S, Tao A, et al. Influence of vitamin E supplementation on glycaemic control: a meta-analysis of randomised controlled trials. PLoS One. 2014;9(4):e95008. doi:10.1371/journal.pone.0095008
43. Ikemoto M, Okamura Y, Kano M, et al. A relative high dose of vitamin E does not attenuate unweighting-induced oxidative stress and ubiquitination in rat skeletal muscle. J Physiol Anthropol Appl Human Sci. 2002;21(5):257–263. doi:10.2114/jpa.21.257
44. Wang S, Shi J, Peng Y, et al. Stronger association of triglyceride glucose index than the HOMA-IR with arterial stiffness in patients with type 2 diabetes: a real-world single-centre study. Cardiovasc Diabetol. 2021;20(1):1–10. doi:10.1186/s12933-021-01274-x
 © 2024 The Author(s). This work is published and licensed by Dove Medical Press Limited. The
full terms of this license are available at https://www.dovepress.com/terms
and incorporate the Creative Commons Attribution
- Non Commercial (unported, 3.0) License.
By accessing the work you hereby accept the Terms. Non-commercial uses of the work are permitted
without any further permission from Dove Medical Press Limited, provided the work is properly
attributed. For permission for commercial use of this work, please see paragraphs 4.2 and 5 of our Terms.
© 2024 The Author(s). This work is published and licensed by Dove Medical Press Limited. The
full terms of this license are available at https://www.dovepress.com/terms
and incorporate the Creative Commons Attribution
- Non Commercial (unported, 3.0) License.
By accessing the work you hereby accept the Terms. Non-commercial uses of the work are permitted
without any further permission from Dove Medical Press Limited, provided the work is properly
attributed. For permission for commercial use of this work, please see paragraphs 4.2 and 5 of our Terms.
Recommended articles
Platelet-Activating Factor Promotes the Development of Non-Alcoholic Fatty Liver Disease
Yin H, Shi A, Wu J
Diabetes, Metabolic Syndrome and Obesity 2022, 15:2003-2030
Published Date: 8 July 2022
Tang-Ping-San Decoction Remodel Intestinal Flora and Barrier to Ameliorate Type 2 Diabetes Mellitus in Rodent Model
Yin W, Zhang SQ, Pang WL, Chen XJ, Wen J, Hou J, Wang C, Song LY, Qiu ZM, Liang PT, Yuan JL, Yang ZS, Bian Y
Diabetes, Metabolic Syndrome and Obesity 2022, 15:2563-2581
Published Date: 20 August 2022
The Association Between Sarcopenia and Diabetes: From Pathophysiology Mechanism to Therapeutic Strategy
Chen H, Huang X, Dong M, Wen S, Zhou L, Yuan X
Diabetes, Metabolic Syndrome and Obesity 2023, 16:1541-1554
Published Date: 30 May 2023
Impact of Lipids on Insulin Resistance: Insights from Human and Animal Studies
Elkanawati RY, Sumiwi SA, Levita J
Drug Design, Development and Therapy 2024, 18:3337-3360
Published Date: 31 July 2024
Lipotoxicity: A New Perspective in Type 2 Diabetes Mellitus
Chen B, Li T, Wu Y, Song L, Wang Y, Bian Y, Qiu Y, Yang Z
Diabetes, Metabolic Syndrome and Obesity 2025, 18:1223-1237
Published Date: 24 April 2025