Back to Journals » Diabetes, Metabolic Syndrome and Obesity » Volume 17
Correlation Between Glycolipid Metabolism Levels and Diabetic Retinopathy in Patients with Type 2 Diabetes Mellitus
Authors Wang S, Pan X ![]() , Zhang M, Chen S
, Zhang M, Chen S
Received 22 October 2023
Accepted for publication 15 December 2023
Published 3 January 2024 Volume 2024:17 Pages 1—9
DOI https://doi.org/10.2147/DMSO.S437586
Checked for plagiarism Yes
Review by Single anonymous peer review
Peer reviewer comments 3
Editor who approved publication: Dr Konstantinos Tziomalos
Shuqi Wang,1,2 Xiaoyu Pan,1,2 Mengmeng Zhang,1,2 Shuchun Chen1,2
1Department of Internal Medicine, Hebei Medical University, Shijiazhuang, People’s Republic of China; 2Department of Endocrinology, Hebei General Hospital, Shijiazhuang, People’s Republic of China
Correspondence: Shuchun Chen, Department of Endocrinology, Hebei General Hospital, Shijiazhuang, People’s Republic of China, Tel/Fax +86 31185988406, Email [email protected]
Purpose: We investigate the correlation between glucose and lipid metabolism and diabetic retinopathy (DR) in patients with type 2 diabetes mellitus (T2DM) and its diagnostic and predictive value.
Patients and Methods: A retrospective analysis involved 620 patients diagnosed with T2DM, categorized into two groups based on fundus examination results: the non-diabetic retinopathy group (NDR, n=340) and the diabetic retinopathy group (DR, n=280). We collected baseline patient data, calculated the ratio of glycated hemoglobin (HbA1c) to high-density lipoprotein cholesterol (HDL-C), and analyzed its association with Type 2 Diabetic Retinopathy.
Results: HbA1c/HDL-C in DR group exhibited significantly higher than the NDR group (P< 0.001). Mantel-Haenszel’s chi-square trend analysis indicated a notable linear trend (P< 0.001) between HbA1c/HDL-C and DR. HbA1c/HDL-C revealed moderate positive correlations with DR, r=0.342, P< 0.001. Binary logistic regression analysis showed systolic blood pressure (SBP), diabetes course, fasting blood glucose (FBG) and HbA1c/HDL-C as independent risk factors for DR in T2DM patients. Restrictive cubic spline analysis demonstrated a significant nonlinear relationship between HbA1c/HDL-C and DR (P total trend < 0.001, P nonlinear = 0.0196). ROC curve analysis identified that HbA1c/HDL-C had the highest diagnostic accuracy for DR, with an area under the ROC curve (AUC) of 0.711, 53.2% sensitivity, and 78.2% specificity.
Conclusion: Our study shows that HbA1c/HDL-C is an independent risk factor for DR in patients with type 2 diabetes. HbA1c/HDL-C has good diagnostic value for DR and can be used as a biological index for early screening of DR.
Keywords: glucose metabolism, lipid metabolism, glycosylated hemoglobin, high density lipoprotein cholesterol, HbA1c/HDL-C, type 2 diabetes, diabetic retinopathy
Introduction
Diabetic retinopathy (DR) is a common microvascular complication of type 2 diabetes mellitus (T2DM). Vascular endothelial injury, microaneurysm formation, and punctate intraretinal hemorrhage are the early manifestations of non-proliferative diabetic retinopathy (NPDR). As the disease progresses, new capillaries appear and fibrous tissue proliferates, which gradually develops into proliferative diabetic retinopathy (PDR). In severe cases, it can pull the retina away, leading to blindness.1 Due to pathological changes in DR, ophthalmoscopy is still the first choice for early diagnosis and risk stratification of DR.2 However, due to the limitation of medical resources and the degree of patients’ cooperation, ophthalmoscopy has not been fully popularized, and the early screening rate of DR is low, which often progresses to irreversible damage.3 Therefore, it is of great significance to identify more biomarkers for early screening and intervention of DR.
Glycated hemoglobin (HbA1c) is a product of non-enzymatic glycosylation of protein, which reflects the average blood glucose level for nearly 2–3 months and more stable than fasting blood glucose, therefore it is not affected by fasting blood glucose and insulin therapy.4 Several studies have shown that HbA1c is independently associated with the risk of T2DM and diabetic complications.5–7 As early as 2010, ADA guidelines have listed HbA1c>6.5% as the diagnostic criteria of diabetes mellitus,8 which shows that HbA1c plays an important role in blood glucose monitoring of patients with T2DM. In recent years, studies have found that disorder of blood glucose metabolism not only leads to the apoptosis of islet β cells but also affects the metabolism of blood lipids. Hyperglycemia will accelerate the synthesis of free fatty acids and the accumulation of cholesterol, and the increased lipid will be deposited in non-adipose tissues, such as heart, kidney, and blood vessel wall, eventually multiple-organ dysfunction occurs.9,10 Researchers have demonstrated that more than 75% of T2DM patients with diabetic dyslipidemia (DD), mainly manifested by the increase in triglyceride (TG) and the decrease in high-density lipoprotein cholesterol (HDL-C).11 The synergistic effect of glucose and lipid metabolism disorder continuously aggravates insulin resistance and accelerates the process of T2DM and its complications.12 However, in clinical practice, patients with T2DM often have normal HbA1c or blood lipids, but still progress to DR. Therefore, this study comprehensively considers the glucose and lipid metabolism levels of patients with T2DM, integrates the HbA1c and HDL-C indicators, calculates HbA1c/HDL-C, and discusses the correlation between HbA1c/HDL-C and DR.
Materials and Methods
Ethical Declaration: This study was conducted in strict adherence to the Helsinki Declaration of Principles and received approval from the Ethics Committee of Hebei General Hospital. At the same time, patients are informed of the purpose of this study and signed informed consent forms.
Experimental design: This study employed a cross-sectional design, collected clinical data of 1326 T2DM patients diagnosed in Hebei General Hospital from January 2020 to December 2022, and screened patients according to the following criteria. Inclusion criteria: 1) aged 18 to 80 years; 2) T2DM patients diagnosed according to the 1999 World Health Organization Diagnostic Criteria for Diabetes. Exclusion criteria: 1) Acute complications and acute stress state of diabetes; 2) Diabetic foot; 3) Patients with severe cardiac, liver, or renal insufficiency; 4) Patients with pregnancy and blood system diseases; 5) and individuals with conditions such as Hyperthyroid eye disease or glaucoma, which cannot cooperation during fundoscopic examinations. In the end, 620 T2DM patients were screened to be included in this study. All 620T2DM patients underwent a fundus examination and were divided into non-diabetic retinopathy group (NDR, n=340) and diabetic retinopathy group (DR, n=280) according to the DR grading standard formulated by International Society of Ophthalmology in 2002.
Data collection and laboratory analysis: Collect basic information of the patients, including age, gender, diabetes course, smoking history, drinking history, systolic blood pressure (SBP), diastolic blood pressure (DBP), height, and weight. Laboratory tests included glycated hemoglobin (HbA1c), fasting blood glucose (FBG), albumin (ALB), serum creatinine (Cr), serum uric acid (UA), blood urea nitrogen (BUN), glomerular filtration rate (eGFR), total cholesterol (TC), triglyceride (TG), high-density lipoprotein cholesterol (HDL-C), and low-density lipoprotein cholesterol (LDL-C). Body mass index (BMI) was calculated by dividing weight by the square of height, and HbA1c/HDL-C was calculated by dividing glycated hemoglobin by high-density lipoprotein cholesterol.
Statistical analysis: SPSS 21.0 software was used for statistical analysis of the collected data, and GraphPad Prism 8.0.2 and R version 4.3.1 software were used for drawing. Measurement data that conformed to a normal distribution were expressed as mean ± standard deviation, with group comparisons performed using two independent samples t-tests. Non-normally distributed measurement data were expressed as the median and quantile spacing [M(P25%, P75%)], with group comparisons performed using the Mann–Whitney U-test. Chi-square trend testing via Mantel–Haenszel analysis was employed for trend analysis. Binary logistic regression analysis was used to identify independent risk factors for DR in T2DM patients. The nonlinear relationship between the risk of DR and HbA1c/HDL-C in T2DM patients was analyzed using restricted cubic spline. The diagnostic value of HbA1c/HDL-C for DR in T2DM patients was determined through Receiver Operating Characteristic (ROC) curve analysis, including the calculation of the area under the curve (AUC). Statistical significance was established at P<0.05 for all analyses.
Results
Comparison of General Data and Laboratory Related Indexes Between the Two Groups
In all T2DM patients, the HbA1c/HDL-C ratio of DR patients was significantly higher than that of NDR patients (P<0.001) (Table 1 and Figure 1). DR patients had a significantly longer course of diabetes compared to NDR patients (P<0.001). Several laboratory indicators were elevated in the DR group, including SBP, HbA1c, FBG, and TG levels, while ALB and HDL-C decreased (all P<0.05). However, there were no significant differences between DR and NDR in age, gender, smoking history, drinking history, DBP, BMI, Cr, UA, BUN, eGFR, TC, or LDL-C (Table 1).
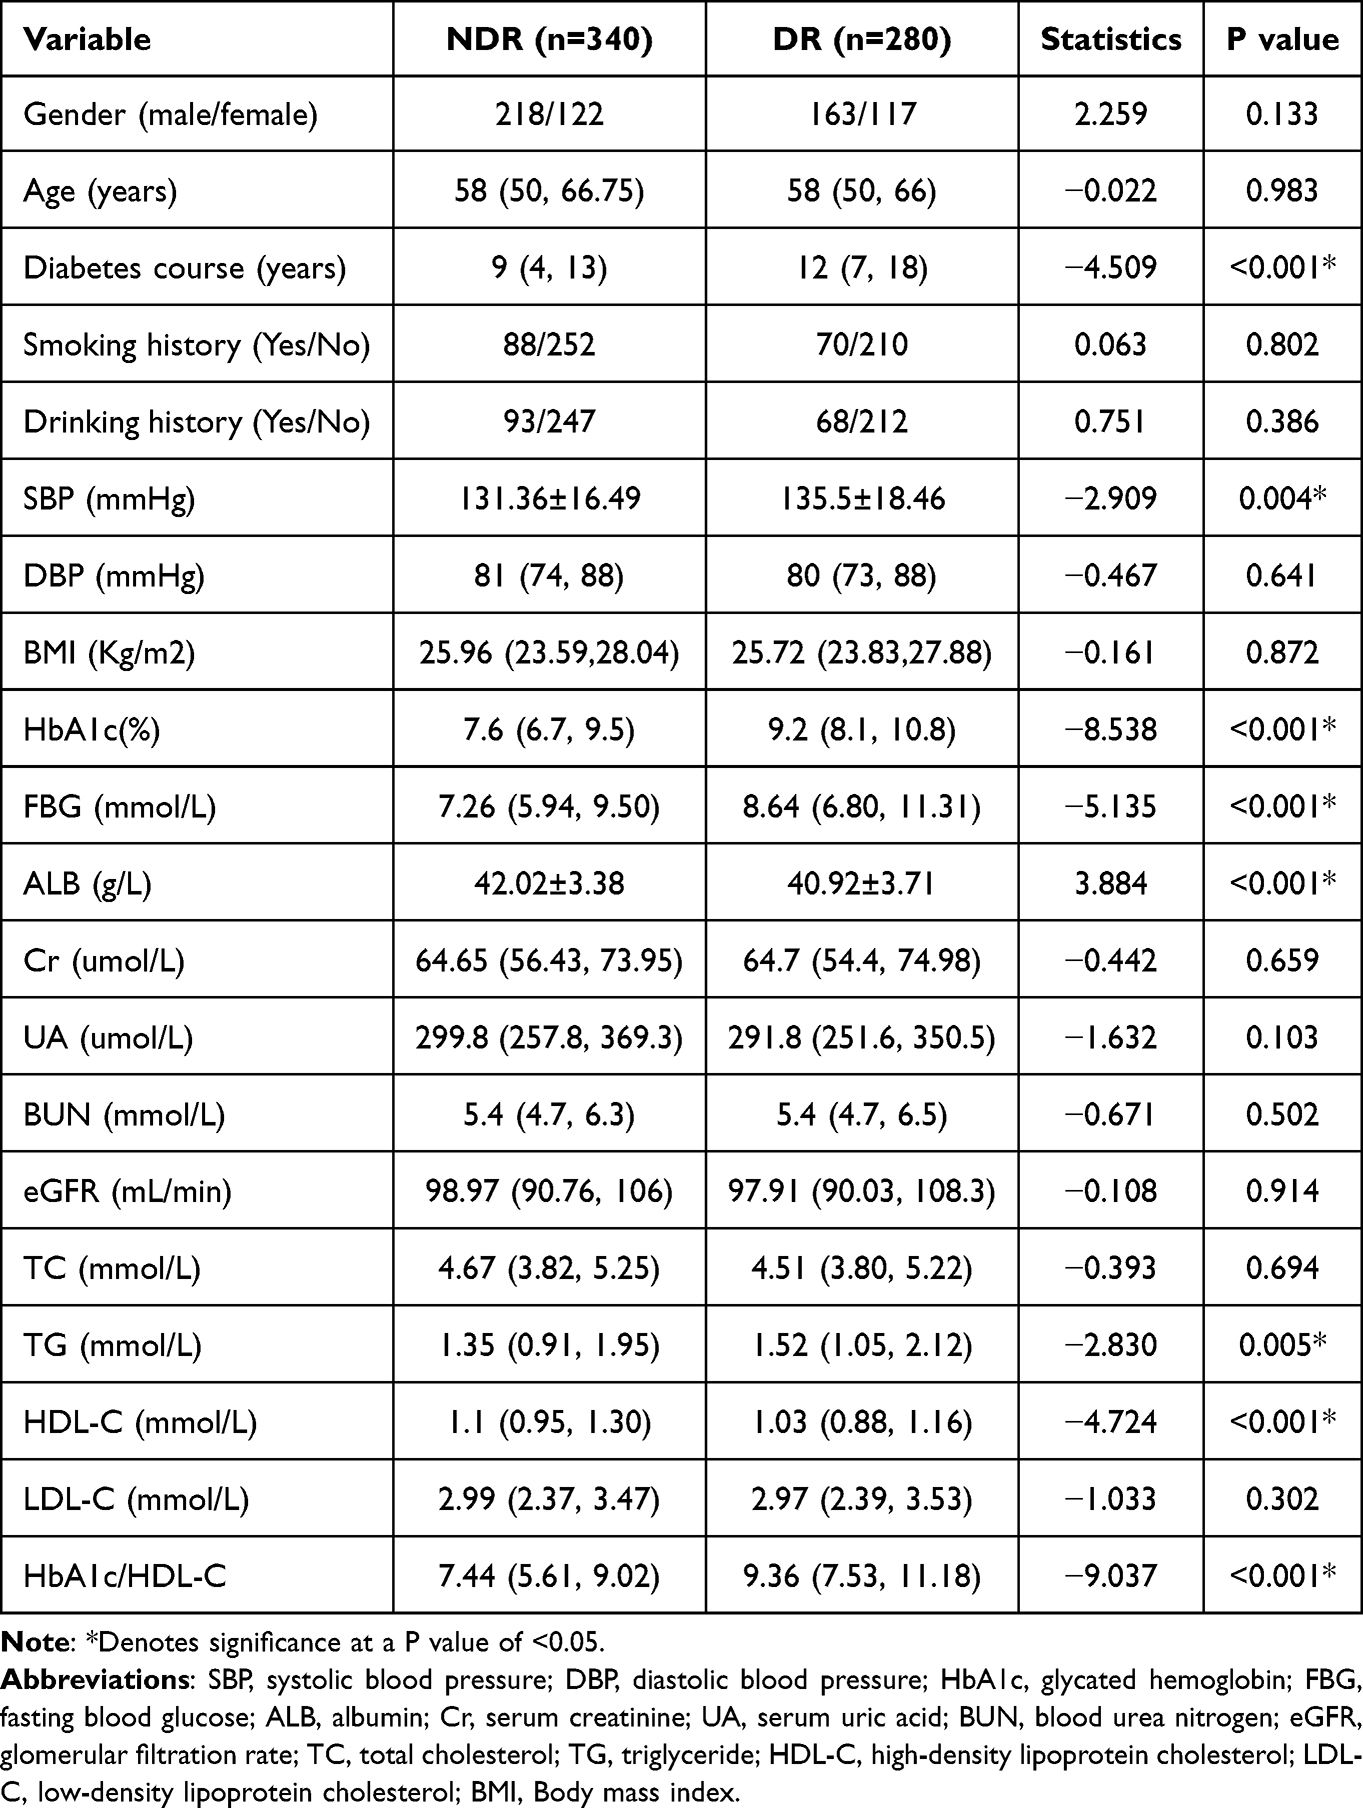 |
Table 1 Comparison of General Data and Laboratory-Related Indexes Between the Two Groups |
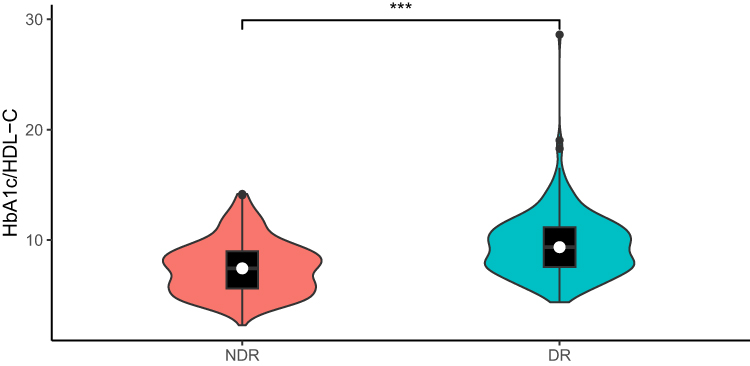 |
Figure 1 Comparison of HbA1c/HDL-C between NDR group and DR group. Note: ***Denotes significance at a P value of <0.001. |
Trend Test of HbA1c/HDL-C Quartile Intervals and DR Risk in T2DM Patients
We categorized patients into four groups based on quartile intervals of HbA1c/HDL-C (A-D) to convert HbA1c/HDL-C into ordered multi-classification variables. Specifically, Group A (HbA1c/HDL-C<6.32273), group B (6.32273<HbA1c/HDL-C<8.12843), group C (8.12843<HbA1c/HDL-C<10.09554), Group D (HbA1c/HDL-C>10.09554), and each group comprised 155 patients. Mantel–Haenszel chi-square trend test was performed on four groups of patients. After grouping, there was an evident linear trend between HbA1c/HDL-C and DR (P<0.001), and there was a moderate positive correlation between HbA1c/HDL-C and DR (r=0.342, P<0.001). The incidence of DR demonstrated an escalating pattern with increasing HbA1c/HDL-C quartile levels with rates of 19.4%, 45.8%, 45.2%, and 70.3% in Groups A, B, C, and D, respectively (Table 2).
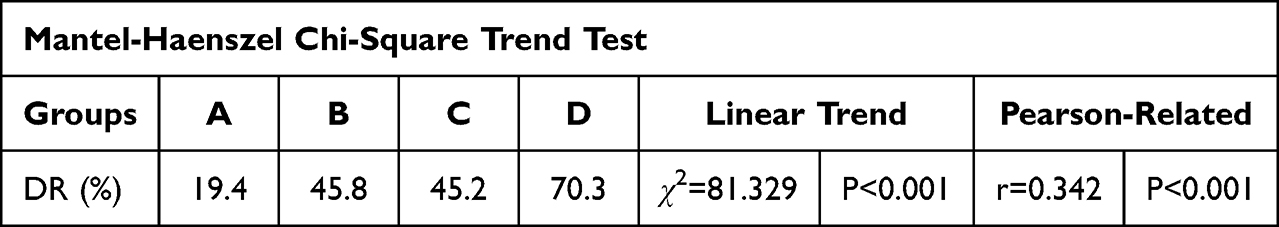 |
Table 2 HbA1c/HDL-C Quartile Intervals and DR Risk Trend Test |
Multi-Factor Regression Analysis of DR in T2DM Patients
Taking DR as the dependent variable, the independent variables were screened in turn, and the candidate variables with P<0.1: diabetes course, SBP, FBG, ALB, TG, HbA1c/HDL-C were included in the binary logistic regression equation. The HL test showed a good fit of the regression model (X2=9.248, P=0.322). Regression analysis indicated that diabetes course, SBP, FBG, HbA1c/HDL-C were independent risk factors for DR. For each additional unit of HbA1c/HDL-C, the probability of DR in T2DM patients increased by 0.334 times (Table 3 and Figure 2).
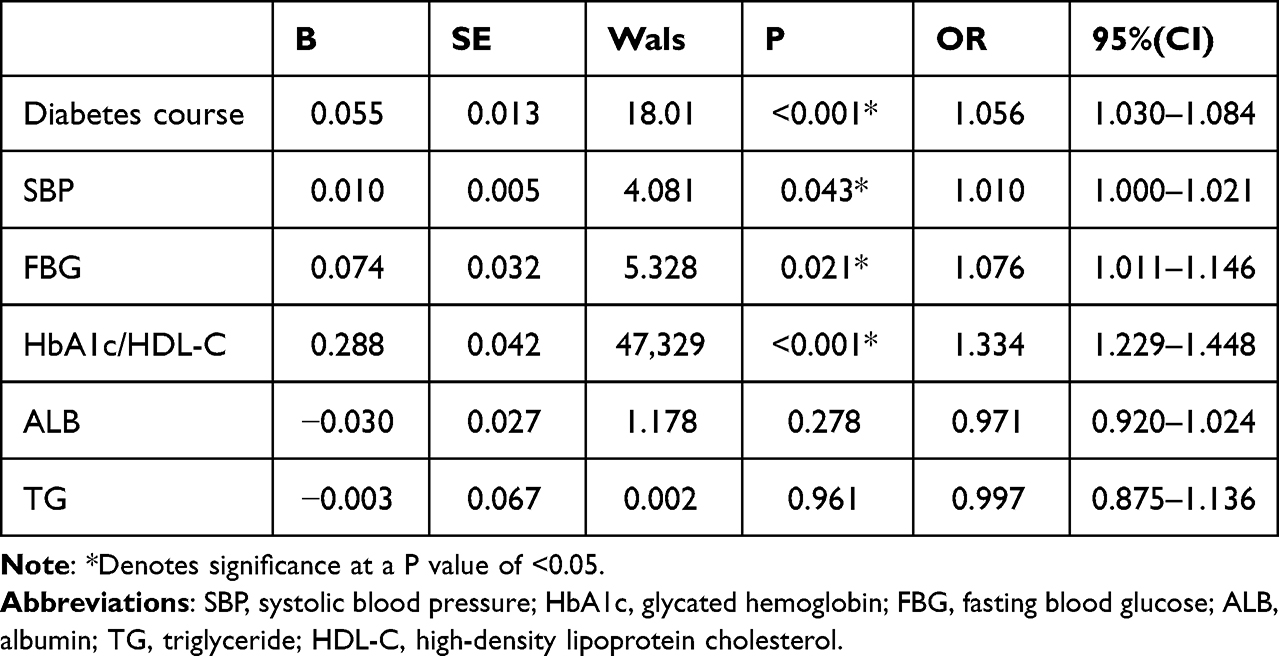 |
Table 3 Binary Logistic Regression Analysis of DR in T2DM Patients |
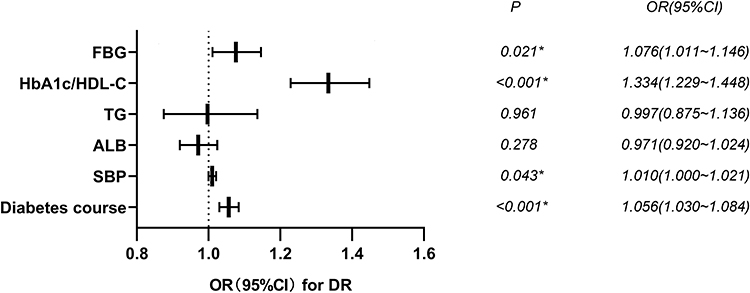 |
Figure 2 Binary logistic regression Analysis of DR in T2DM patients. Abbreviations: SBP, systolic blood pressure; HbA1c, glycated hemoglobin; FBG, fasting blood glucose; ALB, albumin; TG, triglyceride; HDL-C, high-density lipoprotein cholesterol. Note: *Denotes significance at a P value of <0.05. |
Nonlinear Relationship Analysis Between HbA1c/HDL-C and DR Risk in T2DM Patients
The relationship of DR and HbA1c/HDL-C was analysed by using restricted cubic spline. After adjusting diabetes course, SBP and FBG related confounding factors, we found a significant nonlinear relationship between HbA1c/HDL-C and DR risk (P total trend<0.0001, P nonlinear=0.0196). When HbA1c/HDL-C>8.1745, the risk of DR increased significantly, and this risk increased nonlinearly with higher HbA1c/HDL-C values (Figure 3).
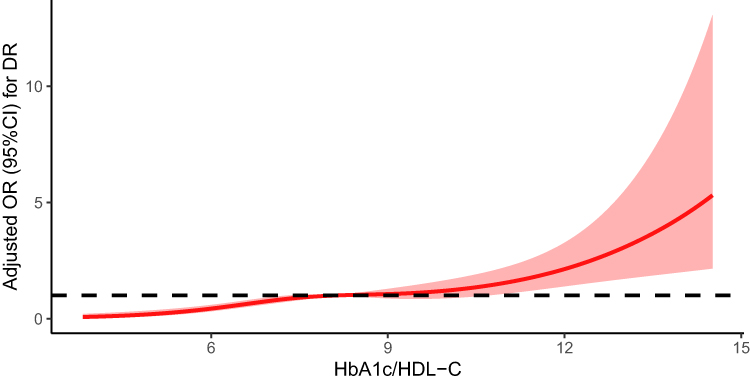 |
Figure 3 Nonlinear relationship analysis between HbA1c/HDL-C and DR risk in T2DM patients. |
ROC Curve Analysis of the Diagnostic Value of HbA1c/HDL-C for DR
ROC curve analysis demonstrated that HbA1c/HDL-C had the highest accuracy in evaluating DR, with an AUC of 0.711, a sensitivity of 53.2%, and a specificity of 78.2%. HbA1c/HDL-C was more accurate than HbA1c alone in diagnosing DR. AUC of HbA1c was 0.699, followed by FBG (0.620), diabetes course (0.605), and SBP (0.565) (Table 4 and Figure 4).
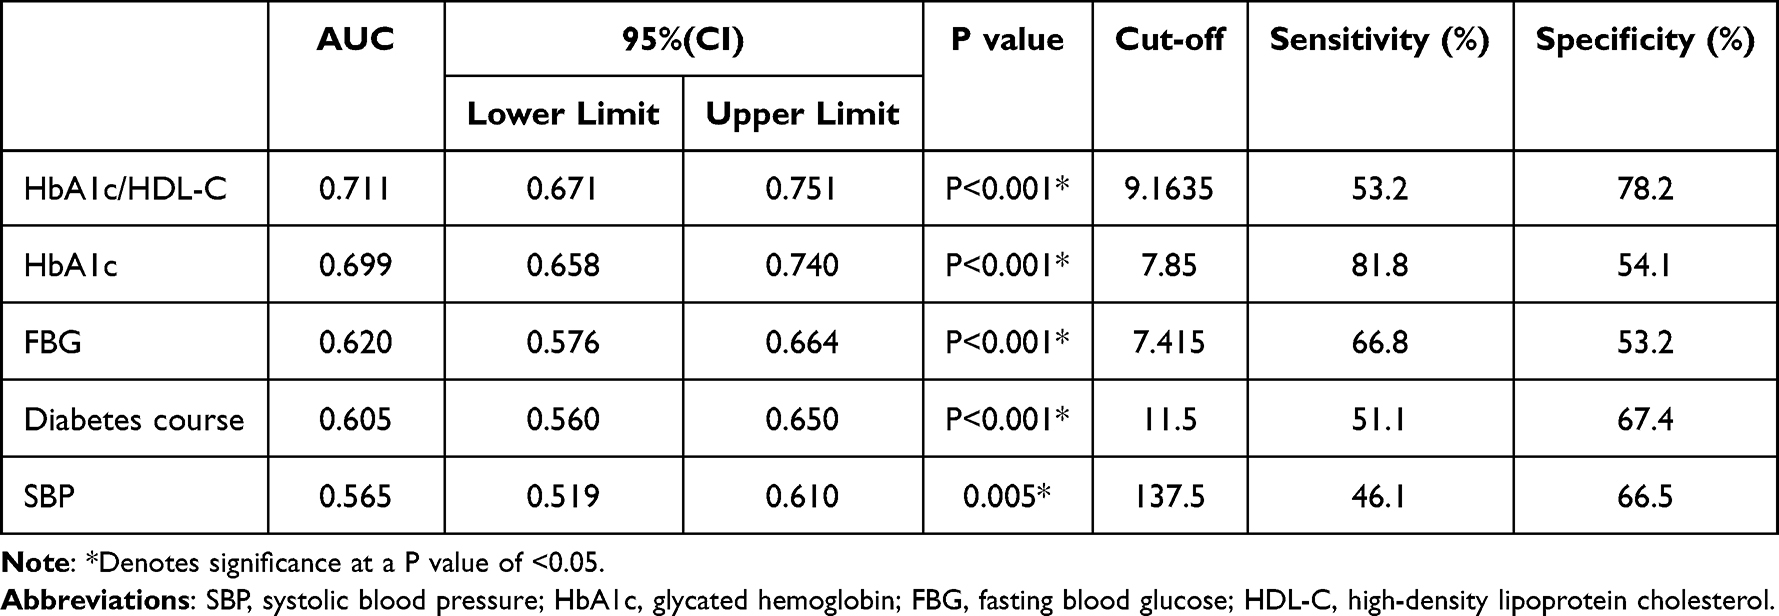 |
Table 4 ROC Curves of HbA1c/HDL-C, HbA1c, FBG, Diabetes Course, and SBP |
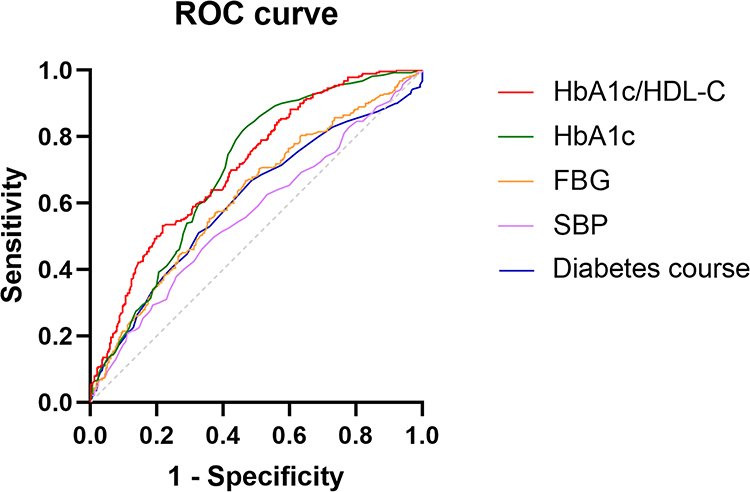 |
Figure 4 ROC curve of HbA1c/HDL-c, HbA1c, FBG, diabetes course and SBP. Abbreviations: SBP, systolic blood pressure; HbA1c, glycated hemoglobin; FBG, fasting blood glucose; HDL-C, high-density lipoprotein cholesterol. |
Discussion
In the past 40 years, the global prevalence of diabetes has increased from 108 million to 537 million, and the rapid economic growth and urbanization of various countries have made the global diabetes burden increasingly heavier.13 Diabetes and diabetes-related complications seriously affect the quality of life and longevity of patients. According to the report of the Global Disease Burden Research Vision Loss Expert Group, from 1990 to 2020, the blindness rate caused by all kinds of reasons except DR declined regionally, but only DR was the only blinding factor that continued to increase in the past 30 years.14 Among them, vision-threatening DR (VTDR) is the main cause of visual impairment in patients, including severe non-proliferative diabetic retinopathy (NPDR), proliferative diabetic retinopathy (PDR), and diabetic macular edema (DME). VTDR not only seriously affects patients’ vision but also increases the risk of death. According to the latest research by Takao, and so on. DR was independently related to all-cause, vascular, and non-cancer non-vascular mortality, and VTDR was a more powerful predictor of all-cause, vascular, and non-cancer non-vascular mortality.15 A Meta-Analysis for Eye Disease shows that the global prevalence of DR is as high as 34.6%, of which the prevalence of VTDR is about 10.2%.16 However, globally, there are only 7.16 ophthalmologists per 1000 patients with VTDR, and the density of ophthalmologists is only 0.9117 in Africa where the prevalence of VTDR is the highest.17 The shortage of ophthalmologists makes the treatment of VTDR face great challenges. Therefore, in order to avoid the progression to VTDR, it is very important to find simple and accessible biological indicators to predict and diagnose DR early.
Researchers have shown that microvascular endothelial cells are the main target of hyperglycemia, which increases inflammatory response and oxidative stress in vivo and directly leads to vascular endothelial cell dysfunction.18 Controlling blood glucose is a fundamental measure to delay diabetic microangiopathy. HbA1c is the glycosylation part of hemoglobin, and its synthesis rate is directly proportional to the concentration of glucose in the environment where red blood cells are located, thus it directly reflects the level of blood glucose metabolism in the body. A 4-year cohort study showed that HbA1 level was the main predictor of DR progress.19 At the same time, Calderon and others thought that strictly controlling the HbA1c level below 7% can significantly reduce the occurrence of DR.20 Our research exhibited that the levels of HbA1c and FBG in DR group were significantly higher than those in NDR group, which was consistent with Song et al.5 To wrap up, strict blood glucose control is still the most critical and effective strategy to prevent DR. With the development of diabetes mellitus, the incidence of diabetic dyslipidemia (DD) increases gradually, and the plasma lipid spectrum of diabetic patients also changes substantially. In addition to the main elevated quantitative lipoprotein TG and the reduction of HDL-C, qualitative lipoproteins such as LDL-C and very low-density lipoprotein cholesterol (VLDL-C) have also increased abnormally, accompanied by apolipoprotein glycosylation, and the variation of these lipoproteins is closely related to insulin resistance.10,11 Therefore, hyperglycemia causes lipid metabolism disorder, while abnormally increased and ectopic accumulated lipids continue to damage the function of islet β cells, resulting in decreased intake and utilization of blood glucose and aggravating the vicious cycle of blood glucose metabolism disorder. Clinical studies have found that most lipid-lowering drugs can improve glucose homeostasis, and the efficacy of lipid-lowering therapy in diabetic patients is negatively correlated with blood glucose level.11,21 Diabetes mellitus complicated with DD, especially when TG and LDL-C are elevated, is often considered an important risk factor for diabetic vascular complications.22,23 On the contrary, HDL-C in blood lipids plays a protective role.24 A cross-sectional study involving more than 8000 diabetic patients also proved the view that HDL-C was negatively correlated with insulin resistance steady-state model (HOMA-IR).25 The reason is that HDL-C mainly plays the role of reversing cholesterol, transporting cholesterol from peripheral tissues, including blood vessel walls, to the liver for metabolism, promoting cholesterol clearance, and maintaining lipid balance in the body. At the same time, HDL-C can resist the damage of vascular endothelial cells caused by hyperglycemia and reduce the risk of diabetic vascular complications by increasing insulin sensitivity and improving the function of islet β cells.25 However, clinical researchers have found that the level of HDL-C in most patients with T2DM is lower than normal.11 Hyperglycemia and low HDL-C continuously aggravate insulin resistance, oxidative stress, and inflammatory reaction in the body, causing persistent tissue damage and end-organ complications.25
Considering that, in clinical practice, it often happens that patients’ HbA1c or blood lipids are at normal levels, but they still progress to DR. In order to evaluate patients’ condition more accurately, we have been looking for more biological indicators to help diagnose DR. Some researchers integrated HbA1c and HDL-C into a new index HbA1c/HDL-C to predict carotid atherosclerosis, and found that HbA1c/HDL-C was positively correlated with carotid atherosclerosis.26 However, the correlation between HbA1c/HDL-C and T2DM or related complications has not been reported, so this study aims to explore the role of HbA1c/HDL-C in DR. HbA1c/HDL-C not only combines the two pathways of blood glucose and blood lipid metabolism in vivo, reflects the metabolism in vivo more stably, but also the calculation method of HbA1c/HDL-C is fast, simple, cost-effective. At the same time, HbA1c/HDL-C is obtained only by blood test, which greatly facilitates patients with mobility and cognitive impairment who cannot cooperate with ophthalmoscopy and helps clinicians to diagnose and intervene as early as possible. In our study, HbA1c/HDL-C in DR group was significantly higher than that in NDR group, and HbA1c/HDL-C was moderately positively correlated with the risk of DR. As HbA1c/HDL-C levels increased, the risk of developing DR in T2DM patients increased gradually. In addition, our study showed that HbA1c/HDL-C is an independent risk factor for evaluating the risk of DR in patients with T2DM. ROC curve analysis demonstrated that the area under HbA1c/HDL-C curve was the largest, which was more valuable than HbA1c alone in diagnosing DR, and might become a new biological index for early screening of DR.
Of course, there are still some limitations in this study. First of all, this study is retrospective, and the causal relationships between DR and HbA1c/HDL-C cannot be determined. Secondly, the detection results of HbA1c are affected by the life span of red blood cells, while at the same time, pregnancy, anemia, or the use of certain drugs may also affect the level of HbA1c, thus limiting the diagnosis and predictive value of HbA1c/HDL-C. Finally, the results of this study are limited to the local population, with a relatively small sample size, limiting the broader applicability to most T2DM patients. Consequently, the study on the correlation between HbA1c/HDL-C and DR patients still needs to be verified by a large number of subsequent clinical trials.
Conclusion
Our results discuss for the first time that HbA1c/HDL-C is closely related to the occurrence of DR in T2DM patients, and HbA1c/HDL-C serves as independent risk factors for DR in patients with T2DM. In addition, the high accuracy of HbA1c/HDL-C in diagnosing DR underscores its potential as early biological indicators for DR diagnosis.
Ethical Approval and Informed Consent
The study followed the principles in the Declaration of Helsinki and was approved by the Ethical Committees of Hebei General Hospital (No.2023183). Informed consent was obtained from all individuals participating in the study.
Disclosure
The authors report no conflicts of interest in this work.
References
1. Lin KY, Hsih WH, Lin YB, Wen CY, Chang TJ. Update in the epidemiology, risk factors, screening, and treatment of diabetic retinopathy. J Diabetes Investig. 2021;12(8):1322–1325. PMID: 33316144; PMCID: PMC8354492. doi:10.1111/jdi.13480
2. Le HG, Shakoor A, Cicinelli MVM. Diabetic and retinal vascular eye disease. Med Clin North Am. 2021;105(3):455–472. PMID: 33926641. doi:10.1016/j.mcna.2021.02.004
3. Vujosevic S, Aldington SJ, Silva P, et al. Screening for diabetic retinopathy: new perspectives and challenges. Lancet Diabetes Endocrinol. 2020;8(4):337–347. PMID: 32113513. doi:10.1016/S2213-8587(19)30411-5
4. Braga F, Dolci A, Mosca A, Panteghini M. Biological variability of glycated hemoglobin. Clin Chim Acta. 2010;411(21–22):1606–1610. PMID: 20688052. doi:10.1016/j.cca.2010.07.030
5. Song KH, Jeong JS, Kim MK, et al. Discordance in risk factors for the progression of diabetic retinopathy and diabetic nephropathy in patients with type 2 diabetes mellitus. J Diabetes Investig. 2019;10(3):745–752. PMID: 30300472; PMCID: PMC6497586. doi:10.1111/jdi.12953
6. Lee S, Liu T, Zhou J, Zhang Q, Wong WT, Tse G. Predictions of diabetes complications and mortality using hba1c variability: a 10-year observational cohort study. Acta Diabetol. 2021;58(2):171–180. PMID: 32939583. doi:10.1007/s00592-020-01605-6
7. Boye KS, Thieu VT, Lage MJ, Miller H, Paczkowski R. The association between sustained HbA1c control and long-term complications among individuals with type 2 diabetes: a retrospective study. Adv Ther. 2022;39(5):2208–2221. PMID: 35316502; PMCID: PMC9056490. doi:10.1007/s12325-022-02106-4
8. American Diabetes Association. Standards of medical care in diabetes--2010. Diabetes Care. 2010;1(Suppl 1):S11–61. Erratum in: Diabetes Care. 2010 33(3):692. PMID: 20042772; PMCID: PMC2797382. doi:10.2337/dc10-S011
9. Muačević-Katanec D, Reiner Z. Diabetic dyslipidemia or ‘diabetes lipidus’? Expert Rev Cardiovasc Ther. 2011;9(3):341–348. PMID: 21438813. doi:10.1586/erc.11.17
10. Falkevall A, Mehlem A, Palombo I, et al. Reducing VEGF-B signaling ameliorates renal lipotoxicity and protects against diabetic kidney disease. Cell Metab. 2017;25(3):713–726. PMID: 28190774. doi:10.1016/j.cmet.2017.01.004
11. Athyros VG, Doumas M, Imprialos KP, et al. Diabetes and lipid metabolism. Hormones. 2018;17(1):61–67. PMID: 29858856. doi:10.1007/s42000-018-0014-8
12. Wang L, Yan N, Zhang M, Pan R, Dang Y, Niu Y. The association between blood glucose levels and lipids or lipid ratios in type 2 diabetes patients: a cross-sectional study. Front Endocrinol. 2022;13:969080. PMID: 36147575; PMCID: PMC9485560. doi:10.3389/fendo.2022.969080
13. Kropp M, Golubnitschaja O, Mazurakova A, et al. Diabetic retinopathy as the leading cause of blindness and early predictor of cascading complications-risks and mitigation. EPMA J. 2023;14(1):21–42. PMID: 36866156; PMCID: PMC9971534. doi:10.1007/s13167-023-00314-8
14. Steinmetz JD, Bourne RRA, Briant PS; GBD 2019 Blindness and Vision Impairment Collaborators;Vision Loss Expert Group of the Global Burden of Disease Study. Causes of blindness and vision impairment in 2020 and trends over 30 years, and prevalence of avoidable blindness in relation to VISION 2020: the Right to Sight: an analysis for the Global Burden of Disease Study. Lancet Glob Health. 2021;9(2):e144–e160. Erratum in: Lancet Glob Health. 2021 Apr; 9(4):e408. PMID: 33275949; PMCID: PMC7820391. doi:10.1016/S2214-109X(20)30489-7
15. Takao T, Suka M, Yanagisawa H, Kasuga M. Combined effect of diabetic retinopathy and diabetic kidney disease on all-cause, cancer, vascular and non-cancer non-vascular mortality in patients with type 2 diabetes: a real-world longitudinal study. J Diabetes Investig. 2020;11(5):1170–1180. PMID: 32267626; PMCID: PMC7477514. doi:10.1111/jdi.13265
16. Yau JW, Rogers SL, Kawasaki R, et al; Meta-Analysis for Eye Disease (META-EYE) Study Group. Global prevalence and major risk factors of diabetic retinopathy. Diabetes Care. 2012;35(3):556–564. PMID: 22301125; PMCID: PMC3322721. doi:10.2337/dc11-1909
17. Teo ZL, Tham YC, Yu M, Cheng CY, Wong TY, Sabanayagam C. Do we have enough ophthalmologists to manage vision-threatening diabetic retinopathy? A global perspective. Eye. 2020;34(7):1255–1261. PMID: 31992863; PMCID: PMC7314752. doi:10.1038/s41433-020-0776-5
18. Yang J, Liu Z. Mechanistic pathogenesis of endothelial dysfunction in diabetic nephropathy and retinopathy. Front Endocrinol. 2022;13:816400. PMID: 35692405; PMCID: PMC9174994. doi:10.3389/fendo.2022.816400
19. Salinero-Fort MÁ, San Andrés-Rebollo FJ, de Burgos-Lunar C, Arrieta-Blanco FJ, Gómez-Campelo P, Wang G; MADIABETES Group. Four-year incidence of diabetic retinopathy in a Spanish cohort: the MADIABETES study. PLoS One. 2013;8(10):e76417. PMID: 24146865; PMCID: PMC3798464. doi:10.1371/journal.pone.0076417
20. Calderon GD, Juarez OH, Hernandez GE, Punzo SM, De la Cruz ZD. Oxidative stress and diabetic retinopathy: development and treatment. Eye. 2017;31(8):1122–1130. PMID: 28452994; PMCID: PMC5558229. doi:10.1038/eye.2017.64
21. Goldberg RB. Dyslipidemia in diabetes: when and how to treat? Endocrinol Metab Clin North Am. 2022;51(3):603–624. PMID: 35963631. doi:10.1016/j.ecl.2022.02.011
22. Huh JH, Han KD, Cho YK, et al. Remnant cholesterol and the risk of cardiovascular disease in type 2 diabetes: a nationwide longitudinal cohort study. Cardiovasc Diabetol. 2022;21(1):228. PMID: 36324177; PMCID: PMC9632127. doi:10.1186/s12933-022-01667-6
23. Huang J, Gu JX, Bao HZ, et al. Elevated serum small dense low-density lipoprotein cholesterol may increase the risk and severity of coronary heart disease and predict cardiova scular events in patients with type 2 diabetes mellitus. Dis Markers. 2021;2021:5597028. PMID: 34046097; PMCID: PMC8128552. doi:10.1155/2021/5597028
24. Ishibashi T, Kaneko H, Matsuoka S, et al. HDL cholesterol and clinical outcomes in diabetes mellitus. Eur J Prev Cardiol. 2023;30(8):646–653. PMID: 36738171. doi:10.1093/eurjpc/zwad029
25. Tabara Y, Arai H, Hirao Y, et al.; Nagahama study group. Different inverse association of large high-density lipoprotein subclasses with exacerbation of insulin resistance and incidence of type 2 diabetes: the nagahama study. Diabet Res Clin Pract. 2017;127:123–131. PMID: 28365559. doi:10.1016/j.diabres.2017.03.018
26. Hu X, Li W, Wang C, et al. Association between the plasma-glycated hemoglobinA1c/high-density lipoprotein cholesterol ratio and carotid atherosclerosis: a retrospective study. J Diabetes Res. 2021;2021:9238566. PMID: 34805413; PMCID: PMC8598339. doi:10.1155/2021/9238566
 © 2024 The Author(s). This work is published and licensed by Dove Medical Press Limited. The
full terms of this license are available at https://www.dovepress.com/terms
and incorporate the Creative Commons Attribution
- Non Commercial (unported, 3.0) License.
By accessing the work you hereby accept the Terms. Non-commercial uses of the work are permitted
without any further permission from Dove Medical Press Limited, provided the work is properly
attributed. For permission for commercial use of this work, please see paragraphs 4.2 and 5 of our Terms.
© 2024 The Author(s). This work is published and licensed by Dove Medical Press Limited. The
full terms of this license are available at https://www.dovepress.com/terms
and incorporate the Creative Commons Attribution
- Non Commercial (unported, 3.0) License.
By accessing the work you hereby accept the Terms. Non-commercial uses of the work are permitted
without any further permission from Dove Medical Press Limited, provided the work is properly
attributed. For permission for commercial use of this work, please see paragraphs 4.2 and 5 of our Terms.
Recommended articles
Comparison of Clinical Profiles, Demographics, and Surgical Outcomes of 25-Gauge Vitrectomy for Proliferative Diabetic Retinopathy in Young Adults with Type 1 or Type 2 Diabetes
Zhang M, Zhang J, Xu G, Ruan L, Huang X
Diabetes, Metabolic Syndrome and Obesity 2023, 16:1967-1975
Published Date: 29 June 2023
Trapa Bispinosa Roxb. Inhibits the Insulin-Dependent AKT/WNK1 Pathway to Induce Autophagy in Mice with Type 2 Diabetes
Suzuki T, Sato T, Masuhara K, Tokusanai M, Akatsuka H, Kashikawa T, Suzuki Y
Diabetes, Metabolic Syndrome and Obesity 2023, 16:3095-3104
Published Date: 5 October 2023
Exploring the Correlation Between the Systemic Immune Inflammation Index (SII), Systemic Inflammatory Response Index (SIRI), and Type 2 Diabetic Retinopathy

Wang S, Pan X, Jia B, Chen S
Diabetes, Metabolic Syndrome and Obesity 2023, 16:3827-3836
Published Date: 24 November 2023
Construction of a Nomogram-Based Prediction Model for the Risk of Diabetic Kidney Disease in T2DM
Wang X, Liu X, Zhao J, Chen M, Wang L
Diabetes, Metabolic Syndrome and Obesity 2024, 17:215-225
Published Date: 12 January 2024
Effect of Helicobacter Pylori Infection on Glucose Metabolism, Lipid Metabolism and Inflammatory Cytokines in Nonalcoholic Fatty Liver Disease Patients
Xiao QY, Wang RL, Wu HJ, Kuang WB, Meng WW, Cheng Z
Journal of Multidisciplinary Healthcare 2024, 17:1127-1135
Published Date: 14 March 2024