Back to Journals » Diabetes, Metabolic Syndrome and Obesity » Volume 16
Correlation Between Fibrinogen/Albumin and Diabetic Peripheral Neuropathy
Authors Ban J, Pan X ![]() , Yang L
, Yang L ![]() , Jia Z, Zhen R
, Jia Z, Zhen R ![]() , Zhang X, Chen S
, Zhang X, Chen S
Received 25 June 2023
Accepted for publication 16 September 2023
Published 27 September 2023 Volume 2023:16 Pages 2991—3005
DOI https://doi.org/10.2147/DMSO.S427510
Checked for plagiarism Yes
Review by Single anonymous peer review
Peer reviewer comments 2
Editor who approved publication: Dr Konstantinos Tziomalos
Jiangli Ban,1,2 Xiaoyu Pan,2,3 Liqun Yang,2 Zhuoya Jia,2,3 Ruoxi Zhen,2,3 Xueqing Zhang,2,4 Shuchun Chen2,3
1Graduate School of Hebei North University, Zhangjiakou, People’s Republic of China; 2Department of Endocrinology, Hebei General Hospital, Shijiazhuang, People’s Republic of China; 3Graduate School of Hebei Medical University, Shijiazhuang, People’s Republic of China; 4Graduate School of North China University of Science and Technology, Tangshan, People’s Republic of China
Correspondence: Shuchun Chen, Department of Endocrinology, Hebei General Hospital, 348 Heping West Road, Shijiazhuang, 050051, People’s Republic of China, Tel/Fax +86 31185988406, Email [email protected]
Purpose: This study aimed to examine the correlation between fibrinogen/albumin (FAR) and diabetic peripheral neuropathy (DPN).
Patients and Methods: A total of 342 patients were included and categorized into either the DPN group or the Non-DPN (NDPN) group based on their DPN status. The FAR index was determined by calculating the ratio of fibrinogen (FIB) to serum albumin (ALB), multiplied by 100. The participants were then divided into a High-FAR group and a Low-FAR group using the median FAR value as the threshold. Neurophysiological data were collected from the participants, which included motor conduction velocity (MCV) and sensory conduction velocity (SCV).
Results: The DPN group displayed higher FAR levels [(DPN vs NDPN:6.72 (5.89,7.74) vs 5.94± 1.14], in addition to slower SCV and MCV data compared to the NDPN group. The high FAR group had a higher prevalence of DPN (78.9% vs 55.6%) (P< 0.05). There was a negative correlation between FAR and NCV, including bilateral median nerve SCV, left ulnar nerve SCV, bilateral median nerve MCV, bilateral common peroneal nerve MCV, bilateral tibial nerve MCV, and left ulnar nerve MCV. FAR was revealed to be an independent risk factor for the development of DPN in patients and demonstrated a greater predictive value for DPN development in Type 2 diabetes mellitus (T2DM) compared with FIB, HbA1c.
Conclusion: The results suggest that monitoring FAR levels in patients with T2DM could identify those at higher risk for developing DPN, making the FAR index a valuable predictor of DPN development. Furthermore, since FAR has an inverse relationship with NCV, it stands to reason that high FAR levels may indicate nerve damage and slower conduction velocities. Thus, managing FAR could prove beneficial in both preventing and delaying the onset of DPN in T2DM patients.
Keywords: type 2 diabetes mellitus, diabetic peripheral neuropathy, fibrinogen/albumin
Introduction
Type 2 diabetes mellitus (T2DM) is a chronic disease characterized by high blood glucose levels due to defects in insulin secretion or action.1 Studies show that there are about 130 million people with diabetes in China, and the number of people with diabetes ranks first in the world.2 Diabetic peripheral neuropathy (DPN) is a common complication of diabetes that can significantly impact the quality of life of patients, and it affects about 50% of people with type 2 diabetes.3 A recent study showed that diabetic polyneuropathy affects approximately one in five Danish patients with recently diagnosed T2DM.4 DPN is characterized by a decrease or loss of sensory and/or motor nerve function, which can lead to disability and other complications.5 Thakore’s study found a significant association between pain in DPN and an increased risk of vascular events and mortality.6 Early detection, diagnosis and treatment of DPN are important for managing the condition and preventing its progression. It is also essential to control blood glucose levels and manage other risk factors to prevent the development of DPN in patients with T2DM.
Fibrinogen (FIB) is a protein involved in blood clotting and its levels increase during inflammation, leading to an increase in blood viscosity.7,8 Studies have shown that high levels of FIB are associated with complications of diabetes.9 Albumin (ALB) is a protein that serves as an indicator of the body’s nutritional status, and low levels of albumin can promote the development of diabetes and its complications.10 The fibrinogen/albumin ratio (FAR) is a new inflammatory biomarker11 that has been studied primarily in cardiovascular disease and tumorigenesis.12,13 Studies have found a correlation between FAR and diabetic nephropathy,14 and there is little information on its relationship with DPN. This is the first article that goes to evaluate the relationship between FAR and DPN. The study aimed to explore differences in clinical indicators and nerve conduction velocity between T2DM patients with and without DPN. It also looked for a correlation between FAR and NCV, and evaluated the predictive value of FAR for DPN. The study involved 324 T2DM patients and aimed to provide useful information for the diagnosis and treatment of DPN.
Materials and Methods
The Study Population
This study selected clinical data from 342 cases of T2DM patients who were hospitalized in the Department of Endocrinology, Hebei General Hospital from September 2021 to August 2022. The patients were divided into DPN and NDPN groups based on whether they had DPN or not. The FAR index was calculated based on the ALB and FIB levels and divided into low and high groups using the median as the boundary. The Hebei General Hospital’s ethics committee gave its approval before the research was conducted in accordance with the Declaration of Helsinki’s criteria. The study objectives were explained to the patients and they signed informed consent forms. Participants in the study had to meet the 1999 World Health Organization diagnostic criteria for diabetes mellitus. And the diagnosis of DPN was based on the 2009 Chinese Clinical Diagnostic and Treatment Guidelines for Diabetic Peripheral Neuropathy: (1) A clear history of diabetes or a basis for a diagnosis of diabetes; (2) Development of neuropathy at or after diagnosis of diabetes; (3) Clinical signs and symptoms of limb movement, sensory or autonomic neuropathy; DPN is diagnosed if two or more of the following five tests are abnormal: Abnormal temperature sensations; Nylon wire examination shows reduced or absent sensation in the foot; Vibronic abnormalities; Loss of ankle reflex; Slowing of two or more NCV tests. Exclusion criteria included patients with type 1 diabetes, acute complications of type 2 diabetes, pregnancy, severe hepatic or renal insufficiency, abnormal thyroid function, malignant tumors, lumbar spine disease, sequelae of cerebrovascular disease, previous surgery, trauma, or use of drugs affecting nerve conduction.
Clinical Assessment and Biochemical Measurements
Participants filled out a questionnaire about basic information, and their blood pressure, weight and height were measured. Blood indicators including ALB, Alanine aminotransferase (ALT), Aspartate transaminases (AST), Fasting blood glucose (FBG), Total cholesterol (TC), Triglycerides (TG), High-density cholesterol (HDL-C), Low-density cholesterol (LDL-C), Blood urea nitrogen (BUN), Serum creatinine (Scr), Uric acid (UA), Glomerular filtration rate (GFR), and FIB were collected from overnight fasted subjects and measured by laboratory physicians. Glycosylated hemoglobin (HbA1c) was measured using high-pressure liquid chromatography in the hospital’s laboratory. Neurologists performed neuroelectrophysiological examinations which included measuring the motor nerve conduction velocity of the bilateral median nerve, ulnar nerve, tibial nerve, and common peroneal nerve. Additionally, they measured the sensory nerve conduction velocities of the bilateral median nerve, ulnar nerve, superficial peroneal nerve, and sural nerve, and recorded the test results.
Calculation of Parameters


Statistical Analysis
The researchers used SPSS 25.0 software to analyze the collected data. They used different statistical tests depending on the distribution of the data. For continuous data, they either presented the mean and standard deviation or the median with 25th and 75th percentiles. Categorical data was presented as numbers and percentages. Different statistical tests were used to compare groups. The relationship between FAR and clinical indicators and nerve conduction velocity was analyzed using Spearman correlation. Binary logistic regression analysis was applied to explore the correlation between FAR and DPN. Statistical significance was set at P<0.05 and ROC and AUC were used to calculate the predictive value of FAR for DPN development in patients with T2DM.
Results
Comparison of Clinical Characteristics Between the NDPN Group and the DPN Group
This study included a total of 342 patients with T2DM, of which 67.3% (230/342) had DPN. The FAR index was higher in the DPN group compared to the NDPN group, as shown by Figure 1. The DPN group had higher Diabetic Retina (DR) prevalence, and patients were older with longer T2DM duration, higher SBP, HbA1c, and FIB, and lower ALB, AST, GFR, TC, and LDL-C levels compared to the NDPN group (P<0.05). However, there were no significant differences in gender (see Figure 2), smoking, drinking, DBP, BMI, ALT, FBG, BUN, Scr, UA, TG, or HDL-C levels between the two groups (P>0.05) (see Table 1).
 |
Table 1 Comparison of Indicators Between NDPN and DPN Groups |
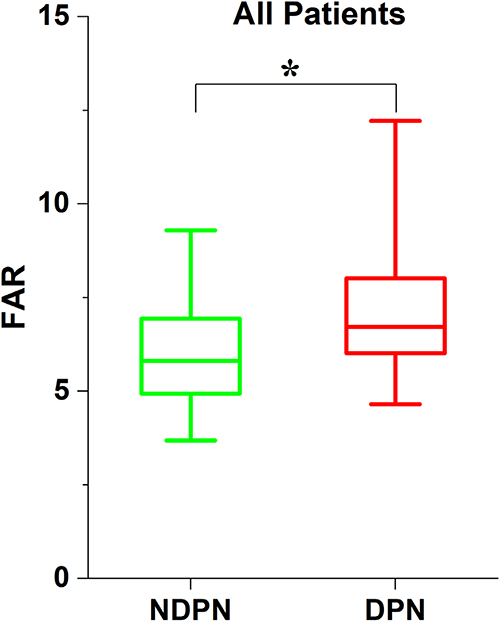 |
Figure 1 Comparison of FAR index between NDPN group and DPN group. Note: *Denotes significance at a P value of <0.05. |
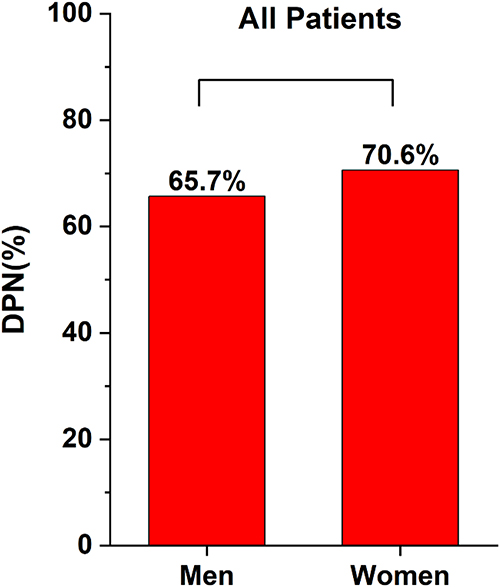 |
Figure 2 Comparisons of DPN morbidity in the men group and women group. Note: *Denotes significance at a P value of <0.05. |
Comparison of NCV in the NDPN Group and the DPN Group
Table 2 shows that patients in the DPN group had slower individual SCV and MCV in various nerves compared to the NDPN group (p<0.05). This included SCV of bilateral median nerve, superficial peroneal nerve, sural nerve, ulnar nerve, and MCV of bilateral median nerve, common peroneal nerve, tibial nerve, and ulnar nerve.
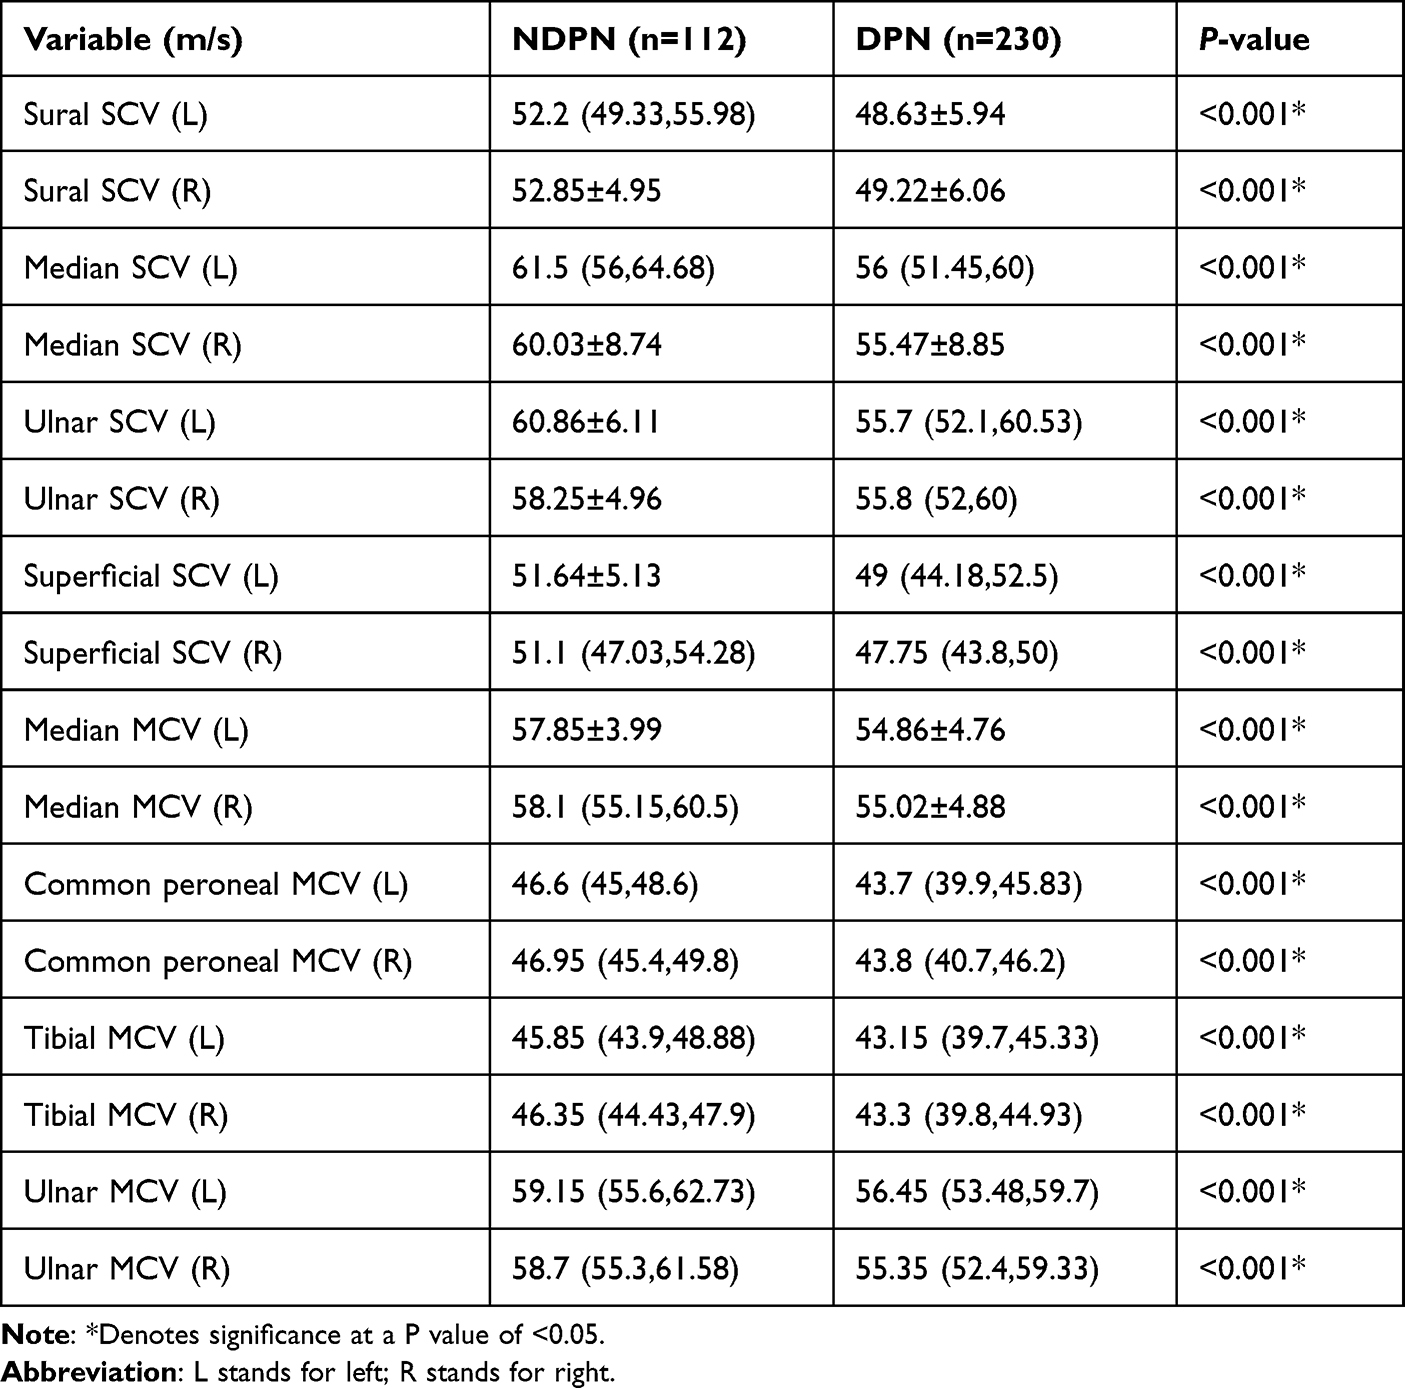 |
Table 2 Comparison of NCV Between NDPN and DPN Groups |
Comparison of Clinical Characteristics of Patients in the Low-FAR and High-FAR Groups
The High-FAR group had a higher incidence of DR and DPN than the Low-FAR group (P<0.05) (see Figure 3). Patients in the High-FAR group were older, had longer disease duration, higher SBP, HbA1c, FIB, and FAR levels, had a smaller proportion of men, and lower ALB, ALT, AST, and GFR levels than the Low-FAR group. However, there were no significant differences in other factors between the two groups (p>0.05) (see Table 3).
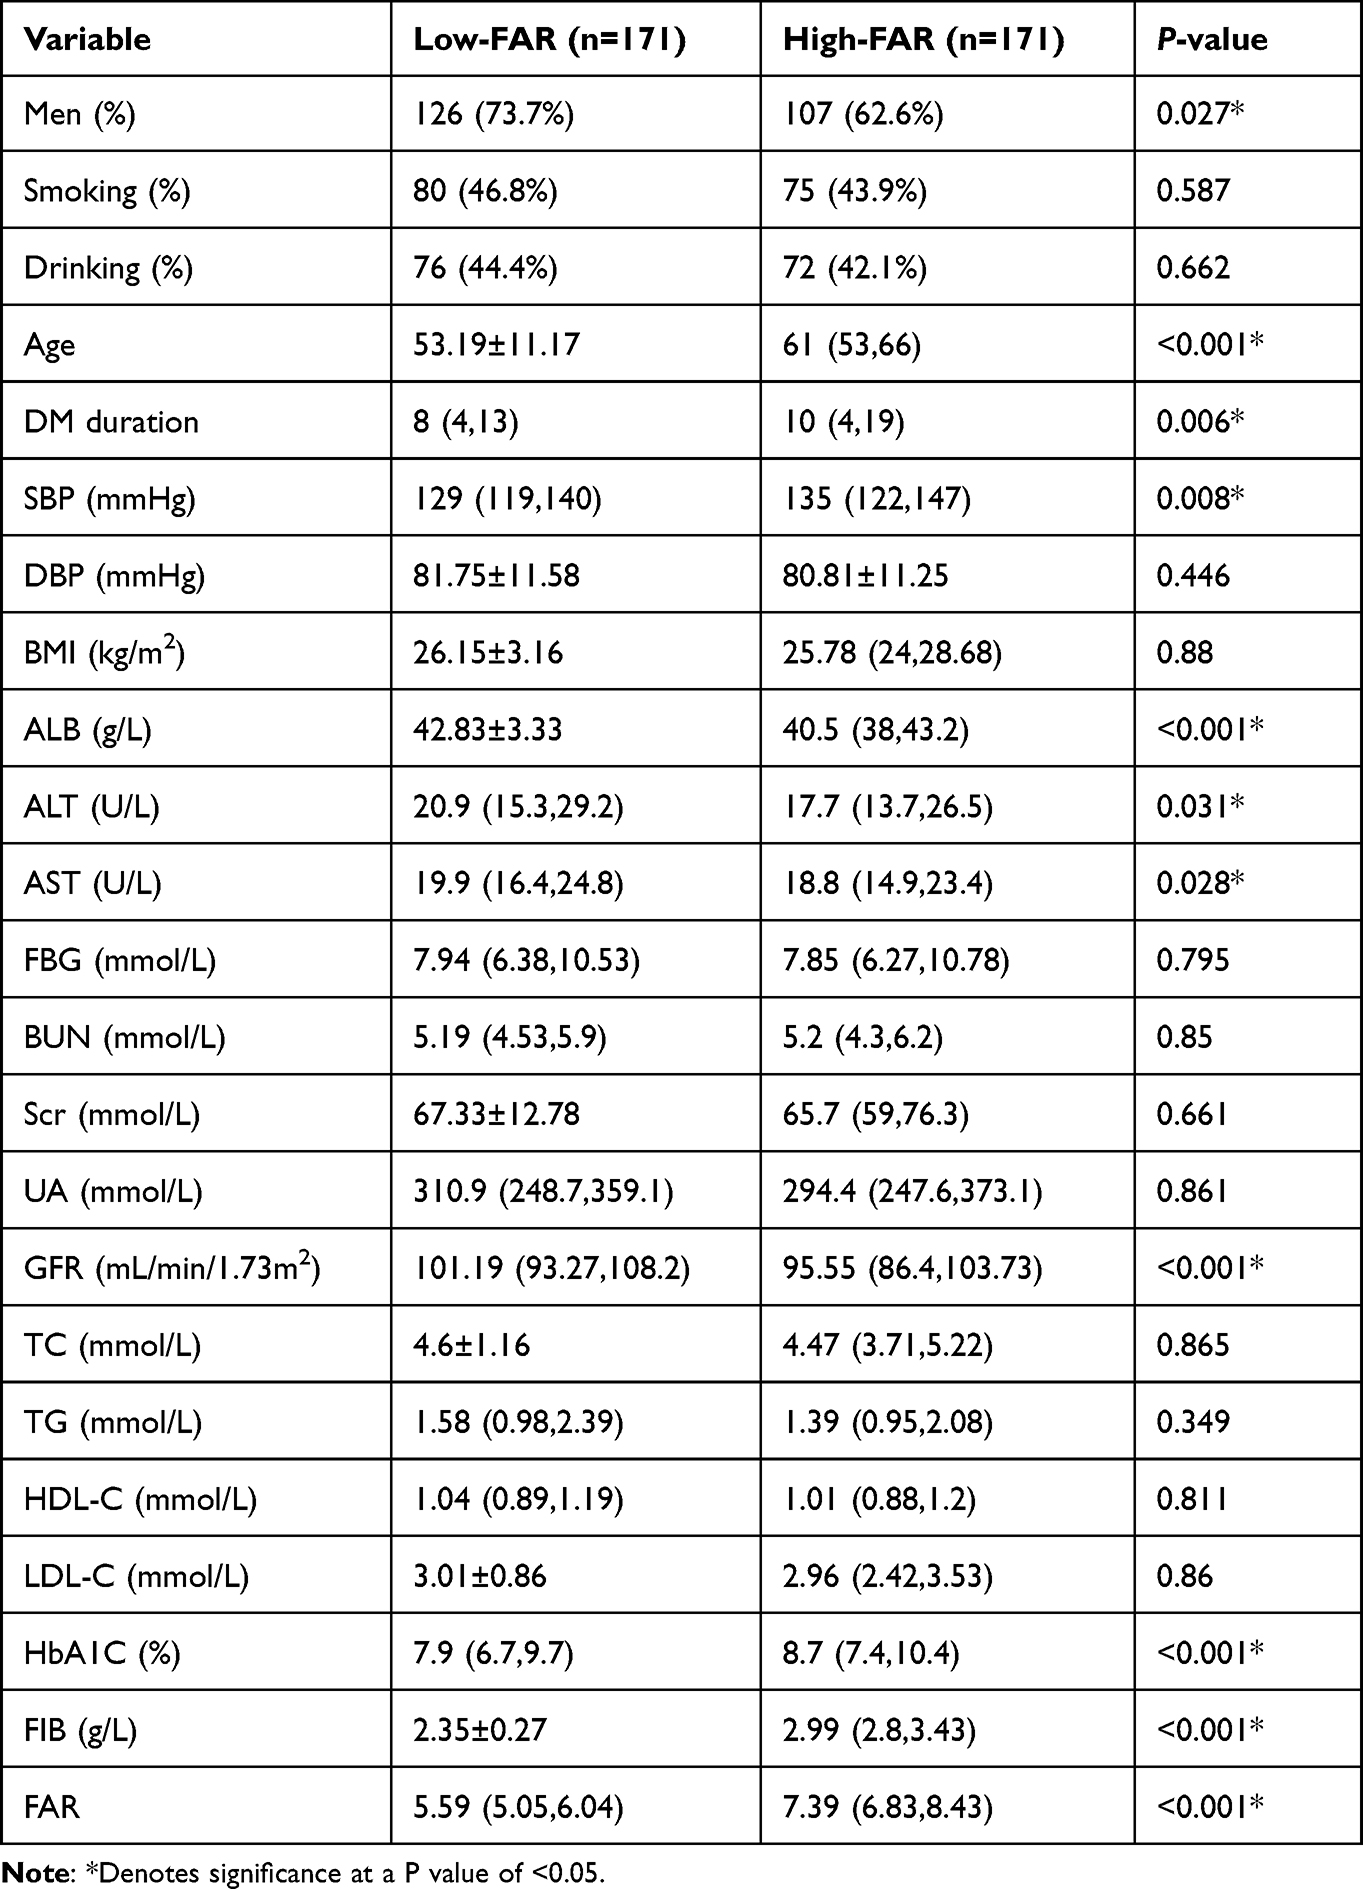 |
Table 3 Comparison of Indicators Between the Low-FAR Group and High-FAR Group |
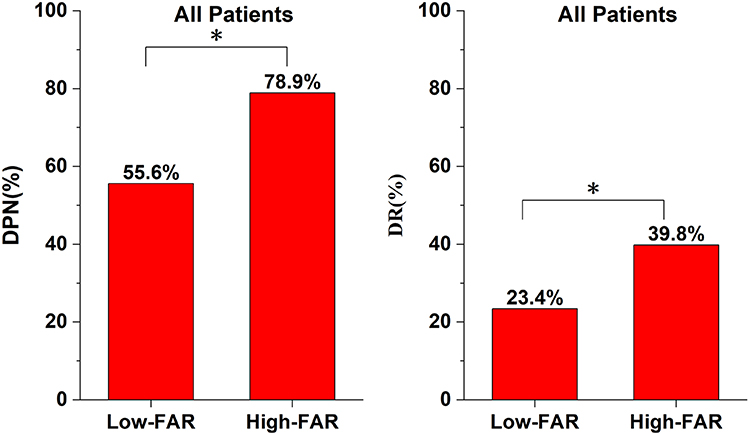 |
Figure 3 Comparisons of DPN and DR morbidity in the Low-FAR group and High-FAR group. Note: *Denotes significance at a P value of <0.05. |
Comparison of NCV Between Patients in the Low-FAR and High-FAR Groups
The High-FAR group had slower right median nerve SCV, left ulnar nerve SCV, bilateral median nerve MCV, bilateral common peroneal nerve MCV, bilateral tibial nerve MCV, and bilateral ulnar nerve MCV than the Low-FAR group (P<0.05). However, there were no significant differences in other nerve conduction parameters between the two groups (P>0.05) (see Table 4).
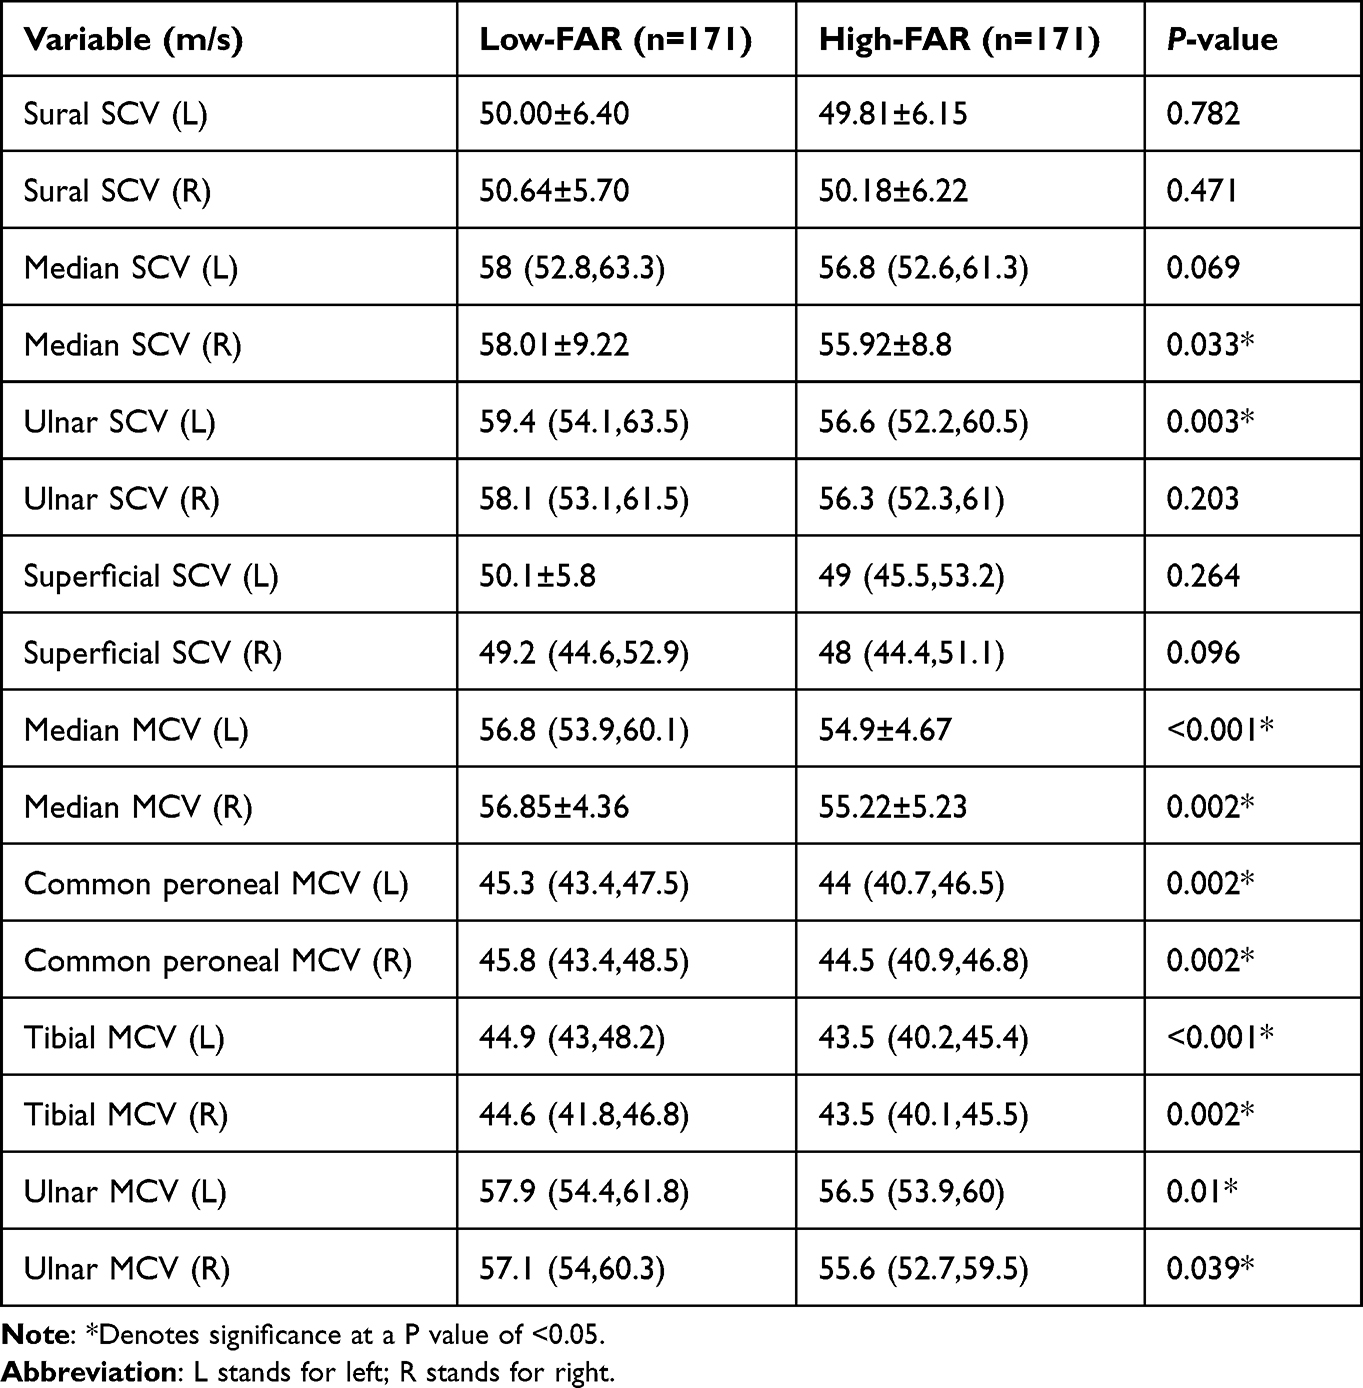 |
Table 4 Comparison of NCV Between Patients in the Low-FAR and High-FAR Groups |
Comparison of FAR with Clinical Indicators in Patients with T2DM
The research found that in patients with T2DM, FAR was positively correlated with the prevalence of both DPN (r=0.336, P<0.001) and DR (r=0.156, P=0.004), as well as age (r=0.332, P<0.001), disease duration (r=0.184, P=0.001), SBP (r=0.16, P=0.003), HbA1C (r=0.174, P=0.001), and FIB (r=0.889, P<0.001) levels. In contrast, FAR was negatively correlated with ALB (r=−0.424, P<0.001), ALT (r=−0.173, P=0.001), AST (r=−0.115, P=0.033), and GFR (r=−0.256, P<0.001) levels. However, there was no statistically significant correlation between FAR and factors such as smoking, drinking, DBP, BMI, FBG, BUN, Scr, UA, TG, TC, HDL-C, or LDL-C (P>0.05) (see Table 5 and Figure 4).
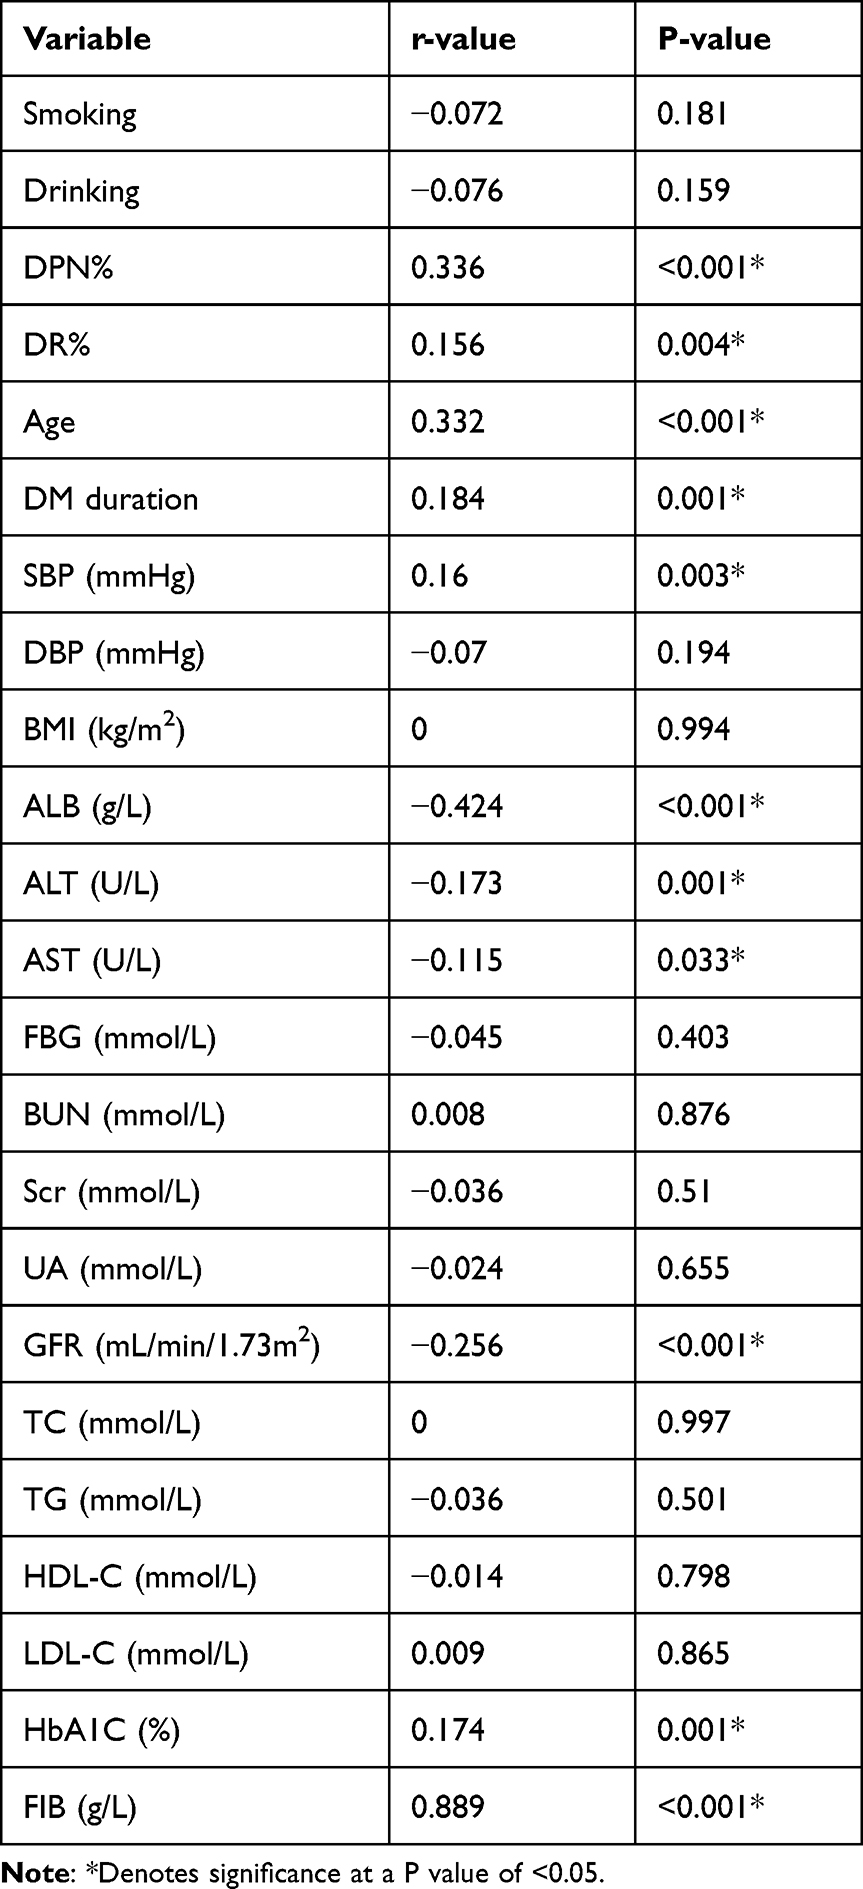 |
Table 5 Correlation Between FAR and Clinical Characteristics in T2DM |
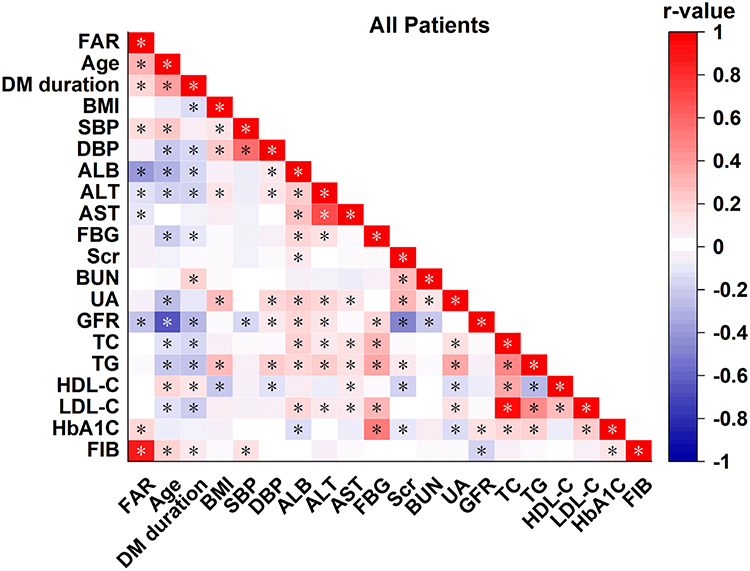 |
Figure 4 Correlation Between FAR and Clinical Characteristics in T2DM. Note: *Denotes significance at a P value of <0.05. |
Correlation Analysis of FAR and NCV in Patients with T2DM
The research found that FAR was negatively correlated with left median nerve SCV (r=−0.121, P=0.025), right median nerve SCV (r=−0.184, P=0.001), left ulnar nerve SCV (r=−0.166, P=0.002), left median nerve MCV (r=−0.245, P<0.001), right median nerve MCV (r=−0.181, P=0.001), left common peroneal nerve MCV (r=−0.148, P=0.006), right common peroneal nerve MCV (r=−0.166, P=0.002), left tibial nerve MCV (r=−0.22, P<0.001), right tibial nerve MCV (r=−0.169, P=0.002), and left ulnar nerve MCV (r=−0.124, P=0.022). However, there was no significant correlation between FAR and bilateral peroneal nerve SCV, bilateral superficial peroneal nerve SCV, right ulnar nerve SCV, and right ulnar nerve MCV (P>0.05) (see Table 6 and Figure 5).
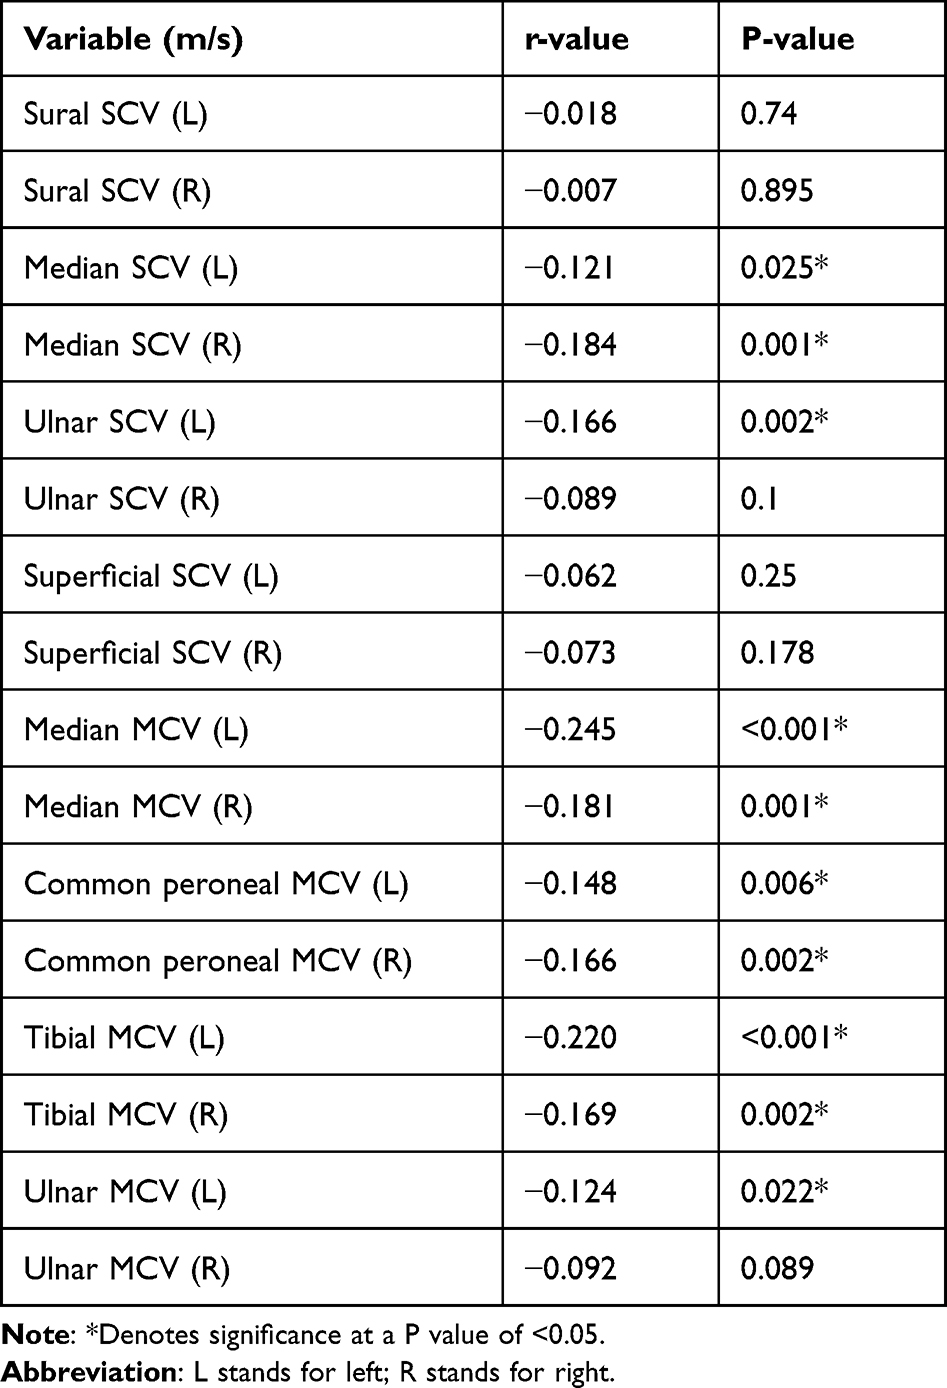 |
Table 6 Correlation Between FAR and Nerve Conduction Velocities in T2DM |
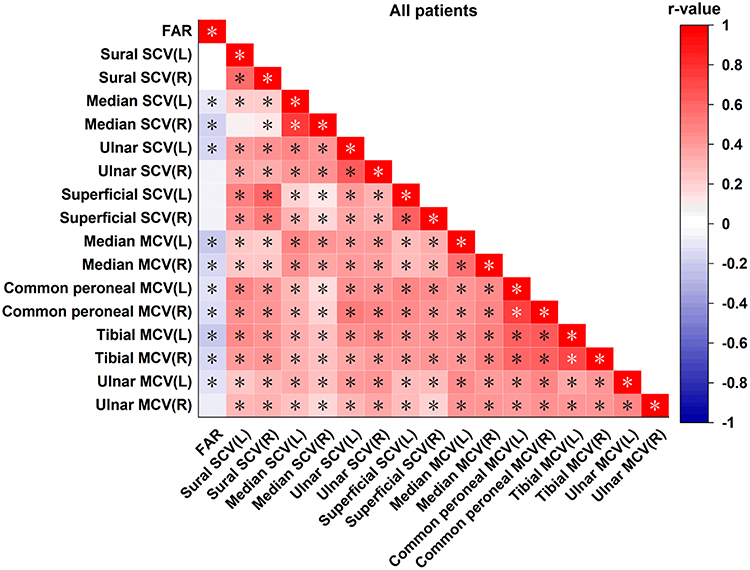 |
Figure 5 Correlation Between FAR and NCV in T2DM. Abbreviation: L stands for left; R stands for right. Note: *Denotes significance at a P value of <0.05. |
Logistic Regression Indicated an Independent Association Between FAR and DPN
The findings showed that FAR had an independent correlation with the development of DPN when T2DM was considered as the dependent variable and age, duration of diabetes, SBP, LDL-C, GFR, and HbA1C were used as independent variables. Moreover, every additional unit increase in FAR contributed to a 1.597-fold increase in the risk of DPN occurrence (see Table 7).
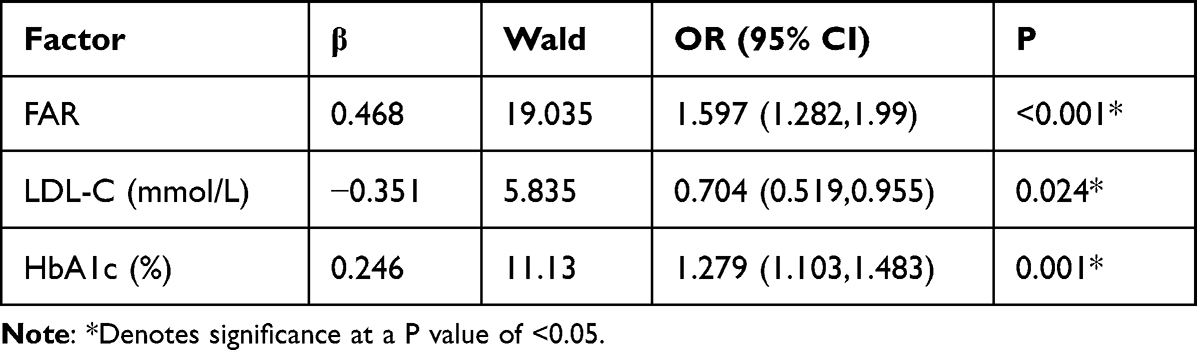 |
Table 7 Logistic Regression Analysis of T2DM Patients with DPN |
Receiver Operating Characteristic (ROC) Curves Show That FAR Predicts DPN
In light of the logistic regression analysis that investigated the relationship between T2DM and DPN, FAR was used to construct the ROC curve. The resulting Area Under Curve (AUC) for FAR was 0.707. These outcomes suggest that FAR has potential predictive value for DPN presence in T2DM patients. Moreover, FAR demonstrated a sensitivity of 70.9%, specificity of 58.9%, Youden index of 0.298, and cut-off value of 6.06 (P<0.05) (see Table 8 and Figure 6).
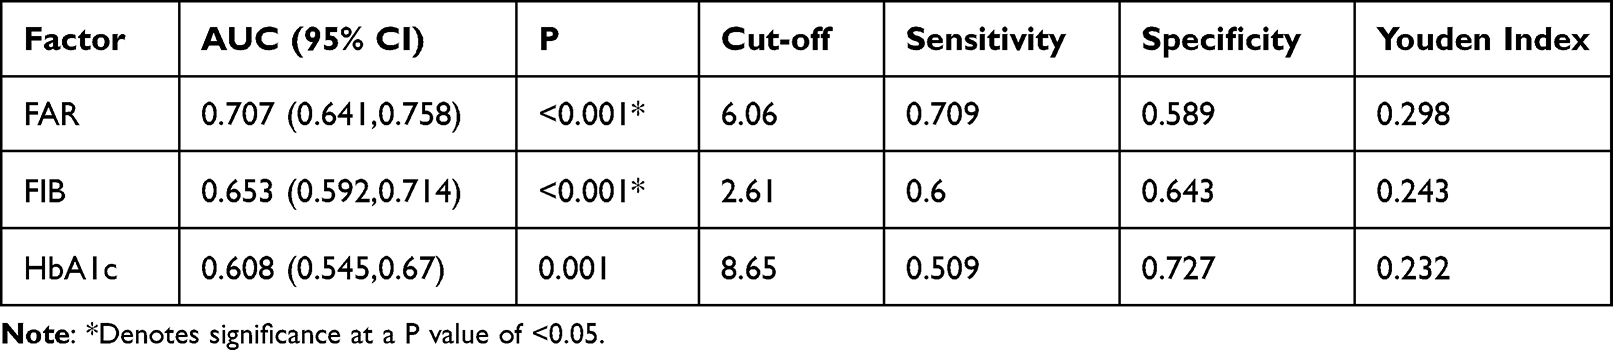 |
Table 8 The ROC Curve of FAR, FIB and HbA1c in Patients of T2DM with DPN |
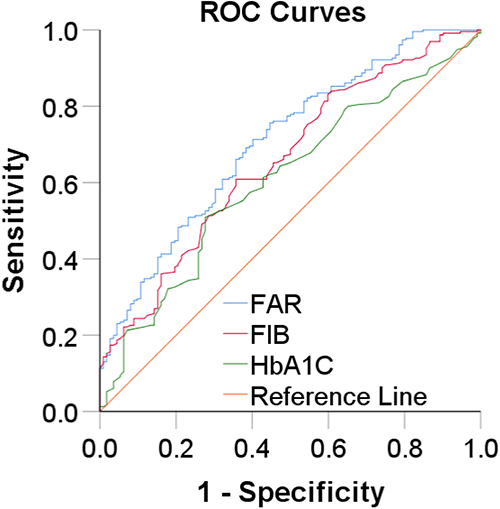 |
Figure 6 The ROC Curve of FAR, FIB and HbA1c in patients of T2DM with DPN. Note: *Denotes significance at a P value of <0.05. |
Discussion
The incidence of diabetes is increasing due to the improvement of living standards and changes in working patterns. The International Diabetes Federation (IDF) predicts that by 2045, the global number of people with diabetes will reach 783 million, with China accounting for 174.4 million patients.15 In T2DM patients, DPN is a common microvascular complication that often presents as nerve dysfunction, including limb numbness, hypoesthesia, pain sensitivity, motor nerve weakness, movement limitations,5 and even a higher risk of amputation.16 The prevalence of DPN observed in this study was 67.3%, which aligns with previous national studies.17 The diagnostic criteria for DPN were determined according to the 2009 Chinese Clinical Diagnostic and Treatment Guidelines for Diabetic Peripheral Neuropathy. As for the reference range of neuromuscular electromyography, it was also addressed in Li’s study.18
However, diagnosing DPN using clinical presentation and physical examination is highly subjective and poorly reproducible, whereas electromyography serves as the gold standard but can be cumbersome and expensive. Therefore, this study aimed to identify an objective, reproducible, easy-to-use, and affordable index for early DPN diagnosis to help guide clinical practice.
The study found that the DPN group was older with longer disease duration, consistent with earlier research.19,20 A 2019 study showed that female gender was the only significant predictor of neuropathic pain among T2DM participants (p<0.01 with an OR (95% CI) of 2.45 (1.29 to 4.67)).21 Studies on gender and the occurrence of diabetic peripheral neuropathy have been controversial, and the present study showed that the prevalence of DPN was higher in women than in men, but not statistically different. It may be related to the diagnostic criteria and sample size, which need to be confirmed by further studies. Nonetheless, there was no significant difference in alcohol consumption, requiring further investigation. Although no significant difference in fasting blood glucose between the groups was noted, HbA1c was markedly different, attributed to the inherent randomness of single fasting blood glucose measurements and emphasizing the importance of utilizing HbA1c as a more stable indicator of glucose control.
FIB is a hexamer consisting of Aα-chain, Bβ-chain and γ-chain linked by a disulfide bond, with a molecular weight of approximately 340,000 Daltons.22 Upon thrombin action, FIB is released, leading to the formation of fibrin monomers, which subsequently polymerize and create soluble fibrin aggregates. These aggregates are then covalently linked by Ca2+ and activated factor XIIIa to produce insoluble fibrin clots;23 these clots actively participate in the body’s coagulation process. High FIB levels increase blood viscosity, promote clotting, thrombosis formation, and even induce microcirculatory ischemia and hypoxia.24 As a marker of inflammation, FIB contributes to the pathogenesis of numerous illnesses primarily by damaging the vascular endothelium, altering blood rheology, and participating in thrombosis.25 The relationship between FIB and T2DM and its related complications has been well documented.26,27 Notably, FIB levels were higher in the DPN group than the NDPN group, as reported in previous research.28 This can be explained by FIB’s effects on altered blood flow velocity, thrombosis, impaired microcirculation, and axonal damage.28 ALB is a crucial liver biomarker with potent metal ion binding and antioxidant scavenging properties that are essential for protecting the body against oxidative stress.29 Changes in ALB levels or structure caused by factors such as hyperglycemia or oxidative stress can lead to increased oxidative stress,30 which contributes to the development of diseases. ALB levels are strongly associated with clinical disease prognosis, emphasizing its value as a diagnostic tool. Previous studies have shown a significantly increased prevalence of DPN in T2DM with Nonalcoholic Fatty Liver Disease (NAFLD).31 This may be related to the fact that patients with NAFLD have enhanced pro-inflammatory and pro-atherosclerotic effects. Both ALB and FIB selected for this study are produced by the liver, and the combination of the two amplifies the inflammatory response in the body and is a more sensitive indicator of response to inflammation.
The FAR index is a reliable metric for assessing the inflammatory status of the body, based on serum ALB and FIB levels, which has proven useful in predicting the prognosis of numerous illnesses, including cardiovascular disease and oncology.32,33 Research has shown that FAR is also strongly associated with the development of rheumatic disorders and the prognosis of patients with cerebral infarction.34,35 In T2DM patients, FAR is correlates with renal disease12. The present study found significantly higher FAR values in the DPN group than the NDPN group, suggesting a close link between FAR and DPN. This is likely due to an increased inflammatory response in the body, which may exacerbate oxidative stress and microcirculatory ischemia and hypoxia in T2DM patients. This might damage axons and impede the normal neural conduction functions, leading to the onset of DPN.36,37 Logistic regression analysis established that FAR, in addition to LDL-C and HbA1c, was an independent risk factor for DPN, further highlighting the key role of inflammatory response in the development and progression of the condition. In this study, the predictive value of FAR on DPN was higher than that of LDL-C and HbA1c.
The DPN group had slower sensory and motor nerve conduction velocities than the NDPN group. The patients were divided into low FAR and high FAR groups based on median FAR. In the high FAR group, the right median SCV, left ulnar SCV, and all MCV were slower than in the low FAR group. A negative correlation was found between FAR and several NCVs. The sensory and motor nerve conduction velocities in the lower limb nerves were slower than those in the upper limb due to the length-dependent nature of DPN nerve damage,38 resulting in slower nerve conduction velocities in the lower limb than in the upper limb. The high FAR group had slower peroneal nerve conduction velocity associated with neuropathy affecting the lower limb first, while no significant difference was observed in sensory conduction velocity between the left and right peroneal nerve groups, suggesting that neuropathy may have affected only the unilateral lower limb nerve. Recent evidence indicates that inflammation plays a crucial role in the formation and development of DPN.34 FAR, as an indicator of inflammation, has a close relationship with NCV. Although neuromyography is typically used to detect conduction velocities in large nerve fibers,39 studies have suggested that early lesions of DPN involve both small and large fiber nerves simultaneously.40 As such, measuring large fiber nerve conduction velocities early on in patients with early-onset diabetes is essential. Given the expensive and specialized nature of neuromyography, FAR can serve as an indicator for early prediction of nerve conduction velocity in outpatient or clinical settings, providing advance warning of the onset and progression of DPN.
In summary, there is a significant negative correlation between FAR levels and DPN nerve conduction velocity. The ROC curve was the first study to compare the predictive function of FIB, HbA1c, and FAR for DPN, and the predictive value of FAR was found to be superior.
And FAR is an independent risk factor for DPN. The optimal threshold corresponding to FAR is 6.06, therefore, when FAR is greater than 6.06, it indicates a significant increase in the incidence of DPN and the need for early clinical intervention.
Although calculating the FAR is a relatively simple process that can be derived from blood indicators, this study has some limitations. It is cross-sectional, so we cannot confirm a causal relationship between DPN and FAR. The patients included were only those who had EMG measurements, so there might be some bias. Also, Vitamin D and Glycated hemoglobin were not collected. Edward’s research shows a strong correlation between vitamin D deficiency and the development of DPN. Whereas loss of nociception accelerates the appearance of diabetic foot, vitamin D supplementation may improve ulcer healing in diabetic foot patients.41 The data of this study did not un vitamin D level, which is a shortcoming of this paper, in the future work, should be improved as much as possible related research. In recent studies focused on evaluating early diabetic peripheral neuropathy (DPN), there has been a growing emphasis on assessing the sensitivity of small sensory nerves and examining their morphology in the skin and cornea.42 Nevertheless, it is important to note that this particular experiment is deficient in terms of corneal confocal data and other relevant information that could be further investigated in future research endeavors.
Conclusion
To conclude, the DPN group presented with a higher FAR index, as well as slower NCV when compared to the NDPN group. Moreover, the high FAR group showcased a greater prevalence of DPN, and some of them exhibited slower NCVs when compared to the low-FAR group. Our correlation analysis revealed that FAR is inversely proportional to NCV. Therefore, being an independent risk factor, FAR is predictive of DPN development, specifically in T2DM patients. In addition, its predictive ability surpasses that of FIB, HbA1c.
Disclosure
The authors report no conflicts of interest in this work.
References
1. Reed J, Bain S, Kanamarlapudi V. A review of current trends with type 2 diabetes epidemiology, aetiology, pathogenesis, treatments and future perspectives. Diabetes Metab Syndr Obes. 2021;14:3567–3602. doi:10.2147/DMSO.S319895
2. Li Y, Teng D, Shi X, et al. Prevalence of diabetes recorded in mainland China using 2018 diagnostic criteria from the American Diabetes Association: national cross sectional study. BMJ. 2020;369:m997. doi:10.1136/bmj.m997
3. Tesfaye S, Selvarajah D. Advances in the epidemiology, pathogenesis and management of diabetic peripheral neuropathy. Diabetes Metab Res Rev. 2012;28(Suppl 1):8–14. doi:10.1002/dmrr.2239
4. Gylfadottir SS, Itani M, Krøigård T, et al. Diagnosis and prevalence of diabetic polyneuropathy: a cross-sectional study of Danish patients with type 2 diabetes. Eur J Neurol. 2020;27(12):2575–2585. doi:10.1111/ene.14469
5. Boulton AJ, Vinik AI, Arezzo JC, et al. Diabetic neuropathies: a statement by the American Diabetes Association. Diabetes Care. 2005;28(4):956–962. doi:10.2337/diacare.28.4.956
6. Lapin BR, Pantalone KM, Milinovich A, et al. Pain in patients with type 2 diabetes-related polyneuropathy is associated with vascular events and mortality. J Clin Endocrinol Metab. 2020;105(9):dgaa394. doi:10.1210/clinem/dgaa394
7. Wolberg AS, Sang Y. Fibrinogen and factor XIII in venous thrombosis and thrombus stability. Arterioscler Thromb Vasc Biol. 2022;42(8):931–941. doi:10.1161/ATVBAHA.122.317164
8. Sun J, Han K, Xu M, et al. Blood viscosity in subjects with type 2 diabetes mellitus: roles of hyperglycemia and elevated plasma fibrinogen. Front Physiol. 2022;13:827428. doi:10.3389/fphys.2022.827428
9. Chen QF, Cao D, Ye TT, Deng HH, Zhu H. Peripheral arterial disease in type 2 diabetes is associated with an increase in fibrinogen levels. Int J Endocrinol. 2018;2018:3709534. doi:10.1155/2018/3709534
10. Zhu Y, Cai X, Liu Y, et al. Serum albumin, but not bilirubin, is associated with diabetic chronic vascular complications in a chinese type 2 diabetic population. Sci Rep. 2019;9(1):12086. doi:10.1038/s41598-019-48486-6
11. Kayapinar O, Ozde C, Kaya A. Relationship between the reciprocal change in inflammation-related biomarkers (fibrinogen-to-albumin and hscrp-to-albumin ratios) and the presence and severity of coronary slow flow. Clin Appl Thromb Hemost. 2019;25:1076029619835383. doi:10.1177/1076029619835383
12. Huang R, Dai Q, Chang L, et al. The association between fibrinogen-to-albumin ratio (FAR) and adverse prognosis in patients with acute decompensated heart failure at different glucose metabolic states. Cardiovasc Diabetol. 2022;21(1):241. doi:10.1186/s12933-022-01662-x
13. Li B, Deng H, Lei B, Chen L, Zhang X, Sha D. The prognostic value of fibrinogen to albumin ratio in malignant tumor patients: a meta-analysis. Front Oncol. 2022;12:985377. doi:10.3389/fonc.2022.985377
14. Wang K, Xu W, Zha B, Shi J, Wu G, Ding H. Fibrinogen to albumin ratio as an independent risk factor for type 2 diabetic kidney disease. Diabetes Metab Syndr Obes. 2021;14:4557–4567. doi:10.2147/DMSO.S337986
15. Teo ZL, Tham YC, Yu M, et al. Global prevalence of diabetic retinopathy and projection of burden through 2045: systematic review and meta-analysis. Ophthalmology. 2021;128(11):1580–1591. doi:10.1016/j.ophtha.2021.04.027
16. Abuhay HW, Yenit MK, Wolde HF. Incidence and predictor of diabetic foot ulcer and its association with change in fasting blood sugar among diabetes mellitus patients at referral hospitals in Northwest Ethiopia, 2021. PLoS One. 2022;17(10):e0274754. doi:10.1371/journal.pone.0274754
17. Ahmed AM, Hussein A, Ahmed NH. Diabetic autonomic neuropathy. Saudi Med J. 2000;21(11):1034–1037.
18. Li Z, Gao Y, Jia Y, Chen S. Correlation between hemoglobin glycosylation index and nerve conduction velocity in patients with type 2 diabetes mellitus. Diabetes Metab Syndr Obes. 2021;14:4757–4765. doi:10.2147/DMSO.S334767
19. Li C, Wang W, Ji Q, et al. Prevalence of painful diabetic peripheral neuropathy in type 2 diabetes mellitus and diabetic peripheral neuropathy: a nationwide cross-sectional study in mainland China. Diabetes Res Clin Pract. 2023;198:110602. doi:10.1016/j.diabres.2023.110602
20. Janghorbani M, Rezvanian H, Kachooei A, et al. Peripheral neuropathy in type 2 diabetes mellitus in Isfahan, Iran: prevalence and risk factors. Acta Neurol Scand. 2006;114(6):384–391. doi:10.1111/j.1600-0404.2006.00716.x
21. Alkhatatbeh M, Abdul-Razzak KK. Neuropathic pain is not associated with serum vitamin D but is associated with female gender in patients with type 2 diabetes mellitus. BMJ Open Diabetes Res Care. 2019;7(1):e000690. doi:10.1136/bmjdrc-2019-000690
22. Mosesson MW, Siebenlist KR, Meh DA. The structure and biological features of fibrinogen and fibrin. Ann NY Acad Sci. 2001;936:11–30. doi:10.1111/j.1749-6632.2001.tb03491.x
23. Mosesson MW. Fibrinogen and fibrin structure and functions. J Thromb Haemost. 2005;3(8):1894–1904. doi:10.1111/j.1538-7836.2005.01365.x
24. Soma P, Pretorius E. Interplay between ultrastructural findings and atherothrombotic complications in type 2 diabetes mellitus. Cardiovasc Diabetol. 2015;14:96. doi:10.1186/s12933-015-0261-9
25. Sugimoto MA, Ribeiro ALC, Costa BRC, et al. Plasmin and plasminogen induce macrophage reprogramming and regulate key steps of inflammation resolution via annexin A1. Blood. 2017;129(21):2896–2907. doi:10.1182/blood-2016-09-742825
26. Li XH, Guan LY, Lin HY, et al. Fibrinogen: a marker in predicting diabetic foot ulcer severity. J Diabetes Res. 2016;2016:2358321. doi:10.1155/2016/2358321
27. Kotbi S, Mjabber A, Chadli A, et al. Correlation between the plasma fibrinogen concentration and coronary heart disease severity in Moroccan patients with type 2 diabetes. Prospective study. Ann Endocrinol. 2016;77(5):606–614. doi:10.1016/j.ando.2015.02.004
28. Erem C, Hacihasanoglu A, Celik S, et al. Coagulation and fibrinolysis parameters in type 2 diabetic patients with and without diabetic vascular complications. Med Princ Pract. 2005;14(1):22–30. doi:10.1159/000081919
29. Don BR, Kaysen G. Serum albumin: relationship to inflammation and nutrition. Semin Dial. 2004;17(6):432–437. doi:10.1111/j.0894-0959.2004.17603.x
30. Faure P, Wiernsperger N, Polge C, Favier A, Halimi S. Impairment of the antioxidant properties of serum albumin in patients with diabetes: protective effects of metformin. Clin Sci. 2008;114(3):251–256. doi:10.1042/CS20070276
31. Greco C, Nascimbeni F, Carubbi F, Andreone P, Simoni M, Santi D. Association of Nonalcoholic Fatty Liver Disease (NAFLD) with peripheral diabetic polyneuropathy: a systematic review and meta-analysis. J Clin Med. 2021;10(19):4466. doi:10.3390/jcm10194466
32. Onoprienko A, Hofstetter G, Dorittke T, et al. The prognostic value of the Fibrinogen-Albumin-Ratio Index (FARI) in patients with advanced vulvar cancer. J Pers Med. 2022;12(11):1882. doi:10.3390/jpm12111882
33. Zhu Y, Tao S, Zhang D, et al. Association between fibrinogen/albumin ratio and severity of coronary artery calcification in patients with chronic kidney disease: a retrospective study. PeerJ. 2022;10:e13550. doi:10.7717/peerj.13550
34. Ding Y, Xue L. The potential value of fibrinogen to albumin ratio (FAR) in the assessment of inflammation in spondyloarthritis. BMC Musculoskelet Disord. 2022;23(1):864. doi:10.1186/s12891-022-05797-6
35. Zhai M, Cao S, Lu J, Xu H, Xia M, Li Z. The relationship between the fibrinogen to albumin ratio and early outcomes in patients with acute pontine infarction. Clin Appl Thromb Hemost. 2022;28:10760296211067260. doi:10.1177/10760296211067260
36. Galiero R, Caturano A, Vetrano E, et al. Peripheral neuropathy in diabetes mellitus: pathogenetic mechanisms and diagnostic options. Int J Mol Sci. 2023;24(4):3554. doi:10.3390/ijms24043554
37. Kellogg AP, Wiggin TD, Larkin DD, Hayes JM, Stevens MJ, Pop-Busui R. Protective effects of cyclooxygenase-2 gene inactivation against peripheral nerve dysfunction and intraepidermal nerve fiber loss in experimental diabetes. Diabetes. 2007;56(12):2997–3005. doi:10.2337/db07-0740
38. Ziegler D, Papanas N, Schnell O, et al. Current concepts in the management of diabetic polyneuropathy. J Diabetes Investig. 2021;12(4):464–475. doi:10.1111/jdi.13401
39. Siao P, Kaku M. A clinician’s approach to peripheral neuropathy. Semin Neurol. 2019;39(5):519–530. doi:10.1055/s-0039-1694747
40. Ziegler D, Papanas N, Zhivov A, et al. Early detection of nerve fiber loss by corneal confocal microscopy and skin biopsy in recently diagnosed type 2 diabetes. Diabetes. 2014;63(7):2454–2463. doi:10.2337/db13-1819
41. Rebelos E, Tentolouris N, Jude E. The role of vitamin D in health and disease: a narrative review on the mechanisms linking vitamin d with disease and the effects of supplementation. Drugs. 2023;83(8):665–685. doi:10.1007/s40265-023-01875-8
42. Gylfadottir SS, Itani M, Kristensen AG, et al. Assessing corneal confocal microscopy and other small fiber measures in diabetic polyneuropathy. Neurology. 2023;100(16):e1680–e1690. doi:10.1212/WNL.0000000000206902
 © 2023 The Author(s). This work is published and licensed by Dove Medical Press Limited. The
full terms of this license are available at https://www.dovepress.com/terms
and incorporate the Creative Commons Attribution
- Non Commercial (unported, 3.0) License.
By accessing the work you hereby accept the Terms. Non-commercial uses of the work are permitted
without any further permission from Dove Medical Press Limited, provided the work is properly
attributed. For permission for commercial use of this work, please see paragraphs 4.2 and 5 of our Terms.
© 2023 The Author(s). This work is published and licensed by Dove Medical Press Limited. The
full terms of this license are available at https://www.dovepress.com/terms
and incorporate the Creative Commons Attribution
- Non Commercial (unported, 3.0) License.
By accessing the work you hereby accept the Terms. Non-commercial uses of the work are permitted
without any further permission from Dove Medical Press Limited, provided the work is properly
attributed. For permission for commercial use of this work, please see paragraphs 4.2 and 5 of our Terms.