Back to Journals » ImmunoTargets and Therapy » Volume 13
Correlation Between C4/IgG with Macroproteinuria in Chronic Kidney Disease: A Pilot Study
Authors Zhang H, Xu A, Li X, Pan B, Wan X
Received 6 December 2023
Accepted for publication 2 April 2024
Published 12 April 2024 Volume 2024:13 Pages 205—214
DOI https://doi.org/10.2147/ITT.S451307
Checked for plagiarism Yes
Review by Single anonymous peer review
Peer reviewer comments 3
Editor who approved publication: Professor Michael Shurin
Hao Zhang,1,* Anqi Xu,2,* Xiangxiang Li,3,* Binbin Pan,1 Xin Wan1
1Department of Nephrology, Nanjing First Hospital, Nanjing Medical University, Nanjing, People’s Republic of China; 2Department of Quality Management, Nanjing Red Cross Blood Center, Nanjing, People’s Republic of China; 3Department of Nephrology, Nanjing Yuhua Hospital, Yuhua Branch of Nanjing First Hospital, Nanjing, People’s Republic of China
*These authors contributed equally to this work
Correspondence: Binbin Pan; Xin Wan, Department of Nephrology, Nanjing First Hospital, No. 68, Changle Road, Nanjing, Jiangsu, 210006, People’s Republic of China, Tel +86 025-87726209, Email [email protected]; [email protected]
Background and Objectives: Loss of immunoglobulin G (IgG) is accompanied with proteinuria, especially macroproteinuria. The complement system participates kidney disease resulting in proteinuria. Whether the ratio of complement and IgG is associated with macroproteinuria remains unknown.
Design, Setting, Participants and Measurements: A total of 1013 non-dialysis chronic kidney disease (CKD) patients were recruited according to the electrical case records system with 268 patients who endured kidney biopsy. Patients were grouped via the estimated glomerular filtration rate or the levels of proteinuria determination. Biomarkers in different CKD groups or proteinuria groups were compared by one-way ANOVA or independent samples t-test. Pearson or spearman analysis was employed to analyze correlation between clinical indexes. Further, influence factor of macroproteinuria was studied by using binary logistic regression. The ROC curve was performed to explore probable predictive biomarker for macroproteinuria.
Results: No significant difference of complement C3 and C4 among CKD1 to CKD5 stages, while higher level of complement C4 in patients with macroproteinuria. Further, C4 had a positive correlation with proteinuria (r=0.255, p=0.006). After adjusted for age, IgA, IgM, triglyceride and HDL, a binary logistic regression model showed lnC4/IgG (OR=3.561, 95% CI 2.196– 5.773, p< 0.01), gender (OR=1.737, 95% CI 1.116– 2.702, p=0.014), age (OR=0.983, 95% CI 0.969– 0.997, p=0.014), and history of diabetes (OR=0.405, 95% CI 0.235– 0.699, p< 0.01) were independent influence factors of macroproteinuria. The area under the ROC curve was 0.77 (95% CI: 0.75– 0.82, p< 0.001) for C4/IgG. The analysis of ROC curves revealed a best cut-off for complement C4 was 0.024 and yielded a sensitivity of 71% and a specificity of 71%. The area under the ROC curve was 0.841 (95% CI: 0.735– 0.946, p < 0.001) for C4/IgG in IgA nephropathy patients. The analysis of ROC curves revealed a best cut-off for complement C4/IgG was 0.026 and yielded a sensitivity of 75% and a specificity of 81.2%. The area under the ROC curve for C4/IgG in CKD1-5 stages were 0.772, 0.811, 0.785, 0.835, 0.674.
Conclusion: Complement C4/IgG could be used to predict macroproteinuria.
Keywords: complement C4, immunoglobulin G, macroproteinuria, chronic kidney disease, kidney biopsy
Introduction
Chronic kidney disease (CKD) is a global disease giving a big economic burden to humans. An epidemiological survey from China in 2012 showed 10.8% in prevalence.1 No data to date are available about the cure methods of CKD. However, many effective regimes which control risk factors are used to reduce the progression of CKD. As is known, proteinuria, especially macroproteinuria, is an independent risk factors of CKD.2–5 The occurrence of macroproteinuria is attributed to glomerular injury which is induced by membrane attack complex (MAC), glycated end products or other pathogenesis.
Membrane attack complex (MAC) is a resultant of activated complement system consists of classical complement pathway, lectin complement pathway and alternative complement pathway. Serum complement C3 is in the central role of complement system and has been proved to be deposited in kidney tissues in many kinds of glomerular nephritis. However, whether serum complement C3 is associated with proteinuria remains unknown. Another complement component, serum C4 plays a pivotal role in both the classical and lectin complement pathways which is mainly produced in the liver with a mean concentration of 600mg/mL in serum. Activated by the enzymes C1s or MASP-2, C4’s internal thioester is exposed, thereby enabling interaction with receptor. After that, C4 is cleaved into C4a and C4b which participates in creation of a C3 convertase and cleavage of C3, resulting in complement-mediated opsonization and activation of the terminal complement pathway.6 A number of studies have proved C4 participated in different nephropathy, including IgA nephropathy,7 anti-neutrophil cytoplasmic antibody-associated vasculitis,8 lupus nephritis.9 However, few studies have shown the deposition of C4 in the kidney. In 2016, Sethi and his fellows have reported 3 cases C4 glomerulopathy cases with bright C4d staining and dense deposits along glomerular basement membranes named C4 dense deposit disease and bright C4d staining and many mesangial electron dense deposits, with or without rare intramembranous electron-dense deposits defined as C4 glomerulonephritis.10 Nevertheless, few studies have focused on the relationship between serum complement C4 and proteinuria, especially macroproteinura.
In light of this background, this study was aimed to explore the possible role of complement C3 or C4 as a candidate biomarker to predict macroproteinuria in CKD patients. Our study result provided a novelty relationship of complement C4/IgG and macroproteinuria which could be used to assess the probability of macroproteinuria in CKD patients. The levels of complement C4/IgG could be used to alert physicians to give active treatment for kidney disease to avoid macroproteinuria.
Materials and Methods
A total of 926 non-dialysis patients hospitalized with CKD and 87 non-CKD controls from August 2008 to December 2020 were registered via electronic case records system from Nanjing first hospital. We excluded subjects who were younger than 18 years old, had fever, women who were pregnant and patients with acute kidney injury.
Laboratory Measure
Blood urea nitrogen (BUN), Serum creatinine (sCr), uric acid, serum albumin, serum lipid and proteinuria were measured by OLYMPUS AU5400 automatic biochemical analyzer (Olympus Corporation, Mishima, Japan). The calibrators for the enzymatic method were traceable to an isotope dilution mass spectrometric method for sCr using standard reference methods NIST SRM 967.11 Hemoglobin (Hb) was detected by Sysmex XT-1800i Automated Hematology System (Shanghai, China). Glycated hemoglobin (HbA1c) was determined using the BioRad VARIANT II HPLC analyser (Biorad, Hemel Hempstead, UK). The values of serum immunoglobulin (Ig) and complements were measured by single immunodiffusion.
Definition of CKD
1. CKD stages were defined in accordance with KDIGO guideline.12 The Chronic Kidney Disease Epidemiology Collaboration (CKD-EPI) four-level race equation was used to calculate estimated glomerular filtration rate (eGFR)13 and the last sCr value before discharge was selected as the baseline level.
2. Macroproteinuria is defined as proteinuria more than 3.5g/24 hours. If proteinuria is less than 3.5g/24-hour, they were assigned into non-macroproteinuria group.
Statistical Analysis
Statistics analysis was performed by PASW 18.0 statistical software (SPSS Inc., Chicago, IL, USA). Data were expressed as mean ± SD. Student’s T-test and One-way ANOVA were used to compare means for continuous variables. Fisher’s exact test was used to compare prevalence for dichotomic variables. The pearson and Spearman correlation analysis were employed. In addition, the binary logistic regression was employed to explore influence factors for macroproteinuria. p value < 0.05 was considered to be statistically significant. Receiver operating characteristic (ROC) curve was built to evaluate the predictivity of significant variables on the likelihood of having macroproteinuria. The best cut off for ROC curve was calculated with the Youden’s index.
Results
Clinical Characteristics of CKD Patients
A total of 1013 CKD patients were recruited in our study. In patients who endured kidney biopsy, a total of 268 records were collected. IgA nephropathy 89 cases, diabetic nephropathy 32 cases, membrane nephropathy 68 cases, minimal change disease 16 cases, focal segmental glomerulus sclerosis 9 cases, mesangial hyperplasia 11 cases, lupus nephritis 8 cases, purpura nephritis 7 cases, other pathology 28 cases (Figure 1).
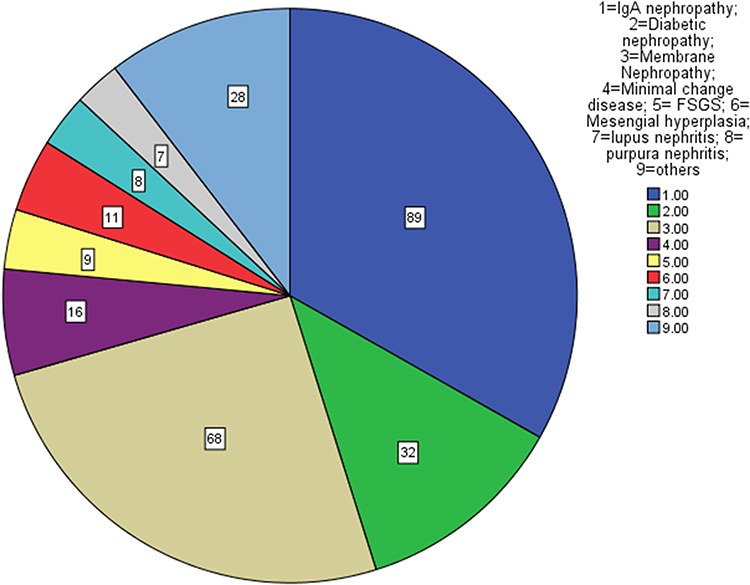 |
Figure 1 Pathology types in biopsy patients. Notes: IgA nephropathy 89 cases, membrane nephropathy 68 cases, diabetic nephropathy 32 cases, minimal change disease 16 cases, mesangial hyperplasia 11 cases, focal segmental glomerulus sclerosis 9 cases, lupus nephritis 8 cases, purpura nephritis 7 cases, other pathology 28 cases. |
Age in CKD1 stage were significantly lower than that in other groups. Hemoglobin was lower in CKD2-CKD5 stages than that in control and CKD1 stage. Lower levels of albumin were observed in CKD1-5 stages compared with control group. Levels of uric acid and proteinuria were lowest in control group compared with CKD patients. High levels of BUN, Scr, IgA were observed in CKD2-5 stages. Levels of total cholesterol (TC) and low-density lipoprotein (LDL) were higher in CKD1-3 stages than those in control group. No significant differences were observed between groups in levels of IgM and HbA1c. Higher levels of C3 in CKD1&4 group and increased levels of C4 in CKD4&5 groups compared with control group. Moreover, frequencies of male, type 2 diabetes (T2DM) and hypertension(HP) were different between groups. (Tables 1 and 2)
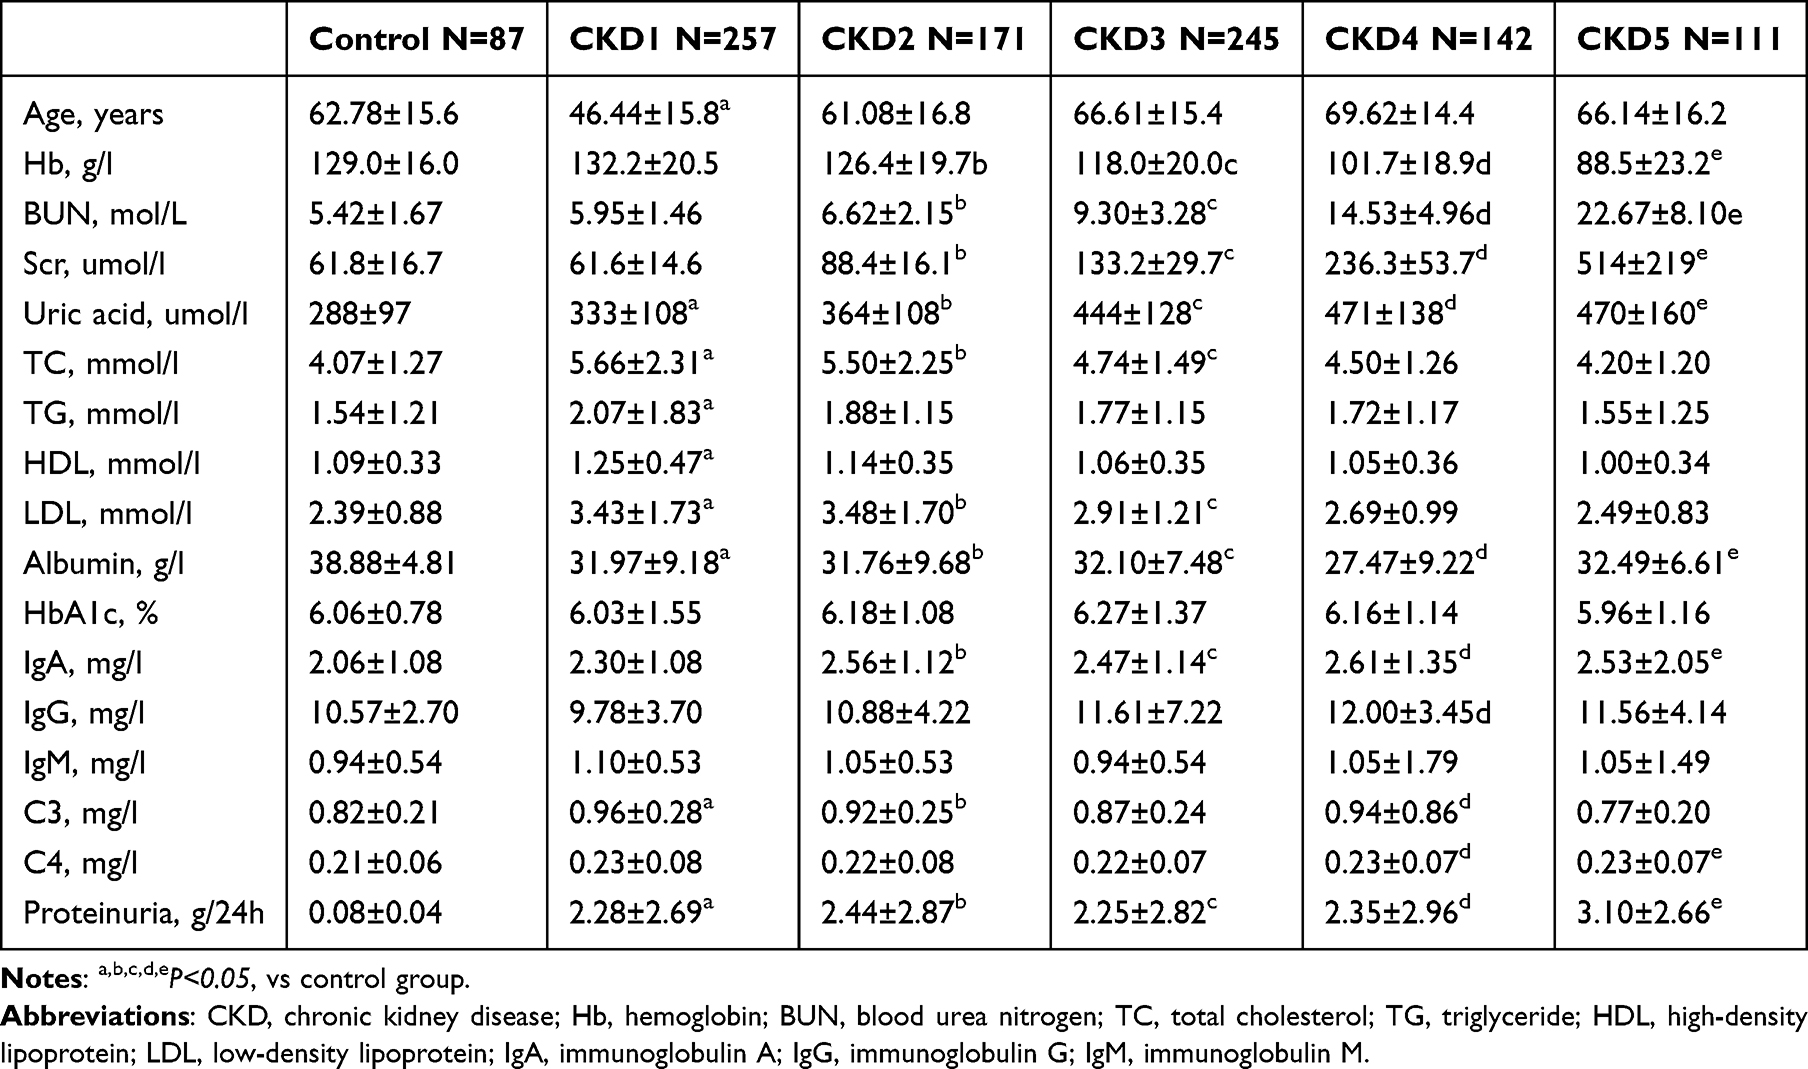 |
Table 1 Clinical Characteristics of Patients |
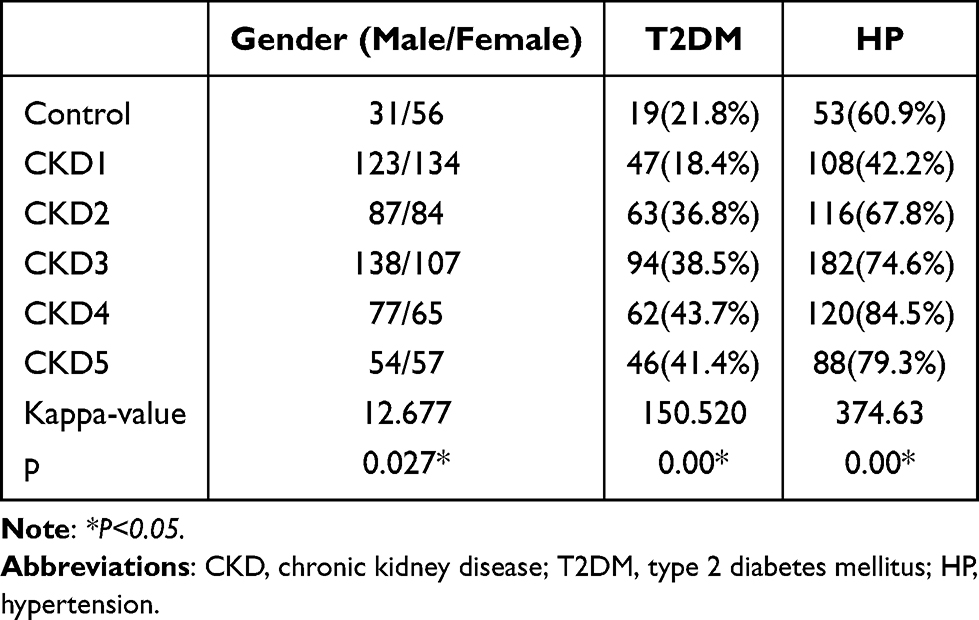 |
Table 2 Characteristics of Categorical Variables |
Clinical Differences Between Macroproteinuria and Non-Macroproteinuria Groups
Macroproteinuria patients showed younger than non-macroproteinuria patients (p<0.001) with similar levels of Hb, uric acid, HbA1c, IgA and complement C3. BUN and sCr were higher in macroproteinuria group than those in non-macroproteinuria group (p<0.01). Additionally, lower albumin and higher serum lipid in macroproteinuria group which is common in nephrotic syndrome (p<0.05). Moreover, IgG was lower while IgM higher in macroproteinuria group (p<0.05). Levels of C4 and C4/IgG were also higher in macroproteinuria group (p<0.001) (Table 3).
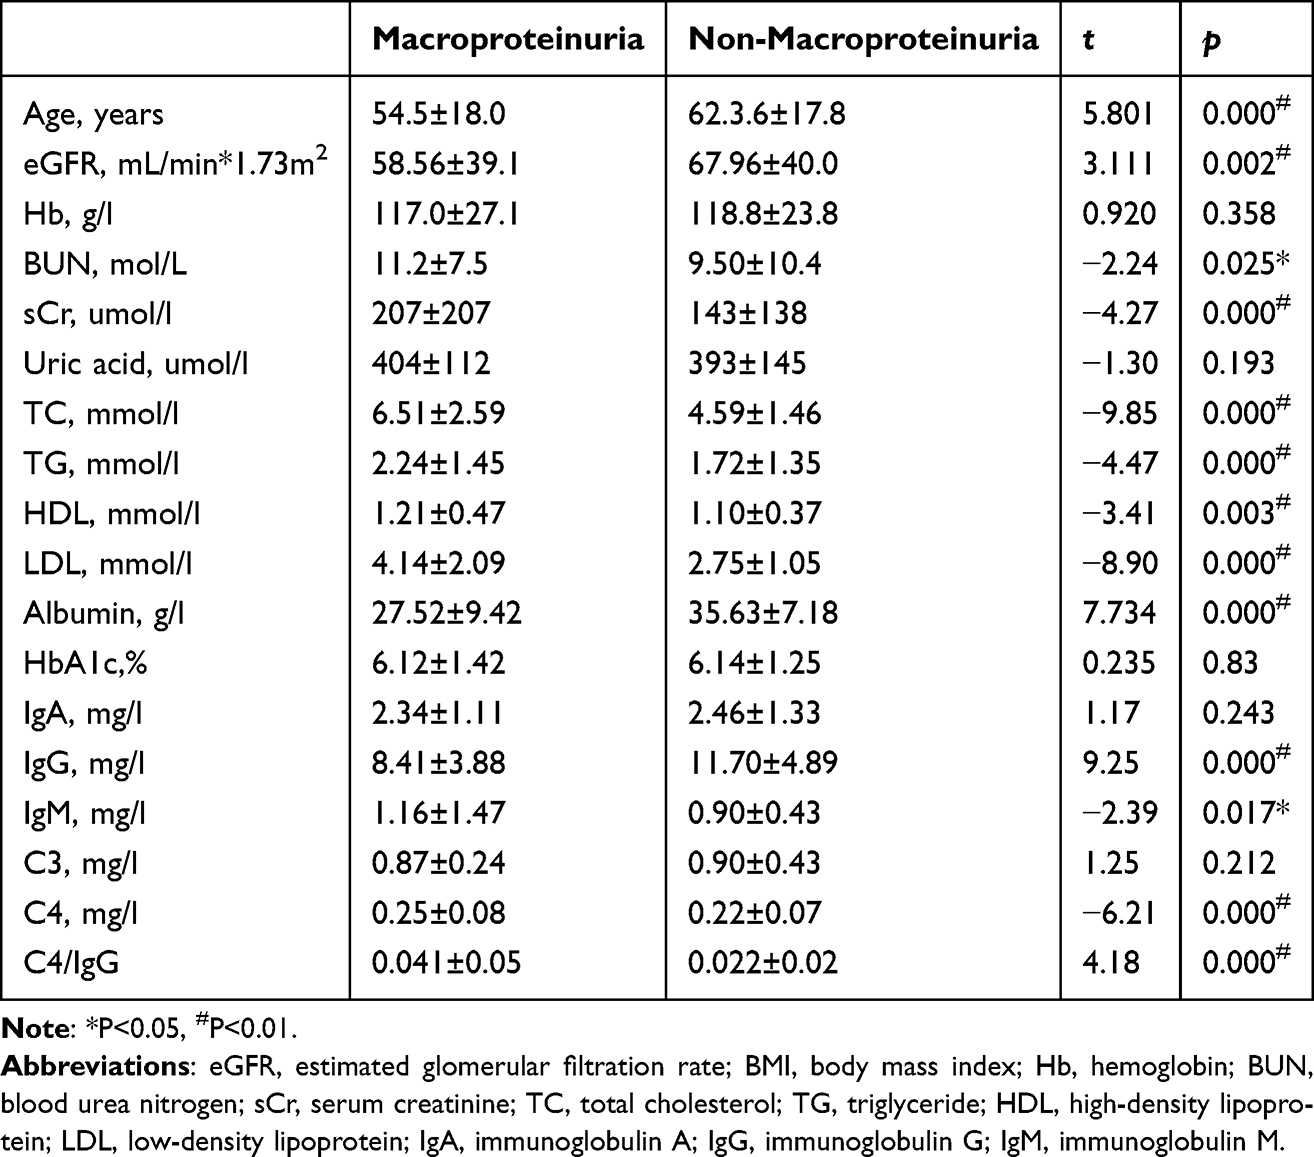 |
Table 3 Comparison of Clinical Characteristics of Macroproteinuria and Non-Macroproteinuria Groups |
Correlations Between Macroproteinuria and Clinical Indexes
No significant correlation between macroproteinuria and complement C3, gender, age, Hb, diabetic history, hypertension history, triglyceride, HDL, HbA1c and IgA. Markedly positive correlation was observed between macroproteinuria and C4 (r=0.209, p<0.001), total cholesterol (r=0.358, p<0.001), LDL (r=0.325, p<0.001), uric acid (r=0.07, p=0.026), BUN (r=0.119, p<0.001) and Scr (r=0.16, p<0.001). Meanwhile, eGFR (r=−0.097, p=0.002), albumin (r=−0.413, p<0.001) and IgG (r=- 0.348, p<0.001) exhibited negatively correlated with macroproteinuria (Table 4). As complement C3 revealed no significant correlation with macroproteinuria, we further asked whether C4 was associated with proteinuria and other indexes. Further, after adjusted for age, history of hypertension, IgA, IgM, HbA1c, total cholesterol, triglyceride, LDL and HDL, a binary logistic regression model showed lnC4/IgG (OR=3.561, 95% CI 2.196–5.773, p<0.01), gender (OR=1.737, 95% CI 1.116–2.702, p=0.014), age (OR=0.983, 95% CI 0.969–0.997, p=0.014), history of diabetes (OR=0.405, 95% CI 0.235–0.699, p<0.01) (Table 5). Further, we performed binary logistic regression to observe correlation of lnC4/IgG and macroproteinuria in different CKD stage and the results showed lnC4/IgG was an independent influence factor of macroproteinuria in CKD2, CKD3 and CKD4 stages with OR= 2.553, 14.946 and 533.548 respectively (Supplemental Table 1). Moreover, we analyzed subgroup of IgA nephropathy with 89 patients, we also observed lnC4 (OR=38.092, 95% CI 1.752–828.162, p=0.021), IgG (OR=0.54, 95% CI 0.364–0.802, p=0.002) were independent influence factors of macroproteinuria (Supplemental Table 2).
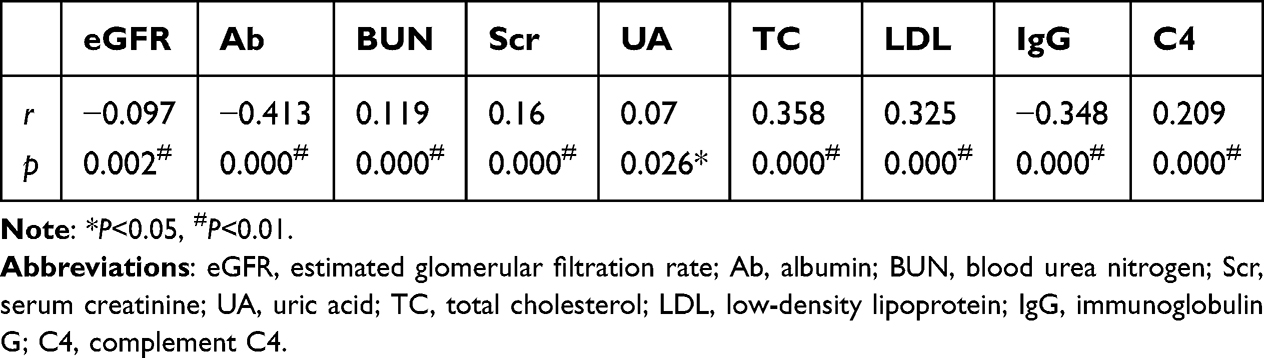 |
Table 4 Correlation Between Macroproteinuria and Clinical Index |
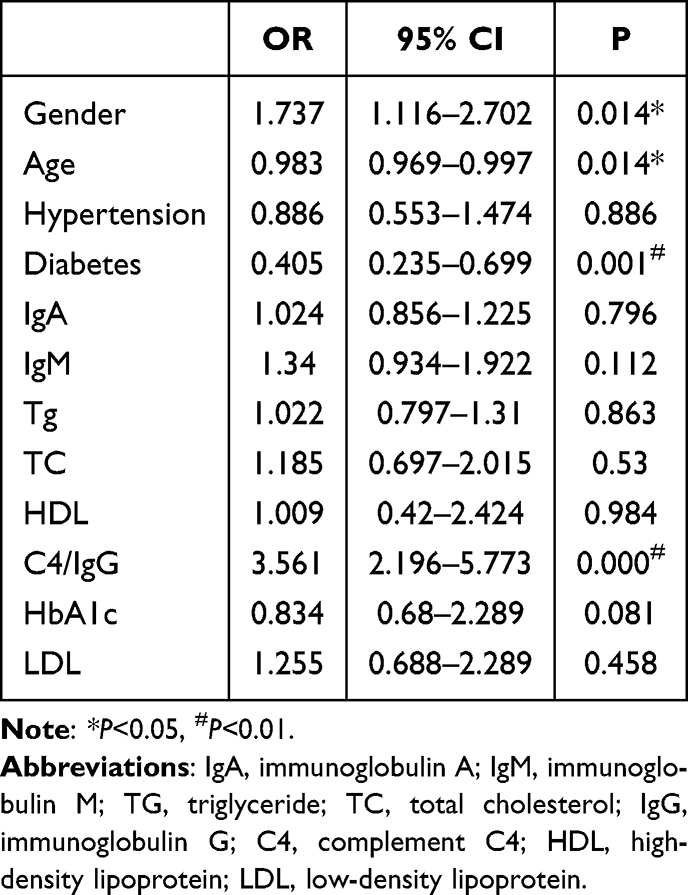 |
Table 5 Influence Factors of Macroproteinuria |
The Predictive Ability of C4/IgG for Macroproteinuria
According to the above analysis, ROC curve was employed to evaluate the prediction efficiency of complement C4/IgG on the likelihood of being diagnosed with macroproteinuria. The area under the ROC curve was 0.77 (95% CI: 0.75–0.82, p < 0.001) for C4/IgG. The analysis of ROC curves revealed a best cut-off for complement C4/IgG was 0.024 and yielded a sensitivity of 71% and a specificity of 71% (Figure 2A). On top of that, we performed ROC analysis in subgroup of IgA nephropathy patients. The area under the ROC curve was 0.841 (95% CI: 0.735–0.946, p < 0.001) for C4/IgG. The best cut-off for complement C4/IgG was 0.026mg/l and yielded a sensitivity of 75% and a specificity of 81.2% (Figure 2B). However, C4/IgG was not a good biomarker for predicting macroproteinuria in membrane nephropathy patients with 0.635 of ROC curve (Figure 2C). Further, we analyzed the predictive ability of C4/IgG in different CKD stages. The area under the ROC curve was 0.772 (95% CI: 0.699–0.845, p < 0.001) for C4/IgG in CKD1 stage. The best cut-off for complement C4/IgG was 0.024mg/l and yielded a sensitivity of 81.5% and a specificity of 65% (Figure 3A). The area under the ROC curve was 0.811 (95% CI: 0.731–0.892, p < 0.001) for C4/IgG in CKD2 stage. The best cut-off for complement C4/IgG was 0.024mg/l and yielded a sensitivity of 70.8% and a specificity of 81.5% (Figure 3B). The area under the ROC curve was 0.785 (95% CI: 0.707–0.863, p < 0.001) for C4/IgG in CKD3 stage. The best cut-off for complement C4/IgG was 0.024mg/l and yielded a sensitivity of 66.7% and a specificity of 74% (Figure 3C). The area under the ROC curve was 0.835 (95% CI: 0.741–0.93, p < 0.001) for C4/IgG in CKD4 stage. The best cut-off for complement C4/IgG was 0.024mg/l and yielded a sensitivity of 73.5% and a specificity of 83.3% (Figure 3D). The area under the ROC curve was 0.674 (95% CI: 0.741–0.93, p < 0.001) for C4/IgG in CKD5 stage. The best cut-off for complement C4/IgG was 0.024mg/l and yielded a sensitivity of 51.3% and a specificity of 68.1% (Figure 3E).
 |
Figure 2 ROC curves for C4/IgG in predicting macroproteinuria. Notes: The area under the ROC curve was 0.77 (95% CI: 0.75–0.82, p < 0.001) for C4/IgG. The analysis of ROC curves revealed a best cut-off for complement C4/IgG was 0.024 and yielded a sensitivity of 71% and a specificity of 71% (A). The area under the ROC curve was 0.841 (95% CI: 0.735–0.946, p < 0.001) for C4/IgG in IgA nephropathy patients. The analysis of ROC curves revealed a best cut-off for complement C4/IgG was 0.026 and yielded a sensitivity of 75% and a specificity of 81.2% (B). The area under the ROC curve was 0.635 (95% CI: 0.735–0.946, p < 0.001) for C4/IgG in membrane nephropathy patients (C). |
 |
Figure 3 ROC curves for C4/IgG in predicting macroproteinuria in different CKD stages. Notes: The area under the ROC curve was 0.772 (95% CI: 0.699–0.845, p < 0.001) for C4/IgG in CKD1 stage. The best cut-off for complement C4/IgG was 0.024mg/l and yielded a sensitivity of 81.5% and a specificity of 65% (A). The area under the ROC curve was 0.811 (95% CI: 0.731–0.892, p < 0.001) for C4/IgG in CKD2 stage. The best cut-off for complement C4/IgG was 0.024mg/l and yielded a sensitivity of 70.8% and a specificity of 81.5% (B). The area under the ROC curve was 0.785 (95% CI: 0.707–0.863, p < 0.001) for C4/IgG in CKD3 stage. The best cut-off for complement C4/IgG was 0.024mg/l and yielded a sensitivity of 66.7% and a specificity of 74% (C). The area under the ROC curve was 0.835 (95% CI: 0.741–0.93, p < 0.001) for C4/IgG in CKD4 stage. The best cut-off for complement C4/IgG was 0.024mg/l and yielded a sensitivity of 73.5% and a specificity of 83.3% (D). The area under the ROC curve was 0.674 (95% CI: 0.741–0.93, p < 0.001) for C4/IgG in CKD5 stage. The best cut-off for complement C4/IgG was 0.024mg/l and yielded a sensitivity of 51.3% and a specificity of 68.1% (E). |
Discussion
The present study focused on the relationship between serum complement C4/IgG and macroproteinuria. Most patients in our study were characterized by normal levels of C4. However, a significant difference was observed after dividing patients into macroproteinuria and non-macroproteinuria groups. Further, correlation analysis revealed remarkable positive correlation between macroproteinuria and complement C4. In addition, the logistic regression revealed lnC4, IgG, LDL and gender were independent influence factors of macroproteinuria. Additionally, ROC curve was performed to justify the predicting function of C4/IgG and the result showed sensitivity of 71% and a specificity of 71% to predict macroproteinuria with best cut-off value of 0.024mg/l. The above results between C4/IgG and macroproteinuria was further validated in subgroup of IgA nephropathy patients. However, the predictive ability of C4/IgG for macroproteinuria was not good enough in membrane nephropathy patients. Nevertheless, C4/IgG in different CKD stages revealed good ability to predict macroproteinuria.
Complement C4 is usually activated via classical and lectin pathways resulting in C4b and further C4c and C4d. Deposition of C4 in kidney tissue is uncommon which may be responsible for normal level of serum complement C4 in most CKD patients. To date, there are some reports about the deposition of C4d in kidney tissues. C4d is an activation-derived fragment of the classical pathway of the complement component C4, which is a 44.5-kD peptide that contains the thiol ester site and remains covalently bound to endothelial surfaces and the basement membranes. C4d deposition in the renal peritubular capillaries (PTC) has been found to be a sensitive and specific marker of antibody-mediated rejection in kidney allografts.14–17 In addition, patients with PTC C4d positive showed higher SLEDAI score and higher frequency of hypocomplementemia as compared to C4d negative. The prevalence of ANA, anti-dsDNA, anti-Sm and ACA were higher in C4d positive group, and most of these patients showed the diffuse proliferative glomerular lesion.18 Different with lupus nephritis, the plasma levels of C4d were significantly higher in patients with AAV with active disease compared with patients with lupus nephritis and normal controls. The plasma level of C4d in AAV patients in remission was significantly higher than that in normal controls.19 Renal survival at 10 years was 43.9% in C4d-positive patients versus 90.9% in C4d-negative patients from IgA nephropathy study.20 Recently, a number of case reports describe a novel diagnosis of C4 glomerulopathy manifesting as C4d deposition in mesangial and glomerular basement membranes.10,21
The above studies have revealed a direct or indirect correlation between complement C4 and CKD. However, little is known about whether the serum complement C4 has a relationship with CKD. A IgA nephropathy study showed serum C4 levels correlated significantly with clinical prognostic factors. Serum C4 levels correlated positively with urinary protein excretion, and negatively correlated with estimated glomerular filtration rate. Furthermore, serum C4 levels increased with aggravation of tubulointerstitial injury, crescents and ratios of global sclerosis.22 Another study also showed an increase in serum C4, as well as a decrease in C3, was an important outcome determinant for patients with IgAN.23 In our study, we also showed C4 was associated with proteinuria, especially macroproteinuria which is an important risk factor of CKD progression. Further, C4 was also an independent influence factor of macroproteinuria. Nevertheless, no data to date are about the correlation between C4 and macroproteinuria. As loss of IgG is accompanied with proteinuria which was also proved in our study, therefore, we analyzed whether C4/IgG could predict macroproteinuria. The ROC result revealed a good prediction effect of C4/IgG on macroproteinuria which attracted our attention to the level of C4/IgG in CKD patients. Our study not only revealed correlation of C4/IgG and macroproteinuria in general CKD patients, but also in IgA nephropathy, membrane nephropathy and different CKD stages supplying a good biomarker for predicting macroproteinuria in CKD patients.
There are some limitations in our study. Firstly, we did not give the follow-up results. Therefore, the correlation of C4/IgG and survive of CKD may not be elucidated. Our study revealed C4/IgG had positive relationship with macroproteinuria which suggesting elevated C4/IgG has an indirect aggravation of kidney function. Secondly, only 268 patients received kidney biopsy in our study which limited the analysis efficiency to differentiate the role of C4 in variable pathology of CKD.
Taken together, our study revealed different levels of serum complement C4 in macroproteinuria and non-macroproteinuria patients. C4/IgG had a pretty good predicting effect on the occurrence of macroproteinuria. Therefore, C4/IgG could be used clinically to help clinicians to assess the probability of macroproteinuria in CKD patients. Also, it could be used as a biomarker to determine whether the treatment regimes are enough for proteinuria in CKD patients.
Data Sharing Statement
Data and material could be obtained via sending Email to [email protected].
Ethics Approval
The study was performed in accordance with the Declaration of Helsinki and was approved by the Institutional Review Board of Nanjing First Hospital.
Consent to Participate
As it was a retrospective study, the informed consent was waived by the Institutional Review Board of Nanjing First Hospital. During the data collection, the patients’ information was confidential.
Consent for Publication
All authors agree to submit and publish the manuscript.
Author Contributions
All authors made a significant contribution to the work reported, whether that is in the conception, study design, execution, acquisition of data, analysis and interpretation, or in all these areas; took part in drafting, revising or critically reviewing the article; gave final approval of the version to be published; have agreed on the journal to which the article has been submitted; and agree to be accountable for all aspects of the work.
Funding
This work was supported by grants from the grants from the Nanjing Special Fund for Health Science and technology development (YKK22110, YKK21170). The funders had no role in study design, data collection and analysis, decision to publish, or reparation of the manuscript.
Disclosure
The authors report no conflicts of interest in this work.
References
1. Zhang L, Wang F, Wang L, et al. Prevalence of chronic kidney disease in China: a cross-sectional survey. Lancet. 2012;379:815–822.
2. Fuhrman DY, Schneider MF, Dell KM, et al. Albuminuria, proteinuria, and renal disease progression in children with CKD. Clin J Am Soc Nephrol. 2017;12:912–920. doi:10.2215/CJN.11971116
3. Palmer SC, Strippoli GF. Proteinuria: does vitamin D treatment improve outcomes in CKD? Nat Rev Nephrol. 2013;9(11):638–640. doi:10.1038/nrneph.2013.209
4. Cravedi P, Ruggenenti P, Remuzzi G. Proteinuria should be used as a surrogate in CKD. Nat Rev Nephrol. 2012;8:301–306. doi:10.1038/nrneph.2012.42
5. Tangri N, Stevens LA, Griffith J, et al. A predictive model for progression of chronic kidney disease to kidney failure. JAMA. 2011;305:1553–1559. doi:10.1001/jama.2011.451
6. Bay JT, Schejbel L, Madsen HO, Sørensen SS, Hansen JM, Garred P. Low C4 gene copy numbers are associated with superior graft survival in patients transplanted with a deceased donor kidney. Kidney Int. 2013;84:562–569. doi:10.1038/ki.2013.195
7. Zhu B, Zhu CF, Lin Y, et al. Clinical characteristics of IgA nephropathy associated with low complement 4 levels. Ren Fail. 2015;37:424–432. doi:10.3109/0886022X.2014.994408
8. Persson U, Truedsson L, Westman KW, Segelmark M. C3 and C4 allotypes in anti-neutrophil cytoplasmic autoantibody (ANCA)-positive vasculitis. Clin Exp Immunol. 1999;116:379–382. doi:10.1046/j.1365-2249.1999.00889.x
9. Jüptner M, Flachsbart F, Caliebe A, et al. Low copy numbers of complement C4 and homozygous deficiency of C4A may predispose to severe disease and earlier disease onset in patients with systemic lupus erythematosus. Lupus. 2018;27:600–609. doi:10.1177/0961203317735187
10. Sethi S, Quint PS, O’Seaghdha CM, et al. C4 glomerulopathy: a disease entity associated with C4d deposition. Am J Kidney Dis. 2016;67(6):949–953. doi:10.1053/j.ajkd.2016.01.012
11. Dodder NG, Tai SS, Sniegoski LT, Zhang NF, Welch MJ. Certification of creatinine in a human serum reference material by GC-MS and LC-MS. Clin Chem. 2007;53:1694–1699. doi:10.1373/clinchem.2007.090027
12. Shlipak MG, Sri Lekha Tummalapalli LEB, Grams ME, et al.; Conference Participants. The case for early identification and intervention of chronic kidney disease: conclusions from a kidney disease: improving global outcomes (KDIGO) controversies conference. Kidney Int. 2021;99(1):34–47. doi:10.1016/j.kint.2020.10.012
13. Stevens LA, Claybon MA, Schmid CH, et al. Evaluation of the chronic kidney disease epidemiology collaboration equation for estimating the glomerular filtration rate in multiple ethnicities. Kidney Int. 2011;79:555–562. doi:10.1038/ki.2010.462
14. Collins AB, Schneeberger EE, Pascual MA, et al. Colvin RB Complement activation in acute humoral renal allograft rejection: diagnostic significance of C4d deposits in peritubular capillaries. J Am Soc Nephrol. 1999;10:2208–2214. doi:10.1681/ASN.V10102208
15. Nickeleit V, Zeiler M, Gudat F, Thiel G, Mihatsch MJ. Detection of the complement degradation product C4d in renal allografts: diagnostic and therapeutic implications. J Am Soc Nephrol. 2002;13:242–251. doi:10.1681/ASN.V131242
16. van de Lest NA, Zandbergen M, Wolterbeek R, et al. Glomerular C4d deposition can precede the development of focal segmental glomerulosclerosis. Kidney Int. 2019;96:738–749. doi:10.1016/j.kint.2019.04.028
17. Liao T, Zhang Y, Ren J, et al. Noninvasive quantification of intrarenal allograft C4d deposition with targeted ultrasound imaging. Am J Transplant. 2019;19:259–268. doi:10.1111/ajt.15105
18. Li SJ, Liu ZH, Zen CH, Wang QW, Wang Y, Li LS. Peritubular capillary C4d deposition in lupus nephritis different from antibody-mediated renal rejection. Lupus. 2007;16:875–880. doi:10.1177/0961203307083279
19. Gou SJ, Yuan J, Chen M, Yu F. Zhao MH.Circulating complement activation in patients with -----anti-neutrophil cytoplasmic antibody-associated vasculitis. Kidney Int. 2013;83:129–137. doi:10.1038/ki.2012.313
20. Espinosa M, Ortega R, Gómez-Carrasco JM, et al. Mesangial C4d deposition: a new prognostic factor in IgA nephropathy. Nephrol Dial Transplant. 2009;24:886–891. doi:10.1093/ndt/gfn563
21. Park JM, Lee H, Song S, et al. Primary Glomerulonephritis with Unique C4d Deposition and concurrent non-infectious intermediate uveitis: a case report and literature review. J Korean Med Sci. 2018;33:e136. doi:10.3346/jkms.2018.33.e136
22. Bi TD, Zheng JN, Zhang JX, et al. Serum complement C4 is an important prognostic factor for IgA nephropathy: a retrospective study. BMC Nephrol. 2019;20:244. doi:10.1186/s12882-019-1420-0
23. Pan M, Zhang J, Li Z, et al. Increased C4 and decreased C3 levels are associated with a poor prognosis in patients with immunoglobulin A nephropathy: a retrospective study. BMC Nephrol. 2017;18:231. doi:10.1186/s12882-017-0658-7
 © 2024 The Author(s). This work is published and licensed by Dove Medical Press Limited. The
full terms of this license are available at https://www.dovepress.com/terms
and incorporate the Creative Commons Attribution
- Non Commercial (unported, 3.0) License.
By accessing the work you hereby accept the Terms. Non-commercial uses of the work are permitted
without any further permission from Dove Medical Press Limited, provided the work is properly
attributed. For permission for commercial use of this work, please see paragraphs 4.2 and 5 of our Terms.
© 2024 The Author(s). This work is published and licensed by Dove Medical Press Limited. The
full terms of this license are available at https://www.dovepress.com/terms
and incorporate the Creative Commons Attribution
- Non Commercial (unported, 3.0) License.
By accessing the work you hereby accept the Terms. Non-commercial uses of the work are permitted
without any further permission from Dove Medical Press Limited, provided the work is properly
attributed. For permission for commercial use of this work, please see paragraphs 4.2 and 5 of our Terms.