Back to Journals » Diabetes, Metabolic Syndrome and Obesity » Volume 16
Correlation Between Blood Glucose Indexes Generated by the Flash Glucose Monitoring System and Diabetic Vascular Complications
Authors Sheng X, Li T, Hu Y, Xiong CS, Hu L
Received 21 April 2023
Accepted for publication 21 July 2023
Published 16 August 2023 Volume 2023:16 Pages 2447—2456
DOI https://doi.org/10.2147/DMSO.S418224
Checked for plagiarism Yes
Review by Single anonymous peer review
Peer reviewer comments 3
Editor who approved publication: Dr Konstantinos Tziomalos
Xia Sheng, Ting Li, Yi Hu, Cheng-Shun Xiong, Ling Hu
Department of Endocrine, The First Hospital of NanChang City, Nanchang, Jiangxi, 330008, People’s Republic of China
Correspondence: Ling Hu, Email [email protected]
Objective: To discuss the relationship between time in range (TIR) which is deprived of the FGMS and the risk of diabetic vascular complications and to provide a theoretical foundation for the clinical application of TIR and other FGMS-deprived indexes.
Methods: Patients with T2DM who wore the FGMS sensor continuously were enrolled. Relevant indexes such as TIR, time below range (TBR), time above range (TAR), a standard deviation of blood glucose (SDBG), coefficient of variation of blood glucose (CV), and mean amplitude of glycemic excursion (MAGE) generated by the FGMS were recorded, and the risk of diabetic vascular complications were followed up for one year. The TIR was measured by continuous glucose monitoring at baseline, and patients were grouped according to TIR every 20%. Finally, the Cox proportional hazards regression model was used to estimate the association of different levels of TIR with different rates of diabetic vascular complications.
Results: TIR was negatively correlated with HbA1C, CV, SDBG, and amplitude of glycemic excursion (MV), wherein, the lower the TIR, the higher the HbA1C, CV, SDBG, and MV. TIR in the diabetic microvascular complication was significantly lower than that in the non-microvascular complication group, and the difference was statistically significant. TIR < 40% was identified as a risk factor for DN, DPN, and DR according to the risk assessment. The mean TAR in the DN group was significantly higher than that in the non-DN group. TAR, CV, SD, MAGE, and HbA1C in the DR group were significantly higher than those in the non-DR group. TAR, ABG, CV, SD, MAGE, and HbA1C in the DPN group were significantly higher than those in the non-DPN group.
Conclusion: The relationships between the TIR and the prevalence and risk of diabetic vascular complications and the HbA1C may be negative. Other CGM-deprived indexes such as CV and MV should be integrated into glycemic control and diabetes complication prediction.
Keywords: flash glucose monitoring system, diabetes, diabetic vascular complications, time in range, HbA1C
Introduction
As diabetes has become a growing global public health challenge, accurately predicting, preventing, and minimizing the occurrence and progression of diabetic complications has become a crucial and challenging aspect of diabetes management.1 Keeping blood glucose within a healthy range to reduce glycemic excursion in the early stages of the disease can effectively reduce the risk for microvascular and macrovascular complications associated with type 2 diabetes mellitus (T2DM).2 Blood glucose monitoring must be timely and accurate for effective glucose management.2 Emerging Continuous glucose monitoring (CGM) equipment, the flash glucose monitoring system (FGMS), has broad clinical application prospects.3 CGM can retrospectively provide 24-h blood glucose monitoring data, which can help doctors understand the trend of glycemic excursion and detect latent hyperglycemia and hypoglycemia that are not easily detected by conventional monitoring methods.3 The time in range (TIR) index is derived from the retrospective analysis from the CGM or the FGMS. As recommended in the International Expert Consensus on Clinical Application of CGM, in addition to TIR (3.9–10.0 mmol/L), time above range (TAR) (>10.0 mmol/L) and time below range (TBR) (<3.9 mmol/L) should be analyzed in blood glucose assessment.4 TIR combined with indexes such as TAR and TBR can better reflect and help control the changes in blood glucose of individuals. The application value of the glucose index derived from this emerging CGM technology in the Chinese population remains unexplored due to the lack of clinical experience with FGMS, as it has not been in the market for a long time.5 In addition, correlation studies between TIR and diabetes-related chronic complications are scarce. This study aims to examine the relationship between blood glucose-related indexes automatically generated by the FGMS and diabetes-related chronic complications to provide evidence for TIR which is a reference index for clinical blood glucose regulation and a predictor of the risk for diabetic complications in multiple aspects.
Methods
Participants and Design
A total of 545 patients with T2DM who wore the flash glucose monitoring sensor (for 7–14 days) during their stay at the hospital between October 2020 and October 2021 were enrolled, and a retrospective study was conducted. Clinical data were obtained from the clinical electronic medical record database and the FGM companion software. This study was approved by the ethics committee of the Third Affiliated Hospital of Nanchang University and was exempted from obtaining written informed consent, and the trial was conducted in accordance with the Helsinki guidelines. Cases included in this study were selected based on the inclusion and exclusion criteria of this study.
Inclusion Criteria
(1) Patients who met the 2010 WHO diagnostic criteria for T2DM; (2) patients between the ages of 18 and 80; and (3) patients who wore the flash glucose monitoring sensor for at least five days (≥5 days).
Exclusion Criteria
(1) Patients with type 1 diabetes mellitus (T1DM) or other forms of diabetes; (2) patients with diabetic ketoacidosis or nonketotic hyperosmolar coma; (3) pregnant or lactating women; (4) patients with tumor, trauma, or acute infection; (5) patients with mental disorders who refused to participate in the study; (6) patients with severe liver function impairment (alanine aminotransferase >3 times the upper limit of the normal range, total bilirubin >3 times the upper limit of the normal range, glutamyl transpeptidase >3 times the upper limit of the normal range) or severe renal function impairment [glomerular filtration rate <30 mi/(min*1.73 m2)]; (7) patients with severe hematological disease, platelet count <100×109/L or hemoglobin <60 g/L.
Apparatus
HbA1C: High-performance liquid chromatography-ion exchange method (Huizhong MQ-2000PT)
Flash glucose monitoring (FGM): Produced by Abbott; the generated blood glucose index was from the FGM blood glucose management networking system:
TIR (3.9–10.0 mmol/L)
TAR (≥10.0 mmol/L)
TBR (≤3.9 mmol/L).
Experimental Data
The primary outcome of this study was the correlation between TIR and the prevalence and risk of diabetic vascular complications, and the secondary outcome was the relationship between other related indicators TAR, TBR, MAGE, CV and diabetic vascular complications.
Comparison of Basic Data
Clinical data of the included cases were collected, and the following indexes were recorded: gender, age, course of diabetes, history of tobacco and alcohol use, glycosylated hemoglobin (HbA1C), TIR, time above range (TAR), time below range (TBR), coefficient of variation of blood glucose (CV), standard deviation of blood glucose (SDBG), inter-day variability, intraday variability, urine microalbumin level, creatinine, urea, uric acid, urinary ACR (ratio of urine creatinine to urine microalbumin) (UACR), blood lipid level, fundus photography, carotid color ultrasonography, and electro-neurogram examination.
Follow-Up and Diagnostic Criteria for Different Complications
The patients were followed up for one year after using the FGM and came to the hospital for reexamination every three months. After one year of follow-up, the occurrence of complications was counted through the electronic medical record system.
Diabetic Nephropathy
In clinical practice, diabetic nephropathy (DN) is generally diagnosed based on an elevated UACR or a decreased estimated glomerular filtration rate (eGFR), with other chronic kidney diseases (CKDs) excluded.6 Random urine collection is suggested for the determination of UACR; UACR ≥30 mg/g in two random urine tests is indicative of elevated urinary albumin excretion. In this study, the urine microalbumin groups are as follows: normal urine microalbumin group (urine microalbumin <30 ug/mg), microalbuminuria group (urine microalbumin: 30–300ug/mg), and macroalbuminuria group (urine microalbumin >300 ug/mg).
Diabetic Retinopathy
In this study, the TOPCON TRC-NW400 non-mydriatic retinal camera (Japan) was used for preliminary screening and diabetic retinopathy (DR) diagnosis.7 Patients with diabetic retinopathy (DR) were divided into three groups for analysis: (1) normal group, (2) background stage DR group, and (3) proliferative stage DR group.
Diagnostic Criteria for Diabetic Peripheral Neuropathy
1) patients with a clear diabetes history; 2) patients with neuropathy at or after the diabetes diagnosis; 3) patients with clinical symptoms and signs consistent with the manifestations of diabetic peripheral neuropathy (DPN). 4) if any of the five items (ankle reflex, prickly sensation, vibration sensation, pressure sensation, temperature sensation) was abnormal in patients with clinical symptoms (such as pain, numbness, abnormal sensation), or if any two of the five items were abnormal in patients without clinical symptoms, neural electromyography (EMG) may be performed to confirm the diagnosis if none of the aforementioned tests produce a definitive result.8
Diagnosis of Carotid Atherosclerotic Lesions
Definition of intima-media thickness (IMT) and plaques in carotid color ultrasonography:
Grade 1: no obvious abnormalities were observed; Grade 2: the carotid intima-media was thickened; and Grade 3: carotid plaques or lumen stenosis or occlusion were observed.9
Statistical Treatment
Normal distribution measurement data were expressed as mean ± standard deviation, and the Student's t-test was used for comparison. The chi-squared test was used to compare the enumeration data. Pearson’s or Spearman correlation analysis was performed for a single-factor correlation analysis. The effect of TIR on the risk of diabetic vascular complications was investigated using a binomial logistic regression model, with variables screened using stepwise regression. P < 0.05 indicated the presence of statistically significant differences. Univariate and multivariate analyses were used to control confounding and further verify the results.
Results
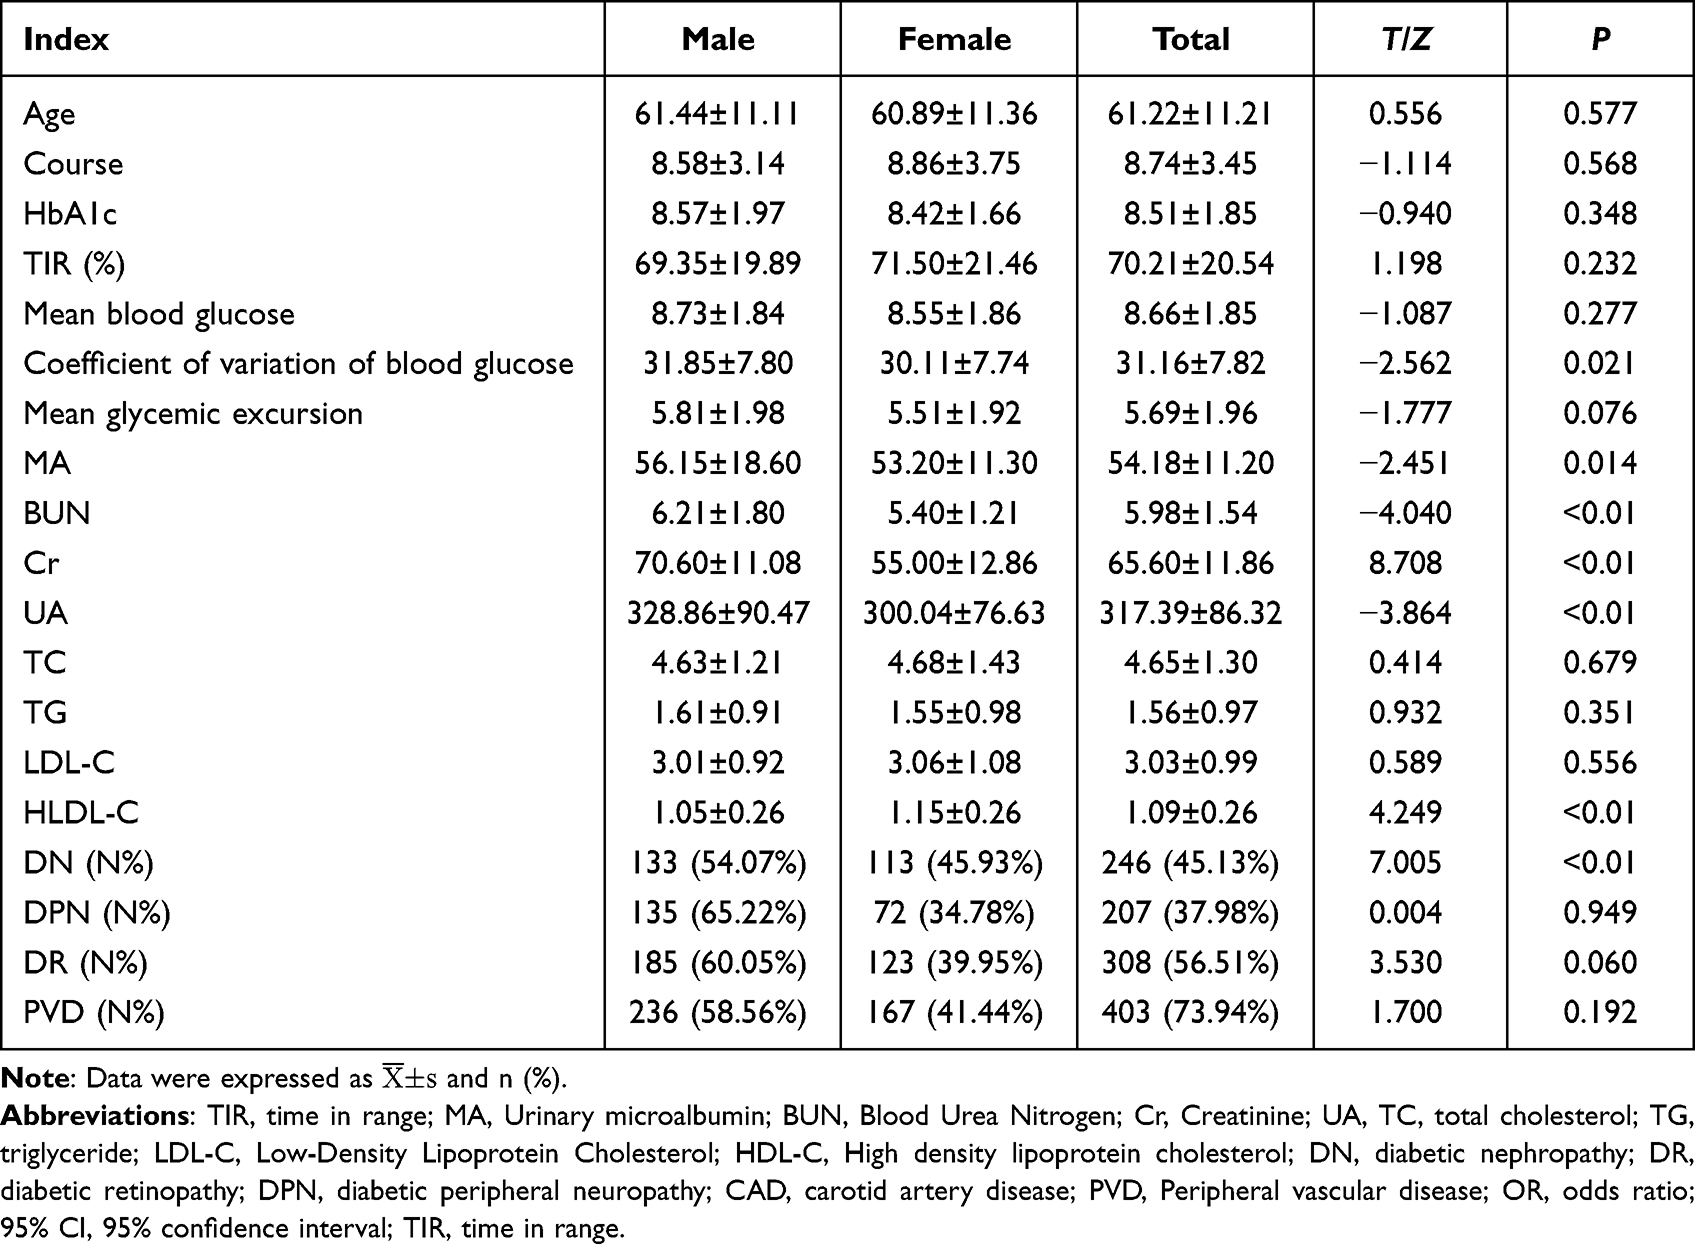
The study included a total of 545 patients with T2DM with a mean age of (61.22 ± 11.21) years. There were 328 males with a mean age of (61.44 ± 11.11) years and 217 females with a mean age of (60.89 ± 11.36) years among these patients. The average TIR was (70.21 ± 20.54)%, and the average HbA1C was (8.51 ± 1.85)% (Table 1).
 |

The 545 patients were divided into groups based on the presence or absence of diabetic complications, and the mean value of each blood glucose index was compared between the groups (Table 2).
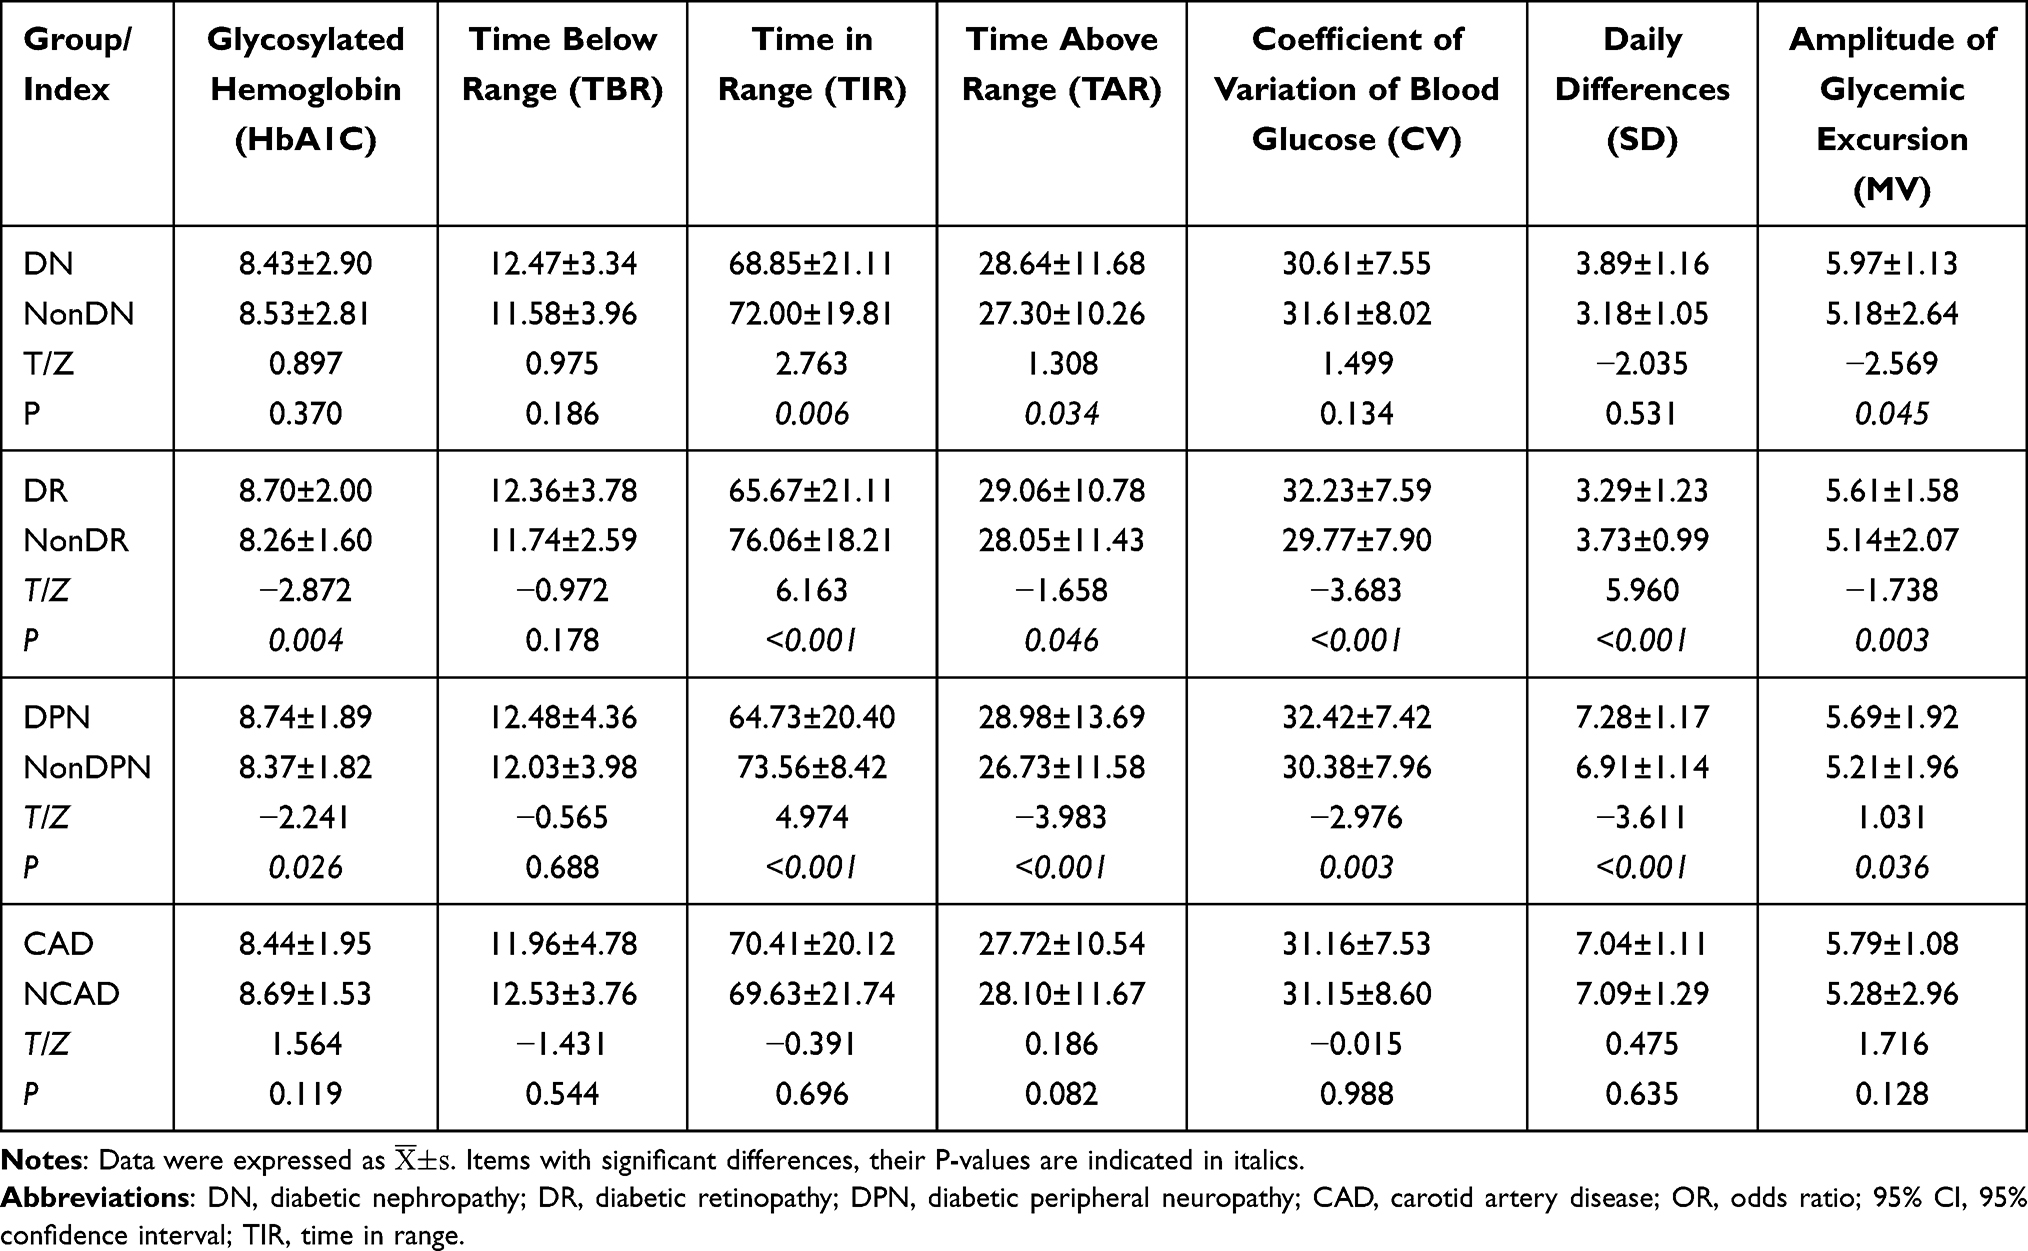 |
Table 2 Comparison of Glycemic Indexes of Complications |
The mean TIR in the DN group was significantly lower than that in the non-DN group (P < 0.05); the mean TAR in the DN group [(28.64±11.68)%] was significantly higher than that in the non-DN group [(27.30±10.26)%] and the difference was statistically significant (P < 0.05); there were no statistical differences in TBR, CV, SD, MF, or HbA1C between the two groups (P > 0.05) (Table 2).
The mean TIR in the DR group [(65.67±21.11)%] was lower than that in the non-DR group [(76.06±18.21)%], and the difference was statistically significant (t = 6.049, P < 0.01); the CV, SD, MF, and HbA1C in the DR group were higher than those in the non-DR group, and the differences were statistically significant (P < 0.05); there was no statistical difference in TBR between the DR and non-DR groups (P > 0.05) (Table 2).
TIR was lower and other blood glucose indexes (ABG, CV, SD, MFR, and HbA1C) were higher in the DPN group compared to the non-DPN group, and the differences were statistically significant (P < 0.05) (Table 2).
There were no statistical differences in all blood glucose indexes between the CAD group and the non-CAD group (P > 0.05) (Table 2).
To examine the proportion of patients with different TIR values and the correlation between TIR and HbA1C, MV, and CV, TIR was categorized into 20% intervals. There were 20 patients with TIR 20%, 105 with TIR between 20% and 40%, 151 with TIR between 40% and 60%, 164 with TIR between 60% and 80%, and 103 with TIR > 80% (Figure 1).
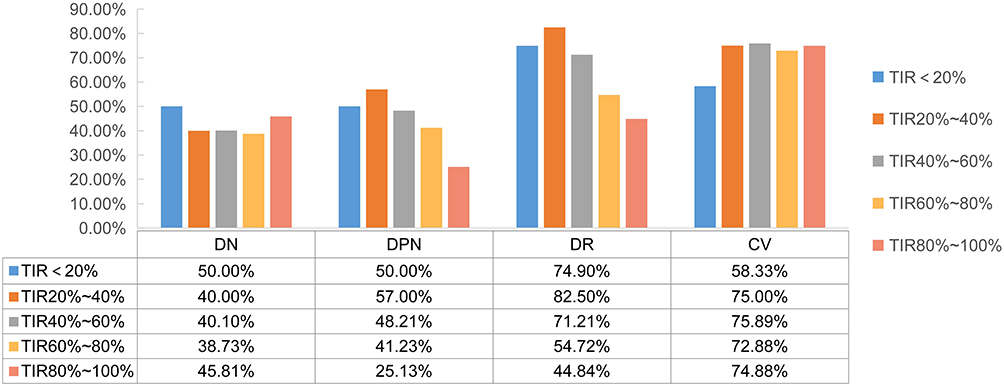 |
Figure 1 Prevalence of diabetic vascular complications in different time in range (TIR)% groups. |
According to the correlation analysis, the average TIR was (70.21 ± 20.54)%, and the average HbA1C was (8.51±1.85)%. TIR had a negative linear correlation with HbA1C (P < 0.01, Pearson’s correlation coefficient r = −0.889). The linear regression equation is HbA1C = 10.54–4.93*TIR. TIR was negatively correlated with CV (P < 0.01, r = −0.451) and MV (P 0.01, r = −0.346), where it correlated most strongly with HbA1C. In the range of 20% to 60%, the lower the TIR, the greater the MV, and the difference was statistically significant (χ2= 78.424, r = −0.346, P < 0.01); when TIR was less than 20% or greater than 60%, the MV was lower (Table 3).
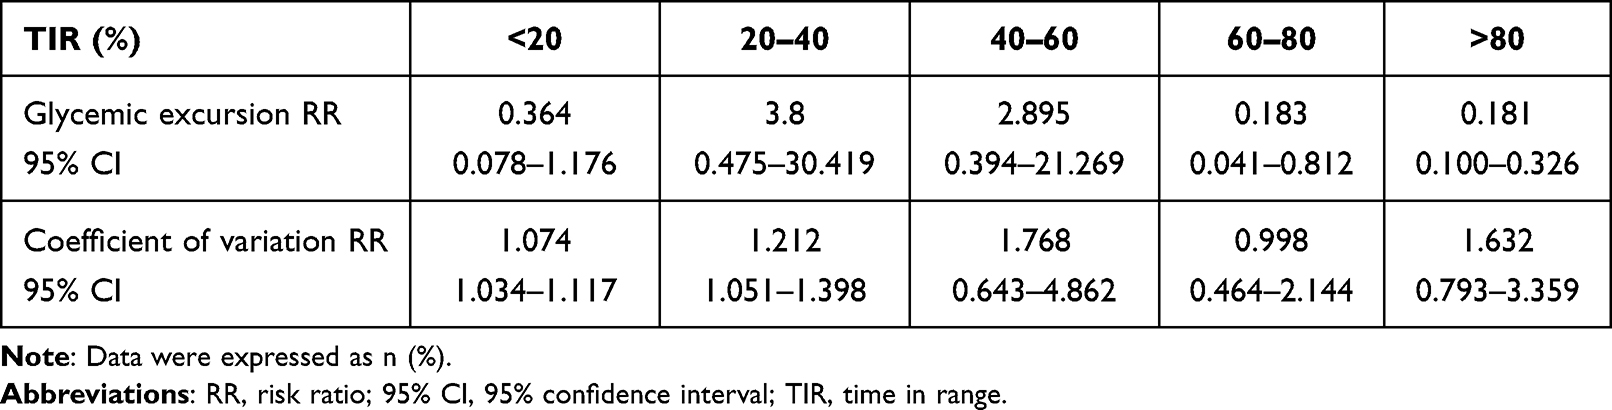 |
Table 3 TIR and Glucose Fluctuation Amplitude and Glucose Coefficient of Variation |
TIR was categorized into 5 groups at 20% intervals. Patients with DN were separated into the microalbuminuria group (urine microalbumin <300 mg/L) and the macroalbuminuria group (urine microalbumin ≥300 mg/L) based on the urine protein concentration. DN prevalence rates were compared between these TIR groups. The results indicated that the prevalence of DN increased with decreasing TIR, and the difference between groups was statistically significant (χ2= 11.74, P < 0.05). The percentage of microalbuminuria and macroalbuminuria was highest in the group with TIR <20%. TIR 40% was identified as a risk factor for microalbuminuria and macroalbuminuria in patients with DN (OR = 1.565, 95% CI: 1.085–2.049) (Table 4) (Figure 1).
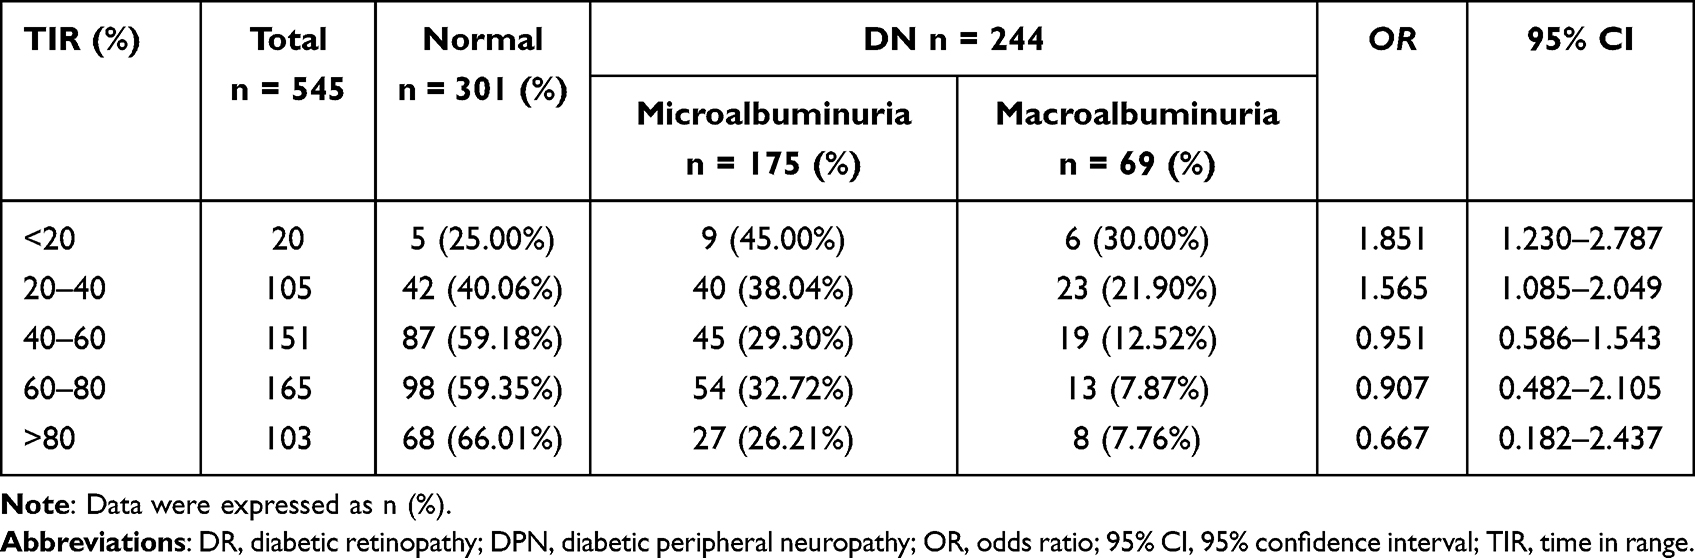 |
Table 4 Distribution and Risk Assessment of DN with Different TIR Propotion |
TIR was categorized into 5 groups at 20% intervals, and the prevalence rate of DR and risk coefficient were compared between these groups. The results indicated that the lower the TIR, the higher the prevalence rate of DR; proliferative stage DR had the highest prevalence rate in the group with TIR <40%, and background stage DR had the highest prevalence rate in the group with TIR in the 40–60% range, and the difference between groups was statistically significant (χ2= 146.635, P < 0.01). TIR ≤60% was a risk factor for background stage DR (OR = 1.183, 95% CI: 0.618–1.921), whereas TIR ≤40% was a risk factor for proliferative stage DR (OR = 1.571, 95% CI: 1.010–4.613) (Table 5) (Figure 2).
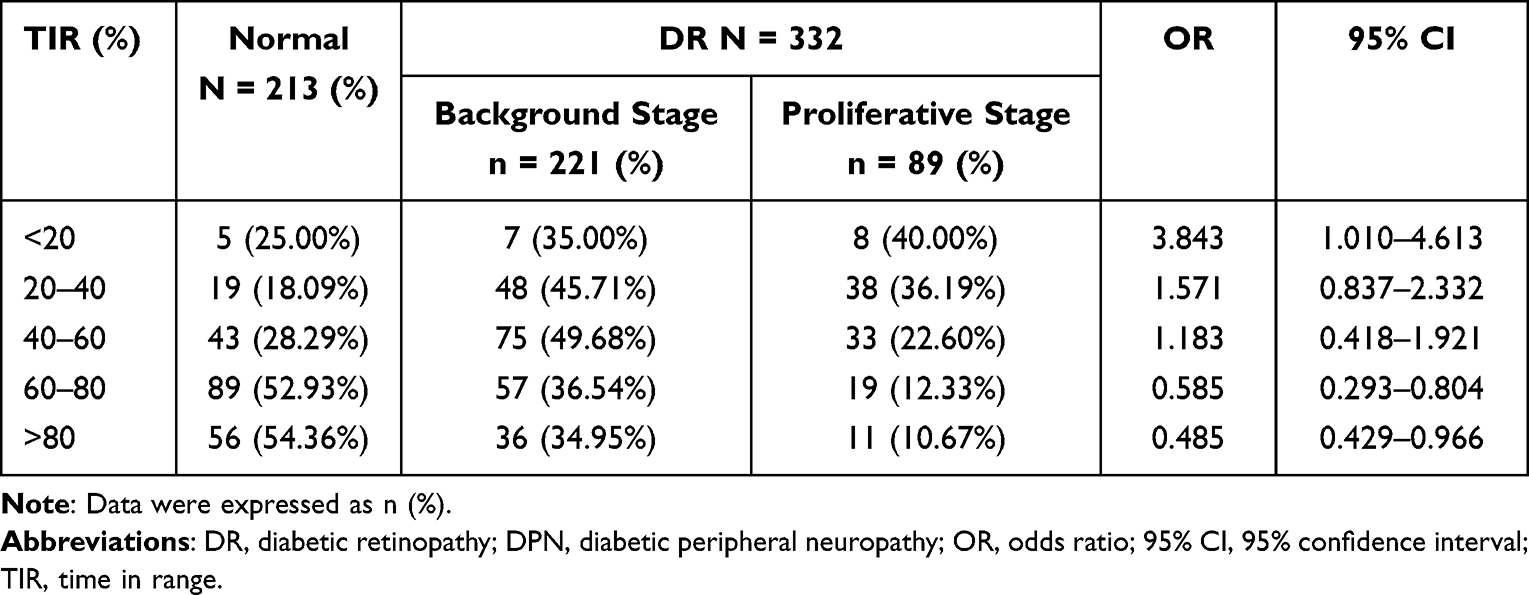 |
Table 5 Distribution and Risk Assessment of DR with Different TIR Propotion |
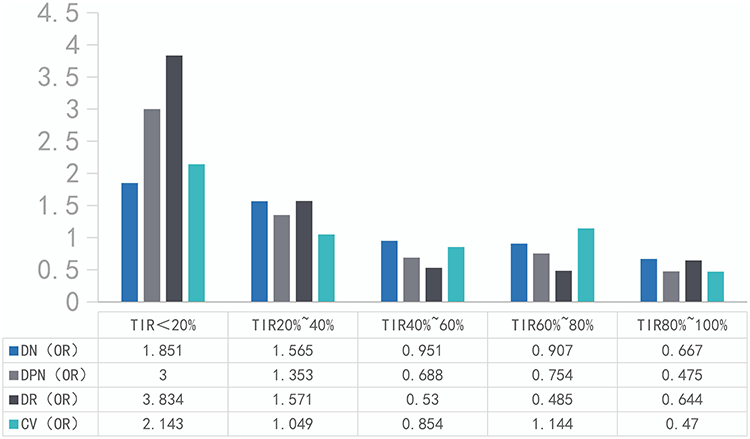 |
Figure 2 Odds ratio (OR) of diabetic vascular complications in different time in range (TIR)%. |
Among the 545 patients with diabetes, 254 were diagnosed with DPN, representing 44.95% of the total. The difference between the mean TIR of non-DPN patients [(73.56±19.92)%] was higher than that in DPN patients [(64.73±20.40)%], and the difference was statistically significant (t = 4.974, P < 0.01) (Table 5).
TIR was categorized into 5 groups at 20% intervals, and the prevalence rate of DR and risk coefficient were compared between these TIR groups. The results indicated that the prevalence of DPN increased with decreasing TIR, and the difference was statistically significant (χ2= 27.577, P < 0.001). The risk assessment indicated that TIR <40% was a risk factor for DPN, and the risk in the group with TIR <20% was 2.2 times that of the group with TIR <40% (Table 6) (Figure 2).
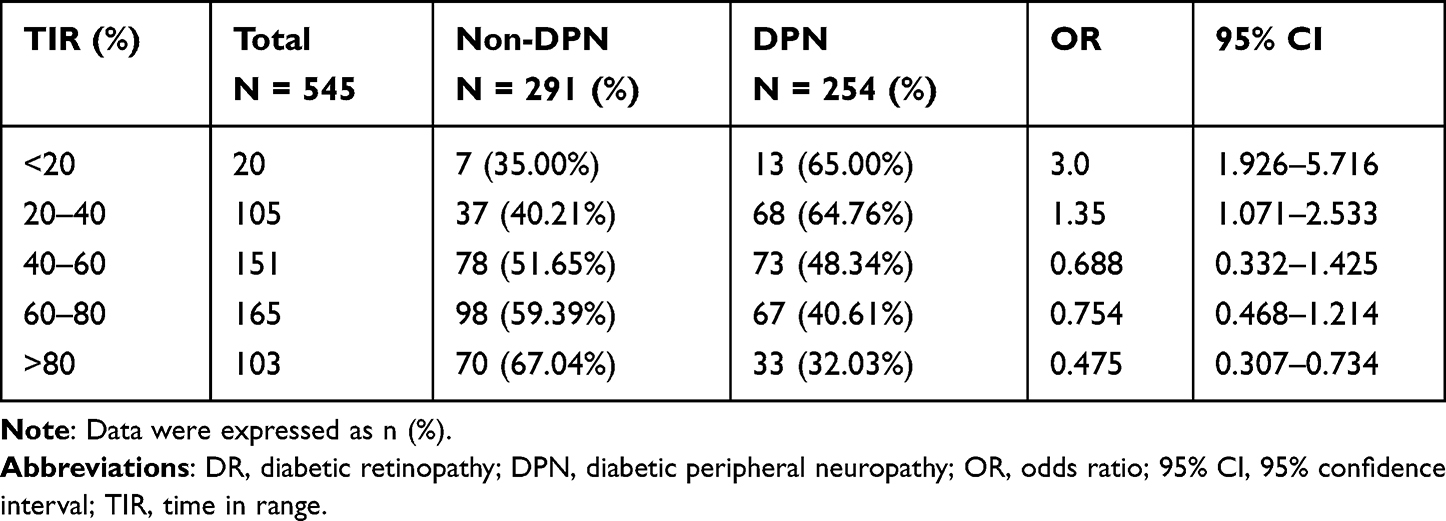 |
Table 6 Distribution and Risk Assessment of DPN with Different TIR Propotion |
Among the 545 patients with diabetes, 403 patients or 78.90% of the population were diagnosed with CAD. Statistically, there was no difference in the mean TIR between the non-CAD group [(69.63±21.74)%] and the CAD group [(70.41±20.12)%] (t = −0.391, P = 0.696) (t = −0.391, P = 0.696). Statistically, there was no difference in the mean TAR between the non-CAD group [(28.10±11.67)%] and the CAD group [(27.72±10.54)%] (t = 0.186, P = 0.852) (Table 6).
Among the 403 patients with CAD, 202 were at the thickening stage (52.60%) and 201 were at the plaque stage (47.40%). There were 7 patients with TIR <20%, 30 with TIR between 20% and 40%, 85 with TIR between 40% and 60%, 109 with TIR between 60% and 80%, and 152 with TIR >80%. TIR and CAD did not correlate (r = −0.098), and the difference was not statistically significant (χ2= 1.899, P = 0.759). There were 187 patients with TBR <20% and 216 with TBR ≥20%. TBR and CAD did not exhibit a dose–response relationship, and the difference was not statistically significant (χ2= 0.018, P = 0.894). There were 178 patients with TAR <20%, and 34 patients with TIR >20%. TAR and CAD had no correlation, and the difference was not statistically significant (χ2= 2.912, P = 0.405) (Table 7).
 |
Table 7 Prevalence and Risk Assessment of Carotid Artery Diseases with Different TIR |
There was no statistical difference in age, course of disease, TIR, HbA1C, mean blood glucose, CV, amplitude of glycemic excursion (MV), total cholesterol, low-density cholesterol, and triglyceride between the two groups (P > 0.05) (Table 1). The male group had higher levels of urine microalbumin, urea, serum creatinine, and uric acid than the female group, and the difference was statistically significant (P < 0.05). The female group had a higher level of high-density lipoprotein cholesterol than the male group, and the difference was statistically significant (P < 0.05). There was no statistically significant difference between the prevalence rates of DR, DPN, and peripheral artery disease (PAD) between the two groups (P > 0.05) (Table 1).
There were 301 patients with DN, 237 with DR, 338 with peripheral neuropathy, and 142 with carotid artery disease (CAD); males had a higher prevalence rate of DN than females, and the difference was statistically significant (χ2= 7.005, P = 0.008), whereas there was no statistical difference between males and females in the other groups (P > 0.05) (Table 8).
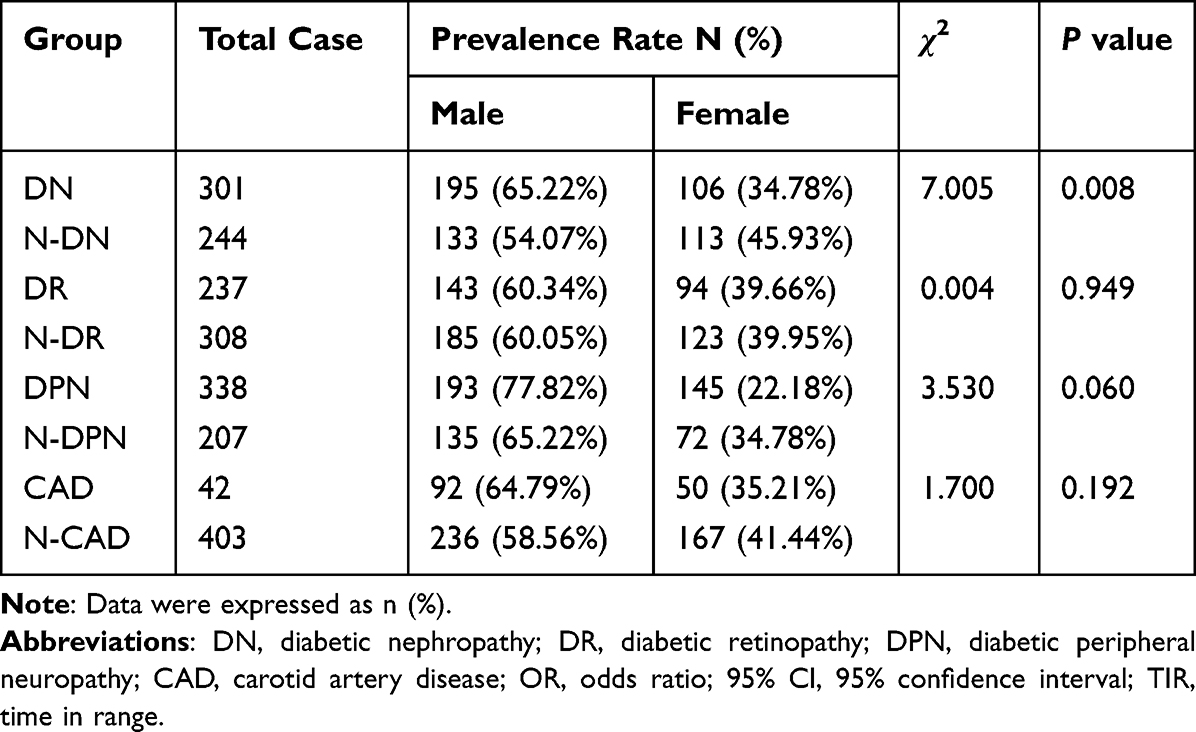 |
Table 8 Prevalence of Diabetes Complications N (%) |
Discussion
In this study, the results revealed that TIR was negatively correlated with HbA1C, CV, and MV, but with the strongest correlation with HbA1C (r = −0.889). Therefore, similar to HbA1C, controlling TIR within a certain range can effectively prevent the occurrence of long-term complications. Different from HbA1C, TIR can be obtained at any time through FGM. The change of TIR can not only predict the occurrence of long-term complications of diabetes but also can be used as a short-term indicator to guide daily blood glucose control. Previous research indicated that the tested TIR was closely related to HbA1C, with HbA1C decreasing by approximately 0.5% for every 10% increase in TIR.3,10 In this study, the mean TIR was (70.21±20.54)%, and the mean HbA1C was (8.51±1.85)%, with a negative linear correlation (r = −0.889) between the two variables. The results were consistent with both the conclusion of Raj et al11 and the previous findings of this research team.4 Large inter-day glycemic variability and MV may promote the occurrence and development of diabetes-related chronic complications, according to previous research.12 This study also revealed the relationship between TIR, inter-day glycemic variability, and MV. When TIR was between 20% and 60%, the lower the TIR, the greater the inter-day glycemic variability and MV, and the difference was statistically significant (P < 0.01); when TIR was 20% or >60%, the inter-day variability and MV decreased. Low TIR or high TIR correlated with low MV, indicating that MV could not dynamically reflect the blood glucose control to some extent.
In addition, we found a weak correlation between TIR and hypoglycemic parameters and a strong correlation between TIR and TAR, with TAR gradually decreasing as TIR increased. The reason may be that TBR (<5% in general) has a much smaller impact on TIR than TAR (20–50% in general).13 The results of this study indicate that TIR does not adequately reflect the risk of hypoglycemia. Thus, TIR may be combined with TBR to evaluate blood glucose control in a more comprehensive manner in populations at a higher risk of hypoglycemia, particularly patients with T1DM.13
The incidence of DR, DPN, and CAD did not differ significantly between males and females in this study (P > 0.05), but the levels of urine microalbumin, urea, serum creatinine, and uric acid were significantly higher, and the prevalence rate of DN was higher in males than in females. Lu et al14 discovered in a meta-analysis of 30 clinical studies that males with T2DM were more likely to develop DN compared to females, corroborating our findings. Moreover, high-density lipoprotein cholesterol in females was found to be higher than that in males, which suggests that females with T2DM experience fewer cardiovascular events than males. Yapanis et al10 found a strong relationship between TIR and diabetic microvascular complications. Raj et al11 found that TIR was a reliable predictor of diabetic vascular complications. El Malahi’s recent research results showed that a lower TIR is related to the presence of complex microvascular complications and hospitalization for hypoglycemia or ketoacidosis. TIR, SD, and CV were not associated with macrovascular complications.12 In this study, the prevalence rates of diabetic microvascular complications, including DN, DR, and DPN, increased with decreasing TIR, consistent with previous findings.10,11 This suggests that controlling blood glucose within the TIR may help reduce the incidence and development of diabetic microvascular complications. Jingyi Lu et al's14 recent findings showed that lower TIR was associated with increased risk of all-cause and CVD death in type 2 diabetes found in a follow-up of data up to 6.9 years, supporting the validity of TIR as a surrogate marker of long-term adverse clinical outcome. However, this study revealed a weaker correlation between TIR and large vessels (carotid intima thickness) and peripheral vessels. This may be due to the influence of multiple risk factors, such as age, disease progression, blood lipids, and uric acid, on macrovascular complications.
This research has the following limitations: First, in this cross-sectional study, abnormal CIMT and the occurrence and progression of DR in each group cannot be confirmed after grouping according to this cutoff point. In addition, the target glucose range chosen for TIR calculation was 3.9–10.0 mmol/L, whereas the blood glucose control for different diabetic patients must be individualized; thus, additional research is necessary to clarify the clinical significance of the upper limits of different target ranges and to determine the correct TIR cutoff point. The effects of various treatment plans on the TIR outcome of patients with diabetes require additional investigation.
Conclusion
The relationships between the TIR and the prevalence and risk of diabetic vascular complications and the HbA1C may be negative. Other CGM-deprived indexes such as CV and MV should be integrated into glycemic control and diabetes complication prediction.
Data Sharing Statement
The datasets used and/or analysed during the current study are available from the corresponding author on reasonable request. We declared that the materials described in the manuscript, including all relevant raw data, will be freely available to any scientist wishing to use them for non-commercial purposes, without breaching participant confidentiality.
Ethics Approval and Consent to Participate
This study was conducted with approval from the Ethics Committee of The First Hospital of Nanchang. This study was conducted in accordance with the declaration of Helsinki. Written informed consent was obtained from all participants.
Acknowledgments
We would like to acknowledge the hard and dedicated work of all the staff that implemented the intervention and evaluation components of the study.
Author Contributions
All authors made a significant contribution to the work reported, whether that is in the conception, study design, execution, acquisition of data, analysis and interpretation, or in all these areas; took part in drafting, revising or critically reviewing the article; gave final approval of the version to be published; have agreed on the journal to which the article has been submitted; and agree to be accountable for all aspects of the work.
Funding
This work was supported by Key R&D Project in Jiangxi Province (No.20203BBG73053), Project of Jiangxi Provincial Health Commission (No.20214007).
Disclosure
The authors declare that they have no competing interests in this work.
References
1. Danne T, Revital N, Tadej B, et al. International consensus on use of continuous glucose monitoring. Diabetes Care. 2017;40(12):1631–1640. doi:10.2337/dc17-1600
2. The Diabetes Control and Complications Trial Research Group. The relationship of glycemic exposure (HbA1C) to the risk of development and progression of retinopathy in the diabetes control and complications trial. Diabetes. 1995;44(8):968–983. doi:10.2337/diab.44.8.968
3. Ford ES, Cowie CC, Li C, et al. Iron‑deficiency anemia, non‑iron‑deficiency anemia and HbA1C among adults in the US. J Diabetes. 2011;3(1):67–73. doi:10.1111/j.1753-0407.2010.00100.x
4. Sheng X, Xiong GH, Yu PF, et al. The correlation between time in range and diabetic microvascular complications utilizing information management platform. Int J Endocrinol. 2020;2020:8879085. doi:10.1155/2020/8879085
5. Battelino T, Danne T, Bergenstal RM, et al. Clinical targets for continuous glucose monitoring data interpretation: recommendations from the international consensus on time in range. Diabetes Care. 2019;42(8):1593–1603. doi:10.2337/dci19-0028
6. Vigersky RA, McMahon C. The relationship of hemoglobin A1C to time-in-range in patients with diabetes. Diabetes Technol Ther. 2019;21(2):81–85. doi:10.1089/dia.2018.0310
7. Ali MK, Pearson-Stuttard J, Selvin E, et al. Interpreting global trends in type 2 diabetes complications and mortality. Diabetologia. 2022;65(1):3–13. doi:10.1007/s00125-021-05585-2
8. Zhu X, Zhao L, Chen J, et al. The effect of physical activity on glycemic variability in patients with diabetes: a systematic review and meta-analysis of randomized controlled trials. Front Endocrinol. 2021;12:767152. doi:10.3389/fendo.2021.767152
9. Zhang XX, Kong J, Yun K. Prevalence of diabetic nephropathy among patients with type 2 diabetes mellitus in China: a meta-analysis of observational studies. J Diabetes Res. 2020;2020:2315607. doi:10.1155/2020/2315607
10. Yapanis M, James S, Craig ME, et al. Complications of diabetes and metrics of glycemic management derived from continuous glucose monitoring. J Clin Endocrinol Metab. 2022;107(6):e2221–e2236. doi:10.1210/clinem/dgac034
11. Raj R, Mishra R, Jha N, et al. Time in range, as measured by continuous glucose monitor, as a predictor of microvascular complications in type 2 diabetes: a systematic review. BMJ Open Diabetes Res Care. 2022;10(1):e002573. doi:10.1136/bmjdrc-2021-002573
12. El Malahi A, Van Elsen M, Charleer S, et al. Relationship between time in range, glycemic variability, HbA1C, and complications in adults with type 1 diabetes mellitus. J Clin Endocrinol Metab. 2022;107(2):e570–e581. doi:10.1210/clinem/dgab688
13. De Ritter R, de Jong M, Vos RC, et al. Sex differences in the risk of vascular disease associated with diabetes. Biol Sex Differ. 2020;11(1):1. doi:10.1186/s13293-019-0277-z
14. Lu J, Wang C, Shen Y, et al. Time in range in relation to all-cause and cardiovascular mortality in patients with type 2 diabetes: a prospective cohort study. Diabetes Care. 2021;44(2):549–555. doi:10.2337/dc20-1862
 © 2023 The Author(s). This work is published and licensed by Dove Medical Press Limited. The
full terms of this license are available at https://www.dovepress.com/terms
and incorporate the Creative Commons Attribution
- Non Commercial (unported, 3.0) License.
By accessing the work you hereby accept the Terms. Non-commercial uses of the work are permitted
without any further permission from Dove Medical Press Limited, provided the work is properly
attributed. For permission for commercial use of this work, please see paragraphs 4.2 and 5 of our Terms.
© 2023 The Author(s). This work is published and licensed by Dove Medical Press Limited. The
full terms of this license are available at https://www.dovepress.com/terms
and incorporate the Creative Commons Attribution
- Non Commercial (unported, 3.0) License.
By accessing the work you hereby accept the Terms. Non-commercial uses of the work are permitted
without any further permission from Dove Medical Press Limited, provided the work is properly
attributed. For permission for commercial use of this work, please see paragraphs 4.2 and 5 of our Terms.
Recommended articles
Associations of Obesity Indices with Bone Mineral Densities and Risk of Osteoporosis Stratified Across Diabetic Vascular Disease in T2DM Patients
Zheng S, Zhou J, Wang K, Wang X, Li Z, Chen N
Diabetes, Metabolic Syndrome and Obesity 2022, 15:3459-3468
Published Date: 3 November 2022
Systemic Predictors of Diabetic Retinopathy and Diabetic Macular Edema in an Adult Veteran Population
Tran EM, Gregori NZ, Rachitskaya A, Nandan A, Pershing S, Goldberg JL
Clinical Ophthalmology 2025, 19:101-110
Published Date: 8 January 2025