Back to Journals » OncoTargets and Therapy » Volume 13
Correlation Between Baseline Serum Tumor Markers and Clinical Characteristic Factors in Patients with Advanced Pancreatic Cancer
Authors Deng G, Yan H, Guo Z, Dai G ![]()
Received 21 July 2020
Accepted for publication 29 September 2020
Published 2 November 2020 Volume 2020:13 Pages 11151—11163
DOI https://doi.org/10.2147/OTT.S269720
Checked for plagiarism Yes
Review by Single anonymous peer review
Peer reviewer comments 2
Editor who approved publication: Dr Sanjay Singh
Guo-chao Deng,1,2 Huan Yan,2 Zhi-peng Guo,2 Guanghai Dai1,2
1School of Medicine, Nankai University, Tianjin 300071, People’s Republic of China; 2Department of Medical Oncology, The First Medical Center of Chinese People’s Liberation Army (PLA) General Hospital, Beijing, 100853, People’s Republic of China
Correspondence: Guanghai Dai
Department of Medical Oncology, The First Medical Center of Chinese People’s Liberation Army (PLA) General Hospital, Beijing 100853, People’s Republic of China
Tel +86-13801232381
Email [email protected]
Purpose: In pancreatic cancer (PC), CA 19– 9, CEA and CA 125 are the most widely used tumor markers. The aim of this study was to explore the prognostic significance of baseline levels of serum CA 19– 9, CEA, and CA 125, and to evaluate the clinical significance of these markers in PC patients.
Patients and Methods: A total of 278 patients with advanced PC that had received first-line chemotherapy treatments were examined. Correlation analysis between the tumor markers and clinical characteristics was performed using a Pearson’s Chi-squared test or Fisher’s exact test. A Pearson’s correlation test was utilized to investigate the relationship between tumor markers and peripheral blood parameters. Univariate analysis was estimated using a Kaplan–Meier analysis and compared using a Log rank test. Multivariate analysis was performed using a Cox proportional hazards regression model.
Results: Both individually and collectively, the baseline CA 19– 9, CEA and CA 125 levels were positively associated with the primary tumor site (p < 0.01), liver metastasis (p < 0.05), and number of organ metastases (p < 0.05). Furthermore, CA 19– 9, CEA and CA 125 were correlated to baseline WBC (p < 0.001) and LDH (p < 0.01) levels. Additionally, CA 19– 9 was correlated with years of smoking (p = 0.024); diabetes and years of diabetes (p = 0.012); baseline glycemic levels (p = 0.004); and neutrophil counts (p < 0.001). Moreover, CA 125 levels were associated with the baseline neutrophil counts (p < 0.001) and peritoneal metastasis (p = 0.008). When examining neutrophil, LDH, CA 19– 9 and CA 125 levels were found to be associated with overall survival (OS) and shown to be independent prognostic factors.
Conclusion: CA 19– 9, CEA and CA 125 are correlated with multiple clinical factors. Baseline neutrophil, LDH, CA 19– 9 and CA 125 levels are associated with OS and may potentially serve as prognostic factors.
Keywords: pancreatic cancer, CA 19-9, CEA, CA 125, correlation analysis, prognosis
Introduction
Pancreatic cancer (PC) is the fourth leading cause of cancer deaths worldwide, with a five year survival rate of less than 7%.1 In the United States in 2019, PC-related deaths totaled 45,750 individuals, with an estimated 56,770 new cases.2 In China, PC ranks tenth in cancer incidences and sixth in cancer-related mortalities.3 Hence, obtaining a baseline assessment and classification of patient prognosis is necessary to guide treatment.
Currently, non-invasive and low-cost tumor markers are widely used to establish a clinical prognosis. One such marker is carbohydrate antigen (CA) 19–9, which belongs to the sialylated Lewis blood group.4 In more than 80% of patients with advanced PC, CA 19–9 levels were increased.5 Furthermore, CA 19–9 is the only biomarker that is recommended for clinical use in PC by the National Comprehensive Cancer Network (NCCN) guidelines.6 In addition to CA 19–9, another less commonly used diagnostic, carcinoembryonic antigen (CEA), is elevated in 30–60% of PC patients and is correlated with PC survival.7 Furthermore, another marker, CA 125, has been shown to be superior to CA 19–9 for predicting PC.8 In a previous study, CA 19–9, CEA and CA 125 were combined and shown to serve as preoperative factors that could be utilized to predict surgical outcomes.9 Furthermore, other studies have combined various tumor biomarkers with the peripheral blood index to better establish a PC patient prognosis.10–12
Previous studies examining CA 19–9, CEA and CA 125 have predominantly focused on their survival prognostic value in PC, with few studies exploring their predictive values. In colon cancer, elevated preoperative CA 19–9 levels were shown to effectively predict lung and abdominopelvic metastasis.13 Furthermore, in locally advanced rectal cancer, changes in CA 19–9 and CEA levels during neoadjuvant chemoradiotherapy were associated with tumor downstaging.14 Therefore, potential applications for CA 19–9, CEA and CA 125 in PC warrant further exploration.
While the prognostic values of CA 19–9, CEA and CA 125 have been confirmed independently, few studies have examined their prognostic value collectively. This study also investigated the prognostic significance of CA 19–9, CEA, and CA 125 as well as the connection between CA 19–9, CEA and CA 125 baseline levels obtained prior to first-line chemotherapy and the prognosis of advanced PC.
Patients and Methods
Patients
In this retrospective study, 278 patients with advanced or metastatic PC that were treated at the Chinese People’s Liberation Army General Hospital from 2010 to 2017 were examined. All patients were admitted for first-line chemotherapy, with follow-up information obtained every 6 months. The chemotherapy regimens included 40 patients treated with gemcitabine monotherapy, 43 patients treated with gemcitabine-based combination chemotherapy, 27 patients treated with nab-paclitaxel plus gemcitabine, 159 patients treated with nab-paclitaxel plus S1, and 9 patients treated with S1 monotherapy. All clinical characteristics were obtained before the initial first-line chemotherapy was administered. Chemotherapy responses were estimated based on CT scans that were performed after 2 cycles of chemotherapy and evaluated based on the Response Evaluation Criteria in Solid Tumors (RECIST) guidelines version 1.0. Patients were then classified into four groups, including the PR (partial response), SD (sable disease), PD (progressive disease) or NA (not available) groups. The inclusion criteria included a PC diagnosis confirmed by histopathology or cytology; no previous first-line chemotherapy received prior to recruitment; a Karnofsky performance status (KPS) score of ≥70; and an explicit terminal status. Patients were excluded if the baseline data was lacking or if the follow-up data was lost. Patients were followed until July 30, 2018.
Laboratory Measurements
Serum CA 19–9, CEA, CA 125, lactate dehydrogenase (LDH), albumin (Alb), white blood cell (WBC), neutrophil, platelet (Plt), total bilirubin (TB) and glycemic (blood sugar) levels were measured prior to first-line chemotherapy initiation to determine the baseline levels. The cut-off values for the peripheral blood parameters were defined as the upper limit of normal (ULN) and are defined as follows: CA 19–9 (37 U/mL), CEA (5.0 ng/mL), CA 125 (35 U/mL), LDH (250 U/L), WBC (10×10^9/L), neutrophil (0.70), Plt (300×10^9/L), TB (21 µmol/L), and glycemic (6.1 mmol/L). A normal lower limit was examined for Alb (35 g/L).
Statistical Analysis
Overall survival (OS) was defined as the time interval from the date of starting first-line chemotherapy to death or the last follow-up. Potential correlations between the clinical characteristics and serum tumor markers were determined using a Pearson’s chi-squared test or Fisher’s exact test. Pearson’s correlation analysis was performed to determine possible correlations between the three tumor markers and peripheral blood parameters due to the data displaying a normal distribution. Overall survival rates were estimated using the Kaplan–Meier method and compared using a Log rank test. Multivariate analysis was performed using a Cox proportional hazards regression model. Survival analysis was performed using SPSS software (version 22.0), and survival curves and correlation graphs were drawn using GraphPad Prism 8.0. Statistical significance was defined as p < 0.05.
Results
Patient Characteristics
From January 2010 to December 2017, 278 patients with advanced or metastatic PC were enrolled in this retrospective study. The patients included 109 (39.2%) males and 169 (60.8%) females, with a median age at diagnosis of 56 years (range: 30–85 years) and a median OS of 9.7 months (range: 1.68–43.66 months).
Correlation Between Clinical Characteristic Factors and Baseline Tumor Markers
The median CA 19–9, CEA, and CA 125 values were 1180 U/mL (range: 0.60–20,000 U/mL), 7.23 µg/L (range: 0.21–5033 µg/L), and 82.56 U/mL (range: 5.10–4134 U/mL), respectively. The median CA 19–9 level was significantly correlated with years of smoking (p = 0.024), diabetes (p = 0.012), years of diabetes (p = 0.012), tumor location (p = 0.007), number of organ metastases (p = 0.001) and liver metastasis (p = 0.001). The median CEA value was significantly correlated with the tumor location (p = 0.012), number of organ metastases (p = 0.008) and liver metastasis (p = 0.001). The medium CA 125 level was significantly correlated with tumor location (p = 0.003), number of organ metastases (p = 0.042), liver metastasis (p = 0.028), and peritoneal metastasis (p = 0.008; Table 1).
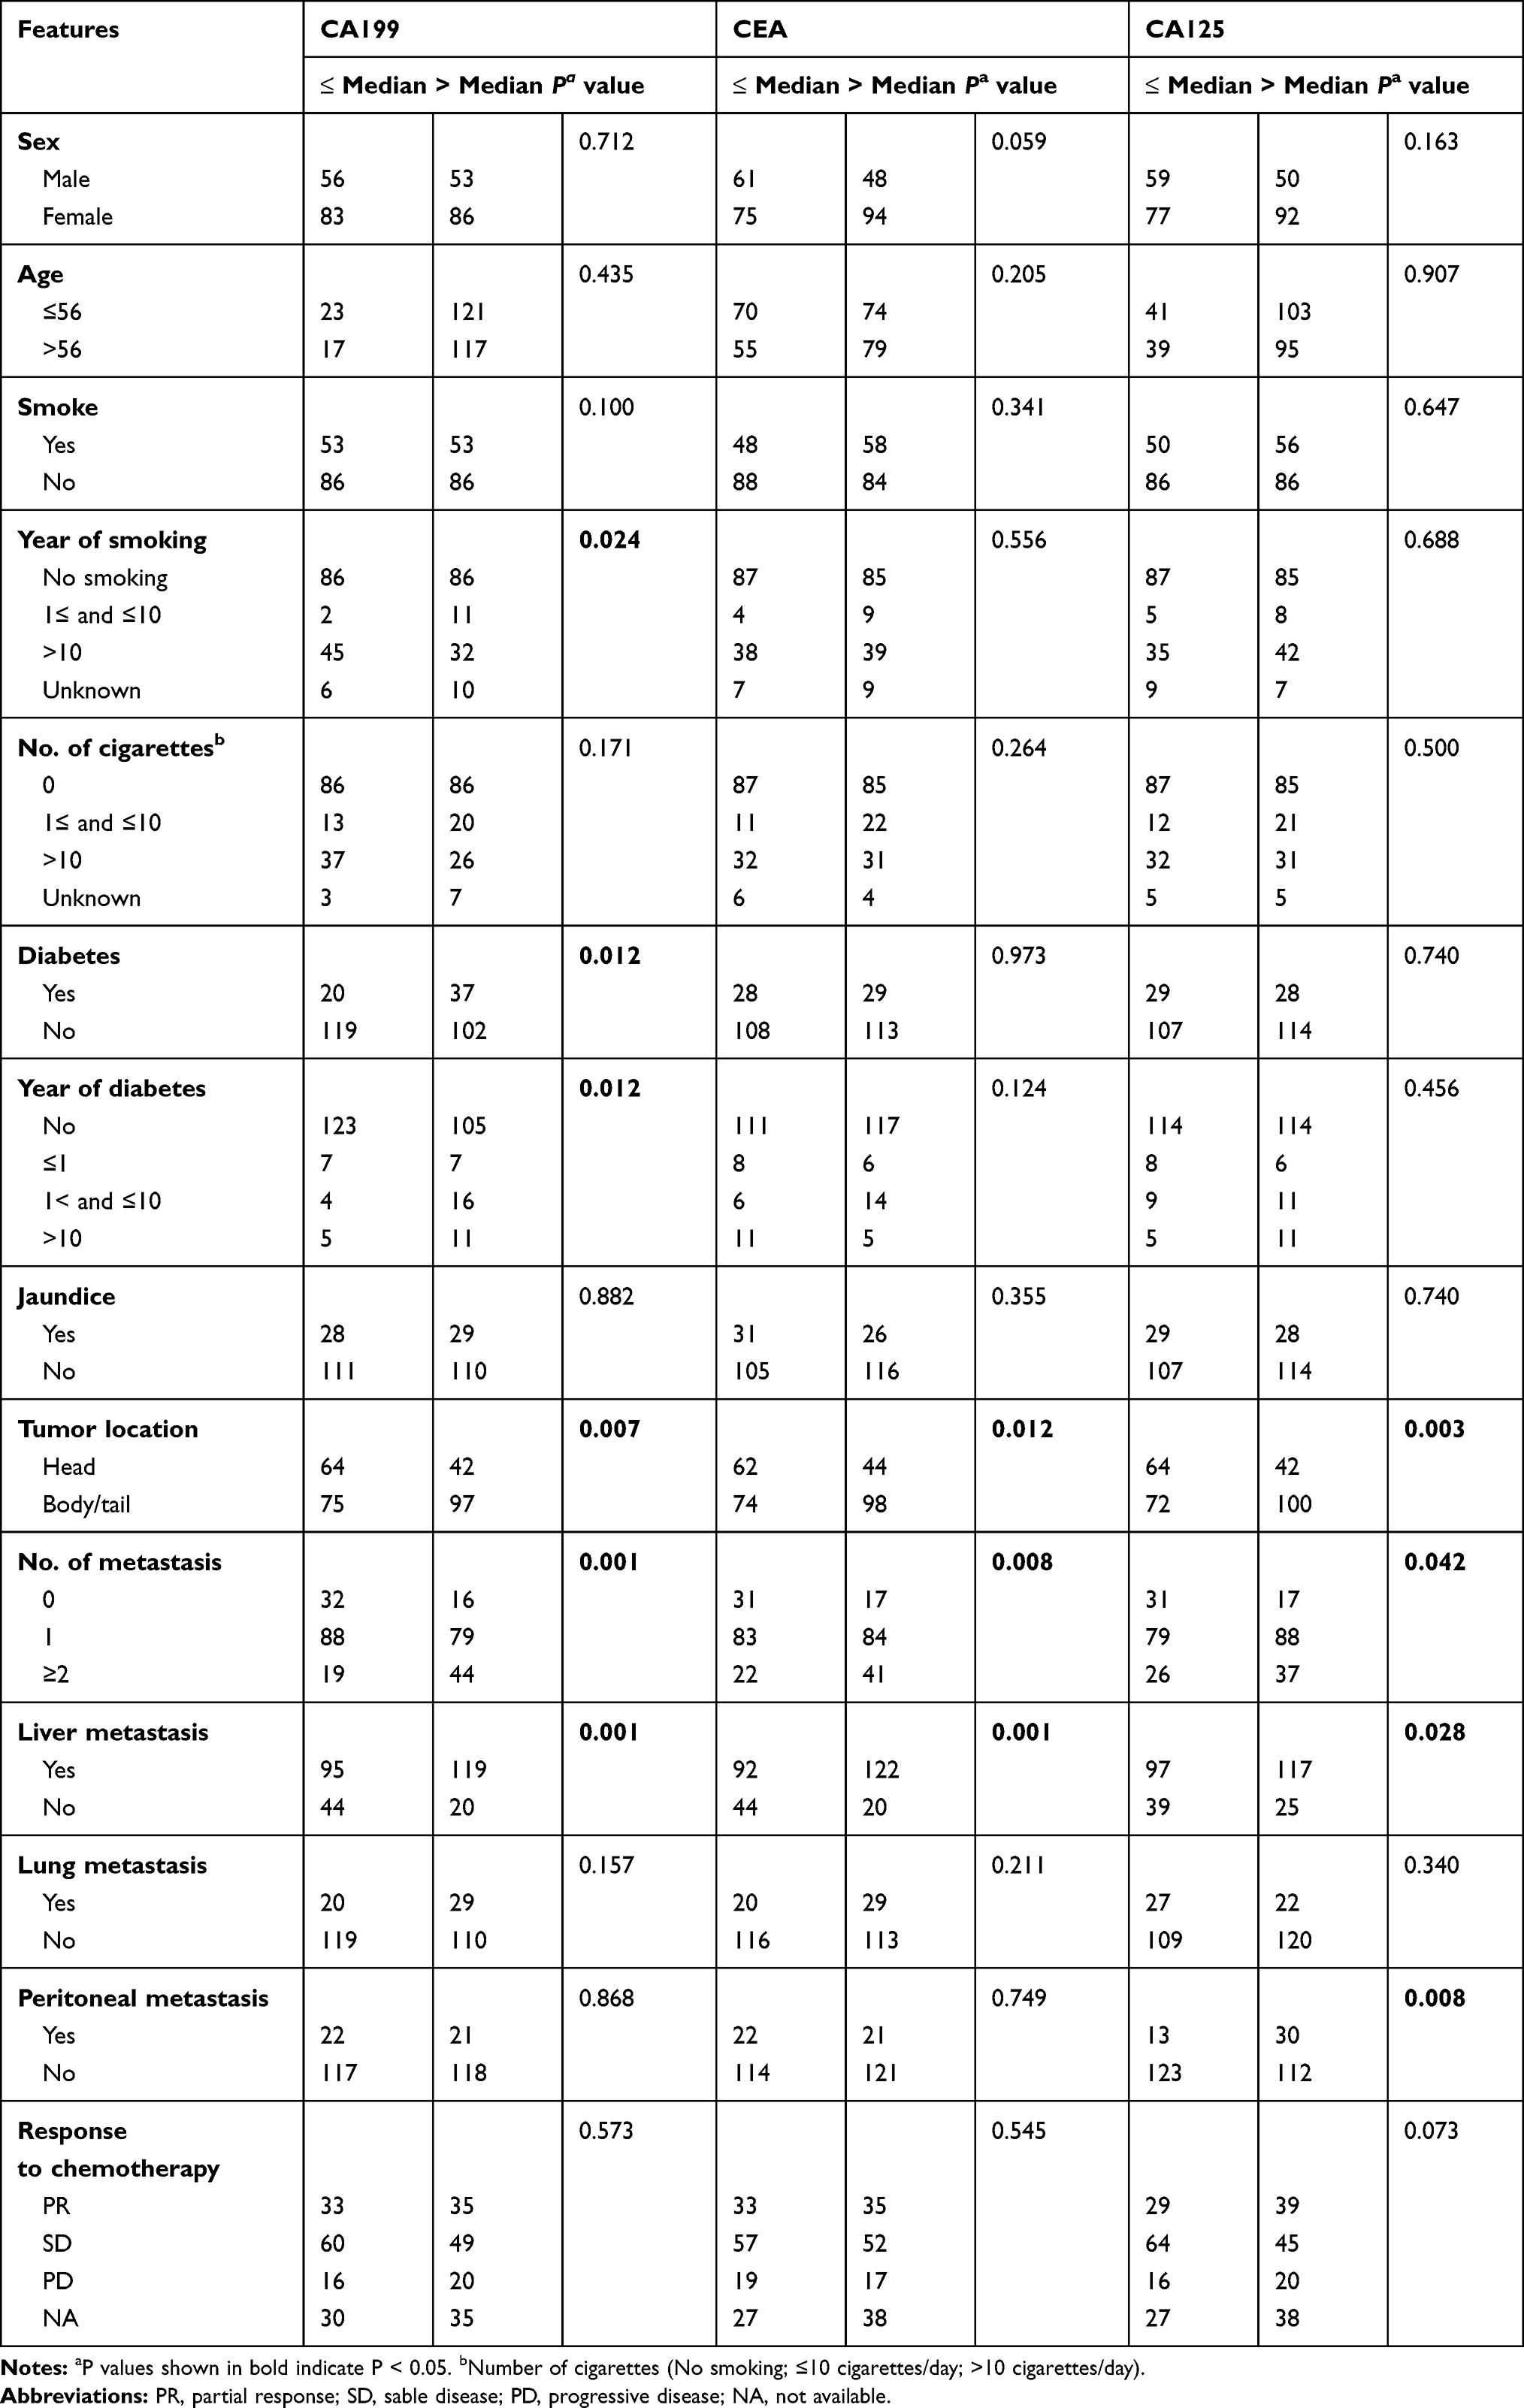 |
Table 1 Correlation Between Clinical Characteristic Factors and Tumor Markers |
Correlation Between Tumor Markers and Different Parameters
Pearson’s correlation analysis showed that the median WBC is associated with the median CA 19–9 (r = 0.296, p < 0.001), CEA (r = 0.249, p < 0.001) and CA 125 (r = 0.251, p < 0.001). The median LDH was also correlated with the CA 19–9 (r = 0.299, p < 0.001), CEA (r = 0.178, p = 0.004) and CA 125 (r = 0.239, p < 0.001). Furthermore, neutrophil levels were correlated with both CA 19–9 (r = 0.313, p < 0.001) and CA 125 (r = 0.223, p < 0.001). Additionally, CA 19–9 was associated with the glycemic level (r = 0.175, p = 0.004), CEA (r = 0.207, p = 0.001) and CA 125 (r = 0.402, p < 0.001) (Table 2, Figure 1).
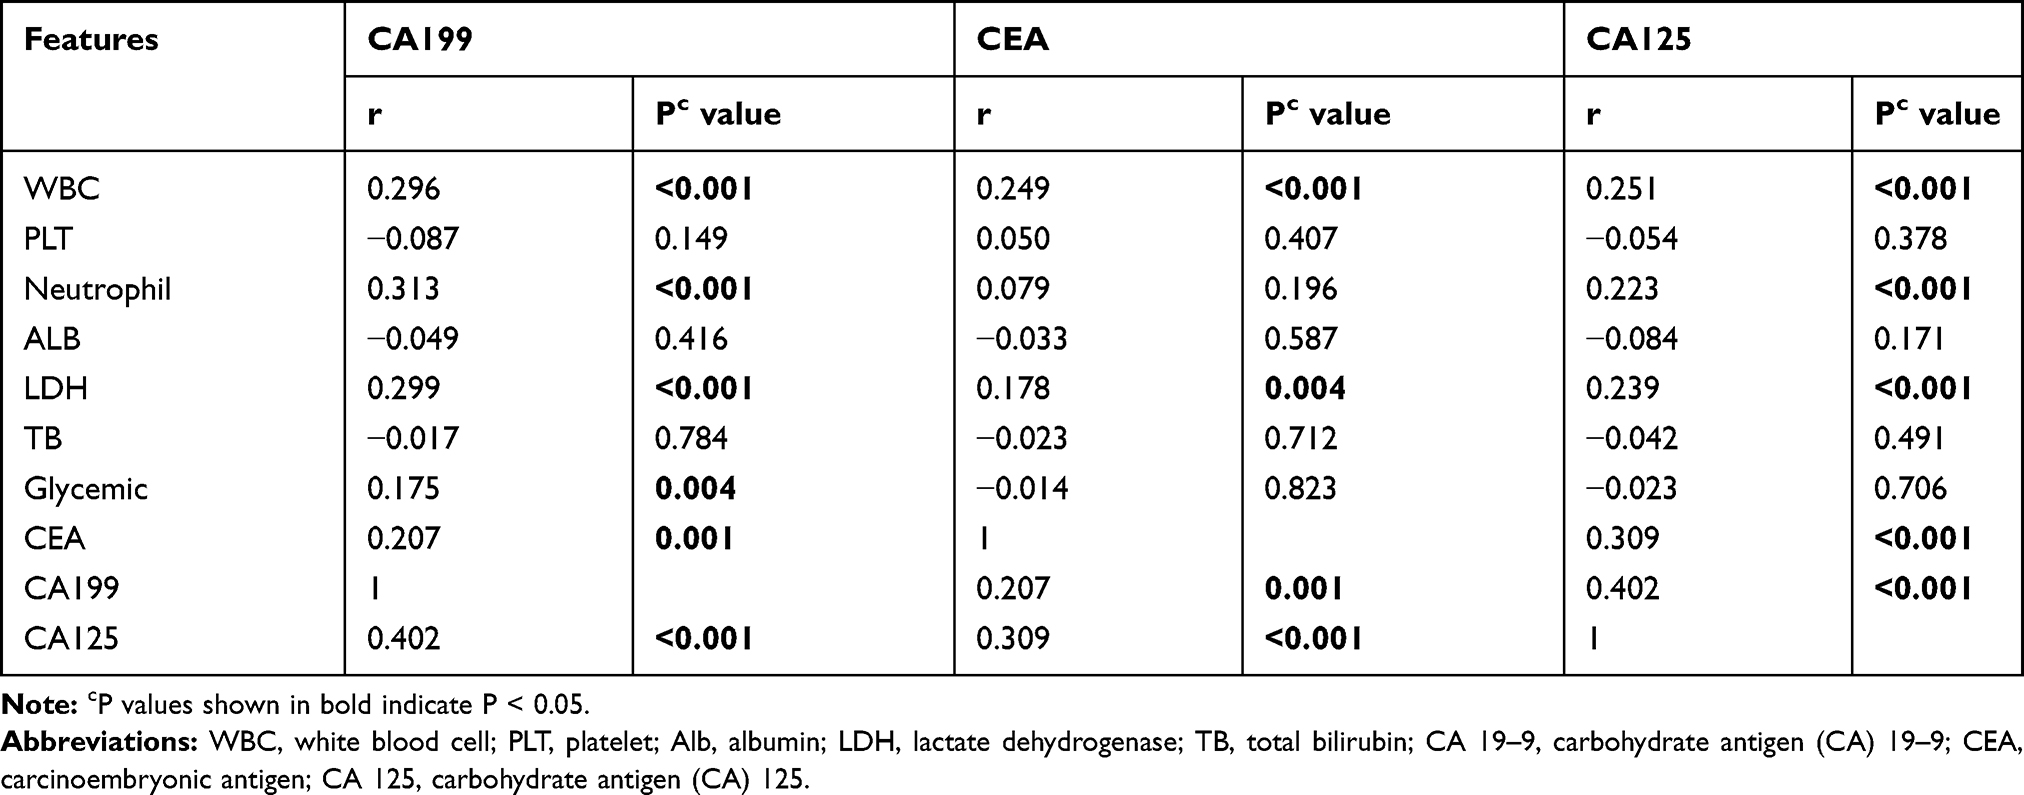 |
Table 2 Correlation Between Tumor Markers and Different Peripheral Blood Parameters |
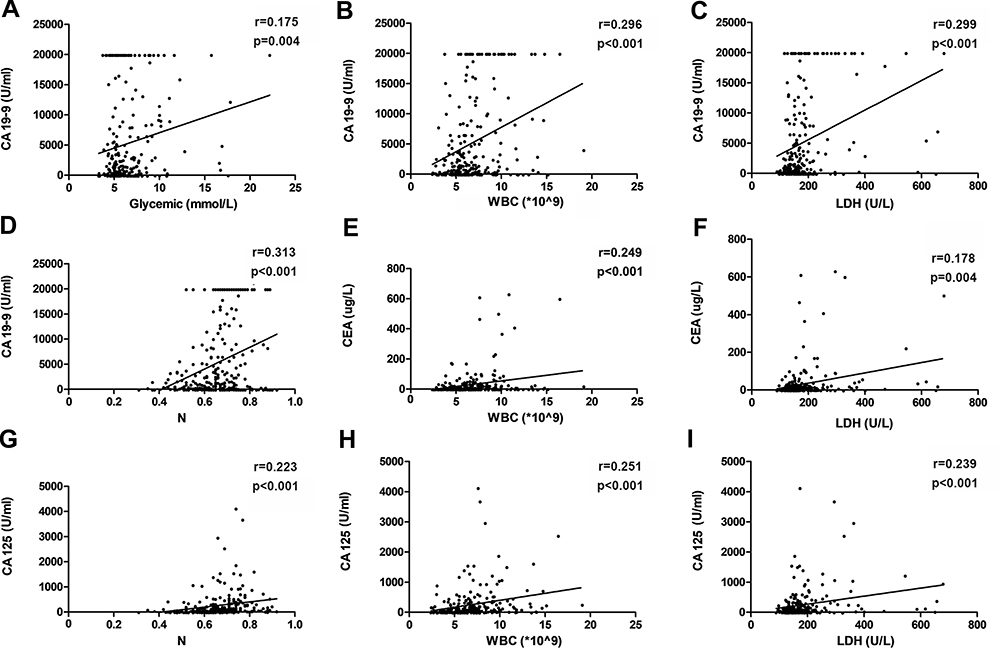 |
Figure 1 Correlations between the three tumor markers and different peripheral blood parameters in advanced pancreatic cancer. (A) Correlation between baseline CA 19–9 levels and baseline glycemic levels; (B) Correlation between baseline CA 19–9 levels and baseline WBC levels; (C) Correlation between baseline CA 19–9 levels and baseline LDH levels; (D) Correlation between baseline CA 19–9 levels and baseline N levels; (E) Correlation between baseline CEA levels and baseline WBC levels; (F) Correlation between baseline CEA levels and baseline LDH levels; (G) Correlation between baseline CA 125 levels and baseline N levels; (H) Correlation between baseline CA 125 levels and baseline WBC levels; (I) Correlation between baseline CA 125 levels and baseline LDH levels. |
Correlation Between Combined Markers and Clinical Characteristic Factors
The three tumor markers (CA 19–9, CEA and CA 125) were then combined and correlations with clinical factors were examined. If any marker level was higher than its median, that individual was deemed positive. Alternatively, if all three marker levels (CA 19–9, CEA, CA 125) were below their median levels, that individual was deemed negative. The only clinical factors that were found to correlate with a positive assignment included tumor location, number of metastases, and liver metastasis (p = 0.001; Table 3).
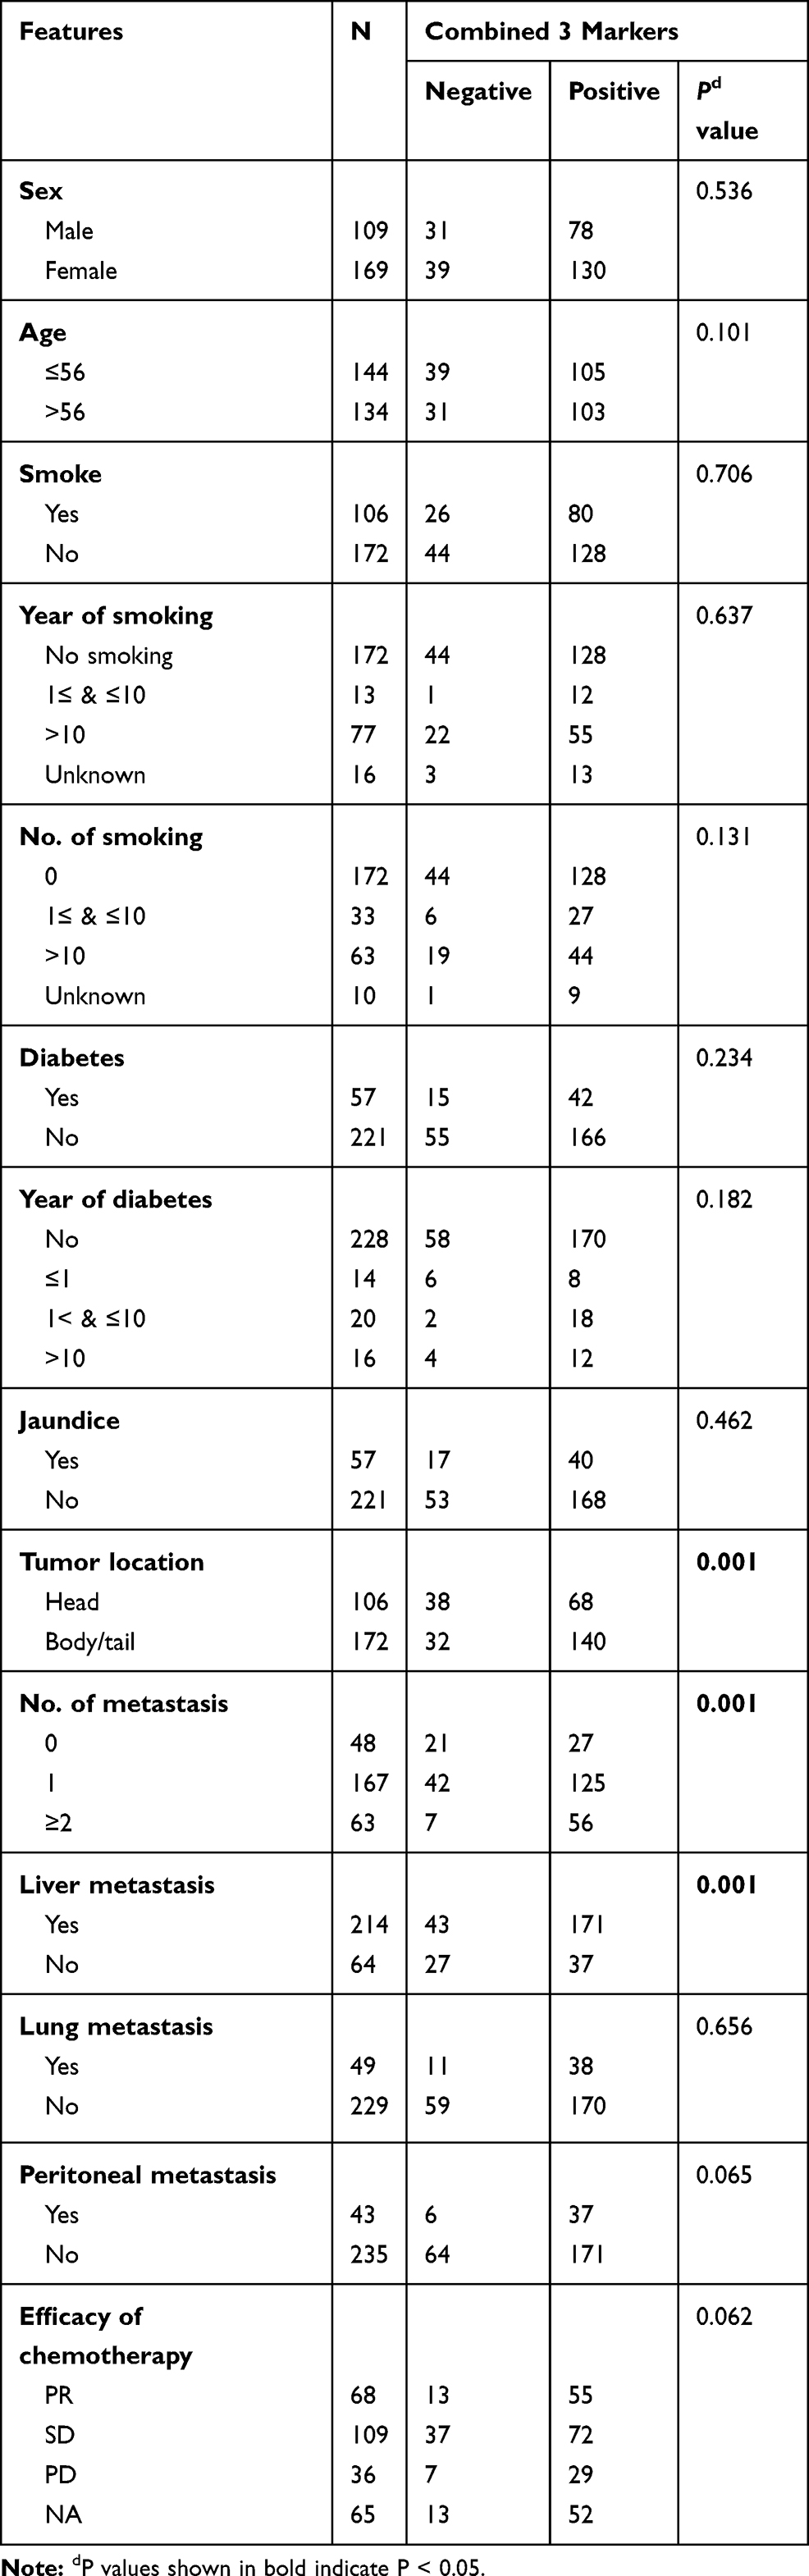 |
Table 3 Correlation Between Clinicopathologic Factors and Combined Tumor Markers |
Univariate and Multivariate Analysis of Prognostic Factors
A Cox proportional hazards regression model was used to identify the prognostic values of the tumor markers and clinical characteristics. In the univariate analysis, the significant prognostic factors included sex (p = 0.001); smoking (p = 0.020); years of smoking (p = 0.004); number of cigarettes (per day) (p = 0.030); WBC (p = 0.022); neutrophil (p < 0.001); LDH (p = 0.004); CA 19–9 (p < 0.001); CEA (p = 0.003); CA 125 (p < 0.001); and combined markers (p = 0.009; Table 4, Figures 2 and 3).
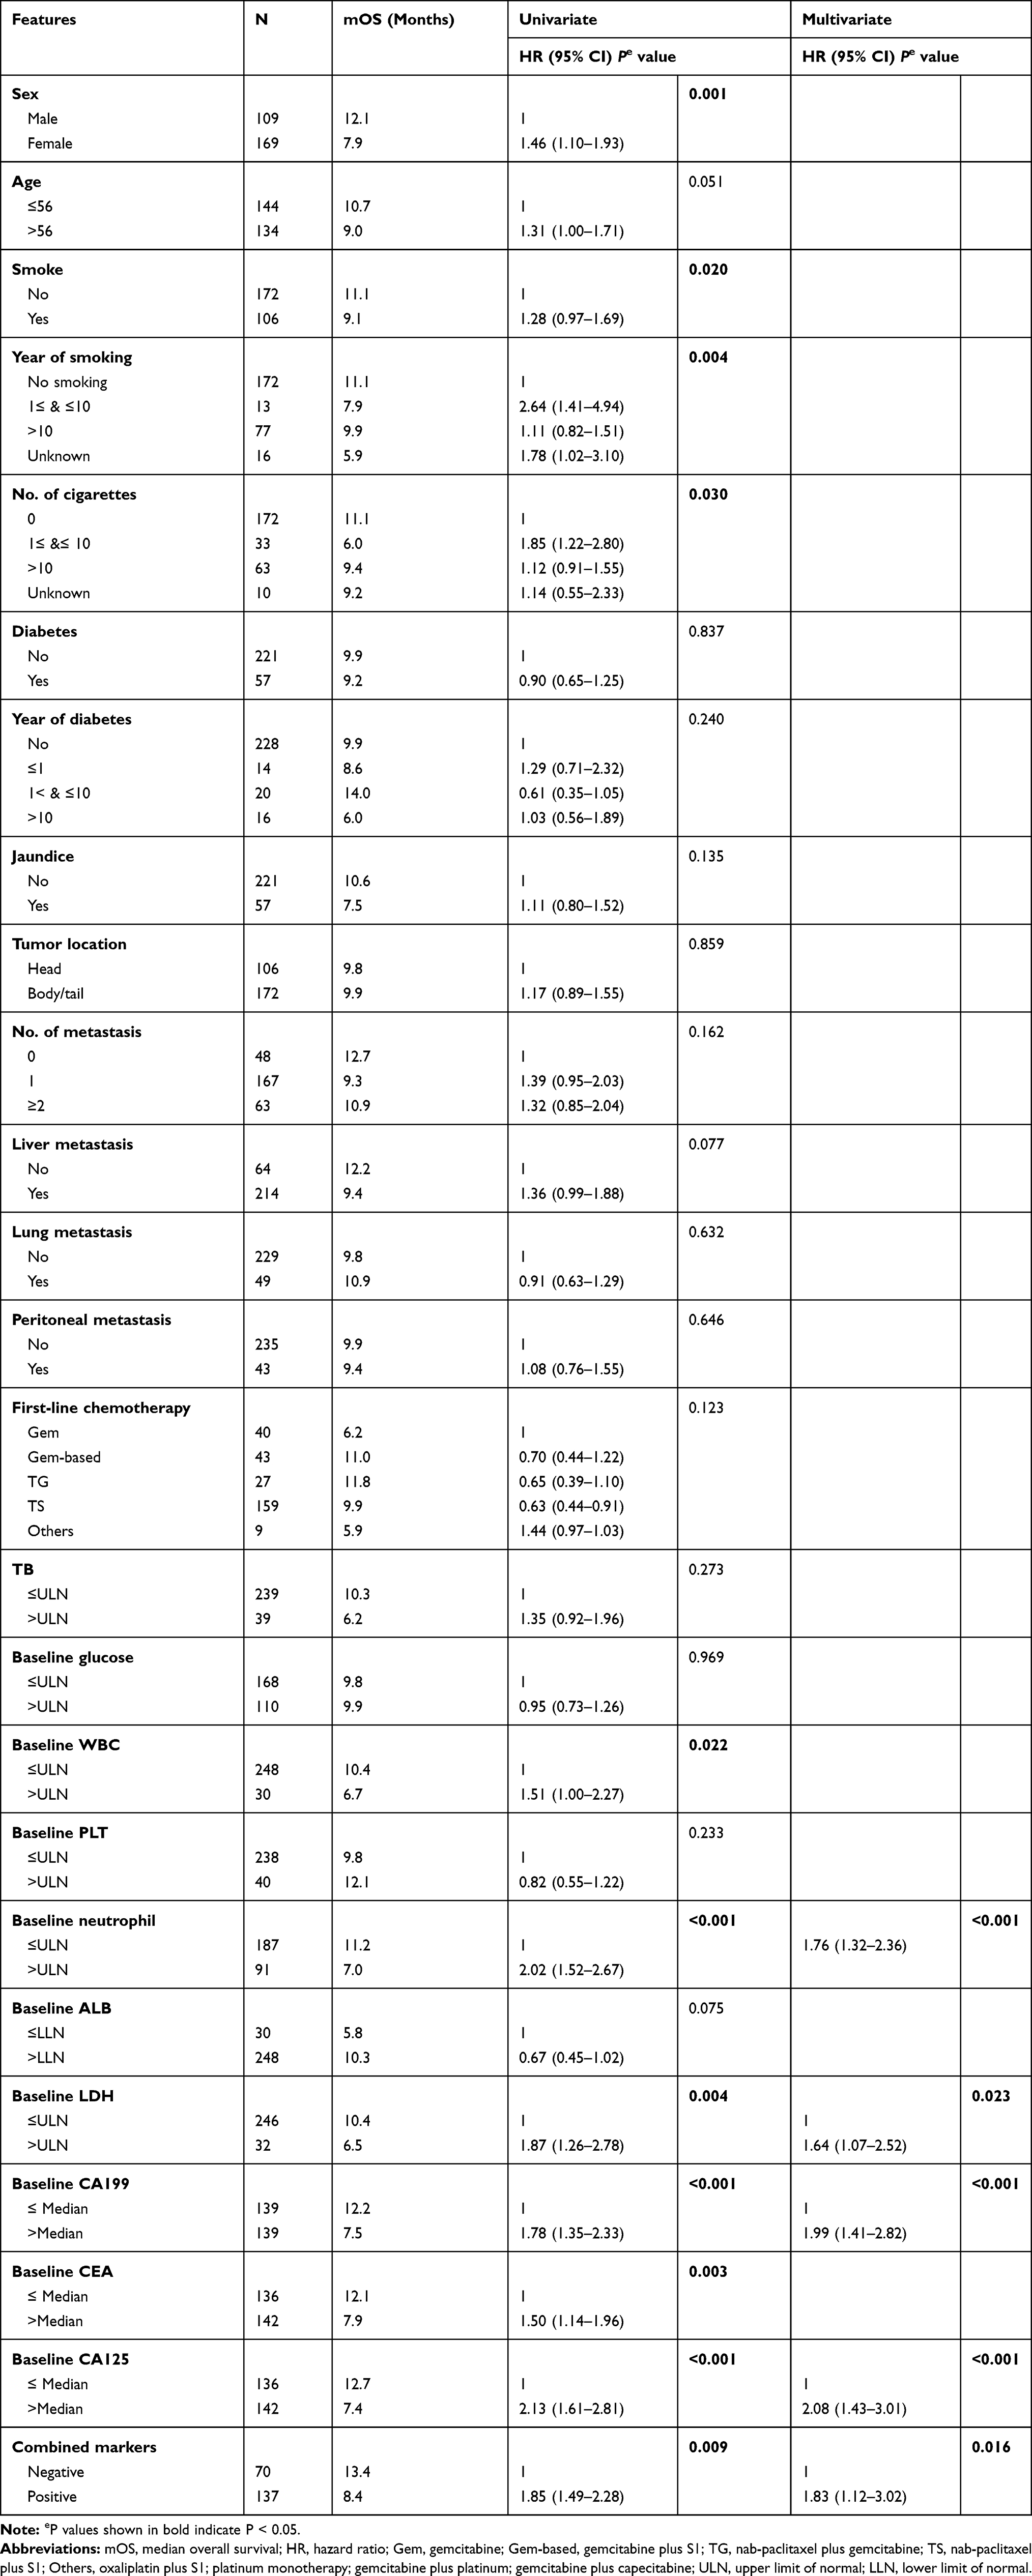 |
Table 4 Univariate and Multivariate Analysis of Prognostic Factors |
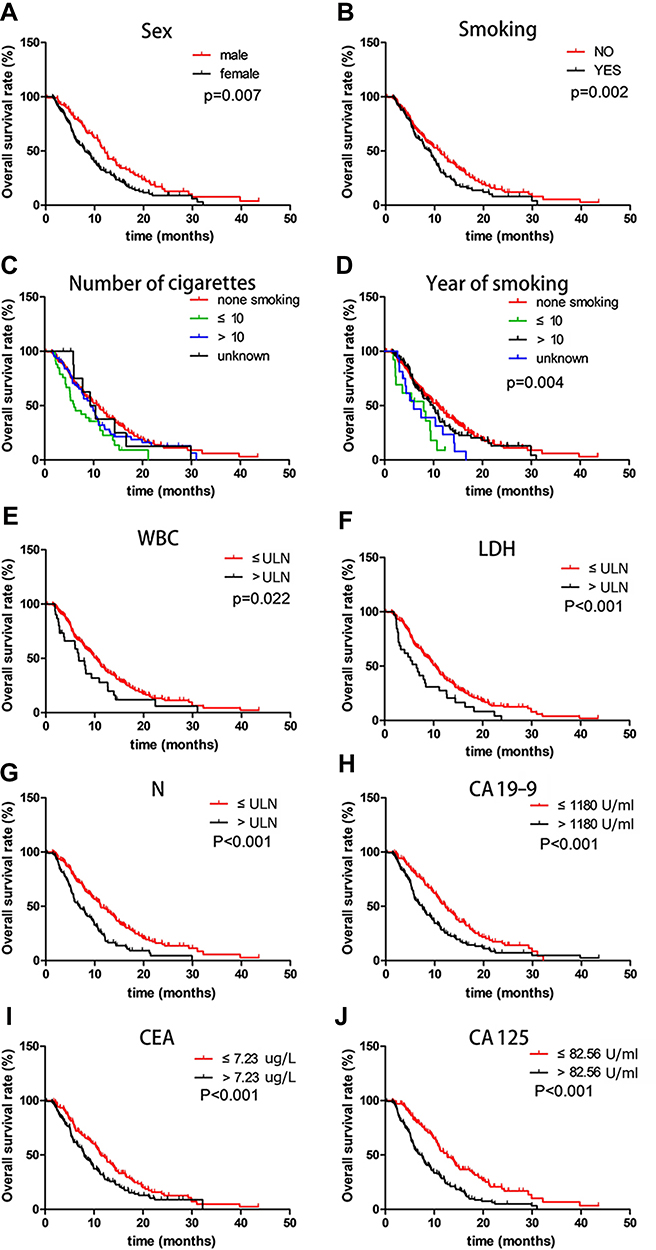 |
Figure 2 Kaplan–Meier overall survival curves examining different clinical characteristics and the three tumor biomarkers. Overall survival curves for (A) sex; (B) smoking; (C) number of cigarettes; (D) years of smoking; (E) baseline WBC levels; (F) baseline LDH levels; (G) baseline neutrophil counts levels; and baseline median serum (H) CA 19–9; (I) CEA; and (J) CA 125 levels. |
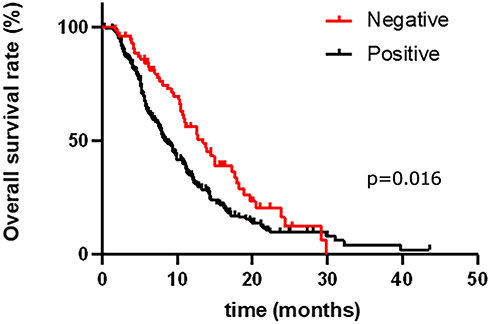 |
Figure 3 Kaplan–Meier overall survival curves for the 278 patients with advanced pancreatic cancer when combining the baseline CA 19–9, CEA and CA 125 levels. |
Multivariate analysis showed that the neutrophil counts [hazard ratio (HR) = 1.76; 95% CI: 1.32–2.36, p < 0.001]; LDH (HR = 1.64; 95% CI: 1.07–2.52, p = 0.023); CA 19–9 (HR = 1.99; 95% CI: 1.41–2.82, p < 0.001); CA 125 (HR = 2.08; 95% CI: 1.43–3.01, p < 0.001); and combined markers (HR = 1.83; 95% CI: 1.12–3.02, p = 0.016) were all identified as independent prognostic factors (Table 4).
Elevated Serum Neutrophil, LDH, CA 19-9 and CA 125 Levels are Associated with a Poor Prognosis
Multivariate analysis showed that neutrophil, LDH, CA 19–9 and CA 125 levels can serve as independent PC prognostic factors. Therefore, these four markers were further examined to determine their collective prognostic value. One elevation of neutrophil, LDH, CA 19–9 and CA 125 levels was assigned a score of 1. Finally, patients were divided into groups based on their assigned scores from 0–4.
The survival analysis showed that a higher patient score is associated with a statistically shorter OS (p < 0.001; Figure 4). The longest median OS (14.0 months) was associated with the 1 score group, followed by 13.7 months (score of 0), 9.2 months (score of 2), 5.7 months (score of 3) and 3.2 months (score of 4). Furthermore, these results showed that elevated serum neutrophil, LDH, CA 19–9 and CA 125 levels were associated with a poor prognosis. The predictive performance of the three tumor markers (CA 19–9, CEA and CA 125) and four prognostic factors (neutrophil, LDH, CA 19–9 and CA 125) were evaluated by ROC (Receiver Operating Characteristic) curves (Supplementary Figure 1). Furthermore, the prognosis between patients in the 0 group in Figure 4 and patients in the negative group in Figure 3 showed no difference (P > 0.05; Supplementary Figure 2).
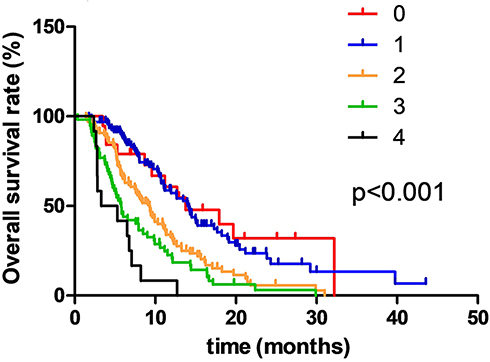 |
Figure 4 Kaplan–Meier overall survival curves for 278 patients with advanced pancreatic cancer stratified by different assigned scores when combining baseline serum neutrophil, LDH, CA 19–9, and CA 125 levels. |
Discussion
When conducting clinical diagnoses or prognoses, peripheral blood parameters or tumor biomarkers are commonly used. In colorectal cancer and gallbladder cancer, several tumor markers have been shown to be associated with various clinical characteristics.13–15 However, few correlation analyses have explored potential relationships between tumor markers and different peripheral blood parameters, especially in association with PC. In many cases, combining these indicators can provide a useful indicator. Therefore, in this retrospective study, potential correlations between three of the most commonly used PC tumor markers and clinical factors were examined. The relation between the tumor markers and different peripheral blood parameters was also investigated. Performing a correlation analysis between tumor markers and clinical factors and different peripheral blood parameters can aid in elucidating the influences of tumor marker levels and aid in determining the predictive value of tumor markers. Finally, survival analysis was performed with a Cox proportional hazards regression model.
CA 19–9, CEA, and CA 125 both individually and collectively were all associated with the primary tumor site, number of organ metastases, and liver metastasis. Additionally, CA125 was correlated with peritoneal metastasis. CA 19–9 is a cell surface glycoprotein that functions in cellular adhesion and can participate in tumor metastasis, with higher levels seen in invasive tumors.7 CEA, which is also a surface glycoprotein with cell adhesion properties, is used to conduct PC prognostic monitoring.16 In one study, CA 125 levels were shown to reflect the metastasis-associated burden in advanced PC patients.17 In gastric cancer, serum CA 125 levels were shown to predict peritoneal metastasis.18 Furthermore, CA 125 is mainly distributed in mesothelial cells within the pleura, peritoneum and pericardium, which may explain why peritoneal dissemination affects serum CA 125 levels.19 Therefore, the findings of the current study are consistent with the previous findings regarding these markers.
In this study, CA 19–9 was individually associated with the number of years of smoking. In a previous study examining the relationships between serum CA 19–9 levels and smoking, alcohol consumption, and BMI, smoking was shown to effect serum CA 19–9 levels, while having no significant association with alcohol consumption or BMI.20 Furthermore, other studies have shown that smoking can alter gene expressions and subsequently affect biomarker expression.21,22 These findings collectively suggest that smoking habits can alter CA 19–9 levels.
This study also found that CA 19–9 is associated with diabetes and glycemic levels. In one study comparing diabetes patients with subjects without diabetes, CA 19–9 levels were higher in patients with diabetes and impaired glycemic regulation relative to subjects with no history of diabetes.23 Furthermore, another study demonstrated that CA 19–9 levels are influenced by glycemic levels.24 However, how CA 19–9 levels effect PC patients with diabetes is unclear. The mechanism could be that pancreatic insulin secretion is dysfunctional in patients with diabetes and that this cellular dysfunction may increase CA 19–9 levels.25 It is also possible that PC induces pancreatic endocrine and exocrine disorders and damages pancreatic cells. Taken together, our present and previous findings agree that CA 19–9 is associated with diabetes.
When examining the three tumor markers (CA 19–9, CEA, CA 125) in association with different peripheral blood parameters, all the biomarkers were significantly associated with WBC, and CA 19–9 and CA 125 were associated with neutrophil levels. Inflammatory cells play an important role in the processes of tumor initiation, proliferation and metastasis.26 Moreover, other studies have suggested that these inflammatory cells can be correlated with tumor metastasis.27 However, few studies have examined potential correlations between peripheral blood counts and tumor biomarkers. In one study, CEA was found to have no relationship with WBCs in patients with advanced rectal cancer,28 which is the opposite of what was found herein. While the mechanism behind the relation between inflammatory cells and tumor markers is unknown, it is possible that inflammatory cells change the tumor microenvironment and contribute to tumor proliferation and migration, thereby affecting tumor marker levels.
LDH is a pivotal enzyme that participates in the process of converting pyruvate to lactate in anaerobic conversion.29 Additionally, LDH is overexpressed in hypoxic tumor tissues and in metastatic cancer tissues;30 its levels have been associated with tumor invasion and metastasis.12 In the current study, LDH levels were correlated with CA 19–9, CEA, and CA 125. In a previous study, LDH median levels were associated with systemic inflammation markers, but negatively correlated with CA 19–9 levels.31 Very little is known regarding this association and thus further examination with a larger study set is required.
All the clinical characteristics and markers were evaluated using univariate and multivariate analyses. The univariate analysis showed that sex and smoking habits were significantly associated with PC patient prognosis, which is consistent with previous findings.31,32 Furthermore, serum baseline WBC, neutrophil, LDH, CA 19–9, CEA and CA 125 levels were correlated with PC prognosis, which is also consistent with previous findings.12,28,33 However, when examining the OS, tumor location, number of organ metastases, and liver and lung metastasis had no effect. The multivariate analysis suggested that the only clinical factor that influences prognosis is years of smoking. Furthermore, baseline neutrophil levels, LDH, CA 19–9 and CA 125 levels were identified as independent factors for OS. Any single factor for predicting PC survival was found to not be precise. Thus, to improve the prognostic accuracy, four different factors (neutrophil, LDH, CA 19–9 and CA 125) representing tumor metabolism, systemic inflammation and tumor markers were examined. For these four factors, every indicator increased by 1 point, and the results showed that a higher score is associated with a worse survival time.
There are some limitations in this study. First, a retrospective analysis may contain selection bias. Also, the sample set that was used was small and from a single center; thus, some of the results need to be confirmed using a larger sample set from multiple centers. Finally, some of the patients’ histories, specifically smoking history, were incomplete. Future work will focus on performing a multi-center study to validate the results of this correlation analysis.
Conclusion
Our research confirmed that when considered individually or combined, baseline CA 19–9, CEA, and CA 125 are associated with primary tumor site, number of organ metastases and liver metastasis. Furthermore, serum WBC and LDH levels were correlated with CA 19–9, CEA, and CA 125 levels. Moreover, CA 19–9 was correlated with years of smoking, diabetes, and glycemic levels, while CA 19–9 and CA 125 were correlated with neutrophil counts. Overall, sex, years of smoking, number of cigarettes, baseline neutrophil levels, LDH, CA 19–9, CEA, CA 125, and combined markers were identified as independent prognostic factors. However, no one independent factor was found to precisely indicate survival; therefore, neutrophil, LDH, CA 19–9 and CA 125 were examined and shown to accurately correlate with survival.
Ethics Approval and Consent to Participate
Our study was approved by the ethics committee of PLA General Hospital. The ethical approval number is S2014-031-01. All treatments were performed in accordance with institutional guidelines and regulations. Clinical data retrieved electronically from the medical records of PLA General Hospital Registry. Our study obtained informed consent from the study participants, in accordance with the Declaration of Helsinki.
Disclosure
The authors report no conflicts of interest in this work.
References
1. Siegel RL, Miller KD, Jemal A. Cancer statistics, 2015. CA Cancer J Clin. 2015;65:5–29.
2. Siegel RL, Miller KD, Jemal A. Cancer statistics, 2019. CA Cancer J Clin. 2019;69(1):7–34. doi:10.3322/caac.21551
3. Chen WQ, Zheng RS, Peter DB, et al. Cancer statistics in China, 2015. CA Cancer J Clin. 2016;66(2):115–132. doi:10.3322/caac.21338
4. Luo G, Guo M, Jin K, et al. Optimize CA19-9 in detecting pancreatic cancer by Lewis and Secretor genotyping. Pancreatology. 2016;16(6):1057–1062. doi:10.1016/j.pan.2016.09.013
5. Viviane HBG, Philipp G, Daniel D, et al. CA19-9 tumour-marker response to chemotherapy in patients with advanced pancreatic cancer enrolled in a randomised controlled trial. Lancet Oncol. 2008;9(2):132–138. doi:10.1016/S1470-2045(08)70001-9
6. NCCN. Guidelines version 1.2019 pancreatic adenocarcinoma. Available from: https://wwwnccnorg/professionals/physician_gls/pdf/pancreatic.
7. Swords DS, Firpo MA, Scaife CL, Mulvihill SJ. Biomarkers in pancreatic adenocarcinoma: current perspectives. Onco Targets Ther. 2016;9:7459–7467. doi:10.2147/OTT.S100510
8. Luo G, Xiao Z, Long J, et al. CA125 is superior to CA19-9 in predicting the resectability of pancreatic cancer. J Gastrointest Surg. 2013;17(12):2092–2098. doi:10.1007/s11605-013-2389-9
9. Liu L, Xu H, Wang W, et al. A preoperative serum signature of CEA+/CA125+/CA19-9 ≥ 1000 U/mL indicates poor outcome to pancreatectomy for pancreatic cancer. Int J Cancer. 2015;136(9):2216–2227. doi:10.1002/ijc.29242
10. Michael HRP, Laubender PS, Stefan H, Christiane J. Prognostic relevance of CA 19-9, CEA, CRP, and LDH kinetics in patients treated with palliative second-line therapy for advanced pancreatic cancer. Tumor Biol. 2010;31(4):351–357. doi:10.1007/s13277-010-0044-6
11. Chen Y, Wang YR, Deng GC, Dai GH. CA19-9 decrease and survival according to platelet level in patients with advanced pancreatic cancer. BMC Cancer. 2019;19(1):860. doi:10.1186/s12885-019-6078-2
12. Wang Y, Xiao X, Wang T, et al. A survival model in locally advanced and metastatic pancreatic ductal adenocarcinoma. J Cancer. 2018;9(7):1301–1307. doi:10.7150/jca.23984
13. Zhou W, Yang F, Peng J, et al. High pretreatment serum CA19-9 level predicts a poor prognosis for patients with stage III colon cancer after curative resection and adjuvant chemotherapy. J Cancer. 2019;10(16):3810–3818. doi:10.7150/jca.31375
14. Song J, Huang X, Chen Z, et al. Predictive value of carcinoembryonic antigen and carbohydrate antigen 19-9 related to downstaging to stage 0-I after neoadjuvant chemoradiotherapy in locally advanced rectal cancer. Cancer Manag Res. 2018;10:3101–3108. doi:10.2147/CMAR.S166417
15. Xu WY, Zhang HH, Yang XB, et al. Prognostic significance of combined preoperative fibrinogen and CA199 in gallbladder cancer patients. World J Gastroenterol. 2018;24(13):1451–1463. doi:10.3748/wjg.v24.i13.1451
16. Hammarstrom S. The carcinoembryonic antigen CEA family: structures, suggested functions and expression in normal and malignant tissues. Cancer Biol. 1999;9(2):67–81. doi:10.1006/scbi.1998.0119
17. Liu LXH, Wang WQ, Wu CT, Xiang JF, Liu C, Long J. CA125 is a novel predictive marker for pancreatic cancer metastasis and correlates with the metastasis-associated burden. Oncotarget. 2016;7.
18. Fujimura TKS, Ninomiya L, Kitagawa H, et al. Diagnostic laparoscopy, serum CA125, and peritoneal metastasis in gastric cancer. Endoscopy. 2002;34(7):569–574. doi:10.1055/s-2002-33228
19. Nakata BHY, Chung K, Kato Y. Serum CA 125 level as a predictor of peritoneal dissemination in patients with gastric carcinoma. Cancer. 1998;83(12):2488–2492. doi:10.1002/(SICI)1097-0142(19981215)83:12<2488::AID-CNCR12>3.0.CO;2-1
20. Kawai S, Suzuki K, Nishio K, et al. Smoking and serum CA19-9 levels according to Lewis and secretor genotypes. Int J Cancer. 2008;123(12):2880–2884. doi:10.1002/ijc.23907
21. Philibert RA, Ryu GY, Yoon JG, et al. Transcriptional profiling of subjects from the iowa adoption studies. Am J Med Genet B Neuropsychiatr Genet. 2007;144B(5):683–690. doi:10.1002/ajmg.b.30512
22. van Leeuwen DM, Gottschalk RW, van Herwijnen MH, Moonen EJ, Kleinjans JC, van Delft JH. Differential gene expression in human peripheral blood mononuclear cells induced by cigarette smoke and its constituents. Toxicol Sci. 2005;86:200–210.
23. Huang Y, Xu Y, Bi Y, et al. Relationship between CA 19-9 levels and glucose regulation in a middle-aged and elderly Chinese population. J Diabetes. 2012;4(2):147–152. doi:10.1111/j.1753-0407.2011.00179.x
24. Kim SH, Baek CO, Lee KA, Park TS, Baek HS, Jin HY. Clinical implication of elevated CA 19-9 level and the relationship with glucose control state in patients with type 2 diabetes. Endocrine. 2014;46(2):249–255. doi:10.1007/s12020-013-0058-0
25. Yu H, Li R, Zhang L, Chen H, Bao Y, Jia W. Serum CA19-9 level associated with metabolic control and pancreatic beta cell function in diabetic patients. Exp Diabetes Res. 2012;2012:745189. doi:10.1155/2012/745189
26. Ocana A, Nieto-Jimenez C, Pandiella A, Templeton AJ. Neutrophils in cancer: prognostic role and therapeutic strategies. Mol Cancer. 2017;16(1):137. doi:10.1186/s12943-017-0707-7
27. Zhou B, Deng J, Chen L, Zheng S. Preoperative neutrophil-to-lymphocyte ratio and tumor-related factors to predict lymph node metastasis in nonfunctioning pancreatic neuroendocrine tumors. Sci Rep. 2017;7(1):17506. doi:10.1038/s41598-017-17885-y
28. Lee JH, Jeong JU, Kim SH, et al. Nadir/pre-chemoradiotherapy ratio of white blood-cell count can predict tumor response and recurrence-free survival in locally advanced rectal cancer: a multi-institutional analysis. Int J Colorectal Dis. 2018;34(1):105–112. doi:10.1007/s00384-018-3174-8
29. Markert CL. Lactate dehydrogenase isozymes dissociation and recombination of subunits. Science. 1963;140(3573):1329–1330. doi:10.1126/science.140.3573.1329
30. Maftouh M, Avan A, Sciarrillo R, et al. Synergistic interaction of novel lactate dehydrogenase inhibitors with gemcitabine against pancreatic cancer cells in hypoxia. Br J Cancer. 2014;110(1):172–182. doi:10.1038/bjc.2013.681
31. Yu SLXL, Qi Q, Geng YW, et al. Serum lactate dehydrogenase predicts prognosis and correlates with systemic inflammatory response in patients with advanced pancreatic cancer after gemcitabine-based chemotherapy. Sci Rep. 2017;7(1):45194. doi:10.1038/srep45194
32. Chen Y, Ana Babic VM-O, Clish CB, et al. Cigarette smoking and pancreatic cancer survival. J Clin Oncol. 2017;35.
33. Piotr HAS, Adam D, Anna K, et al. Panel of CA19-9, Ca125, and Ca15-3 as the enhanced test for the differential diagnosis of the pancreatic lesion. Dis Markers. 2017.
 © 2020 The Author(s). This work is published and licensed by Dove Medical Press Limited. The
full terms of this license are available at https://www.dovepress.com/terms
and incorporate the Creative Commons Attribution
- Non Commercial (unported, 3.0) License.
By accessing the work you hereby accept the Terms. Non-commercial uses of the work are permitted
without any further permission from Dove Medical Press Limited, provided the work is properly
attributed. For permission for commercial use of this work, please see paragraphs 4.2 and 5 of our Terms.
© 2020 The Author(s). This work is published and licensed by Dove Medical Press Limited. The
full terms of this license are available at https://www.dovepress.com/terms
and incorporate the Creative Commons Attribution
- Non Commercial (unported, 3.0) License.
By accessing the work you hereby accept the Terms. Non-commercial uses of the work are permitted
without any further permission from Dove Medical Press Limited, provided the work is properly
attributed. For permission for commercial use of this work, please see paragraphs 4.2 and 5 of our Terms.