Back to Journals » Diabetes, Metabolic Syndrome and Obesity » Volume 16
Correlation Between Abdominal Fat Distribution and Serum Uric Acid in Patients Recently Diagnosed with Type 2 Diabetes
Authors Wang HP, Xu YY, Xu BL, Lu J, Xia J, Shen T, Fang J, Lei T
Received 12 July 2023
Accepted for publication 26 September 2023
Published 21 November 2023 Volume 2023:16 Pages 3751—3762
DOI https://doi.org/10.2147/DMSO.S430235
Checked for plagiarism Yes
Review by Single anonymous peer review
Peer reviewer comments 2
Editor who approved publication: Dr Konstantinos Tziomalos
Hong-Ping Wang,1,* Yuan-Ying Xu,1,* Bi-Lin Xu,1 Jun Lu,1 Juan Xia,1 Tian Shen,1 Ji Fang,1,2 Tao Lei1
1Department of Endocrinology, Putuo Hospital, Shanghai University of Traditonal Chinese Medicine, Shanghai, 200333, People’s Republic of China; 2Department of Nephrology, Putuo Hospital, Shanghai University of Traditonal Chinese Medicine, Shanghai, 200333, People’s Republic of China
*These authors contributed equally to this work
Correspondence: Tao Lei, Department of Endocrinology, Putuo Hospital, Shanghai University of Traditonal Chinese Medicine, No. 164 of Lanxi Road, Putuo District, Shanghai, 200333, People’s Republic of China, Tel +86 021-22233222-58142, Email [email protected] Ji Fang, Department of Nephrology, Putuo Hospital, Shanghai University of Traditonal Chinese Medicine, No. 164 of Lanxi Road, Putuo District, Shanghai, 200333, People’s Republic of China, Tel +86 021-22233222-58082, Email [email protected]
Objective: To investigated the link between the distribution of abdominal fat and the concentration of serum uric acid (SUA) in individuals recently diagnosed with type 2 diabetes.
Methods: Studied 364 individuals had been diagnosed with type 2 diabetes within one month, and evaluated factors such as the distribution of fat in the abdomen, indicators related to glucose and lipid metabolism. The participants’ SUA concentrations were divided into a normal control group (CG) and a hyperuricemia group (HG).
Results: The HG group had elevated abdominal subcutaneous fat area (SFA), visceral fat content (VFA), body mass index (BMI), fasting blood glucose (FBG), 2-hour postprandial blood glucose (PBG), glycosylated albumin (GA), serum creatinine (SCr), triacylglycerol (TG), and lower values in glomerular filtration rate (eGFR), high-density lipoprotein cholesterol (HDL-C) when compared to the CG group (P < 0.05). Among the obese individuals, the hyperuricemia subgroup exhibited higher measurements in waistline, hipline, VFA, SFA, BMI, PBG, SCr, TG, and lower HDL-C (P < 0.05) compared to the subgroup with normal uric acid levels. In the non-obese group, the hyperuricemia subgroup showed higher VFA, SCr, and FBG levels, and lower HDL-C (P < 0.05). There was a positive correlation between VFA and serum uric acid (SUA) levels (r = 0.329, P < 0.0001). Logistic regression analysis indicated a 24% increased risk of hyperuricemia with every 10cm2 increase in abdominal VFA. Generate the Receiver Operating Characteristic (ROC) curve analysis revealed that VFA was the most effective predictor of hyperuricemia and insulin resistance (P < 0.05).
Conclusion: Newly diagnosed type 2 diabetes patients exhibit a strong correlation between abdominal visceral fat and SUA concentration, the former is identified as an autonomous risk factor for hyperuricemia and an effective indicator for assessing the presence of hyperuricemia and predicting insulin resistance.
Keywords: abdominal fat distribution, newly diagnosed type 2 diabetes, serum uric acid, visceral fat area
Introduction
Newly diagnosed type 2 diabetes holds significant importance in terms of its prevention and treatment, given that it is a persistent metabolic condition that can lead to various complications in the advanced stages. Early intervention in type 2 diabetes has the potential to reduce the risk of complications and improve quality of life.
Research has confirmed the role of serum uric acid (SUA) as an inflammation and metabolic predictor in diabetes and related conditions, including diabetic nephropathy.1,2 In a prospective cohort study involving 2690 participants without prior diabetes or cardiovascular disease and with hyperuricemia, the findings demonstrated that over a median follow-up of 9.0 years, 548 participants developed type 2 diabetes, highlighting a connection between uric acid concentration and the incidence of type 2 diabetes.3 Moreover, not just uric acid itself but also uric acid-based metabolic indices have been associated with obesity and related conditions such as type 2 diabetes,4 hypertension,5 hepatic steatosis6 and metabolic syndrome.7 It is worth noting that the connection between obesity and recently diagnosed type 2 diabetes is strong, with an obesity rate of 80–92% in comparison to 56% in the control group.8,9 Excessive fat buildup in the abdominal region leads to abdominal obesity, which is a significant risk factor for diabetes. Previous research indicates that the size of subcutaneous fat area (SFA) and the amount of visceral fat content (VFA) play crucial roles in preventing diabetes.10 For these reasons, we are justified to study the correlation between uric acid and fat distribution in abdominal region.
Insulin resistance(IR) is widely recognized as being associated with both body fat distribution11 and the onset of type 2 diabetes. This relationship stems from the fact that adipose tissue releases an abundance of non-esterified fatty acids, glycerol, hormones, and pro-inflammatory cytokines.12 Interestingly, recent research suggests that SUA levels also relate to IR.13 Based on the available evidence, it becomes apparent that the pathogenesis of IR is shared by type 2 diabetes, abdominal obesity, and hyperuricemia. As a result, the concentration of SUA may impact the distribution of abdominal fat in individuals who have recently been diagnosed with type 2 diabetes.
This study aimed to explore the correlation between SUA concentration and abdominal fat content specifically in individuals with newly diagnosed type 2 diabetes. By doing so, our research establishes a theoretical foundation for assessing the risk of hyperuricemia in these patients through the distribution of abdominal fat. Furthermore, we utilized VFA as an estimation to evaluate the risk of hyperuricemia in individuals who have recently been diagnosed with type 2 diabetes. Additionally, we assess the accuracy and effectiveness of VFA as a predictive tool for IR based on the classification of uric acid levels. In summary, our research findings suggest that VFA can effectively serve as an indicator for assessing the presence of hyperuricemia and predicting the IR status in newly diagnosed type 2 diabetes patients.
Objects and Methods
Study Participant Selection Criteria: Inclusion and Exclusion Criteria
From January 2018 to June 2020, we chose individuals who were recently diagnosed with type 2 diabetes within one month from the outpatient clinic of Shanghai Putuo District Central Hospital. The study included a total of 364 patients, consisting of 199 males and 165 females, ranging in age from 20 to 67 years. Certain criteria were applied for exclusion, including: 1) Patients who have been prescribed insulin or insulin secretagogues in the last month. 2) individuals with mental illness, severe liver damage, or cachexia. 3) those experiencing high stress levels or severe infections. 4) individuals with symptoms of typical Cushing syndrome or abnormal thyroid function. 5) patients who had taken glucocorticoid drugs or anti-epileptic drugs within the three months prior to the study. 6) pregnant or lactating women; and 7) individuals unable to independently complete the questionnaire. Before participating in the research, the participants provided informed consent, and the study was approved by the Ethics Committee of Shanghai Putuo District Central Hospital.
Research Methods
- We collected the basic details of registered patients, such as their gender, age, height, waistline, hipline, and more. Additionally, we computed the body mass index (BMI) using the following formula: BMI = weight (kg)/height 2 (m2). The height was recorded with a precision of 0.5 cm, while the weight was recorded with a precision of 0.1 kg. Homeostatic Model Assessment of Insulin Resistance (HOMA-IR) using the following formula: fasting blood glucose (FBG) * fasting insulin (Fins)/22.5. The formula for calculating the Waist-Hip Ratio (WHR) is as follows: WHR = Waist Circumference (cm) / Hip Circumference (cm).
- Abdominal fat content measurement: To assess abdominal fat, we utilized the Omron HDS-2000 DUALSCAN tool. This device is a biomedical impedance device used for measuring VFA and SFA in the body. Its operating principle is based on the variation in electrical resistance as current flows through different body tissues. The device performs measurements by utilizing two distinct electrical pathways, each dedicated to measuring the adipose area in the abdomen: one pathway measures the area devoid of fat, while the other measures the SFA. The process involves an abdominal measurement unit that assesses the shape and overall cross-sectional area of the abdomen. By employing specific calculation formulas, an estimated value for VFA can be derived. Prior to measurement, we ensured that the participants fasted for a minimum of 8 hours and had evacuated their bowels and bladder. The measurements were taken in a calm and warm setting while the participants were lying on their backs. Trained professionals carried out the measurements for VFA and SFA.
- Participants were required to fast for a minimum of 8 hours before blood samples were collected. These blood samples were then transferred to the biochemistry laboratory of our hospital to assess various indicators including FBG, blood glucose levels 2 hours after eating (PBG), glycosylated albumin (GA), glycosylated hemoglobin (HbA1C), Fins, fasting C peptide (F-CP), insulin levels 2 hours after eating (Pins), C peptide levels 2 hours after eating (P-CP), total cholesterol (TC), triacylglycerol (TG), low-density lipoprotein cholesterol (LDL-C), high-density lipoprotein cholesterol (HDL-C), SUA, blood urea nitrogen(BUN), serum creatinine (SCr), estimated glomerular filtration rate (eGFR), and other relevant parameters.
- We conducted a survey using the Restraint Scale (RS) questionnaire, which is designed to assess restrictive eating habits. Trained investigators administered the survey consistently. RS is a tool used to measure common eating behaviors and consists of two dimensions: dieting concerns and weight fluctuation. The dieting concerns subscale includes 6 items (1, 5–9), while the weight fluctuation subscale includes 4 items (2–4, 10). In total, there are 10 questions. Each item is scored on a scale of 0–4, representing the response options of never, rarely, sometimes, often, and always, respectively. The scores for each dimension are calculated by summing the item scores within that dimension, and the total score of the scale is determined by summing the scores from both dimensions.
Based on the BMI index: According to the “Guidelines for the Diagnosis and Treatment of Hyperuricemia and Gout in China: 2019” individuals with a BMI of 28 kg/m2 or higher are classified as obese, while those with a BMI between 18.5 kg/m2 and 28 kg/m2 are considered non-obese. Additionally, individuals with a uric acid concentration exceeding 360 µmol/L are categorized as the hyperuricemia group (HG).
Based on the HOMA-IR: According to the “Expert Consensus on Clinical Issues Related to Insulin Resistance (2022 Edition)”, IR is identified by using the highest quartile as a cutoff point. IR is defined as a Homeostatic Model Assessment for Insulin Resistance (HOME-IR) value greater than or equal to 4.62, which results in the classification of individuals into either the insulin resistant (IR) group or the non-insulin resistant (non-IR) group.
Statistical Processing
To process the data, utilize SPSS 24.0 software. All variables were assessed for normality. For measurement data that follow a normal distribution, they are presented as mean ± standard deviation ( ). For measurement data that do not follow a normal distribution, they are presented as median (M), 25th percentile (P25), and 75th percentile (P75). To compare normally distributed variables between two groups, the independent-sample t-test was employed. For the comparison of non-normally distributed variables, the Wilcoxon rank-sum test was used. Enumeration data are represented as a percentage (%), and the chi-squared test was used for group comparisons. After considering relevant factors, Pearson and Logistic stepwise regression were conducted to analyze the relationship between the VFA area and SUA concentration. Generate the Receiver Operating Characteristic (ROC) curve, which involves calculating the area under the curve (AUC), to assess the diagnostic efficacy of the test parameter. Additionally, perform an in-depth analysis to determine the sensitivity, specificity, and establish an optimal cut-off value for accurate diagnosis. This comprehensive approach allows for a thorough evaluation of the test’s diagnostic utility and precision. A statistically significant difference was considered when P < 0.05.
Results
Comparison of All Patients Grouped by SUA Concentration
Based on the concentration of uric acid, the patients were divided into two groups: the high uric acid group (HG) with SUA ≥ 360 µmol/L and the normal control group (CG) with SUA < 360 µmol/L. A comparison was made between the CG and HG groups in terms of various measurements including waistline, weight, height, hipline, VFA, SFA, BMI, RS score, RS weight concern, FBG, PBG, F-CP, Fins, Pins, BUN, SCr, GA, and TG.
The results showed that the HG group had significantly higher values for all these indicators compared to the CG group (P < 0.05), with waistline, VFA, and SCr showing an extremely significant difference (P < 0.001). Additionally, eGFR and HDL-C were found to be lower in the HG group with statistically significant differences (P < 0.05). However, there were no significant differences between the two groups in terms of age, RS dieting attention, HA1C, P-CP, aspartate transaminase (AST), alanine transaminase (ALT), TC, and LDL-C indicators (P > 0.05) (Table 1).
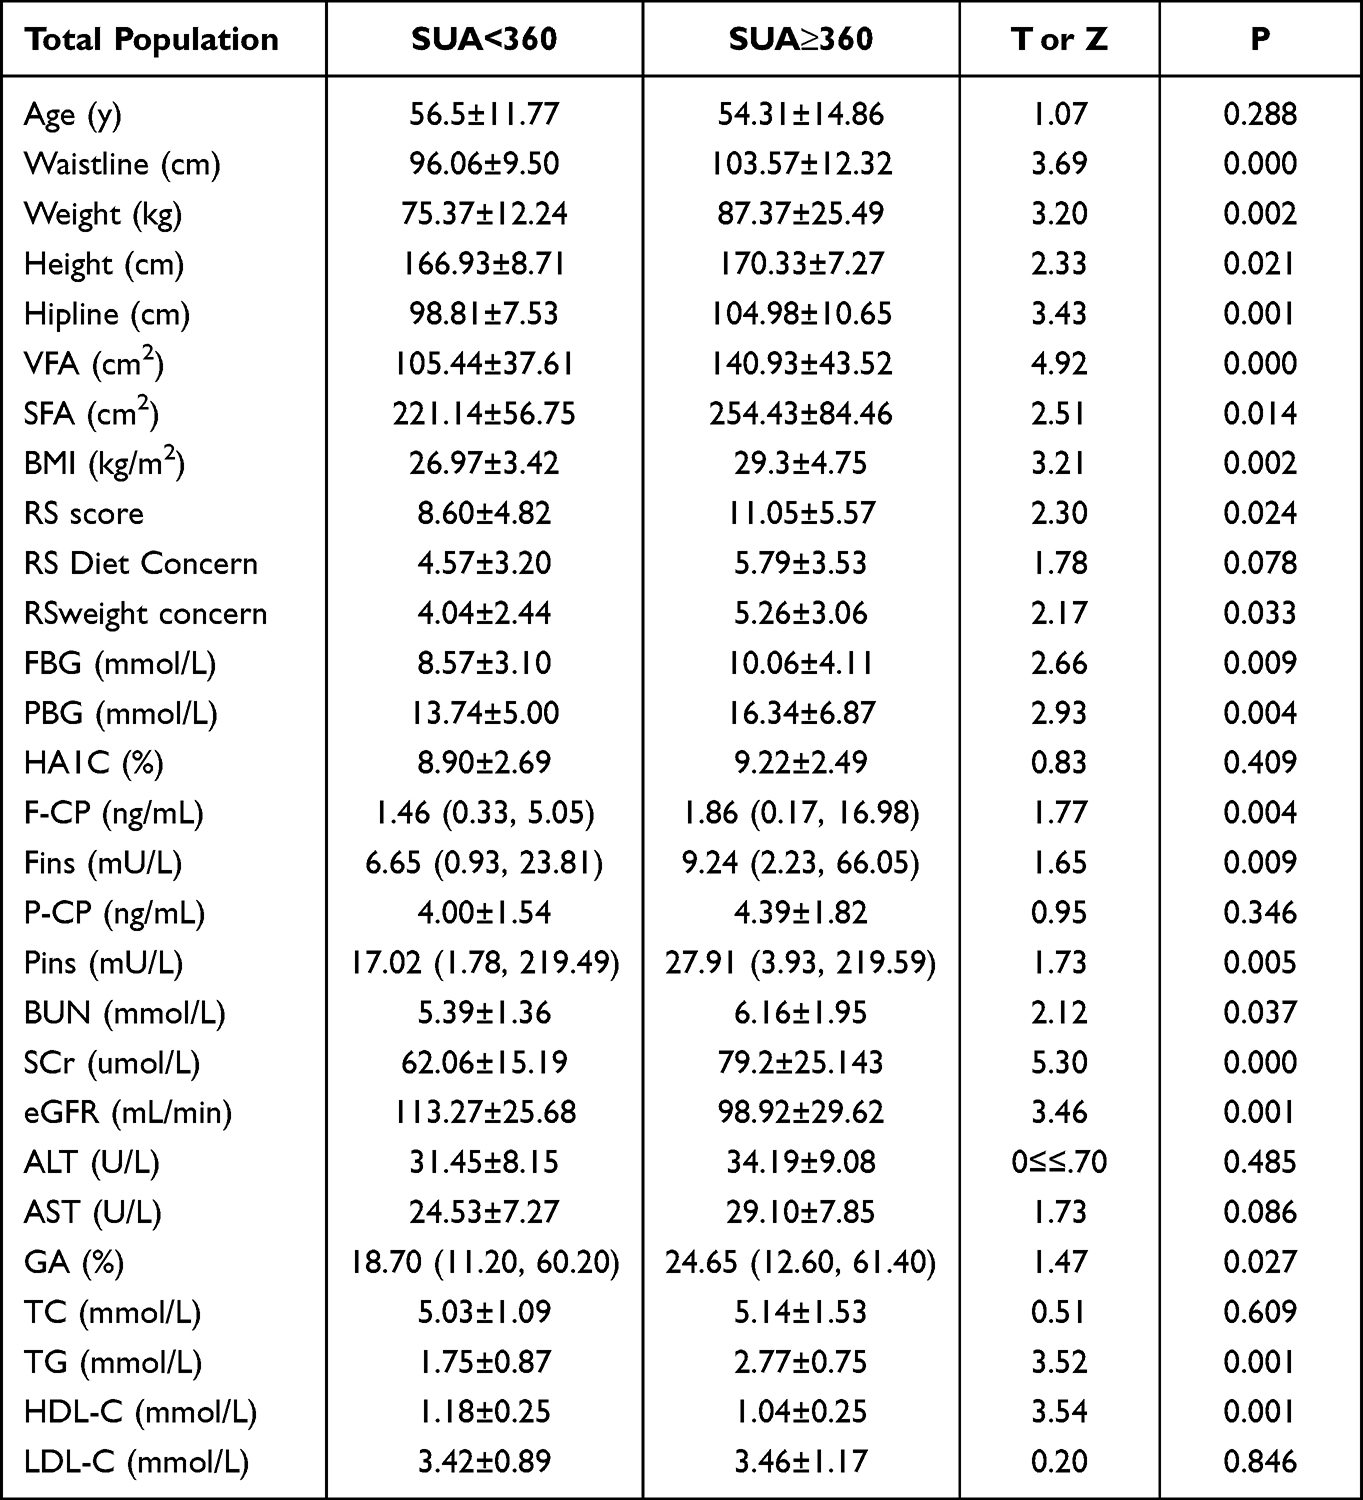 |
Table 1 Comparison of All Patients Grouped by Serum Uric Acid Concentration |
Comparison of Various Indicators of Non-Obese Patients Grouped by SUA Concentration
In comparison to the CG, the HG exhibited significantly higher levels of VFA, FBG, Pins, and SCr (P < 0.05). Conversely, HDL-C levels were lower and significantly different (P < 0.05). However, there were no significant differences in the remaining indicators (P > 0.05) (Table 2).
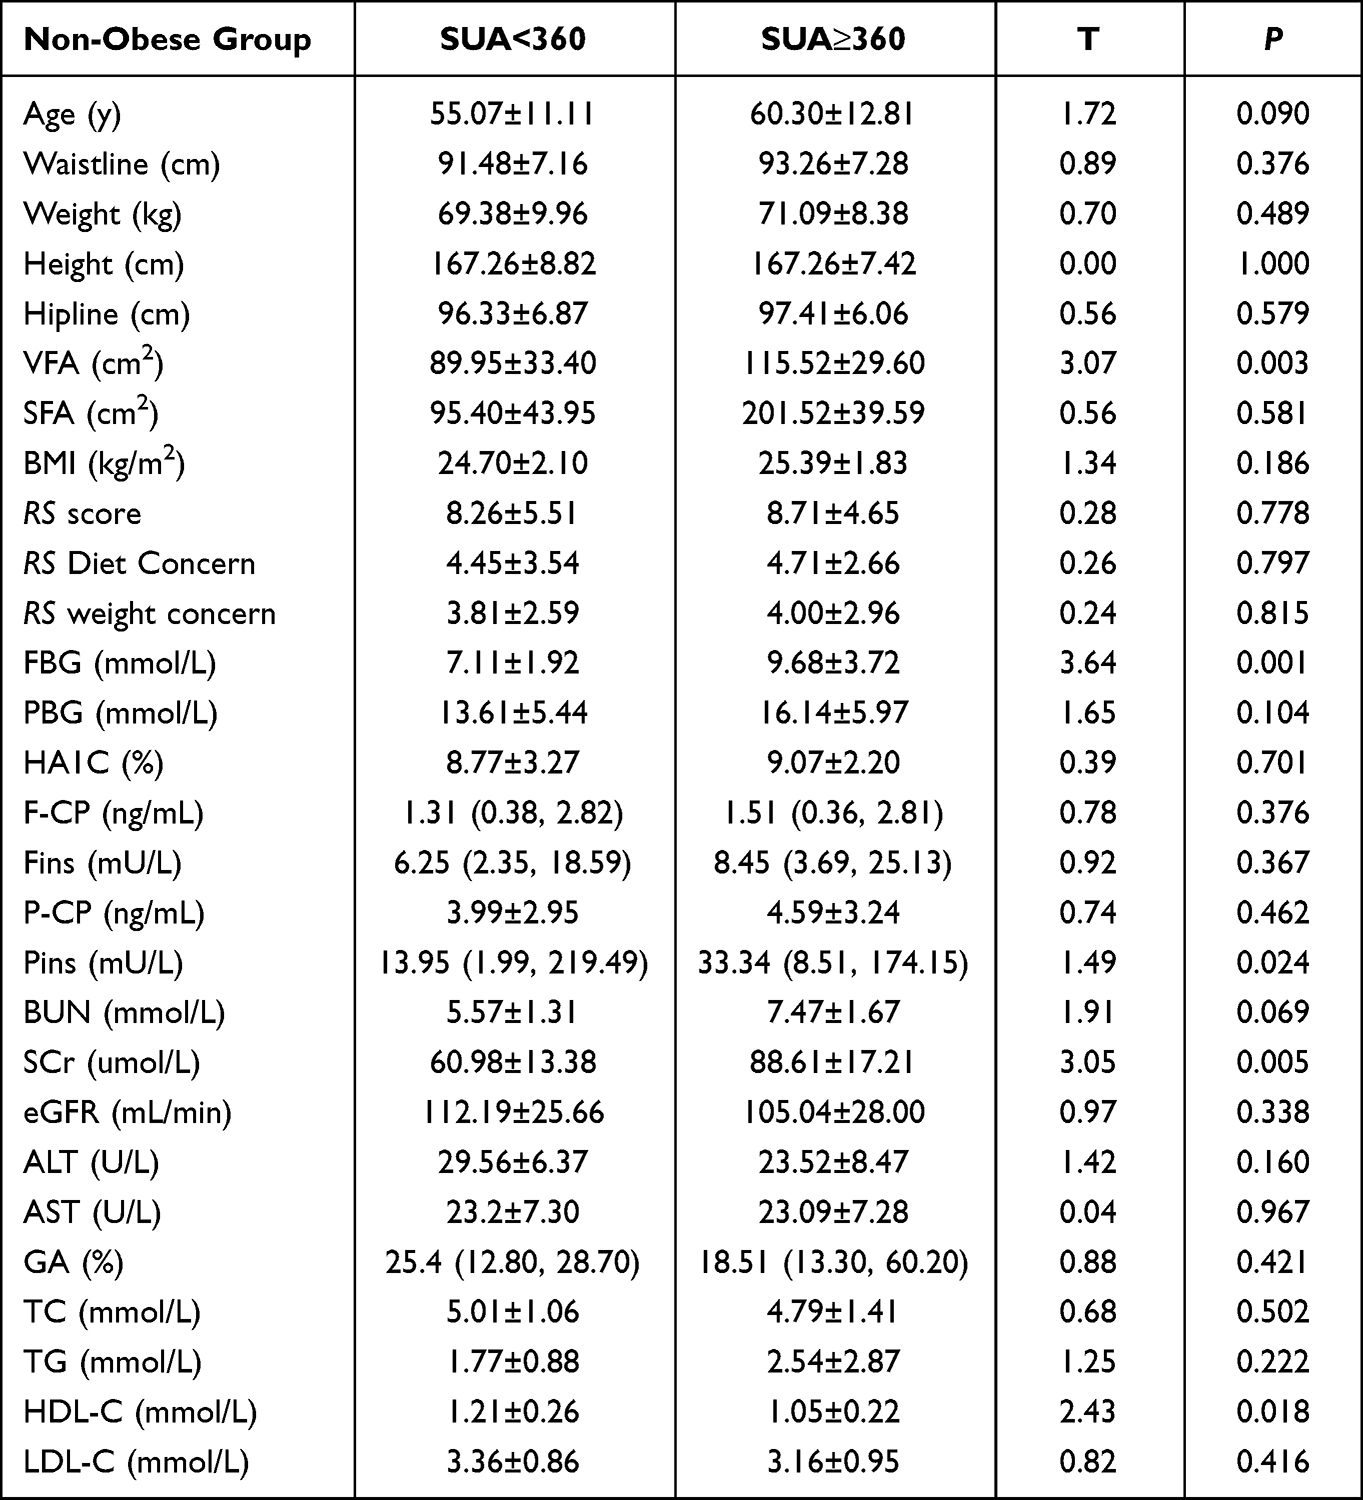 |
Table 2 Comparison of Various Indicators of Non-Obese Patients Grouped by SUA |
Comparison of Various Indicators of Obese Patients Grouped According to Serum Uric Acid Concentration
In comparison to the CG, the HG exhibited significantly higher values for waistline, weight, height, hipline, VFA, SFA, BMI, RS score, RS weight concern, PBG, SCr, and TG index (P < 0.05). On the other hand, HDL-C levels were significantly lower (P < 0.05) in the high uric acid group. No statistically significant differences (P > 0.05) were observed for other indicators (Table 3).
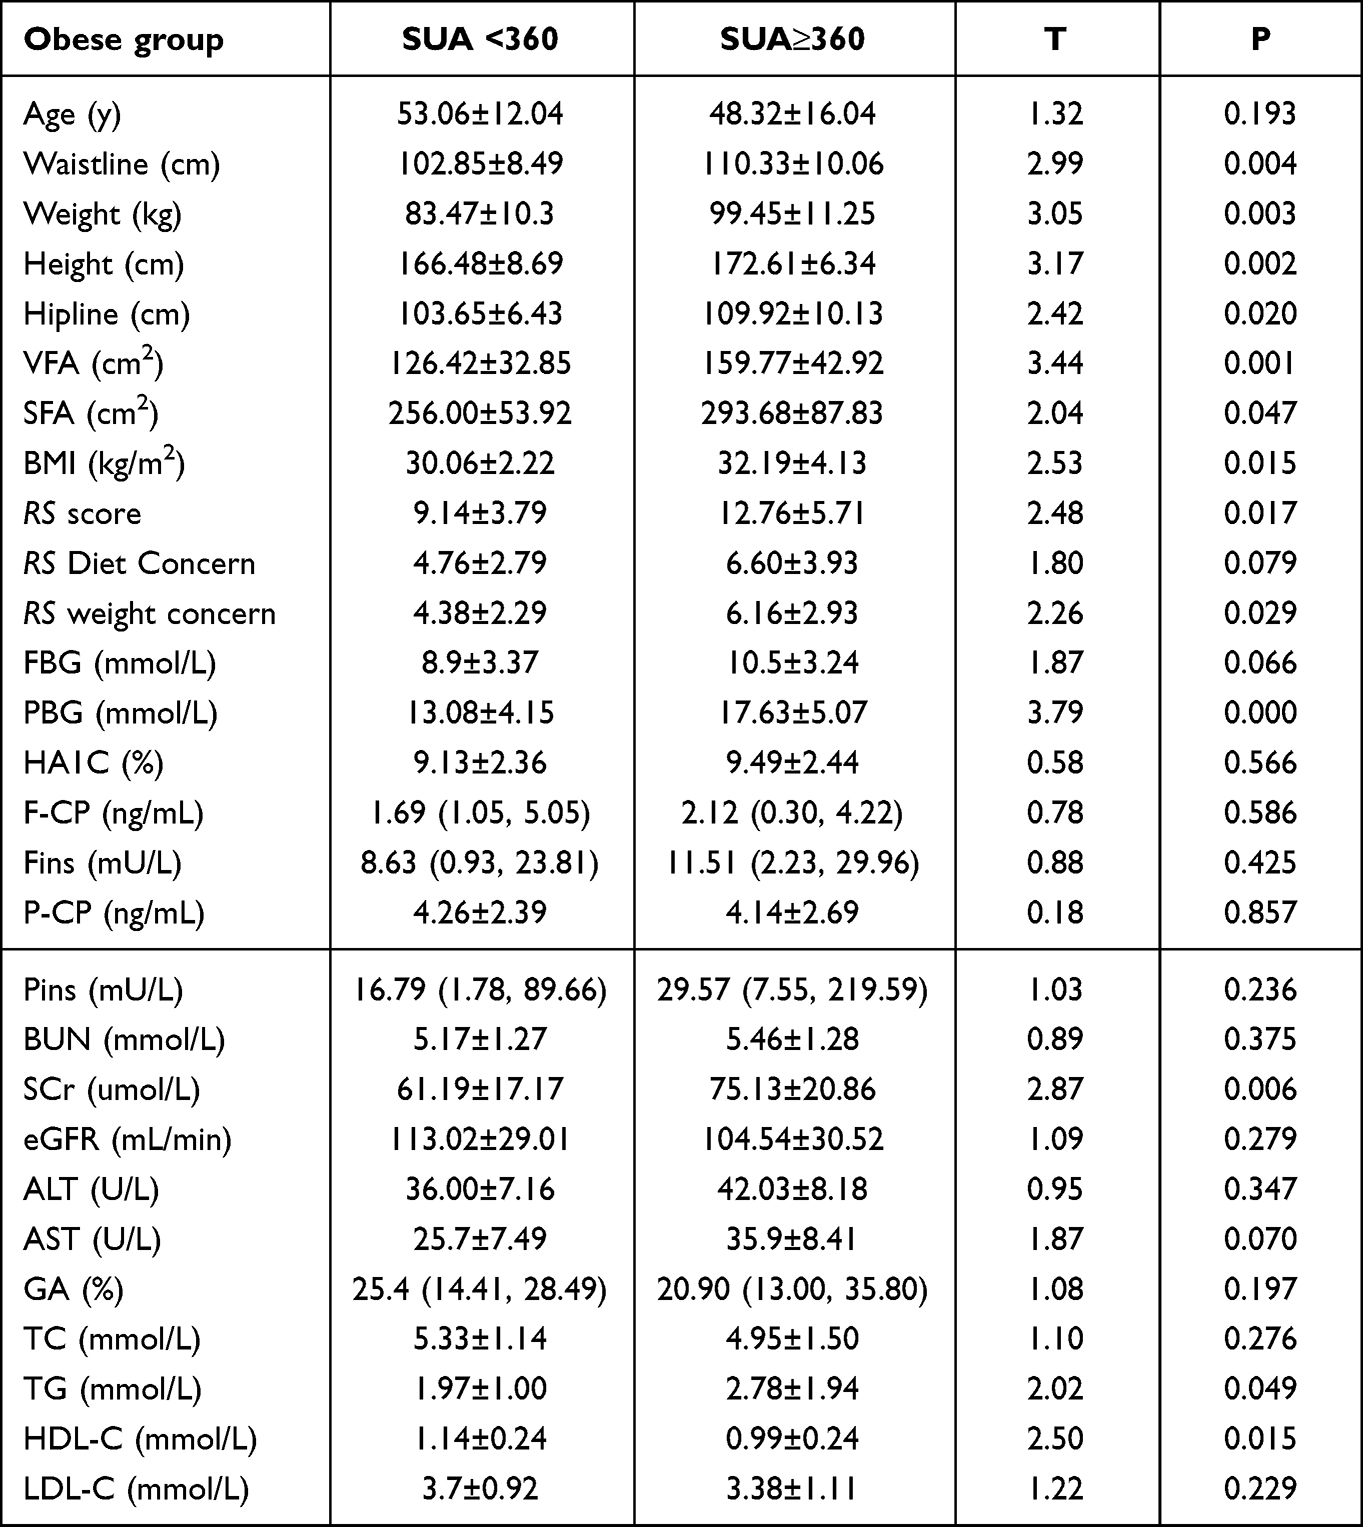 |
Table 3 Comparison of Various Indexes of Obese Patients Grouped by SUA |
Correlation Analysis Between SUA Concentration and Various Indicators
After adjusting for age, gender, VFA, SFA, HbA1C, TC, TG, HDL-C, LDL-C, and other variables, there remains a significant positive correlation between VFA and SUA levels (r = 0.329, P < 0.0001). Furthermore, there is a significant negative correlation between HDL-C and SUA concentration (r = −0.395, P = 0.001). Additionally, TG levels were found to be significantly positively correlated with SUA (r = 0.328, P < 0.001) (Table 4).
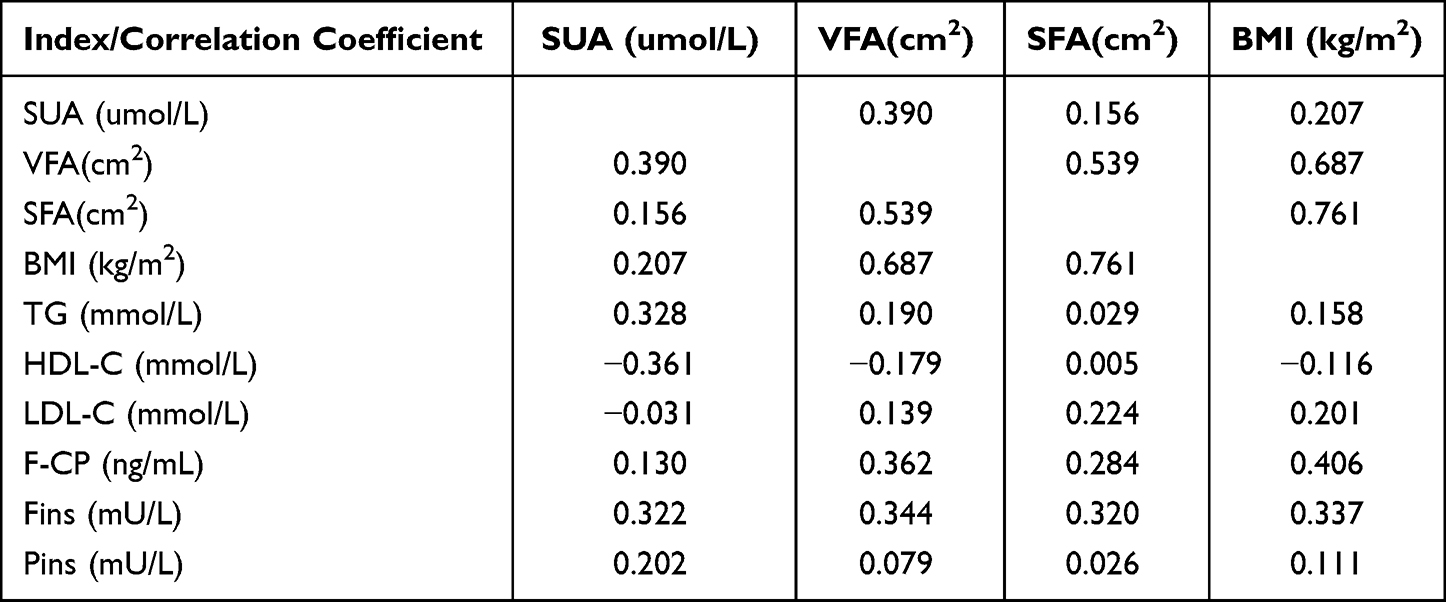 |
Table 4 Correlation Analysis of Patients’ SUA and Various Indexes |
Analysis of Related Risk Factors for Hyperuricemia
The inclusion of various factors such as age, gender, VFA, SFA, HbA1C, TC, TG, HDL, LDL, and other indicators in the logistic stepwise regression analysis indicates that the rise in abdominal VFA and the decline in HDL-C levels are autonomous risk factors for hyperuricemia. The likelihood of developing hyperuricemia increases by 24% with every 10 cm2 increase in VFA, as shown in Table 5.
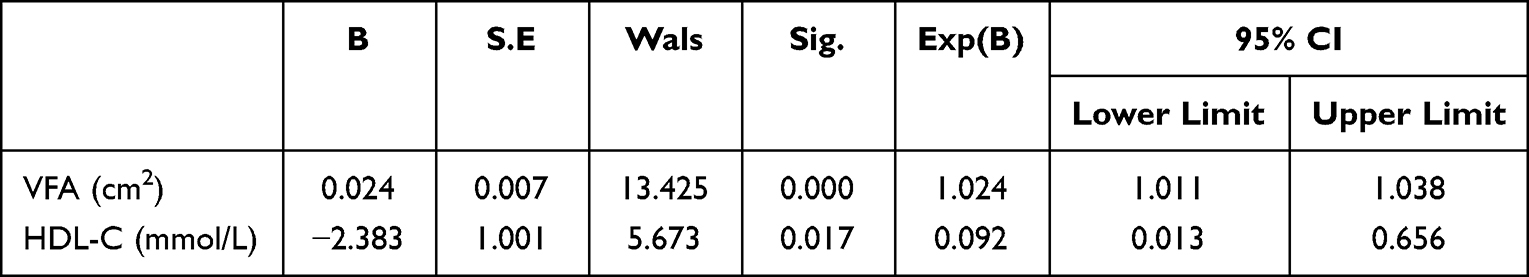 |
Table 5 Analysis of Related Risk Factors for Hyperuricemia |
Analysis of the Area Under the ROC Curve for Hyperuricemia and Insulin Resistance
We conducted an analysis to evaluate the predictive utility of various measures, including VFA, SFA, BMI, waistline, and WHR, in estimating the risk of hyperuricemia in individuals newly diagnosed with type 2 diabetes using ROC curves. In the overall study population, VFA displayed the highest area under the ROC curve (AUC) for predicting hyperuricemia, followed by waistline and BMI, which also exhibited notable AUC values. Specifically, SFA, BMI, and waistline had AUC values of 0.764, 0.709, and 0.684, respectively, while VFA had an AUC of 0.645 (P < 0.05). The optimal cutoff value for VFA was determined as 107.5, with a Youden index of 0.447, sensitivity of 0.837, and specificity of 0.610. Further subgroup analysis revealed that VFA was the most effective predictor for hyperuricemia in individuals with insulin resistance, achieving an AUC of 0.876. In this subgroup, the cutoff value for VFA was 92.0, with a Youden index of 0.6, sensitivity of 1.0, and specificity of 0.6 (P < 0.01). Conversely, for individuals without insulin resistance, BMI emerged as the superior indicator, with an AUC value of 0.692, while VFA had an AUC value of 0.677 (P < 0.05).
Additionally, we assessed the effectiveness of VFA in predicting IR in individuals recently diagnosed with type 2 diabetes based on their uric acid levels. ROC curves were generated using IR as the state variable and VFA, SFA, BMI, waistline, and WHR as the test variables. In the entire study cohort, VFA proved to be the most effective indicator for predicting IR, with an AUC of 0.765 (P < 0.001). The optimal cutoff value for VFA was determined as 141.5, with a Youden index of 0.518, sensitivity of 0.645, and high specificity of 0.873. Notably, in the HG, VFA exhibited outstanding predictive performance, with an AUC of 0.878 (P < 0.001). The cutoff value for VFA in the HG was 135, with a Youden index of 0.678, sensitivity of 0.895, and specificity of 0.783. However, in the CG, VFA was not a reliable indicator for predicting IR in individuals with newly diagnosed type 2 diabetes (Figure 1, Table 6 and Table 7).
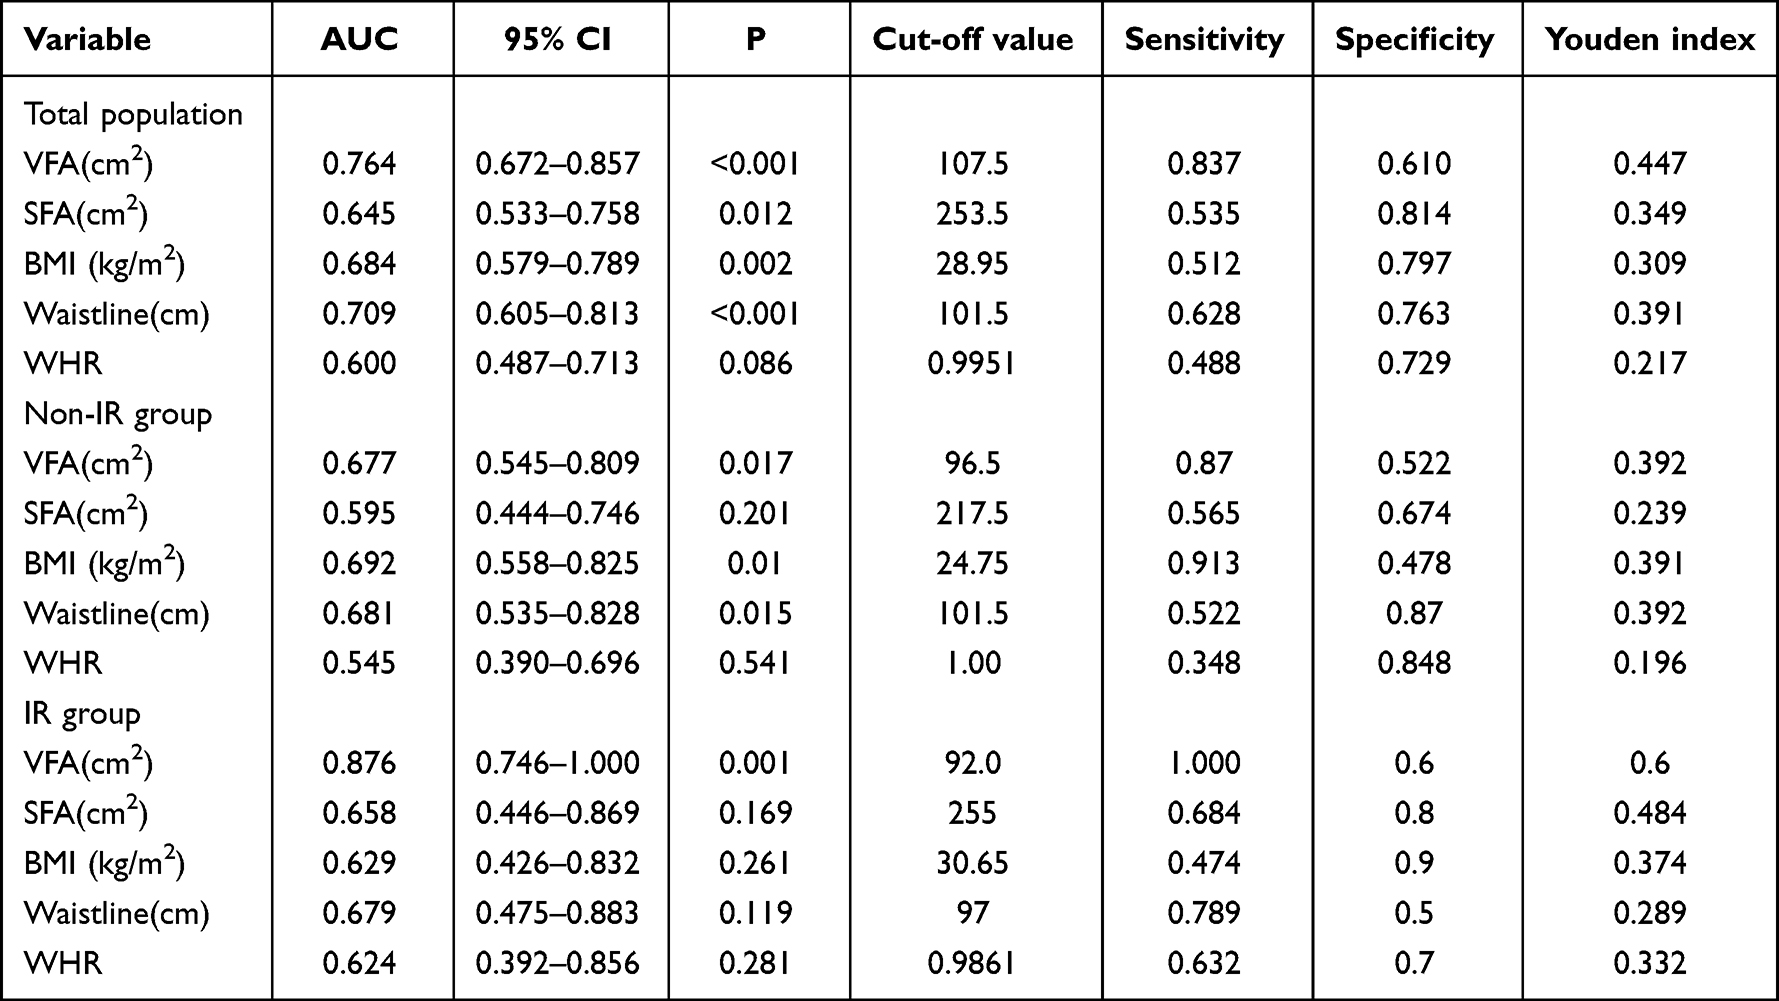 |
Table 6 Area and Analysis Under ROC Curve of the Risk of Hyperuricemia |
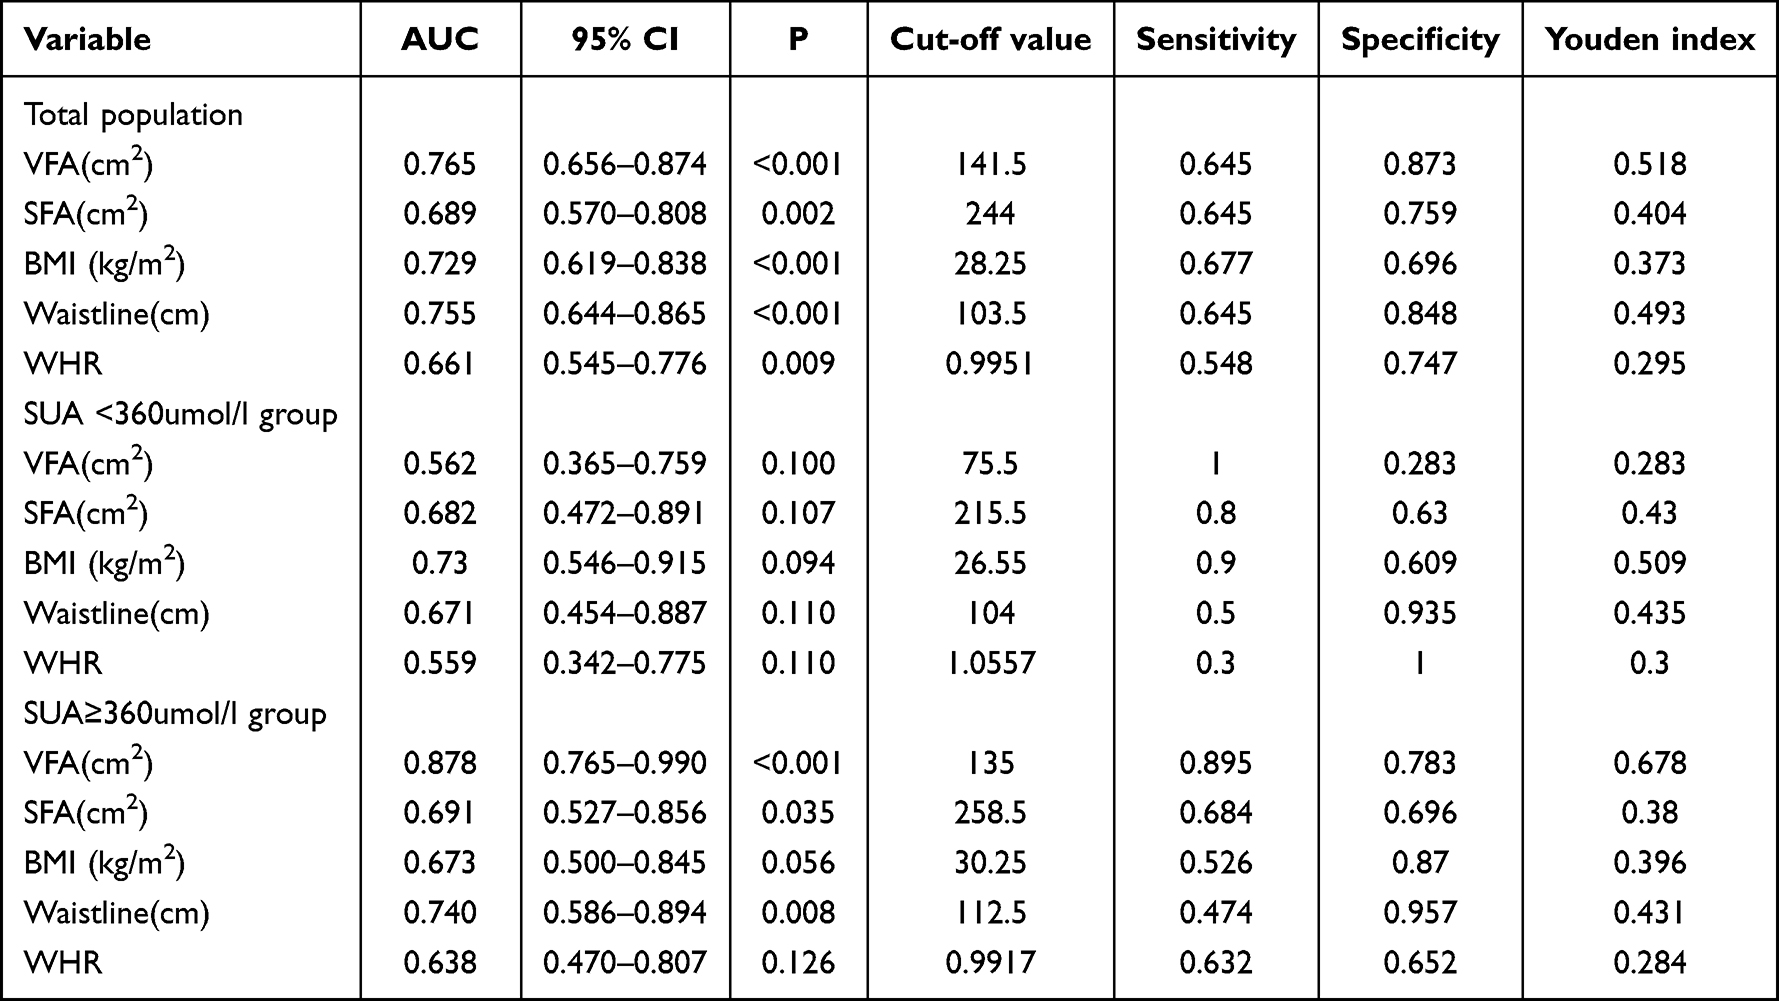 |
Table 7 Area and Analysis Under ROC Curve of the Risk of Insulin Resistance |
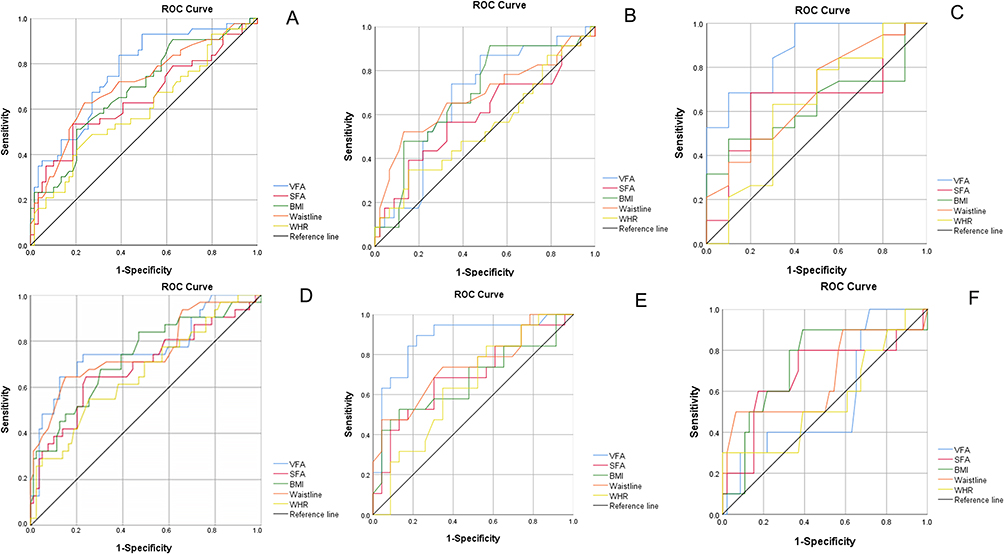 |
Figure 1 (A) The area under the ROC curve for the risk of hyperuricemia: total sample patients. (B) Hyperuricemia risk ROC curve area: non-insulin resistance group. (C) Hyperuricemia Risk ROC Area: Insulin Resistant Group. (D) Insulin resistance risk area under the ROC curve: total sample patients. (E) Insulin resistance risk ROC curve area: HG. (F) Insulin resistance risk ROC curve area: CG. |
Discussion
Obesity is frequently seen in individuals with diabetes, particularly visceral obesity.14 Lean individuals who are prone to developing diabetes may experience IR in their muscles, leading to excessive fat accumulation. On the other hand, obese individuals with diabetes may have higher hormone release from their adipose tissue, including pro-inflammatory cytokines, which can contribute to IR. When IR is coupled with dysfunction of pancreatic β-cells, it becomes challenging to control blood sugar levels within the normal range.12,15
Abdominal fat, which comprises both visceral and subcutaneous fat, is associated with an elevated risk of various diseases, such as cardiovascular disease, type 2 diabetes, and intestinal inflammation.16,17 Some studies suggest that having excessively high uric acid concentration can worsen IR and pancreatic β-cell dysfunction,18 ultimately leading to obesity and diabetes. Additionally, hyperuricemia is related to metabolic syndrome and cardiovascular disease morbidity and death rate.19 This condition can increase the occurrence of cardiovascular events and contribute to the progression of diabetes and nephropathy. Hence, it is crucial to investigate the connection between the amount of abdominal fat and the presence of hyperuricemia in individuals with diabetes, in order to avoid the onset and progression of diabetic complications. Specifically, the occurrence of newly diagnosed type 2 diabetes is strongly correlated with IR and is closely associated with elevated uric acid levels.18,20,21 Currently, there is limited research on the link between the distribution of abdominal fat and the concentration of SUA in patients who have recently been diagnosed with type 2 diabetes. The objective of this study is to examine this relationship and establish a theoretical basis for assessing the risk of hyperuricemia in individuals with newly diagnosed type 2 diabetes. During the course of this study, we discovered that individuals with elevated levels of uric acid in newly diagnosed type 2 diabetes will experience the following alterations: various indicators associated with obesity, including waistline, weight, height, hipline, VFA, SFA, and BMI will increase. Additionally, glucose and lipid metabolism indicators such as FBG, PBG, F-CP, Fins, Pins, GA, TG will increase, while HDL-C will decrease. Renal function indicators, such as BUN and SCr, will increase, and eGFR will decrease. These changes suggest that patients with high uric acid concentration tend to be more obese, experience greater weight fluctuations, and exhibit more pronounced abnormalities in blood glucose and blood lipid levels. The altered renal function indicators indicate a certain degree of kidney damage. This could be attributed to the impact of elevated uric acid on the nitric oxide pathway, induction of pro-inflammatory cytokines, activation of the renin-angiotensin system, and subsequent exacerbation of kidney damage in diabetic patients.22 Research studies have indicated that in individuals diagnosed with type 2 diabetes, particularly those with abdominal obesity, there is a positive association between VFA and SUA as well as F-CP levels.18 Our own investigation confirms this correlation between VFA and SUA. Furthermore, our study reveals that in newly diagnosed type 2 diabetes patients, an increase in SUA leads to elevated levels of Fins and TG, while reducing HDL-C. Previous studies have demonstrated that high uric acid levels can result in abnormal lipid profiles, characterized by increased TG and decreased HDL-C levels. An elevation in SUA concentration triggers the release of monocyte chemotactic protein and hampers adiponectin production, subsequently impacting adipose cells and causing alterations in blood lipid levels. Furthermore, the findings from our research support the theory that elevated SUA concentrations contribute to IR and inflammation, both of which influence blood glucose levels.23
Visceral fat found in the abdomen differs from subcutaneous fat, which is mainly located in the mesentery and omentum. Visceral fat is directly transported to the liver through the portal vein circulation. It is regulated by a greater number of cells, blood vessels, and nerve connections. Additionally, it contains more inflammation and immune cells. Adipocytes in visceral fat have higher metabolic activity, are more responsive to the breakdown of fats, and exhibit increased resistance to insulin. On the other hand, subcutaneous fat is more inclined to absorb free fatty acids and triglycerides in the bloodstream.24 Several studies have demonstrated that the measurement of VFA can be utilized to predict coronary collateral circulation dysfunction,25 anticipate postoperative outcomes in gastric cancer patients,26 and assess the improved prognosis of acute cholecystitis.27 Therefore, VFA serves as a valuable indicator for research purposes. Furthermore, given that previous studies have shown independent associations between uric acid, obesity, and diabetes,28–30 it is plausible that the level of abdominal fat may also be indicative of SUA levels in individuals newly diagnosed with type 2 diabetes. To enhance the understanding of the connection between the amount of fat in the abdomen and the concentration of uric acid, individuals recently diagnosed with type 2 diabetes were categorized into two groups: obese and non-obese. The findings from both groups indicated that individuals with high levels of uric acid had a greater abdominal VFA and lower levels of HDL. Through logistic stepwise regression analysis conducted in this study, it was observed that the likelihood of hyperuricemia increased by 24% for every 10 cm2 rise in abdominal VFA (as shown in Table 5). In this study, we also utilized ROC curves to assess the diagnostic performance of VFA and calculate the AUC. The findings consistently support the conclusion that VFA is an effective indicator for predicting hyperuricemia in patients newly diagnosed with type 2 diabetes (as shown in Figure 1 and Table 6). These results further confirm that the increase in abdominal VFA independently contributes to the risk of hyperuricemia.
The development of the disease may be attributed to the buildup of fat around internal organs, the secretion or activation of certain pro-inflammatory molecules by fatty tissue, such as IL-6, IL-8, monocyte chemoattractant protein 1 (MPC-1), and tumor necrosis Factor α (TNF-α). This process leads to a mild form of inflammation and oxidative stress, resulting in IR.31 Additionally, there is a close association between hyperuricemia and IR, as demonstrated in animal experiments.32 In our study, we investigated the efficacy of VFA in predicting the risk of IR in individuals newly diagnosed with type 2 diabetes, based on their uric acid levels. It is important to highlight that in the HG, VFA exhibited outstanding predictive capabilities, thereby reinforcing the connection between hyperuricemia and IR (as shown in Figure 1 and Table 7). These two factors are interconnected in the following ways: Uric acid induces IR in pancreatic beta cells through the IRS2/AKT pathway,33 and it also promotes the accumulation of fat in liver cells, leading to IR and disruption of insulin signaling through the NLRP3 inflammasome.34 Hence, it can be confidently stated that the amount of fat in the abdomen serves as a significant indicator for predicting the level of SUA in individuals recently diagnosed with type 2 diabetes. Therefore, from a clinical perspective, it is important to measure abdominal fat content in order to identify individuals at risk of developing newly diagnosed type 2 diabetes along with hyperuricemia. Additionally, it is crucial to adopt appropriate measures to manage waistline, weight, height, hipline, VFA, SFA, blood sugar, and blood lipid levels. Specifically, placing emphasis on reducing VFA holds great clinical value in preventing or delaying the onset of complications related to diabetic cardio-cerebrovascular and nephropathy.
Our research has several limitations. Firstly, our study is a cross-sectional survey, which cannot establish causal relationships. Secondly, this study is a single-center study with a small sample size, limiting the representativeness of its findings. While VFA has good sensitivity in predicting hyperuricemia, its specificity is low, leading to a certain false positive rate. Additionally, newly diagnosed diabetic patients may have impaired β-cell function due to elevated blood glucose levels, resulting in decreased serum C-peptide and HOMA-IR, which could potentially lead to inaccurate estimates in these association studies.
Conclusion
In conclusion, our study highlights the significance of evaluating abdominal fat distribution in assessing the risk and prognosis of hyperuricemia in individuals recently diagnosed with type 2 diabetes. We found that higher VFA is an independent factor associated with an increased likelihood of hyperuricemia. This study presents a novel quantification of the relationship between VFA and SUA levels, providing potential value in predicting SUA level progression among newly diagnosed type 2 diabetes patients. These findings emphasize the importance of monitoring VFA in clinical practice to better manage hyperuricemia risk in this population.
Abbreviations
SUA, serum uric acid; CG, normal control group; HG, hyperuricemia group; SFA, subcutaneous fat area; VFA, visceral fat content; BMI, body mass index; FBG, fasting blood glucose; PBG, 2-hour postprandial blood glucose; GA, glycosylated albumin; HbA1C, glycosylated hemoglobin; F-CP, fasting C Peptide; Fins, fasting insulin; Pins, 2 hours postprandial insulin; P-CP, 2 hours postprandial C peptide; BUN, blood urea nitrogen; SCr, serum creatinine; eGFR, glomerular filtration rate; TG, triacylglycerol; HDL-C, high-density lipoprotein cholesterol; TC, total cholesterol; LDL-C, low-density lipoprotein cholesterol; RS, Restrained Scale; AST, Aspartate transferase; ALT, Alanine aminotransferase; WHR, Waist-Hip Ratio; HOMA-IR, Homeostatic Model Assessment of Insulin Resistance; IR, Insulin Resistance; ROC, Generate the Receiver Operating Characteristic.
Ethics Approval and Consent to Participate
This study was conducted in accordance with the Declaration of Helsinki.This study was conducted with approval from the Ethics Committee of Shanghai University of Traditonal Chinese Medicine Affiliated Putuo Hospital (PTEC-A-2019-5-1). A written informed consent was obtained from all participants.
Consent for Publication
Consent for publication was obtained from every individual whose data are included in this manuscript.
Data Sharing Statement
The datasets used and/or analysed during the current study available from the corresponding author on reasonable request.
Acknowledgments
We are particularly grateful to all the people who have given us help on our article.
Author Contributions
All authors made a significant contribution to the work reported, whether that is in the conception, study design, execution, acquisition of data, analysis and interpretation, or in all these areas; took part in drafting, revising or critically reviewing the article; gave final approval of the version to be published; have agreed on the journal to which the article has been submitted; and agree to be accountable for all aspects of the work.
Funding
This study was supported by a grant from Science and Technology Innovation Project of Shanghai Putuo District Health System, (ptkwws202217, ptkwws202302, and ptkwws202003), Discipline Talent Scientific Research Promotion Plan 'Xing Lin Scholar' of Chengdu University of Traditional Chinese Medicine (YYZX2022173).
Disclosure
The authors report no conflicts of interest in this work.
References
1. Atak BM, Kocak MZ, Savli H, et al. Serum uric acid level is associated with type 2 diabetes mellitus and diabetic regulation. Exper Bio Res. 2018;1(4):135–139. doi:10.30714/j-ebr.2018443416
2. Kocak MZ, Aktas G, Duman TT, et al. Is Uric Acid elevation a random finding or a causative agent of diabetic nephropathy? Rev Assoc Med Bras. 2019;65:1155–1160. doi:10.1590/1806-9282.65.9.1156
3. Chien K-L, Chen M-F, Hsu H-C, et al. Plasma uric acid and the risk of type 2 diabetes in a Chinese community. Clin Chem. 2008;54(2):310–316. doi:10.1373/clinchem.2007.095190
4. Aktas G, Kocak MZ, Bilgin S, et al. Uric acid to HDL cholesterol ratio is a strong predictor of diabetic control in men with type 2 diabetes mellitus. Aging Male. 2020;23(5):1098–1102. doi:10.1080/13685538.2019.1678126
5. Aktas G, Khalid A, Kurtkulagi O, et al. Poorly controlled hypertension is associated with elevated serum uric acid to HDL-cholesterol ratio: a cross-sectional cohort study. Postgrad Med. 2022;134(3):297–302. doi:10.1080/00325481.2022.2039007
6. Kosekli MA, Kurtkulagii O, Kahveci G, et al. The association between serum uric acid to high density lipoprotein-cholesterol ratio and non-alcoholic fatty liver disease: the abund study. Rev Assoc Med Bras. 2021;67:549–554. doi:10.1590/1806-9282.20201005
7. Kocak MZ, Aktas G, Erkus E, et al. Serum uric acid to HDL-cholesterol ratio is a strong predictor of metabolic syndrome in type 2 diabetes mellitus. Rev Assoc Med Bras. 2019;65:9–15. doi:10.1590/1806-9282.65.1.9
8. Hsia Y, Neubert AC, Rani F, et al. An increase in the prevalence of type 1 and 2 diabetes in children and adolescents: results from prescription data from a UK general practice database. Br J Clin Pharmacol. 2009;67(2):242–249. doi:10.1111/j.1365-2125.2008.03347.x
9. Shield J, Lynn R, Wan KC, et al. Management and 1 year outcome for UK children with type 2 diabetes. Arch Dis Child. 2009;94(3):206–209. doi:10.1136/adc.2008.143313
10. Yokokawa H, Fukuda H, Saita M, et al. An association between visceral or subcutaneous fat accumulation and diabetes mellitus among Japanese subjects. Diabetol Metab Syndr. 2021;13:1–10. doi:10.1186/s13098-021-00646-3
11. Patel P, Abate N. Body fat distribution and insulin resistance. Nutrients. 2013;5(6):2019–2027. doi:10.3390/nu5062019
12. Kahn SE, Hull RL, Utzschneider KM. Mechanisms linking obesity to insulin resistance and type 2 diabetes. Nature. 2006;444(7121):840–846. doi:10.1038/nature05482
13. Adnan E, Rahman IA, Faridin H. Relationship between insulin resistance, metabolic syndrome components and serum uric acid. Diabetes Metab Syndr. 2019;13(3):2158–2162.
14. Hirayama S, Hori A, Isshiki M, et al. Fasting serum free glycerol concentration is a potential surrogate marker of visceral obesity and insulin sensitivity in middle-aged Japanese men. J Clin Lipidol. 2020;14(4):522–530. doi:10.1016/j.jacl.2020.06.003
15. Malone JI, Hansen BC. Does obesity cause type 2 diabetes mellitus (T2DM)? Or is it the opposite? Pediatr Diabetes. 2019;20(1):5–9. doi:10.1111/pedi.12787
16. Barroso T, Conway F, Emel S, et al. Patients with inflammatory bowel disease have higher abdominal adiposity and less skeletal mass than healthy controls. Anna Gastroenterol. 2018;31(5):566. doi:10.20524/aog.2018.0280
17. Hinnouho G-M, Czernichow S, Dugravot A, et al. Metabolically healthy obesity and the risk of cardiovascular disease and type 2 diabetes: the Whitehall II cohort study. Eur Heart J. 2015;36(9):551–559. doi:10.1093/eurheartj/ehu123
18. Hu X, Rong S, Wang Q, et al. Association between plasma uric acid and insulin resistance in type 2 diabetes: a Mendelian randomization analysis. Diabetes Res Clin Pract. 2021;171:108542. doi:10.1016/j.diabres.2020.108542
19. Katsiki N, Papanas N, Fonseca V, et al. Uric acid and diabetes: is there a link? Curr Pharm Des. 2013;19(27):4930–4937. doi:10.2174/1381612811319270016
20. Tang X, Yan X, Zhou H, et al. Associations of insulin resistance and beta-cell function with abnormal lipid profile in newly diagnosed diabetes. Chin Med J. 2022;135(21):2554–2562. doi:10.1097/CM9.0000000000002075
21. Biradar MI, Chiang K-M, Yang H-C, et al. The causal role of elevated uric acid and waist circumference on the risk of metabolic syndrome components. Int J Obes. 2020;44(4):865–874. doi:10.1038/s41366-019-0487-9
22. Mauer M, Doria A. Uric acid and diabetic nephropathy risk. Uric Acid Chron Kidney Dis. 2018;192:103–109.
23. Ali N, Rahman S, Islam S, et al. The relationship between serum uric acid and lipid profile in Bangladeshi adults. BMC Cardiovasc Disord. 2019;19:1–7. doi:10.1186/s12872-019-1026-2
24. Ibrahim MM. Subcutaneous and visceral adipose tissue: structural and functional differences. Obesity Rev. 2010;11(1):11–18. doi:10.1111/j.1467-789X.2009.00623.x
25. Sahinturk Y, Kucukseymen S, Avci R, et al. Visceral fat index: a novel predictor for coronary collateral circulation. Arch Endocrinol Metab. 2020;64:150–158. doi:10.20945/2359-3997000000218
26. Taniguchi Y, Kurokawa Y, Takahashi T, et al. Impacts of preoperative psoas muscle mass and visceral fat area on postoperative short-and long-term outcomes in patients with gastric cancer. World J Surg. 2021;45:815–821. doi:10.1007/s00268-020-05857-9
27. Leibovitz E, Ben-David N, Shibanov L, et al. Visceral adiposity but not subcutaneous fat associated with improved outcome of patients with acute cholecystitis. J Surg Res. 2018;225:15–20. doi:10.1016/j.jss.2017.11.053
28. Di Bonito P, Valerio G, Licenziati MR, et al. High uric acid, reduced glomerular filtration rate and non-alcoholic fatty liver in young people with obesity. J Endocrinol Invest. 2020;43:461–468. doi:10.1007/s40618-019-01130-6
29. Al-Daghri NM, Al-Attas OS, Wani K, et al. Serum uric acid to creatinine ratio and risk of metabolic syndrome in Saudi type 2 diabetic patients. Sci Rep. 2017;7(1):12104. doi:10.1038/s41598-017-12085-0
30. Zong J, Sun Y, Zhang Y, et al. Correlation between serum uric acid level and central body fat distribution in patients with type 2 diabetes. Diabet Meta Synd Obes. 2020;Volume 13:2521–2531. doi:10.2147/DMSO.S260891
31. Gustafson B. Adipose tissue, inflammation and atherosclerosis. J Atheroscler Thromb. 2010;17(4):332–341. doi:10.5551/jat.3939
32. Adachi S-I, Yoshizawa F, Yagasaki K. Hyperuricemia in type 2 diabetic model KK-A y/Ta mice: a potent animal model with positive correlation between insulin resistance and plasma high uric acid levels. BMC Res Notes. 2017;10:1–5. doi:10.1186/s13104-017-2897-x
33. Ghasemi A. Uric acid‐induced pancreatic β-cell dysfunction. BMC Endocr Disord. 2021;21(1):1–5. doi:10.1186/s12902-021-00698-6
34. Wan X, Xu C, Lin Y, et al. Uric acid regulates hepatic steatosis and insulin resistance through the NLRP3 inflammasome-dependent mechanism. J Hepatol. 2016;64(4):925–932. doi:10.1016/j.jhep.2015.11.022
 © 2023 The Author(s). This work is published and licensed by Dove Medical Press Limited. The
full terms of this license are available at https://www.dovepress.com/terms
and incorporate the Creative Commons Attribution
- Non Commercial (unported, 3.0) License.
By accessing the work you hereby accept the Terms. Non-commercial uses of the work are permitted
without any further permission from Dove Medical Press Limited, provided the work is properly
attributed. For permission for commercial use of this work, please see paragraphs 4.2 and 5 of our Terms.
© 2023 The Author(s). This work is published and licensed by Dove Medical Press Limited. The
full terms of this license are available at https://www.dovepress.com/terms
and incorporate the Creative Commons Attribution
- Non Commercial (unported, 3.0) License.
By accessing the work you hereby accept the Terms. Non-commercial uses of the work are permitted
without any further permission from Dove Medical Press Limited, provided the work is properly
attributed. For permission for commercial use of this work, please see paragraphs 4.2 and 5 of our Terms.