")
Back to Journals » Cancer Management and Research » Volume 12
Construction and Validation of an m6A RNA Methylation Regulators-Based Prognostic Signature for Esophageal Cancer
Received 21 March 2020
Accepted for publication 17 June 2020
Published 6 July 2020 Volume 2020:12 Pages 5385—5394
DOI https://doi.org/10.2147/CMAR.S254870
Checked for plagiarism Yes
Review by Single anonymous peer review
Peer reviewer comments 2
Editor who approved publication: Dr Eileen O'Reilly
Li-chao Xu,1,2,* Jing-xin Pan,3,* Hong-da Pan2
1Department of Interventional Radiology, Fudan University Shanghai Cancer Center, Shanghai 200032, People’s Republic of China; 2Department of Oncology, Shanghai Medical College, Fudan University, Shanghai 200032, People’s Republic of China; 3Department of Internal Medicine, The Second Affiliated Hospital of Fujian Medical University, Quanzhou 362000, People’s Republic of China
*These authors contributed equally to this work
Correspondence: Hong-da Pan
Fudan University Shanghai Cancer Center; Department of Oncology, Shanghai Medical College,Fudan University, Shanghai 200032, People’s Republic of China
Tel +86-18121299598
Email [email protected]
Purpose: N6-methyladenosine (m6A) is reported to play a critical role in cancer through various mechanisms. We aimed to construct and validate an m6A RNA methylation regulators-based prognostic signature for Esophageal cancer (ESCA).
Materials and Methods: The RNA sequencing transcriptome data of 13 m6A RNA methylation regulators as well as clinical data were obtained from The Cancer Genome Atlas (TCGA) ESCA database. The differential expression of the regulators between ESCA tissues and normal tissues was assessed. Consensus clustering was conducted to explore the different ESCA clusters based on the expression of these regulators. LASSO Cox regression analysis was used to generate a prognostic signature based on m6A RNA methylation regulators expression.
Results: Eight regulators (KIAA1429, HNRNPC, RBM15, METTL3, WTAP, YTHDF1, YTHDC1, and YTHDF2) were found to be significantly upregulated in ESCA tissues. Significant differences of survival rate and clinicopathological features were found between the two clusters. A prognostic signature, which consists of HNRNPC and ALKBH5, was constructed based on the TCGA ESCA cohort, which can serve as an independent prognostic predictor. The results of bioinformatics analysis were further successfully validated in the clinical ESCA cohort by qRT-PCR and immunohistochemistry staining.
Conclusion: Our study constructed and validated an m6A RNA methylation regulators-based prognostic signature. This might provide important information for developing diagnostic and therapeutic strategies.
Keywords: m6A, RNA methylation, esophageal cancer, prognosis, experimental validation
Introduction
Esophageal cancer (ESCA) is reported to be the sixth most common cause of cancer-related death globally, and it remains a challenging disease due to limited treatment options and poor prognosis.1 Extensive treatment might be associated with a considerable decline in health-related quality of life and yet still a poor prognosis.2 Neoadjuvant therapy with chemotherapy or chemoradiotherapy has supplemented surgery as the standard treatment of ESCA, and surgery has become more standardized and centralized.3 Developing a robust prognostic predictor for patients with ESCA is critical for precise individualized treatment. The Tumor, Node, Metastasis (TNM) staging system is currently the most commonly used indicator for ESCA staging and prognostic prediction. Identification of novel and reliable prognostic predictors in addition to the TNM staging system is of great importance for developing appropriate therapeutic strategies for ESCA.
N6-methyladenosine (m6A) modification is one of the most frequent chemical modifications in eukaryotic mRNAs.4 Emerging evidence suggests that aberrant m6A RNA methylation plays a critical role in cancer through various mechanisms,5,6 such as mRNA stability, splicing, and translation.7 The level of m6A methylation is regulated by methyltransferases, demethylases, and binding proteins. m6A RNA modification can be installed enzymatically by various methyltransferases, termed m6A “writers” (METTL3, METTL14, WTAP, KIAA1429, RBM15, and ZC3H13). N6-methyladenosine in RNA can be removed by demethylases, termed m6A “erasers” (FTO and ALKBH5). Proteins that selectively bind m6A can be defined as m6A “readers” (HNRNPC, YTHDF1, YTHDF2, YTHDC2, and YTHDC1) that exert regulatory functions by selective recognition of methylated RNA.8 Previous studies have demonstrated that m6A RNA methylation regulators were aberrantly expressed in various types of cancers.9 In addition, emerging evidence has revealed the cancer promoter or suppressor role of m6A regulators in the development of various malignancies.10–12 Zhang et al demonstrated m6A regulator-mediated methylation modification patterns and tumor microenvironment infiltration characterization in gastric cancer.12 METTL3 is significantly upregulated in hepatoblastoma, and it regulates β-catenin to promote tumor proliferation.9 Yang et al revealed that FTO promoted melanoma tumorigenesis and anti-PD-1 resistance, and suggest that the combination of FTO inhibition with anti-PD-1 blockade may reduce the resistance to immunotherapy in melanoma.13 However, the roles of m6A methylation regulators in ESCA are unclear.
In the present study, the differentially expressed m6A RNA methylation regulators between normal and tumor samples were identified using the RNA sequencing data from The Cancer Genome Atlas (TCGA) ESCA dataset. The interactions among these regulators were assessed, and their correlation with clinicopathological features were assessed. Then, consensus clustering was conducted to explore two clusters of ESCA patients according to the expression of m6A RNA methylation regulators to predict clinical outcome. Subsequently, a two-gene prognostic signature was generated, that demonstrated good performance for predicting prognosis. More importantly, the bioinformatics prediction was further experimentally validated in a clinical ESCA cohort (Figure 1). Our study showed that m6A RNA methylation regulators might exert an essential role in the carcinogenesis of ESCA, and that the prognostic signature can serve as a useful tool for predicting the prognosis of ESCA patients.
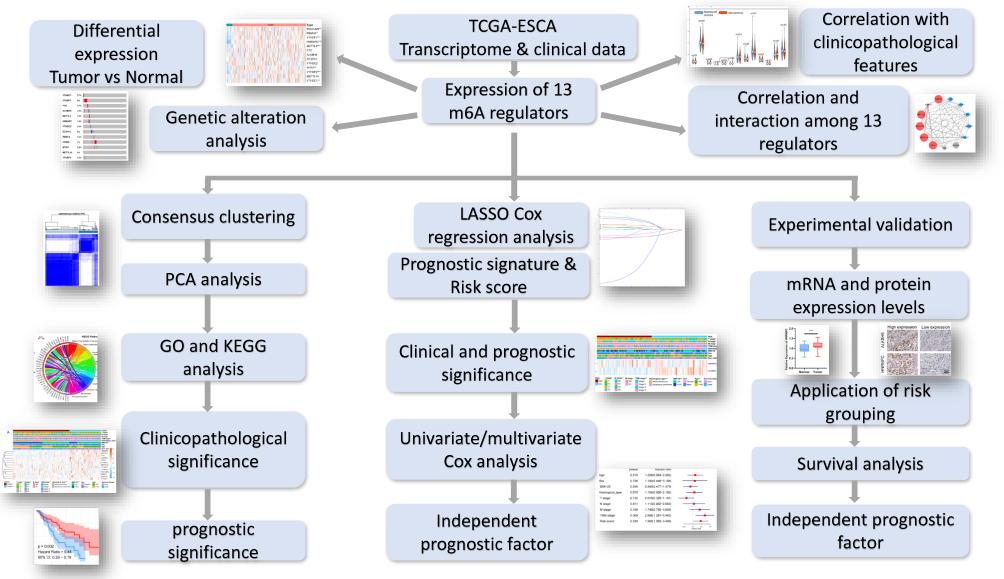 |
Figure 1 Flow chart of construction and validation of a m6A RNA methylation regulators-based prognostic signature for ESCA. |
Materials and Methods
TCGA Data Acquisition
RNA transcriptome data in the Fragments Per Kilobase of transcript, per Million mapped reads (FPKM) format, as well as the corresponding clinicopathological and survival information for ESCA patients, were obtained from The Cancer Genome Atlas (TCGA, https://cancergenome.nih.gov/). All analyses were conducted according to the publication guidelines of TCGA. A total of 161 ESCA samples and 11 normal tissue samples were enrolled for subsequent analysis. According to previously published literature, 13 well-acknowledged m6A RNA methylation regulators (YTHDC1, YTHDC2, YTHDF1, YTHDF2, ALKBH5, FTO, METTL3, METTL14, HNRNPC, WTAP, RBM15, KIAA1429, and ZC3H13) were selected for further analysis.
Construction of the Prognostic Signature
All m6A methylation regulators were included in the Least Absolute Shrinkage and Selection Operator (LASSO) Cox regression model to construct the powerful prognostic signature and calculate a coefficient for each gene. A risk score for each patient was calculated as the sum of each gene’s score, which was obtained by multiplying the expression of each gene and its coefficient. The sensitivity and specificity of the prognostic signature were accessed by receiver operating characteristic (ROC) curves and area under the ROC curves (AUC values).
Experimental Validation
Eighty ESCA tissues and paired normal tissues were obtained from Outdo Biotech (Shanghai, China). The mRNA and protein expression of HNRNPC and ALKBH5 were quantified by immunohistochemistry (IHC) staining and quantitative real-time PCR (qRT-PCR), as per previously described methods.14 The validation cohort was grouped into low- and high-risk groups according to the risk scores calculated by the TCGA cohort. Detailed information regarding PCR primers and antibody used in this study was provided in Table S1. Written informed consent was obtained from all the patients. The validation study was approved by the Ethics Committee of Fudan University.
Statistical Analysis
The Chi-square test was used to compare the clinicopathological features between different groups. The Student’s t-test (two-tailed) was applied to compare the differences between groups. Univariate and multivariate Cox regression analyses were used to identify the independent prognostic factors for patients with ESCA. Kaplan-Meier method and Log rank test were used to compare the overall survival (OS) difference between different groups. Data analysis was performed with either GraphPad Prism 7.0 (GraphPad, San Diego, CA, USA) or SPSS v23.0 (IBM Corp., Armonk, NY, USA). All statistical tests were two-sided. A P value of less than 0.05 was considered statistically significant.
Bioinformatics Analysis
Differential expressions of 13 m6A methylation regulators between different sample groups were identified by “limma” package in R software. Gene expression levels, as well as their correlation with clinicopathological features, were visualized by heatmaps generated with “pheatmap” package. The “corrplot” package was employed to reveal the correlation among m6A RNA methylation regulators. Interactions among m6A RNA methylation regulators were analyzed and a protein–protein interaction network was established and visualized by the STRING and Cytoscape 3.6.0. The genetic alterations of the m6A methylation regulators were analyzed by cBioPortal using data from TCGA. The ESCA cohort was clustered into different groups by consensus expression of m6A RNA methylation regulators with “ConsensusClusterPlus” package. Principal component analysis “PCA” package was used to assess the efficiency of cohort clustering. The Kyoto Encyclopedia of Genes and Genomes (KEGG) pathway analysis and gene ontology (GO) annotation were performed by “clusterProfiler” package and visualized using circos plots generated by “ggplot2” package.
Results
Expression of m6A RNA Methylation Regulators in ESCA
The mRNA expression levels of m6A RNA methylation regulators were analyzed using transcriptome data from the TCGA-ESCA database. A Heatmap was generated to visualize the differential expression of 13 regulators between ESCA and normal tissues (Figure 2A). The mRNA expression levels of 8 regulators (KIAA1429, HNRNPC, RBM15, METTL3, WTAP, YTHDF1, YTHDC1, and YTHDF2) were significantly increased in ESCA compared with normal tissues. No significant difference was found for the other 5 regulators (METTL14, YTHDC2, ZC3H13, FTO, and ALKBH5) (Figure 2B). Moreover, we also investigated the differential expression of these 13 regulators in tissues with regard to clinicopathological variables. The results showed that YTHDC2 expression was higher in ESCA tissues from female patients (Figure 2C). HNRNPC and FTO tended to increase in ESCA tissues from patients younger than 65 years (Figure 2D). A high level of HNRNPC was associated with advanced TNM stage. However, YTHDC2 was underexpressed in stage III/IV ESCA (Figure 2E), and in adenocarcinoma compared with squamous cell carcinoma (Figure 2F).
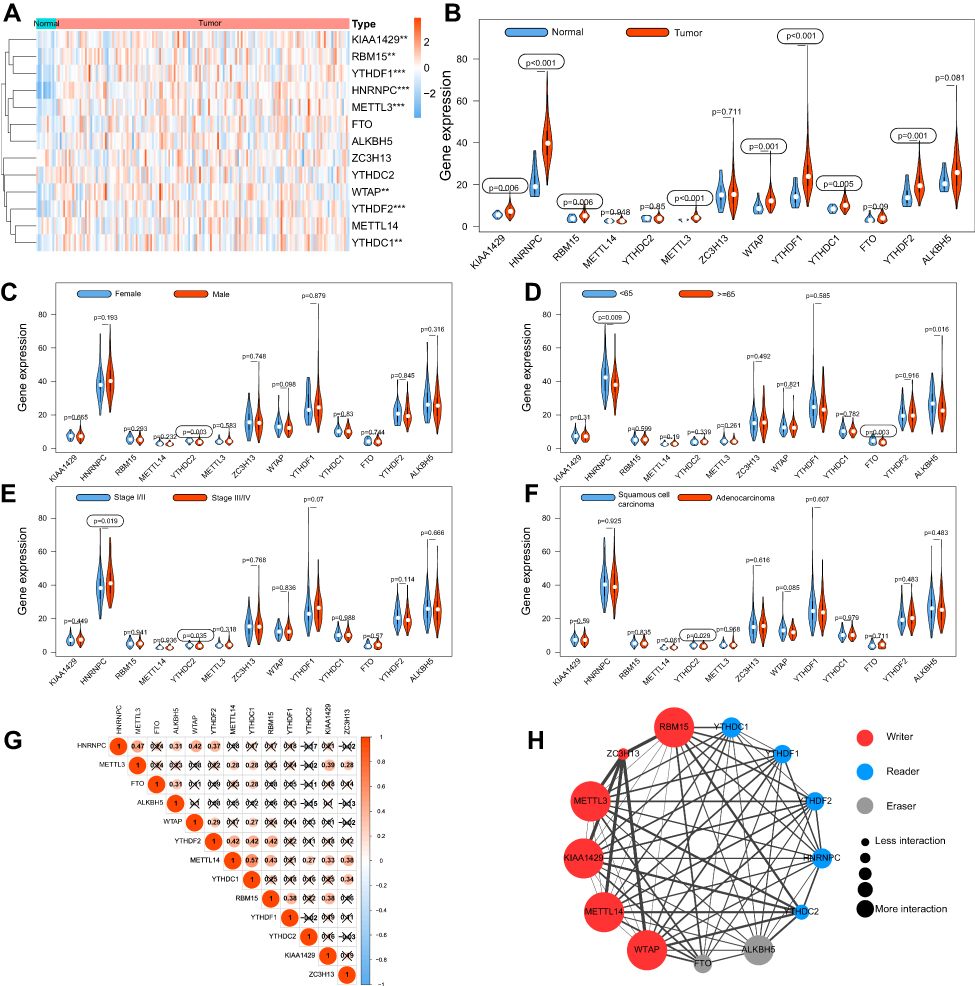 |
Figure 2 The expression, correlation and interaction of 13 m6A RNA methylation regulators in TCGA ESCA cohort. Notes: (A) The heatmap showed the expression of 13 m6A RNA methylation regulators in each sample. (B) The violin plot showed the differentially expressed regulators between normal tissues and ESCA tissues. (C–F) Differential expression of m6A regulators between different groups regarding gender, age, TNM stage and histological type. (G) The correlations among m6A RNA methylation regulators were analyzed by Pearson correlation. (H) PPI network showed the interactions among m6A RNA methylation regulators. **P<0.01, ***P<0.001. |
Correlation and Interaction of 13 m6A RNA Methylation Regulators in ESCA
To further understand the relations among 13 m6A RNA methylation regulators, correlations among the mRNA expression of these genes were analyzed by Pearson correlation analysis (Figure 2G), and the protein–protein interactions (PPI) were analyzed via String database (Figure 2H). Correlation analysis demonstrated that all the regulators were positively correlated with each other, and METTL14 was significantly correlated with YTHDC1 (r = 0.57). The PPI network demonstrated that five writers (METTL3, METTL14, RBM15, KIAA1429, and WTAP) were all significantly associated with each other, as well as readers and erasers. Interactions were founded to be few among the two erasers and five readers in the PPI network.
Genetic Alteration of m6A RNA Methylation Regulators in CESC
To explore the effects of genetic alteration on the expression of m6A RNA methylation regulators, the CNV and mutation were analyzed via the cBioPortal database using TCGA data (Figure 3A). The results indicated that the frequencies of genetic alteration for YTHDF1, ZC3H13, and KIAA1429 (VIRMA) were 7–8%, and the most common alteration was amplification. Frequencies for other regulators were less than 3%, suggesting that changes in the expression levels of these regulators were not caused by genetic alteration.
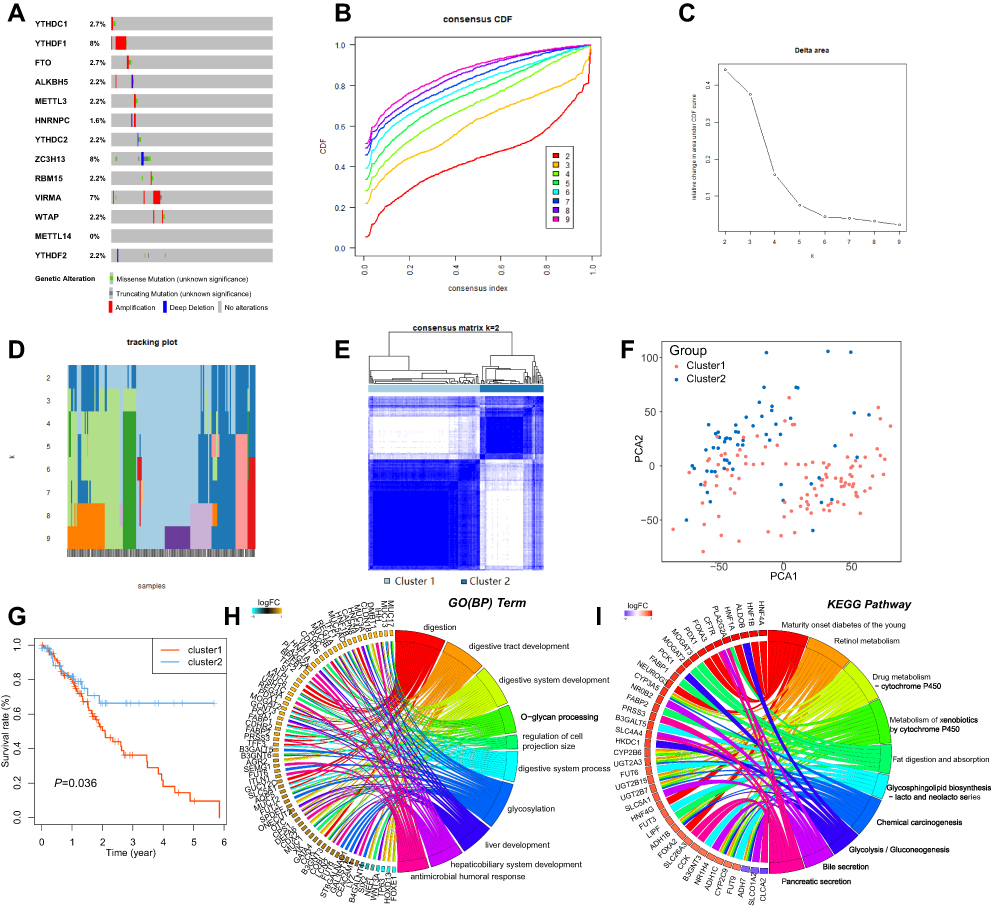 |
Figure 3 Consensus clustering identified two clusters of patients with ESCA. Notes: (A) Genetic alteration was analyzed via cBioPortal database using TCGA data. (B) The cumulative distribution function (CDF) when k ranges from 2 to 10. (C) Area under CDF curve when k ranges from 2 to 10. (D) Distribution of each sample when k ranges from 2 to 10. (E) The ESCA cohort was separated into two clusters when k = 2. (F) PCA analysis showed the separation between these two clusters. (G) The Kaplan–Meier survival analysis for Cluster 1 and 2. (H–I) Functional annotation for the DEGs between Cluster 1 and 2 by GO and KEGG analysis, respectively. |
Consensus Clustering Identified Two Clusters of Patients with ESCA
By using the “ConsensusClusterPlus” package, we tried to divide the ESCA cohort into several clusters according to the consensus of mRNA expression of the 13 m6A RNA methylation regulators. When the clustering index “k” increased from 2–9, k = 2 was demonstrated to be the optimal point to obtain the largest differences between clusters (Figure 3B and C). Meanwhile, the interference between clusters was minimal when k=2 (Figure 3D and E). Therefore, the cohort was divided into two clusters, namely Cluster 1 and Cluster 2. To validate the effect of the division, we performed principal component analysis (PCA) and found significant separation between these two clusters, indicating that the clustering was feasible (Figure 3F). Kaplan-Meier survival analysis was employed to compare the overall survival of the two clusters, and we found that Cluster 1 had a significantly worse survival outcome than Cluster 2 (Figure 3G).
Functional Annotation for Differential Expressed Genes (DEGs) Between Clusters
To explore the differences of genetic features and biological roles between these clusters, the 337 DEGs between clusters were identified. GO analysis for biological processes and the KEEG pathway analysis were conducted for these DEGs. GO-BP analysis indicated that DEGs were mainly enriched in biological processes associated with the development of the digestive system (Figure 3H). KEGG pathway analysis suggested that DEGs were enriched in Chemical carcinogenesis and metabolism pathways (Figure 3I).
Correlation Between the Clustering and Clinicopathological Features
The clinicopathological features were then compared between the two clusters. As showed in the heatmap, Cluster 1 was remarkedly correlated with advanced T stage, higher body mass index (BMI), and more likely to be adenocarcinoma (Figure 4A).
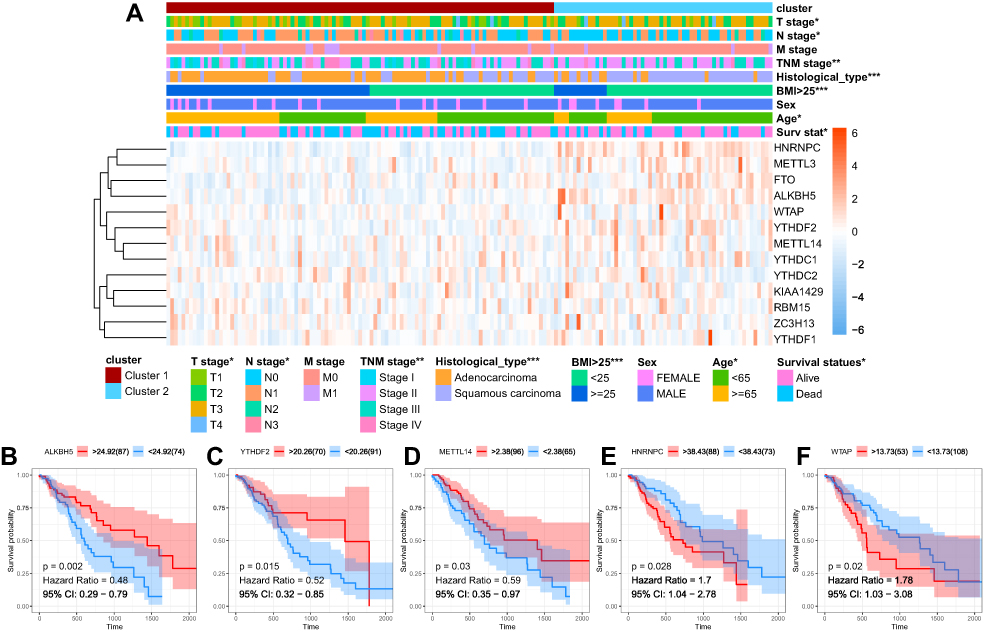 |
Figure 4 Clinical and prognostic significance of clustering. Notes: (A) The clinicopathological features were then compared between the two clusters. (B–F) Kaplan-Meier survival curve for ALKBH5, YTHDF2, METTL14, HNRNPC and WTAP. *P<0.05, **P<0.01, ***P<0.001. |
Identification of Prognostic Signature
To evaluate the prognostic significance of the m6A RNA methylation regulators in ESCA, Kaplan-Meier survival analysis was conducted for these 13 regulators, and we found that high expression levels of ALKBH5, YTHDF2, and METTL14 were associated with better survival (Figure 4B–D), while high expression levels of HNRNPC and WTAP were correlated with shorter OS (Figure 4E and F).
A prognostic signature was constructed using the LASSO Cox regression model to analyze the expression levels of m6a RNA methylation regulators (Figure 5A and B). Two regulators, namely HNRNPC and ALKBH5, were selected to construct the prognostic signature according to the minimum criterion, where the coefficient of HNRNPC was 0.0626, and the coefficient of ALKBH5 was −0.0246. The risk score for each ESCA patient was calculated with the following formula: risk score = 0.0626 * HNRNPC - 0.0246 * ALKBH5. On the basis of the median risk score, the ESCA cohort was divided into low-and high-risk groups.
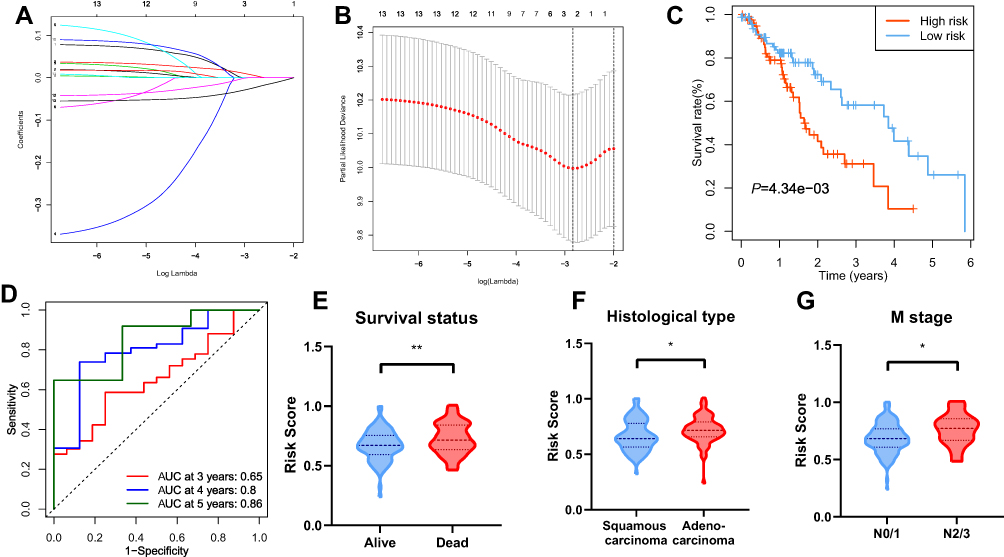 |
Figure 5 Construction of the prognostic signature. Notes: (A and B) The prognostic signature constructed by the minimum criterion of LASSO Cox regression algorithm. (C) The Kaplan-Meier survival analysis for high- and low-risk groups. (D) ROC curve was applied to assess the predictive efficiency of the signature. (E–G) Risk scores in different groups regarding survival status, histological type and M stage. *P<0.05, **P<0.01. |
Prognostic and Clinicopathological Significance of Risk Grouping in ESCA
To validate the prognostic value of risk grouping, Kaplan-Meier survival analysis was conducted and showed that patients in the high-risk group had a significantly worse overall survival than those in the low-risk group (P = 4.34e-05) (Figure 5C). Time-dependent ROC curve was employed to evaluate the specificity and sensitivity of the signature, and the result revealed that the values of area under the curve (AUC) at 3, 4, and 5 years were 0.65, 0.8, and 0.85, respectively, indicating good prediction performances (Figure 5D). The association between the risk scores and each clinicopathological feature were also examined. Patients with poor survival outcome (P<0.01), adenocarcinoma (P<0.05), and metastatic disease (P<0.05) tended to have higher risk score (Figure 5E–G). A heatmap was generated to demonstrate the differences regarding clinicopathological features, HNRNPC, and ALKBH5 mRNA expression levels in high- and low-risk groups. Notably, the high-risk group was significantly associated with advanced T stage (P < 0.05), N stage (P < 0.05), TNM stage (P < 0.01), poor survival (P < 0.05), and more likely to have adenocarcinoma (P < 0.001) (Figure 6A).
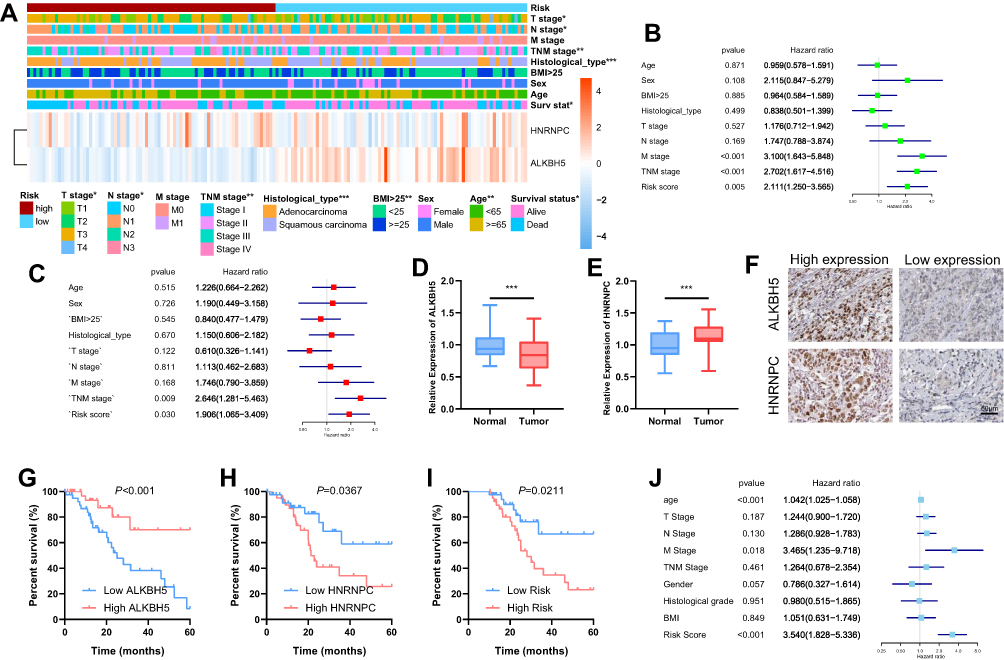 |
Figure 6 Clinical significance of risk grouping and experimental validation. Notes: (A) The clinicopathological features were then compared between the high- and low-risk groups. (B) Univariate Cox analysis of the risk score and clinicopathological features. (C) Multivariate Cox analysis of the risk score and clinicopathological features to identify the independent prognostic predictors in TCGA ESCA cohort. (D–E) mRNA levels of ALKBH5 and HNRNPC in ESCA and normal tissues were measured by qRT-PCR. (F) Representative IHC staining for ALKBH5 and HNRNPC in ESCA tissues (scale bar: 50 µm). (G and H) The Kaplan-Meier survival analysis for patients with high or low expression levels of ALKBH5 and HNRNPC. (I) The ESCA patients in the high-risk group had a significantly lower survival rate than those in the low-risk group. (J) Multivariate COX analysis was used to identify the independent prognostic predictors in the clinical ESCA cohort. *P<0.05, **P<0.01, ***P<0.001. |
The Two-Gene Prognostic Signature Was an Independent Prognostic Predictor in ESCA Cohort
Nest, univariate and multivariate Cox analyses were conducted to identify the independent prognostic predictors for ESCA patients. The univariate Cox analysis showed that the M stage (P < 0.001, HR = 3.100, 95% CI = 1.643–5.848), TNM stage (P < 0.001, HR = 2.702, 95% CI = 1.617–4.516), and risk score (P = 0.005, HR = 2.111, 95% CI = 1.123–3.565) were significantly correlated with the OS (Figure 6B). After these parameters were included into the multivariate Cox regression model, only risk score (P = 0.030, HR = 1.906, 95% CI = 1.065–3.409) and TNM stage (P = 0.009, HR = 2.646, 95% CI = 1.281–5.463) were identified as the independent prognostic factors (Figure 6C).
Experimental Validation of the Signature in a Clinical ESCA Cohort
We measured the mRNA expression of ALKBH5 and HNRNPC with qRT-PCR. ALKBH5 was downregulated in 66.25% (53/80) ESCA tissues compared with paired normal tissues (Figure 6D), and low ALKBH5 expression was associated with poor survival (Figure 6G). Further, we evaluated the expression levels of HNRNPC in ESCA and normal tissues, and found that HNRNPC was significantly upregulated in 82.5% (66/80) ESCA tissues (Figure 6E), and high level of HNRNPC was correlated with lower survival rate (Figure 6H). The differential expressions were also validated using IHC staining, and prognostic significance of the two genes was in accordance with those of TCGA (Figure 6F). A risk score was calculated for each patient within the validation cohort according to the formula and coefficient obtained from the TCGA cohort. Forty-seven patients were identified as a high-risk group, and the rest of 33 patients were categorized into a low-risk group. The Kaplan-Meier analysis demonstrated that the survival was significantly poorer in the high-risk group in comparison with that in the low-risk group (Figure 6I). Multivariate Cox analysis showed that the risk score, along with the TNM stage, was independent prognostic factor for the overall survival of ESCA patients in the validation cohort (Figure 6J).
Discussion
ESCA is one of the most common causes of cancer-related death worldwide and is, therefore, a major global health challenge.15 Surgery combined with radiotherapy, chemotherapy, targeted therapy, and immunotherapy is currently the optimal treatment of ESCA.1 The high incidence of recurrence and metastasis lead to a high mortality rate, and the survival outcome is far from satisfactory. Therefore, it is crucial to have an insight into the underlying mechanism of carcinogenesis of ESCA. The initiation and progression of ESCA is a multistep and multifactor process that involves complex interactions between genetics, epigenetics, and transcriptional alterations.2
In this study, the expression profiles of 13 m6A methylation regulators were analyzed using RNA-seq transcriptional data from the TCGA database. We found that most m6A RNA methylation regulators were abnormally expressed in ESCA, and significantly associated with clinicopathological features and overall survival of patients with ESCA. Two subgroups of the TCGA-ESCA cohort were clustered using consensus clustering according to the expression of these regulators. The survival status and clinicopathological features were significantly different between the two subgroups, indicating that the expression profiles of m6A RNA methylation regulators remarkedly associated with features of ESCA. In addition, a two-gene prognostic signature, consisting of HNRNPC and ALKBH5 was generated and showed good performance for predicting the survival outcome of ESCA. Moreover, the prognostic significance of the expression patterns of ALKBH5 and HNRNPC, as well as the prognostic signature was successfully validated in an independent ESCA cohort, suggesting that this prognostic signature is highly reliable for prognosis prediction.
A recent study16 reported that m6A demethylase ALKBH5 overexpression sensitized pancreatic ductal adenocarcinoma (PDAC) cells to chemotherapy. Decreased ALKBH5 levels remarkably increase PDAC cell proliferation, migration, and invasion both in vitro and in vivo, and predicts poor clinical outcome in PDAC. Another study by Jin et al suggested that ALKBH5 inhibited tumor growth and metastasis in vivo by reducing the expression and activity of YAP.17 Consistent with these studies, the results of our study showed that ALKBH5 is underexpressed in ESCA tissues, and low expression of ALKBH5 was associated with poor survival, indicating that ALKBH5 might act as a tumor suppressor gene in ESCA.
On the contrary, m6A binding proteins HNRNPC might be a promoter for ESCA carcinogenesis. Wu et al showed that the repression of HNRNPC in breast cancer cells MCF7 and T47D inhibited cell proliferation and tumor growth.18 Fischl et al identified that overexpression of HNRNPC has a critical role in the establishment of alternative cleavage and polyadenylation profiles characteristic of metastatic colon cancer cells.19 In line with these findings, our study demonstrated that HNRNPC is overexpressed in ESCA tissues, and its expression is negatively correlated with the overall survival of patients with ESCA.
The strength of our study is that we validated the results of bioinformatics analysis with a clinical ESCA cohort. The mRNA and protein levels of ALKBH5 and HNRNPC were measured by qRT-PCR and IHC, and the risk scores of patients in this cohort were also calculated according to the constructed prognostic signature. The results of experimental validation are consistent with those of bioinformatics prediction, indicating that the prognostic signature might serve as a promising tool for predicting survival outcomes of patients with ESCA.
In summary, the present study demonstrated that the aberrant expression of 13 m6A RNA methylation regulators is associated with the survival outcomes and clinicopathological features of patients with ESCA. A robust prognostic signature can predict the prognosis of ESCA patients and serve as an independent prognostic predictor.
Disclosure
The authors report no conflicts of interest in this work.
References
1. Smyth E, Lagergren J, Fitzgerald R, et al. Oesophageal cancer. Nat Revi Dis Primers. 2017;3(1):17048. doi:10.1038/nrdp.2017.48
2. Lagergren J, Smyth E, Cunningham D, et al. Oesophageal cancer. Lancet. 2017;390(10110):2383–2396. doi:10.1016/S0140-6736(17)31462-9
3. de Gouw D, Klarenbeek B, Driessen M, et al. Detecting pathological complete response in esophageal cancer after neoadjuvant therapy based on imaging techniques: a diagnostic systematic review and meta-analysis. J Thorac Oncol. 2019;14(7):1156–1171. doi:10.1016/j.jtho.2019.04.004
4. Huang H, Weng H, Chen J. The biogenesis and precise control of RNA mA methylation. Trends Genet. 2020;36(1):44–52. doi:10.1016/j.tig.2019.10.011
5. Chen M, Wong C. The emerging roles of N6-methyladenosine (m6A) deregulation in liver carcinogenesis. Mol Cancer. 2020;19(1):44. doi:10.1186/s12943-020-01172-y
6. Zhao W, Qi X, Liu L, et al. Epigenetic regulation of mA modifications in human cancer. Mol Ther Nucleic Acids. 2020;19:405–412. doi:10.1016/j.omtn.2019.11.022
7. Lee Y, Choe J, Park O, et al. Molecular mechanisms driving mRNA degradation by mA modification. Trends Genet. 2020;36(3):177–188.
8. Luo J, Liu H, Luan S, et al. Aberrant regulation of mRNA m⁶A modification in cancer development. Int J Mol Sci. 2018;19(9). doi:10.3390/ijms19092515.
9. Liu L, Wang J, Sun G, et al. mA mRNA methylation regulates CTNNB1 to promote the proliferation of hepatoblastoma. Mol Cancer. 2019;18(1):188. doi:10.1186/s12943-019-1119-7
10. Li H, Su Q, Li B, et al. High expression of WTAP leads to poor prognosis of gastric cancer by influencing tumour-associated T lymphocyte infiltration. J Cell Mol Med. 2020;24(8):4452–4465.
11. Yang D, Chen Z, Yu K, et al. METTL3 promotes the progression of gastric cancer via targeting the MYC pathway. Front Oncol. 2020;10:115. doi:10.3389/fonc.2020.00115
12. Zhang B, Wu Q, Li B, et al. mA regulator-mediated methylation modification patterns and tumor microenvironment infiltration characterization in gastric cancer. Mol Cancer. 2020;19(1):53. doi:10.1186/s12943-020-01170-0
13. Yang S, Wei J, Cui YH, et al. m(6)A mRNA demethylase FTO regulates melanoma tumorigenicity and response to anti-PD-1 blockade. Nat Commun. 2019;10(1):2782. doi:10.1038/s41467-019-10669-0
14. Pan H, Pan J, Ji L, et al. Carboxypeptidase A4 promotes cell growth via activating STAT3 and ERK signaling pathways and predicts a poor prognosis in colorectal cancer. Int J Biol Macromol. 2019;138:125–134. doi:10.1016/j.ijbiomac.2019.07.028
15. Bray F, Ferlay J, Soerjomataram I, et al. Global cancer statistics 2018: GLOBOCAN estimates of incidence and mortality worldwide for 36 cancers in 185 countries. CA Cancer J Clin. 2018;68(6):394–424. doi:10.3322/caac.21492
16. Tang B, Yang Y, Kang M, et al. mA demethylase ALKBH5 inhibits pancreatic cancer tumorigenesis by decreasing WIF-1 RNA methylation and mediating Wnt signaling. Mol Cancer. 2020;19(1):3. doi:10.1186/s12943-019-1128-6
17. Jin D, Guo J, Wu Y, et al. mA demethylase ALKBH5 inhibits tumor growth and metastasis by reducing YTHDFs-mediated YAP expression and inhibiting miR-107/LATS2-mediated YAP activity in NSCLC. Mol Cancer. 2020;19(1):40. doi:10.1186/s12943-020-01161-1
18. Wu Y, Zhao W, Liu Y, et al. Function of HNRNPC in breast cancer cells by controlling the dsRNA-induced interferon response. Embo J. 2018;37(23). doi:10.15252/embj.201899017
19. Fischl H, Neve J, Wang Z, et al. hnRNPC regulates cancer-specific alternative cleavage and polyadenylation profiles. Nucleic Acids Res. 2019;47(14):7580–7591. doi:10.1093/nar/gkz461
 © 2020 The Author(s). This work is published and licensed by Dove Medical Press Limited. The full terms of this license are available at https://www.dovepress.com/terms.php and incorporate the Creative Commons Attribution - Non Commercial (unported, v3.0) License.
By accessing the work you hereby accept the Terms. Non-commercial uses of the work are permitted without any further permission from Dove Medical Press Limited, provided the work is properly attributed. For permission for commercial use of this work, please see paragraphs 4.2 and 5 of our Terms.
© 2020 The Author(s). This work is published and licensed by Dove Medical Press Limited. The full terms of this license are available at https://www.dovepress.com/terms.php and incorporate the Creative Commons Attribution - Non Commercial (unported, v3.0) License.
By accessing the work you hereby accept the Terms. Non-commercial uses of the work are permitted without any further permission from Dove Medical Press Limited, provided the work is properly attributed. For permission for commercial use of this work, please see paragraphs 4.2 and 5 of our Terms.