Back to Journals » Infection and Drug Resistance » Volume 16
Construction and Validation of a Diagnostic Scoring System for Predicting Active Pulmonary Tuberculosis in Patients with Positive T-SPOT Based on Indicators Associated with Coagulation and Inflammation: A Retrospective Cross-Sectional Study
Received 3 March 2023
Accepted for publication 20 July 2023
Published 31 August 2023 Volume 2023:16 Pages 5755—5764
DOI https://doi.org/10.2147/IDR.S410923
Checked for plagiarism Yes
Review by Single anonymous peer review
Peer reviewer comments 3
Editor who approved publication: Professor Suresh Antony
Qi Yu,1,* Jinqiang Guo,2,* Fengyun Gong1
1Department of Infectious Diseases, Wuhan Jinyintan Hospital, Tongji Medical College, Huazhong University of Science and Technology, Wuhan, 430023, People’s Republic of China; 2Department of Rheumatology, Union Hospital, Tongji Medical College, Huazhong University of Science and Technology, Wuhan, 430022, People’s Republic of China
*These authors contributed equally to this work
Correspondence: Qi Yu; Fengyun Gong, Department of Infectious Diseases, Wuhan Jinyintan Hospital, Tongji Medical College of Huazhong University of Science and Technology, Wuhan, 430023, People’s Republic of China, Email [email protected]; [email protected]
Introduction: Tuberculosis (TB) is a life-threatening single infectious disease, which remains a major global public health concern. This study was to establish and validate a clinically practical diagnostic scoring system for predicting active pulmonary tuberculosis (APTB) in patients with positive tuberculosis T cell spot test [T-SPOT] using indicators associated with coagulation and inflammation.
Methods: A single-center retrospective cross-sectional study was performed to include patients with positive T-SOPT registered and hospitalized at Wuhan Jinyintan Hospital between January 2017 and December 2019. All patients were separated into the active pulmonary tuberculosis (APTB) group and the inactive pulmonary tuberculosis (IPTB) group, according to the diagnostic criteria from China’s Expert Consensus for APTB and IPTB. Subsequently, the patients were randomized into a training set and a validation set at a ratio of 2:1. Indicators associated with coagulation and inflammation, including prothrombin time activity (PTA), activated partial thromboplastin time (APTT), thrombin time (TT), fibrinogen concentration (Fbg-C), C-reactive protein/albumin ratio (CAR), C-reactive protein/prealbumin ratio (CPR), neutrophils count/lymphocyte count ratio (NLR), platelet count/lymphocyte count ratio (PLR), monocyte count/lymphocyte count ratio (MLR), and erythrocyte sedimentation rate (ESR) were obtained from electronic medical record system (EMRS). Stepwise logistic regression was performed in the training set to build a diagnostic model for predicting APTB, which was transformed into an easily applicable scoring system via nomogram. Receiver operating characteristic (ROC) analysis, calibration curve (CC), and decision curve analysis (DCA) were conducted to evaluate the predictive performance of the established diagnostic scoring system.
Results: A total of 508 patients [training set (211 cases of APTB and 116 cases of IPTB) and validation set (103 cases of APTB and 78 cases of IPTB)] with positive T-SPOT were recruited in the study. Stepwise logistic regression showed that CPR, MLR, ESR, APTT and Fbg-C were independent predictors for APTB. The scoring system was subsequently formulated based on the abovementioned predictors, which correspond to scores of 10, 6, 7, 5, and 5, respectively. In addition, patients are more likely to be diagnosed as APTB when the cut-off score was ≥ 16 scores, while patients with < 16 scores are more likely to be diagnosed as IPTB. The scoring system showed good predictive efficacy in both the training set [area under the curve (AUC): 0.887] and the validation set (AUC: 0.898). Furthermore, both CC and DCA confirmed the clinical utility of the scoring system.
Conclusion: The data suggest that the combination of indicators associated with coagulation and inflammation could serve as biomarkers to identify APTB in patients with positive T-SPOT. In addition, patients with positive T-SPOT were more prone to be diagnosed with APTB when having a combined total of scores ≥ 16 in the scoring system.
Keywords: coagulation indices, inflammatory biomarkers, scoring system, active pulmonary tuberculosis
Introduction
Tuberculosis (TB) is a life-threatening single infectious disease, which remains a major global public health concern. According to the World Health Organization (WHO) Global TB 2022 Report, there were 1.6 million deaths of TB cases worldwide in 2021.1 Over 80% of these clinical TB cases affect the lungs, which is known as pulmonary tuberculosis.2 According to China’s Expert Consensus of Inactive Pulmonary Tuberculosis3 and active Pulmonary Tuberculosis,4 IPTB was defined as asymptomatic TB patients with positive interferon-gamma release assay (IGRA) or tuberculin skin test (TST) results, lung imaging suggestive of stable tuberculosis lesions, and negative microbiological examination results (sputum smear microscopy, mycobacterial sputum culture, or nucleic acid amplification assays such as PCR and Xpert MTB/RIF), while APTB was defined as TB patients with positive mycobacterial tuberculosis cultures, or/and Xpert MTB/RIF. Numerous researches have shown that a certain proportion of IPTB may progress into APTB.5,6 Some developed countries have already included IPTB as part of the high-risk TB population for prevention and treatment.
In recent years, early determination of PTB activity has been a priority work in clinical practice. Existing diagnostic methods for APTB, including biomarker test, immunological test, histopathological test, laboratory microbiological test, and imaging test, have certain limitations.7 For example, histopathological examinations are usually invasive tests accompanied by trauma, Mycobacterium tuberculosis (MTB) cultures takes a long time before the results came out, and Xpert MTB/RIF are too expensive.7 Hence, these tests are not suitable for extension in underdeveloped or grass-roots hospitals. On the one hand, the failure to effectively and early identify APTB patients can lead to delays in treatment and thus disease progression. On the other hand, the misdiagnosis of IPTB as APTB may result in overtreatment, which may create more adverse events and drug-resistant TB, increasing the economic burden of PTB patients.8 Therefore, it is crucial to develop a method that can accurately and conveniently determine the activity of PTB, to better guide clinical diagnosis and treatment of tuberculosis.
Inflammation biomarkers, such as MLR, C-reactive protein (CRP), and high-sensitivity CRP (hs-CRP) were proven to be associated with the diagnosis of TB. Mayito et al found that MLR can be used for the early screening of HIV patients coinfected with latent Mycobacterium tuberculosis.9 CRP may be a reliable indicator for the diagnosis of TB coinfected with Pneumocystis jirovecii pneumonia,10 TB infection,11 or APTB in HIV patients.12 Also, the decreased CRP levels may suggest a significant reduction of the mycobacterium burden.13 In addition, Ciccacci et al found that hs-CRP was associated with the diagnosis and prognosis of TB.14 Changes in coagulation function of TB patients are also of great interest.15–17 Several studies have shown that the levels of coagulation indicators are altered after antituberculosis treatment in TB patients and that APTT and Fbg-C levels are also markedly higher in TB patients than in the healthy population, implicating the association between coagulation indicators and PTB activity.18 Furthermore, some scholars suggest that the interaction between coagulation and the inflammatory system in TB may be related to the increased replication of Mycobacterium tuberculosis.15 Therefore, the abovementioned markers related to inflammation and coagulation may play a role in differentiating PTB activity. In addition, indicators associated with coagulation and inflammation have the merits of easy availability, therefore the scoring system derived from these biomarkers could be effectively applied to clinical practice, especially in underdeveloped areas.
With the continuous advancement of research methods, methods of machine learning, such as nomogram, are widely applied for differential diagnosis and early identification of various diseases.19 The present study aimed to distinguish APTB from IPTB in patients with positive T-SPOT by constructing and validating a prediction model based on a combination of coagulation and inflammatory indicators. The prediction model was further transformed into a scoring system to facilitate clinical practice.
Materials and Methods
Study Design
A single-center retrospective cross-sectional study was performed to recruit participants with T-SPOT (+) who visited Wuhan Jinyintan Hospital from January 2017 to December 2019. All participants were classified as APTB and IPTB according to the diagnostic criteria from China’s Expert Consensus for APTB3 and IPTB.4 The inclusion criteria are as follows: (1) APTB: patients positive for T-SPOT with positive mycobacterial tuberculosis cultures, or/and Xpert MTB/RIF. (2) IPTB: patients positive for T-SPOT with absence of symptomatic, bacteriologic (sputum smear microscopy, mycobacterial sputum culture, or nucleic acid amplification assays such as PCR and Xpert MTB/RIF), or radiological evidence of APTB, and no history of TB. Patients with the following characteristics were excluded from this study: (1) Patients aged less than 18 years old; (2) Patients having received anti-tuberculosis treatment for more than 2 weeks before admission to our hospital; (3) Patients with other pulmonary diseases. Finally, 508 positive T-SPOT patients (314 cases of APTB and 194 cases of IPTB) were included in the study. All the eligible patients were randomized into two data sets at a ratio of 2:1, namely the training set (211 cases of APTB and 116 cases of IPTB) and the validation set (103 cases of APTB and 78 cases of IPTB) respectively, for model construction and validation. Chronic hepatitis B was confirmed by positive HbsAg and elevated plasma levels of alanine aminotransferase.
Data Processing
The baseline data including demographic characteristics (age and gender), history of diabetes mellitus, and chronic hepatitis B (positive for HbsAg), and laboratory parameters [prothrombin time activity (PTA), activated partial thromboplastin time (APTT), thrombin time (TT), and fibrinogen concentration (Fbg-C), C-reactive protein, albumin, prealbumin, neutrophils count, platelet count, monocyte count, and erythrocyte sedimentation rate (ESR)] were retrospectively extracted from individual medical records. In addition, the computing method of CAR, CPR, NLR, PLR, and MLR are shown in Supplementary Table 1. All participants’ baseline data associated with coagulation and inflammation were retrospectively collected through the EMRS of our hospital.
Statistical Analyses
SPSS software (version 22.0, IBM Corp., Armonk, NY, USA) and RStudio software (version 4.20, PBC, Boston, USA) were used for data analysis and plotting. Missing values of the included variables associated with coagulation and inflammation were multiply imputed by the missForest method. Categorical variables were expressed as absolute values (n), and differences between groups were compared by chi-square test. The Shapiro–Wilk test was conducted to determine the normality of the continuous variables (Supplementary Table 2). The continuous variables with abnormal distribution were presented as median (interquartile range, IQR) and the Mann–Whitney U-test was used for the comparison of between-group differences.
The scoring system was constructed as follows: (1) variable screening: variables with significant between-group differences (P<0.05) and an AUC greater than 0.6 in ROC analysis were selected for subsequent model construction; (2) variable transformation: the cut-off value for each variable was determined by the highest Youden index from ROC analysis, and the selected inflammatory biomarkers and coagulation indices were transformed into dichotomous variables based on their corresponding cut-off values. (3) model construction: stepwise logistic regression was conducted to determine the final parameters included in the model, and to establish a diagnostic model distinguishing APTB from IPTB. (4) construction of the scoring system: RStudio software was used to transform the diagnostic model into a nomogram and a scoring system. Detailed methods are as follows: The score of each variable (rounding to the nearest whole number) was determined by their corresponding regression coefficient in multivariable analysis by taking a score of 10 as reference (CPR with the highest regression coefficient in this study). The score of each variable was added up to get the total score of a patient. (5) assessment of the model and the scoring system: ROC curve, CC, and DCA were performed to assess the predictive performance of the model and the scoring system. (6) validation of the scoring system: internal validation of the model was performed in the validation set.
The main “R packages” used in this study included: “rms”, “mstate”, “ggDCA”, “ROCR”, “ggplot2” and “ggcorrplot”, etc. P-value < 0.05 was considered statistically significant. The description about statistical tools (“rms”, “mstate”, “ggDCA”, “ROCR”, “ggplot2”, and “ggcorrplot”) are shown in the Supplementary Materials (Additional Information 1).
Results
Patient Characteristics
There were 508 PTB patients with T-SPOT(+) in this study, including 314 APTB patients and 194 IPTB patients. The above patients were randomized into the training set (APTB: 211, IPTB: 129) and validation set (APTB: 103, IPTB: 65). Demographic, clinical, and laboratory characteristics of patients with positive T-SPOT are demonstrated in Table 1.
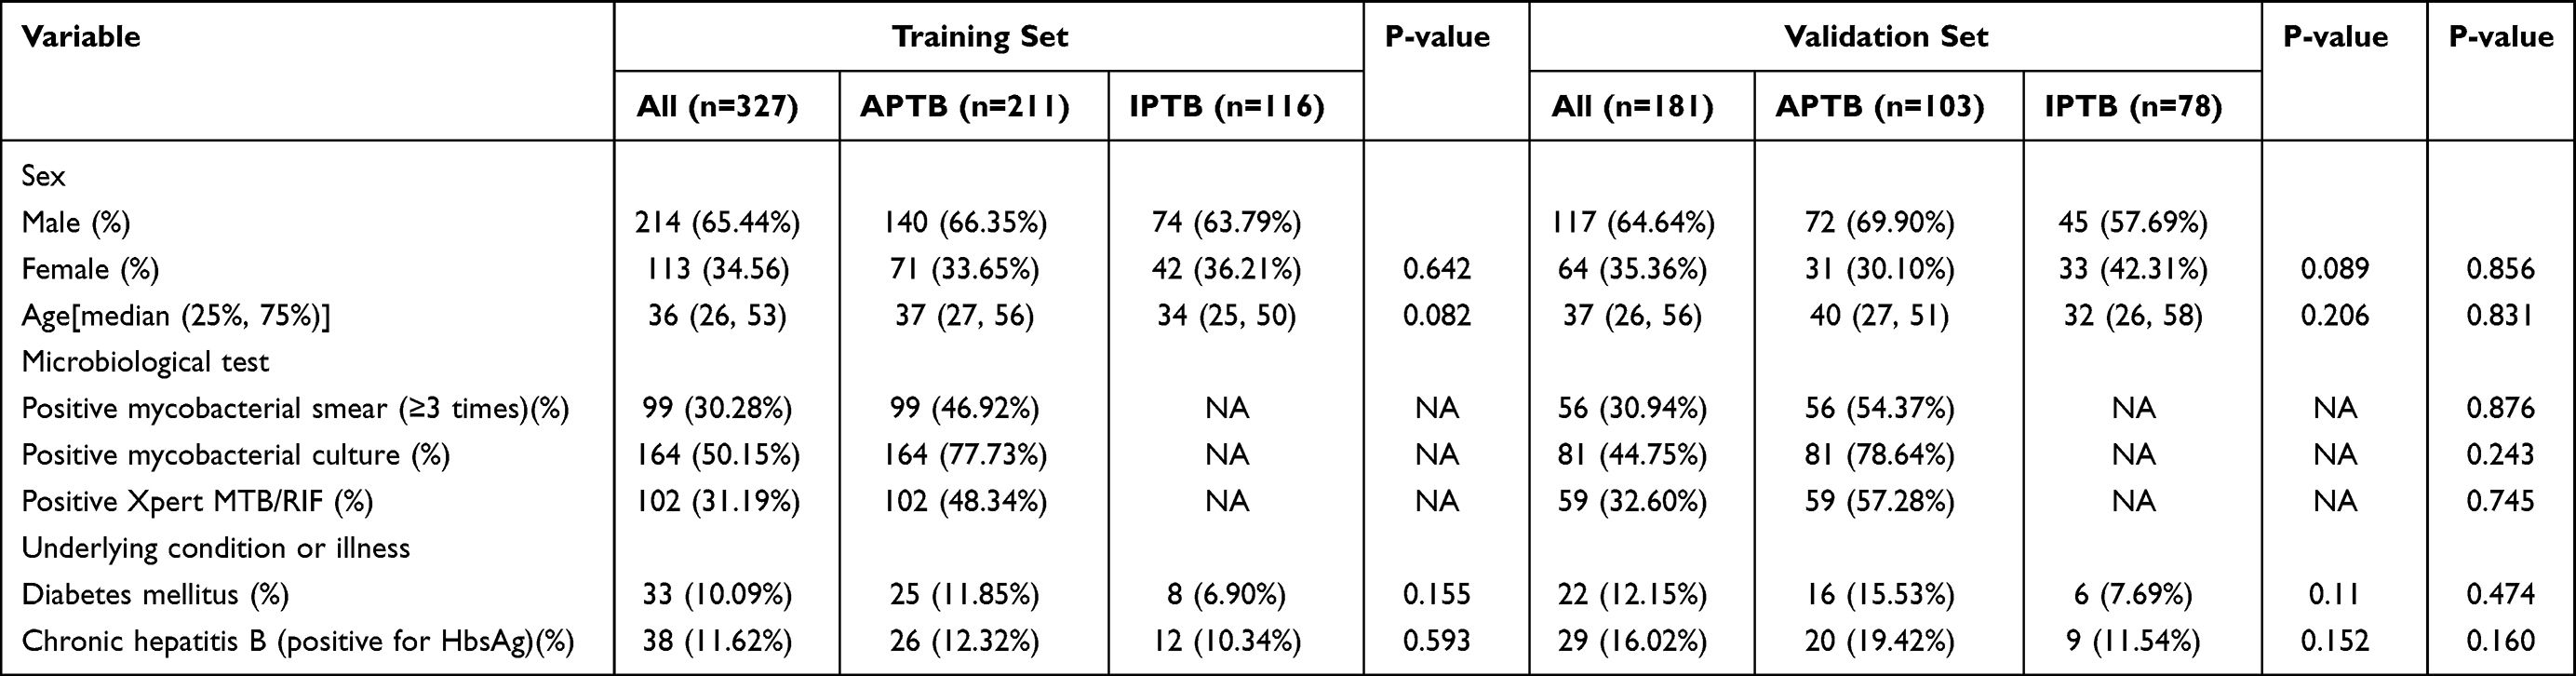 |
Table 1 Demographic, Clinical, and Laboratory Characteristics of Patients with Positive T-SPOT in the Training Set and Validation Set |
Analysis of Coagulation and Inflammatory Indices of APTB and IPTB
In the training set, the levels of PT, PTA, INR, APTT, and Fbg-C were significantly different between APTB and IPTB patients, while the levels of TT were not statistically different (Supplementary Table 3). Fbg-C had the highest AUC of 0.835 (95% CI: 0.791–0.878, P<0.001) in ROC analysis, while AUCs for PT, PTA, INR, and APTT were 0.651 (95% CI: 0.589–0.712, P<0.001), 0.668 (95% CI: 0.609–0.727, P<0.001), 0.666 (95% CI: 0.605–0.728, P<0.001), 0.653 (95% CI:0.59–0.714, P<0.001), respectively (Table 2). These results indicated that it is feasible to differentiate APTB from IPTB by indicators associated with coagulation function. Furthermore, the levels of all the inflammatory indicators, including CAR, CPR, MLR, NLR, PLR, and ESR, were markedly higher in the APTB group than in the IPTB group (Supplementary Table 3). The AUCs of CAR, CPR, ESR, NLR, MLR, and PLR were 0.847 (95% CI: 0.804–0.889, P<0.001), 0.850 (95% CI: 0.808–0.891, P<0.001), 0.831 (95% CI: 0.785–0.876, P<0.001), 0.788 (95% CI: 0.737–0.838, P<0.001), 0.793 (95% CI: 0.744–0.842, P<0.001), and 0.779 (95% CI: 0.729–0.829, P<0.001), respectively (Table 2).
 |
Table 2 The Performance of Parameters in ROC Analysis in the Training Set |
Construction of a Diagnostic Scoring System Based on Indicators Associated with Coagulation and Inflammation
The cut-off values were determined according to the Youden index in ROC analysis. Statistically significant variables with an AUC > 0.6 were transformed into binary variables for subsequent analysis. As shown in Table 3, CPR[OR(95% CI):4.95 (2.52, 9.85), P<0.001], MLR[OR(95% CI):2.59(1.29, 5.18), P=0.007], ESR[OR(95% CI):2.88(1.46, 5.69), P=0.002], APTT[OR(95% CI):2.32(1.26, 4.35), P=0.008], and Fbg-C[OR(95% CI):2.33 (1.12, 4.83), P=0.023] were independent risk factors for APTB. The results of step multivariable logistic regression analyses were subsequently transformed into a nomogram for distinguishing APTB from IPTB (Figure 1A). Figure 1B showed that the diagnostic nomogram had a high discriminatory capability with an AUC of 0.886 (95% CI: 0.851–0.921), sensitivity of 0.801, and specificity of 0.871. Both the calibration curve (Figure 1C) and the DCA (Figure 1D) demonstrated the clinical utility of the diagnostic model. Finally, the nomogram was transformed into a scoring system, in which CPR was rated 10 points, MLR 6 points, ESR 7 points, APTT 5 points, and Fbg-C 5 points (Table 4).
 |
Table 3 The Significant Indexes in the Step Multivariable Logistic Regression Analyses in the Training Set |
 |
Table 4 A Novel Scoring System Developed from a Nomogram in the Training Set |
 |
Figure 1 Calibration and clinical use of a diagnostic nomogram for discriminating APTB from IPTB. Notes: (A) Diagnostic nomogram for discriminating APTB from IPTB. (B) The ROC analysis of the diagnostic nomogram. (C) Calibration curve of the diagnostic nomogram. (D) Decision curve analysis of the diagnostic nomogram. |
Effectiveness Evaluation of the Scoring System in the Training Set
As shown in Table 5, the scoring system showed a maximum Youden index when the cut-off value of the total score was 16, and the scoring system presented the best diagnostic efficacy [AUC: 0.887 (95% CI: 0.852–0.922), sensitivity: 87.07%, specificity: 80.09%] at this point (Figure 2A). To be specific, PTB patients are more prone to be diagnosed with APTB when the aggregate score was ≥16 scores. The CC presented a satisfactory fitting degree between the predicted and actual probabilities of the scoring system (Figure 2C).
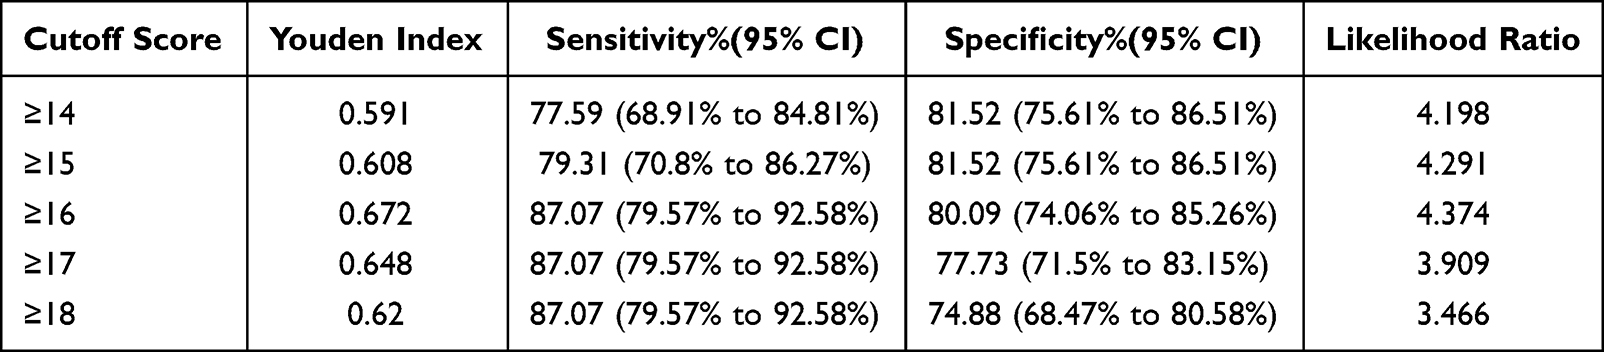 |
Table 5 ROC Analysis of the Scoring System in the Training Set |
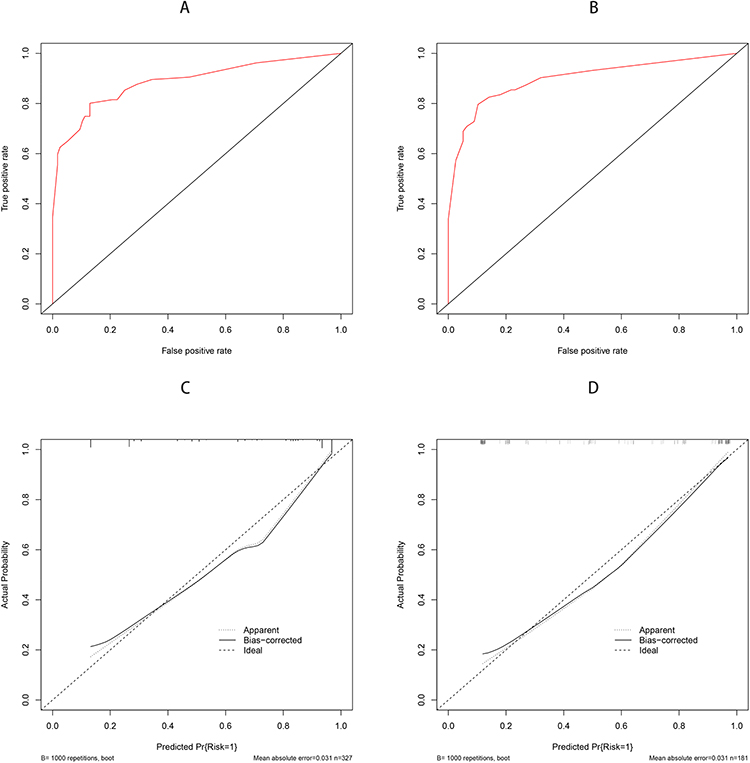 |
Figure 2 Discrimination and calibration of the scoring system for discriminating APTB from IPTB. Notes: ROC curves of the scoring system in the training set (A) and validation set (B). Calibration curves of the scoring system in the training set (C) and validation set (D). |
Internal Validation of the Diagnostic Efficacy of the Scoring System
Similarly, when the aggregate score was ≥16 scores, a good diagnostic efficacy of the scoring system was demonstrated in the validation set, as evidenced by AUC of 0.898 (95% CI: 0.852–0.944) (Figure 2B) (Supplementary Table 4). In addition, the calibration curve also presented a good result (Figure 2D).
Discussion
APTB and IPTB represent two pathogenic states in TB patients, and current guideline recommendations vary widely for treatment regimens and treatment duration of APTB and IPTB. Therefore, early, timely, and accurate identification and diagnosis of APTB or IPTB is particularly important for clinical practice. However, the limitations of existing diagnostic methods hinder the diagnosis of PTB activity from implementation and dissemination in remote and poor areas.
In this study, five parameters (CPR, MLR, ESR, APTT, and Fbg-C) were finally included in the scoring system through machine learning. To our best knowledge, this is the first scoring system for differentiating APTB from IPTB based on indicators associated with inflammation and coagulation. The scoring system has great advantages compared with traditional pathological or molecular biological methods in identification of PTB activity. Firstly, the markers included in the scoring system are easily obtainable and widely applicable, and the scoring system can also be well used in economically less developed areas because of lower time and economic costs. Secondly, the scoring system is beneficial to clinical practice because it is simple to operate. Lastly, the indicators involved in the scoring system can also reflect the changes in inflammation levels and coagulation function of APTB and IPTB patients to a certain extent.
Combined indices such as CPR and MLR are relatively routinely tested indicators in clinical practice, hence they are easy to determine compared with single inflammation indicators like interleukins. Some studies have shown that levels of CPR and MLR relate to various diseases.19–23 CPR can stratify the risk degree for patients with acute heart failure.20 It has also been shown that esophageal squamous carcinoma patients with higher preoperative MLR tend to have an unfavorable prognosis.21 Buttle et al reported the predictive value of MLR in patients with tuberculosis and found that higher MLR levels were liable to be associated with more severe disease and poorer prognosis.22 MLR can also be used to screen the coinfection of tuberculosis in HIV patients receiving antiretroviral therapy23 and to predict treatment response in TB patients with pleurisy.24 However, so far, no scholar has explored the diagnostic value of MLR and CPR to identify APTB in TB patients with positive T-SPOT. The results of this study demonstrated that CPR (AUC: 0.850) and MLR (AUC: 0.793) in APTB are higher than those in the IPTB, and had a larger diagnostic value in differentiating APTB from IPTB, which indicating that APTB had higher inflammation levels. Coagulation function in pulmonary tuberculosis attracted extensive attention in recent years. Wang et al reported that aspirin could improve the efficacy of anti-TB therapy in TB patients with type 2 diabetes mellitus comorbidity.25 Another study showed that levels of APTT and Fbg-C were markedly lower in healthy population than in TB patients and Fbg-C value decreases after anti-TB treatment,17 which was roughly consistent with the results of the present study. In addition, Fbg-C were proven valuable in assessing early therapeutic reaction in patients with HIV/MDR-TB co-infection.26
Currently, no domestic or foreign studies have reported on the determination of PTB activity based on indicators associated with coagulation and inflammation. In this study, the first diagnostic scoring system for APTB was established by combining coagulation and inflammation indicators. The scoring system was subsequently validated by data from the validation set, which further illustrated the stability and reliability of the scoring system. However, this study has some drawbacks. Firstly, the sample size used for the construction of the scoring system was small. Therefore, large multicenter researches are still required to validate the accuracy and reliability of the scoring system. Secondly, PTB patients aged less than 18 were excluded from this study, hence the predictive performance of the model in minors remains unknown. Thirdly, we excluded patients with pulmonary diseases for a more determined diagnosis of IPTB, but this will likely bias the results towards a more favorable conclusion regarding the value of the biomarkers. Lastly, there were no co-infected HIV patients included in this study, therefore the conclusion derived from our study can only be applied to patients without HIV infection.
Conclusion
In conclusion, CPR, MLR, ESR, APTT, and Fbg-C are valuable indicators in distinguishing APTB from IPTB. The diagnostic scoring system developed in this research has satisfactory predictive efficacy and could help clinicians make better clinical decisions. A patient with positive T-SPOT was more prone to be diagnosed with APTB when having a combined total of scores ≥16 in the scoring system.
Abbreviations
APTB, active pulmonary tuberculosis; IPTB, inactive pulmonary tuberculosis; ROC, receiver operating characteristic curve; AUC, area under the curve; CI, confidence interval; CAR, C-reactive protein/prealbumin ratio; CPR, C-reactive protein/prealbumin ratio; NLR, Neutrophils count/lymphocyte count ratio; MLR, monocyte count/lymphocyte count ratio; PLR, Platelet count/lymphocyte count ratio; ESR, erythrocyte sedimentation rate; PT, prothrombin time; PTA, prothrombin time activity; INR, international normalized ratio; APTT, activated partial thromboplastin time; Fbg-C, fibrinogen concentration; OR, Odds Ratio; CI, confidence interval.
Data Sharing Statement
The datasets used in this study are obtainable from the corresponding author on request.
Ethics Statement
The study was conducted according to the good clinical practice guidelines and the Declaration of Helsinki. The Ethics Committee of Wuhan Jinyintan Hospital (KY-2022-06.01) reviewed and approved this study, and approved that informed consent was signed by patients or their guardians. Informed consent was signed by the guardians of the patients only if the patients are deemed incompetent for informed consent due to their physical conditions, such as psychiatric disorders, comatose state and so on.
Acknowledgments
We thank Lin Li, Jisong Yan, and Zhe Chen for the support with data acquisition, interpretation, and analysis, and Lijuan Zheng for the support with conceptualization and supervision.
Author Contributions
All authors made a significant contribution to the work reported, whether that is in the conception, study design, execution, acquisition of data, analysis and interpretation, or in all these areas; took part in drafting, revising or critically reviewing the article; gave final approval of the version to be published; have agreed on the journal to which the article has been submitted; and agree to be accountable for all aspects of the work.
Funding
This work was supported by the Scientific Research Fund of Wuhan in Hubei Province (WX16C33).
Disclosure
All authors have no competing interests to report.
References
1. World Health Organization. Global Tuberculosis Report 2021. World Health Organization; 2022.
2. Cui EN, Yu T, Shang S-J, et al. Radiomics model for distinguishing tuberculosis and lung cancer on computed tomography scans. World J Clin Cases. 2020;8(21):5203–5212. doi:10.12998/wjcc.v8.i21.5203
3. Cheng SM, Zhou L, Zhou X. Expert consensus on diagnosis and prevention of inactive pulmonary tuberculosis. J Tuberc Lung Dis. 2021;2(03):197–201.
4. Deng F, Lu XW. Expert consensus on the criteria for determining pulmonary tuberculosis activity and its clinical application. Chin J Anti Tuberc. 2020;42(04):301–307.
5. Walter ND, Painter J, Parker M, et al. Persistent latent tuberculosis reactivation risk in United States immigrants. Am J Respir Crit Care Med. 2014;189(1):88–95. doi:10.1164/rccm.201308-1480OC
6. Gao L, Zhang H, Xin H, et al. Short-course regimens of rifapentine plus isoniazid to treat latent tuberculosis infection in older Chinese patients: a randomised controlled study. Eur Respir J. 2018;52(6):1801470. doi:10.1183/13993003.01470-2018
7. Yu Q, Yan J, Tian S, et al. A scoring system developed from a nomogram to differentiate active pulmonary tuberculosis from inactive pulmonary tuberculosis. Front Cell Infect Microbiol. 2022;12:947954. doi:10.3389/fcimb.2022.947954
8. Goldberg SV, Duchin JS, Shields T, Nolan CM. Four-month, four-drug preventive therapy for inactive pulmonary tuberculosis. Am J Respir Crit Care Med. 1999;160(2):508–512. doi:10.1164/ajrccm.160.2.9808039
9. Mayito J, Meya DB, Rhein J, Sekaggya-Wiltshire C, Hasnain SE. Utility of the monocyte to lymphocyte ratio in diagnosing latent tuberculosis among HIV-infected individuals with a negative tuberculosis symptom screen. PLoS One. 2020;15(11):e0241786. doi:10.1371/journal.pone.0241786
10. Mendelson F, Griesel R, Tiffin N, et al. C-reactive protein and procalcitonin to discriminate between tuberculosis, Pneumocystis jirovecii pneumonia, and bacterial pneumonia in HIV-infected inpatients meeting WHO criteria for seriously ill: a prospective cohort study. BMC Infect Dis. 2018;18(1):399. doi:10.1186/s12879-018-3303-6
11. Ciccacci F, Floridia M, Bernardini R, et al. Plasma levels of CRP, neopterin and IP-10 in HIV-infected individuals with and without pulmonary tuberculosis. J Clin Tuberc Other Mycobact Dis. 2019;16:100107. doi:10.1016/j.jctube.2019.100107
12. Meca AD, Turcu-Stiolica A, Bogdan M, et al. Screening performance of C-reactive protein for active pulmonary tuberculosis in HIV-positive patients: a systematic review with a meta-analysis. Front Immunol. 2022;13:891201. doi:10.3389/fimmu.2022.891201
13. Leboueny M, Siawaya ACM, Bouanga LDJ, et al. Changes of C-reactive protein and Procalcitonin after four weeks of treatment in patients with pulmonary TB. J Clin Tuberc Other Mycobact Dis. 2023;31:100348. doi:10.1016/j.jctube.2023.100348
14. Ciccacci F, Welu B, Ndoi H. High-sensitivity C-reactive protein in HIV care: tuberculosis diagnosis and short-term mortality in a cohort of Kenyan HIV patients in the DREAM programme. Int J Infect Dis. 2021;104:329–334. doi:10.1016/j.ijid.2021.01.008
15. Caccamo N, Dieli F. Inflammation and the coagulation system in tuberculosis: tissue Factor leads the dance. Eur J Immunol. 2016;46(2):303–306. doi:10.1002/eji.201546225
16. Jin H. Effect of big data analysis-based remote management combined with yangyin runfei decoction on coagulation function, pulmonary function, and quality of life of pulmonary tuberculosis patients. Comput Intell Neurosci. 2022;2022:1708133. doi:10.1155/2022/1708133
17. Verma R, Mahapatro S, Kumar A, et al. Platelet dysfunction and coagulation assessment in patients of tuberculous meningitis. Neurol Sci. 2020;41(8):2103–2110. doi:10.1007/s10072-020-04299-4
18. Akpan PA, Akpotuzor JO, Osim EE. Haemostatic Indices as Markers for Monitoring Pulmonary Tuberculosis Treatment. Niger J Physiol Sci. 2018;33(1):31–35.
19. de O Souza Filho JB, de Seixas JM, Galliez R, et al. A screening system for smear-negative pulmonary tuberculosis using artificial neural networks. Int J Infect Dis. 2016;49:33–39. doi:10.1016/j.ijid.2016.05.019
20. Yamada T, Haruki S, Minami Y, Numata M, Hagiwara N. The C-reactive protein to prealbumin ratio on admission and its relationship with outcome in patients hospitalized for acute heart failure. J Cardiol. 2021;78(4):308–313. doi:10.1016/j.jjcc.2021.05.009
21. Maruyama S, Okamura A, Kanie Y, et al. C-reactive protein to prealbumin ratio: a useful inflammatory and nutritional index for predicting prognosis after curative resection in esophageal squamous cell carcinoma patients. Langenbecks Arch Surg. 2022;407(5):1901–1909. doi:10.1007/s00423-022-02508-6
22. Buttle TS, Hummerstone CY, Billahalli T, et al. The monocyte-to-lymphocyte ratio: sex-specific differences in the tuberculosis disease spectrum, diagnostic indices and defining normal ranges. PLoS One. 2021;16(8):e0247745. doi:10.1371/journal.pone.0247745
23. Gatechompol S, Sophonphan J, Kerr SJ, et al. Monocyte-to-lymphocyte ratio as a predictor of TB among people living with HIV. Int J Tuberc Lung Dis. 2021;25(11):933–938. doi:10.5588/ijtld.21.0300
24. Sukson P, Liwsrisakun C, Inchai J, Trongtrakul K, Tajarernmuang P. Peripheral blood monocyte to lymphocyte ratio for prediction of tuberculous pleuritis. Int J Infect Dis. 2021;112:212–216. doi:10.1016/j.ijid.2021.09.033
25. Wang W, Du Z, Ni M, et al. Aspirin enhances the clinical efficacy of anti-tuberculosis therapy in pulmonary tuberculosis in patients with type 2 diabetes mellitus. Infect Dis. 2020;52(10):721–729. doi:10.1080/23744235.2020.1778177
26. Cudahy PGT, Warren JL, Cohen T, Wilson D. Trends in C-reactive protein, D-Dimer, and fibrinogen during therapy for HIV-associated multidrug-resistant tuberculosis. Am J Trop Med Hyg. 2018;99(5):1336–1341. doi:10.4269/ajtmh.18-0322
 © 2023 The Author(s). This work is published and licensed by Dove Medical Press Limited. The
full terms of this license are available at https://www.dovepress.com/terms
and incorporate the Creative Commons Attribution
- Non Commercial (unported, 3.0) License.
By accessing the work you hereby accept the Terms. Non-commercial uses of the work are permitted
without any further permission from Dove Medical Press Limited, provided the work is properly
attributed. For permission for commercial use of this work, please see paragraphs 4.2 and 5 of our Terms.
© 2023 The Author(s). This work is published and licensed by Dove Medical Press Limited. The
full terms of this license are available at https://www.dovepress.com/terms
and incorporate the Creative Commons Attribution
- Non Commercial (unported, 3.0) License.
By accessing the work you hereby accept the Terms. Non-commercial uses of the work are permitted
without any further permission from Dove Medical Press Limited, provided the work is properly
attributed. For permission for commercial use of this work, please see paragraphs 4.2 and 5 of our Terms.