")
Back to Journals » Patient Related Outcome Measures » Volume 11
Confirmatory Factor Analyses and Differential Item Functioning of the Patient Experience with Treatment and Self-Management (PETS vs. 2.0): A Measure of Treatment Burden
Authors Lee MK, St Sauver JL , Anderson RT, Linzer M, Eton DT
Received 18 September 2020
Accepted for publication 19 November 2020
Published 5 January 2021 Volume 2020:11 Pages 249—263
DOI https://doi.org/10.2147/PROM.S282728
Checked for plagiarism Yes
Review by Single anonymous peer review
Peer reviewer comments 2
Editor who approved publication: Professor Lynne Nemeth
Minji K Lee,1 Jennifer L St Sauver,1,2 Roger T Anderson,3 Mark Linzer,4 David T Eton1,2
1Robert D. and Patricia E. Kern Center for the Science of Health Care Delivery, Mayo Clinic, Rochester, MN, USA; 2Department of Health Sciences Research, Mayo Clinic, Rochester, MN, USA; 3Department of Public Health Sciences, University of Virginia School of Medicine, Charlottesville, VA, USA; 4Hennepin Healthcare, Minneapolis, Minnesota, USA, University of Minnesota Medical School, Minneapolis, MN, USA
Correspondence: Minji K Lee
Robert D. and Patricia E. Kern Center for the Science of Health Care Delivery, Mayo Clinic, Harwick Building, Second Floor, 200 First St SW, Rochester, MN 55905, USA
Tel +1 507 284 1310
Email [email protected]
David T Eton Email [email protected]
Purpose: To examine the factor structure and differential item functioning (DIF) of the Patient Experience with Treatment and Self-management (PETS version 2.0), a measure of treatment burden.
Patients and Methods: Version 2.0 of the PETS has 60 items, extending the previously-validated 48-item version 1.0 by three domains (nine items) and three additional items in an existing domain. We conducted confirmatory factor analyses (CFA) on survey responses of 439 community-dwelling adults living with multiple chronic conditions who completed PETS version 2.0, using R packages, “lavaan” and “semTools.” We tested fit of second-order factors to explore simplifying the reporting of PETS scores. We examined DIF for the two second-order factors with “lordif” R package, testing groups by gender, education, and health literacy, using the McFadden pseudo R2 change criterion of ≥ 0.02 to flag items with DIF. Cronbach’s alpha and the intraclass correlation coefficient (ICC) were used to determine the reliability of PETS domains.
Results: The first-order CFA model featuring 12 multi-item domains had an excellent fit (Comparative Fit Index [CFI]=0.989), as did the second-order CFA model (CFI=0.987), specifying two superordinate factors of treatment burden (workload and impact). Items in the workload and impact second-order factors did not show any DIF across gender, education, and health literacy groups as shown by McFadden pseudo R2 changes < 0.02. Cronbach’s alphas for all multi-item domain scales were ≥ 0.80, and ICCs of ten scales were ≥ 0.70, meeting the threshold for adequate test–retest reliability.
Conclusion: Findings support the construct validity and reliability of PETS version 2.0. The fit of a factor model featuring superordinate (ie, second-order) factors of workload and impact supports index scoring that will simplify reporting of PETS scores. DIF analyses indicate that items from these indices can be interpreted in the same way, regardless of gender, education, or health literacy.
Keywords: factor structure, patient-reported outcomes, multi-morbidity, psychometric testing, questionnaire, validation
Introduction
The Patient Experience with Treatment and Self-management (PETS) questionnaire is a comprehensive, multi-domain measure of patient-perceived treatment burden – the workload and associated stressors of treatment and self-management for chronic conditions and their impact on functioning and well-being. Leveraging a patient-derived conceptual framework of treatment burden,1 confirmatory factor analysis (CFA) was performed previously on a 48-item version of the PETS (version 1.0) featuring 46 items distributed into nine multi-item domains and two single-item indicators (see Figure 1A).2 A 9-factor measurement model was supported by the CFA, representing the nine hypothesized multi-item domains with two single-item indicators of medication bother analyzed separately. In this prior analysis, three content domains identified in the original conceptual framework (namely, diet, exercise/physical therapy, and medical equipment) were set aside due to excessive missing data resulting from yes/no screening questions used with each domain. Hence, the full measurement model of the PETS has not yet been empirically tested.
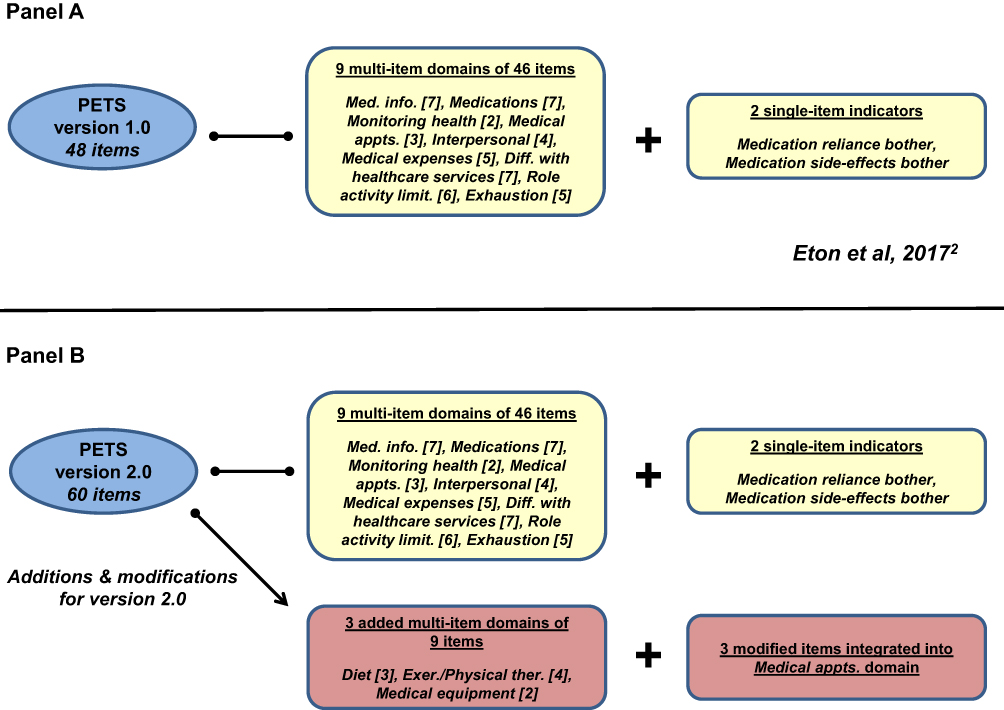 |
Figure 1 Content of PETS version 1.0 (A) and PETS version 2.0 (B). Abbreviation: PETS, Patient Experience with Treatment and Self-management. Note: Additions and modifications for version 2.0 are indicated in the red boxes. |
The purpose of the present analyses is to examine the factor structure of the full 60-item PETS measure (version 2.0) in a community sample of people living with multiple chronic conditions (MCCs). As shown in Figure 1B, the PETS version 2.0 includes the domains and single-item indicators of version 1.0 plus the three previously untested domains of diet, exercise/physical therapy, and medical equipment,2 representing nine additional items. Furthermore, three other items slightly modified in wording in version 2.0 from PETS version 1.0 were newly integrated into the burden with medical appointments domain and analyzed with the already existing items of that domain. Hence, the current test adds 12 items to the previously confirmed 48-item PETS model. In this analysis we test a 12-factor measurement model consisting of the 12 multi-item domains of the original patient-informed conceptual framework of the PETS.1,2 To promote parsimony and use of the measure in both research and clinical practice settings, we will also examine a way to simplify the reporting of PETS scores by testing whether certain conceptually-similar content domains reside within common “superordinate” factors. This could support aggregation of certain individual content domains into summary index scores to facilitate the use and reporting of PETS scores. As differential item functioning (DIF) has never been scrutinized for the PETS measure, we will also test DIF of items when analytically appropriate. Questionnaire items may take on a different meaning across different groups of people with the same latent ability or quality when DIF is present and therefore can reflect measurement bias. Finally, both internal consistency and test–retest reliability will be determined for all domain scales of the PETS.
Materials and Methods
Study Population and Sample
Resources of the Rochester Epidemiology Project (REP) research infrastructure were used to identify English-speaking adults (≥20 years of age) living with MCCs in Olmsted County, Minnesota, USA between July 1, 2015 and June 30, 2016.3 The REP links medical records of local healthcare providers for almost all residents of Olmsted County in southeast Minnesota; hence, it can serve as a population-based sampling frame for residents of the region.4 Surveys were mailed to a random sample of 1,496 persons with MCCs stratified by age (20–49, 50–64, 65+), race (white, non-white), number of medical-record confirmed diagnosed conditions (2–3, 4+), and presence/absence of at least one “incident” condition (a condition diagnosed within the past year). Eligible persons were those who had received an International Classification of Diseases (ICD) diagnostic code from one of their healthcare providers for one or more of 20 chronic conditions identified by the Department of Health and Human Services as public health priorities for the nation.5,6 Furthermore, persons with ICD codes for anxiety, hearing problems, vision problems, irritable bowel/Crohn’s disease, atopic dermatitis/psoriasis, back problems, or headaches were also included as these conditions were identified by our clinical co-investigators as having high treatment burden. Persons with severe cognitive impairments such as dementia or severe mental illness such as psychotic disorder, as identified by ICD codes, were excluded.
Study Measures
Version 2.0 of the PETS was used to assess treatment burden. This 60-item version extends the previously-validated, 48-item version 1.0 by nine items, representing three previously untested content domains (diet, exercise/physical therapy, and medical equipment) and three modified items added to the existing medical appointments domain (having the time, the energy, and transportation to get to medical appointments). The latter items were modified from version 1.0 so that a single response scale could be used for all items within the medical appointments domain. Other PETS content domains include medical information, medications, monitoring health, interpersonal challenges, medical expenses, difficulty with healthcare services, role/social activity limitations due to self-management, physical/mental exhaustion due to self-management, and the two single item indicators of bother with reliance on medication and bother with medication side-effects. Item content is available in the table displaying results of the factor analysis (see below). Note that the two single-item indicators of medication bother were not included in the factor analyses because single items do not represent underlying factors. PETS items use either four- or five-point response scales depending on the content domain. Items querying medical information, medications, medical appointments, monitoring health, medical equipment, and medical expenses use a five-point scale that ranges from “very easy” to “very difficult.” Items querying diet, exercise/physical therapy, and difficulty with healthcare services use a four-point scale that ranges from “strongly agree” to “strongly disagree.” Items querying medication bother, interpersonal challenges, and role/social activity limitations use a five-point scale that ranges from “not at all” to “very much.” Finally, items querying physical/mental exhaustion use a five-point scale that ranges from “never” to “always.” The recall time frame for PETS items is the past 4 weeks.
A validated single-item screener was used to assess subjective health literacy:
How often do you have problems learning about your medical condition because of difficulty understanding written information? (all of the time, most of the time, some of the time, little of the time, none of the time)7
Demographic data on age, race/ethnicity, marital, education, and employment status were also collected on the survey. Data on gender as well as the number and types of chronic conditions were extracted from the electronic medical record.
Procedure
A survey booklet consisting of the PETS and the other measures, a cover letter, and a privacy authorization form (HIPAA) were mailed to the eligible sample of persons along with a stamped envelope for return of the completed survey. The first 100 survey responders were contacted by phone by a research assistant and asked to complete the PETS again within 3 weeks to determine test–retest reliability. Participants were compensated $10 for completing the full survey battery and an additional $5 for completion of the PETS re-test. The study was approved as “minimal risk with the use of oral consent” by Institutional Review Boards at the Mayo Clinic (IRB# 14–008629) as well as the Olmsted Medical Center (IRB# 022-OMC-16), institutional co-administrators of the REP. Oral consent was provided in the form of a cover letter describing the survey procedures and consent to participate was implied based on the return of a completed survey (the need for a signed consent form was waived by the IRBs of record). Hence, those who returned a completed survey provided their consent to participate in the study and are represented in this report. A signed HIPAA form was required prior to using any protected health information extracted from the medical record. All procedures performed in this study involving human participants were in accordance with the ethical standards of the institutional and/or national research committee and with the 1964 Helsinki declaration and its later amendments or comparable ethical standards.
Data Analyses
Confirmatory Factor Analyses (First-Order CFA)
We investigated the factor structure of the full model with 12 hypothesized multi-item factors in two steps. As noted above, the two medication bother items were removed from the CFA. Hence, the measurement model included 58 of the 60 items of version 2.0.
Step 1. We replicated the CFA model in Eton et al2 with nine multi-item factors, but added the three modified medical appointments items to the existing domain of the same name. Hence, the CFA model tested in this step featured nine correlated factors.
Step 2. We fit a separate CFA model that includes the nine correlated factors of step 1 plus the three multi-item domains excluded in the previous validation (12 factors total).2 Question sets on diet, exercise/physical therapy, and medical equipment each begin with a yes/no screening question to indicate the relevance to the respondent. These include the following questions for diet, exercise/physical therapy, and medical equipment, respectively:
1) Has a doctor, nurse, or other healthcare provider discussed or given you recommendations for healthy eating, including specific foods to avoid because of your health problems/illnesses?
2) Has a doctor, nurse, physical therapist, or other healthcare provider discussed or recommended exercise or physical therapy specifically for your health problems/illnesses?
3) Do you currently use any medical equipment or devices?
If the answer to the screening question is “no” then the respondent is asked to skip the domain items.
The CFAs were conducted using the R packages “lavaan” and “semTools,” with polychoric correlation matrices and weighted least squares with adjustments for mean and variance (WLSMV) estimation, which is appropriate for ordered categorical data. We determined model fit using standard criterion and accepted benchmarks: Comparative Fit Index (CFI≥0.95), Standardized Root Mean square Residual (SRMR<0.08), and Root Mean Square Error of Approximation (RMSEA≤0.06).8
Confirmatory Factor Analyses (Second-Order CFA)
When factors are highly correlated, a second-order analysis can provide a broader level of generalization than a first-order analysis.9 Based on construct similarity and inter-domain correlations that have been observed in previous studies using the PETS,2,10,11 we hypothesized two second-order factors: a workload factor consisting of the medical information, medications, medical appointments, and monitoring health domains (ie, domains assessing difficulty in doing various tasks associated with self-management of health conditions) and an impact factor consisting of the role/social activity limitations and physical/mental exhaustion domains (ie, domains assessing the impact of self-management on daily functioning and well-being).
Bifactor Model for Workload and Impact Factors
We investigated whether the items in the workload and impact factors fit the confirmatory bifactor graded response models. These models let us investigate the strength of general factor loadings in the presence of group factor loadings, before DIF analyses based on unidimensional item response theory can be undertaken with these items. We used maximum likelihood estimation under the item response theory paradigm with the multidimensional item response theory “mirt” R package.12 The original designation of items within medical information, medications, medical appointments, and monitoring health domains was used as the group factors for the workload construct. For the impact construct, the group factors were also the original membership of the items, role/social activity limitations, and physical/mental exhaustion. The comparative model fit was evaluated using  statistic (ie, a goodness of fit statistic that uses univariate and bivariate residuals, which shows good fit when P<0.05),13 RMSEA (<0.08), and CFI (≥0.95).14,15
General Factors in Workload and Impact
In order to justify the use of the DIF methods using item response theory, we tested whether a general factor runs through the second-order factors of workload and impact. When several highly related domains comprise the general construct of interest, the explained common variance (ECV) and coefficient omega hierarchical (ωH) can be used to index the degree of a general factor16,17 in workload and impact. Lastly, standardized loadings on the general factor greater than 0.30 in the bifactor model could indicate a well-defined overarching factor even in the presence of the domain factors.16,18,19
Differential Item Functioning
The R software package, lordif,20 was used to evaluate DIF in workload and impact. Lordif assesses DIF using a hybrid of ordinal logistic regression and item response theory (IRT) framework. The main objective of fitting an IRT model under lordif is to obtain IRT trait estimates to serve as matching criterion. We conducted DIF analyses when factors had at least 10 items in order to have reliable trait estimates as matching criterion. This led to DIF analyses of two second-order factors – the workload factor has 22 items and the impact factor has 11 items, so both are suitable for DIF analyses. The individual content domains consisted of between two and seven items each and were therefore not suitable for this particular type of DIF analysis. In this framework, a base model (model 1) posits that only the trait level predicts responses. A second model (model 2) has both trait level and group as independent variables. If model 2 predicts item responses statistically significantly better than model 1, then DIF has a consistent impact across trait levels (uniform DIF). If the model with an interaction term (model 3) fits significantly better than model 2, then the impact of DIF varies by trait level (non-uniform DIF). If model 3 fits significantly better than model 1, there is overall or total DIF.
McFadden pseudo R2 change criterion of ≥0.02 was used to flag items for DIF.21 A value of pseudo R2 less than 0.02 indicates a lack of evidence of differential interpretation of an item across the tested groups. Three groups considered were gender, education (college graduate vs some college or below), and health literacy (no difficulty understanding written medical information vs at least some difficulty understanding written medical information). Gender, education, and health literacy have been used as grouping variables in studies of DIF in PROMIS measures.22,23
Reliability
Two recognized forms of reliability for patient-reported health status measures were determined: internal consistency and test–retest.24,25 Cronbach’s alpha coefficients were computed for all multi-item domains to determine internal consistency reliability. The intraclass correlation coefficient (ICC) was used to determine test–retest reliability of all PETS domains, including the two single-item indicators, over a brief time interval (no more than 3 weeks). Consistent with current recommendations for patient-reported measures (see Qin et al26), to assess test–retest reliability the ICC formula used was derived from the two-way mixed-effect analysis of variance model with interaction for the absolute agreement between single scores.
Results
Characteristics of Survey Responders
Of the 1,496 people mailed a survey, two had died prior to its receipt. Of the 1,494 remaining in the sample, 443 returned a completed survey (30% response). In comparison to the 1,053 non-responders, the 443 responders were older, more likely to be white than of a minority race, and had slightly more diagnosed conditions (Ps<0.0001; data not shown). Regarding specific conditions, the following were significantly more prevalent among survey responders than non-responders: arrhythmia, hyperlipidemia, arthritis, cancer, and vision problems (Ps<0.05; data not shown). Hepatitis was slightly less prevalent among responders than among non-responders (P<0.05). Four responders were excluded prior to data analysis due to a diagnosis of an exclusionary condition identified after the original sampling. Hence, the final analyzed sample was 439.
Table 1 shows sample descriptive characteristics. The mean age was 60.3 years (range: 20–98 years), and there were more women than men (62% vs 38%). Most (77%) reported their race as White/Caucasian, were college-educated (73%), married or in a partnered relationship (59%), and currently not employed (57%). The median number of diagnosed conditions was five, with the most commonly observed diagnoses among respondents being hypertension (53%), hyperlipidemia (52%), low back disorder (51%), arthritis (47%), and diabetes (47%). Mental health conditions (depression and anxiety), vision problems, cardiac arrhythmia, and cancer were also common (>25%). Among all diagnoses, only a small proportion (6%) reflected an incident condition that had been diagnosed within the past year. The majority (65%) of the patients reported no problem with health literacy, while 35% had some difficulty with it.
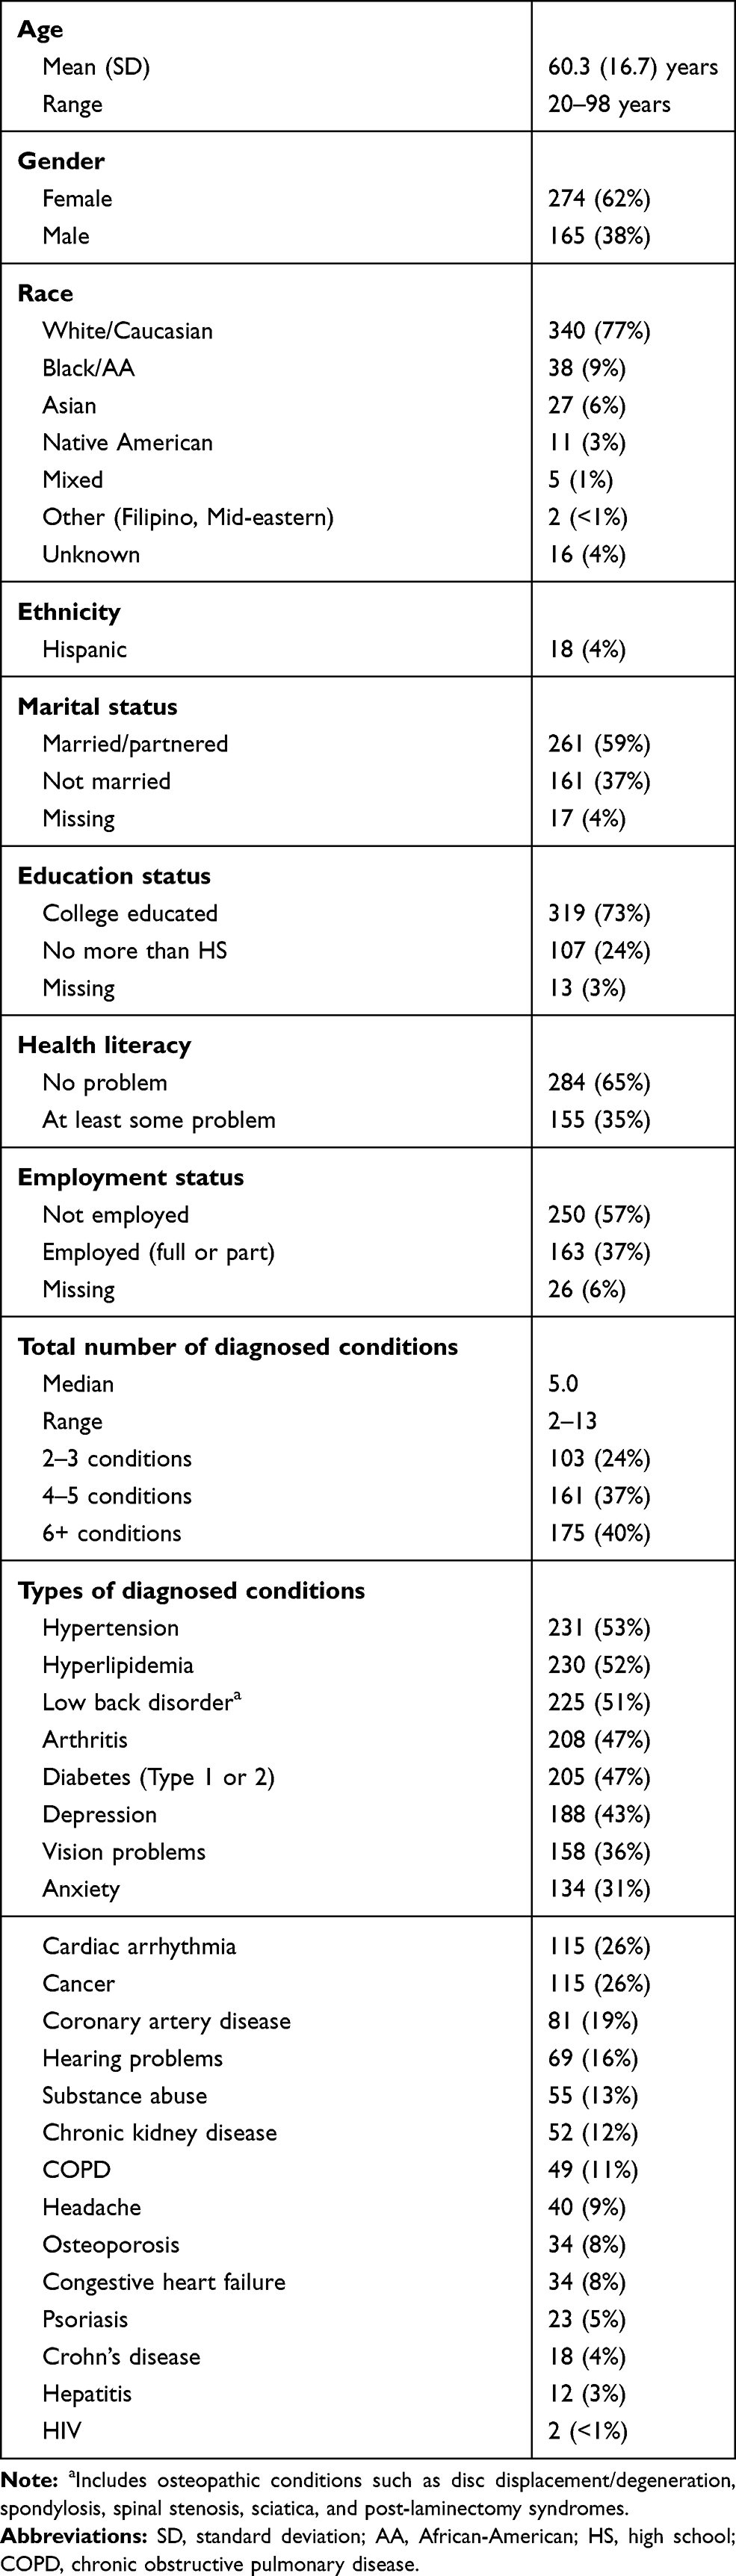 |
Table 1 Descriptive Characteristics of Survey Responder Sample (N=439) |
Confirmatory Factor Analyses (First-Order CFA)
Step 1. The CFA model with nine correlated factors (the first nine domains in Table 2) had excellent fit (χ2(1,091)=1,626.5 with P<0.001, CFI=0.991, RMSEA=0.033 [90% confidence interval (CI): 0.030–0.037], and SRMR=0.051). All item factor loadings were at least 0.68.
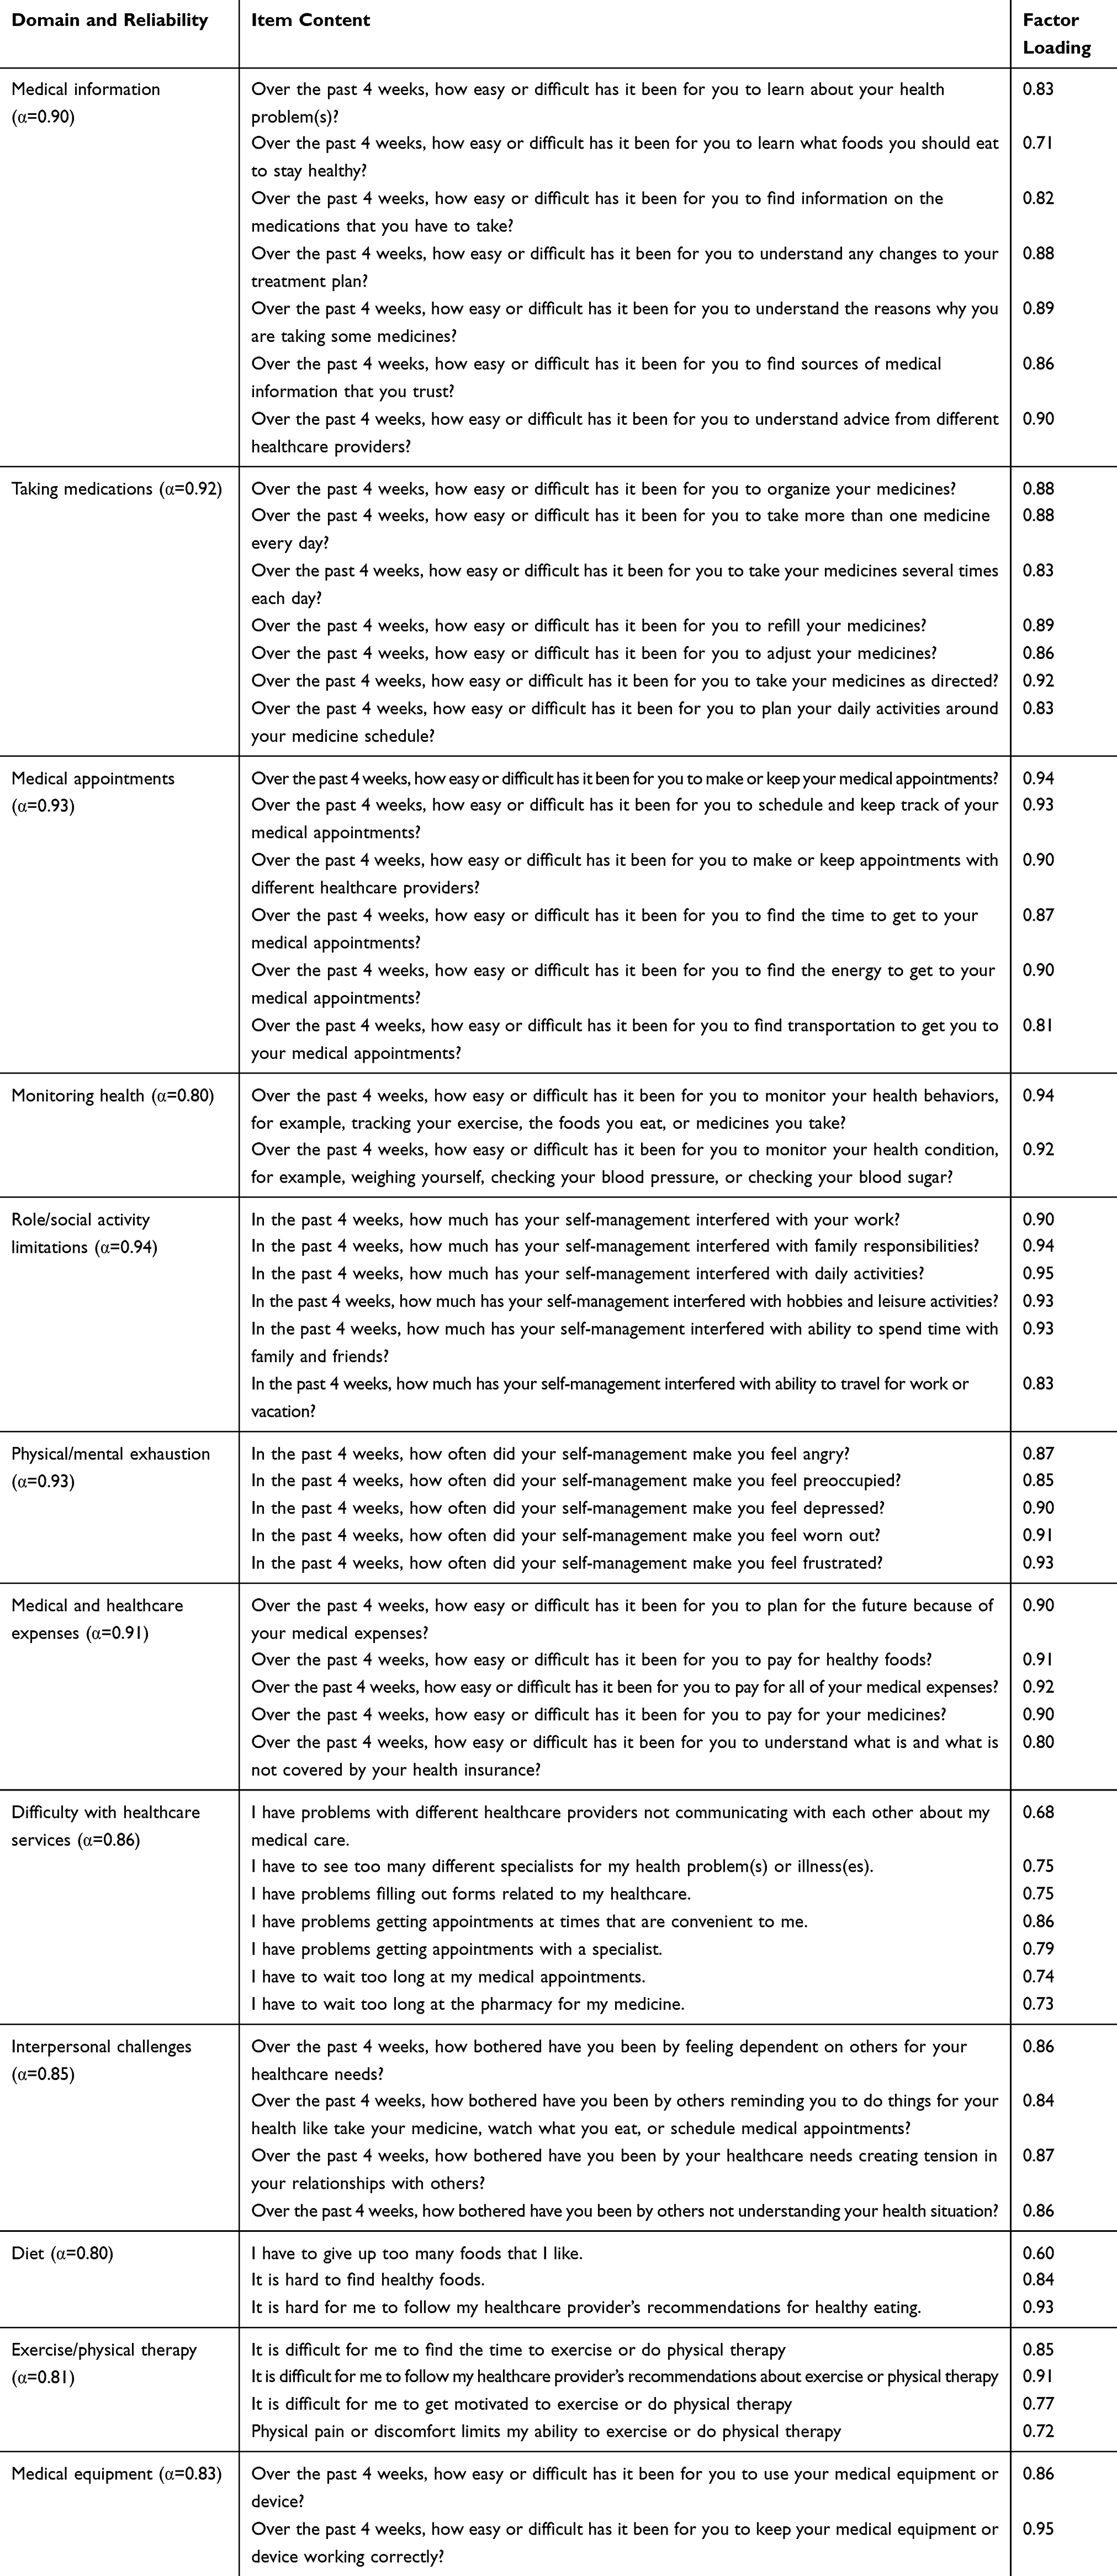 |
Table 2 Content of Items Within Each Domain of the Original Model (12 Factors and 58 Items), Standardized Factor Loadings, and Internal Consistency Reliability (Cronbach’s Alpha) |
Step 2. The overall CFA model integrating the three previously untested factors of diet, exercise/physical therapy, and medical equipment with the nine correlated factors of step 1 (ie, 12 factors total) also had excellent fit (χ2(1,529)=2,181.8. P<0.001, CFI=0.989, RMSEA=0.031 [90% CI: 0.028–0.034], and SRMR=0.057). Table 2 shows the content of the items, the factor loadings, and the Cronbach’s alphas for each of the 12 domains. All item factor loadings were at least 0.60. Table 3 shows the variance and correlations among factors supported in the overall CFA model.
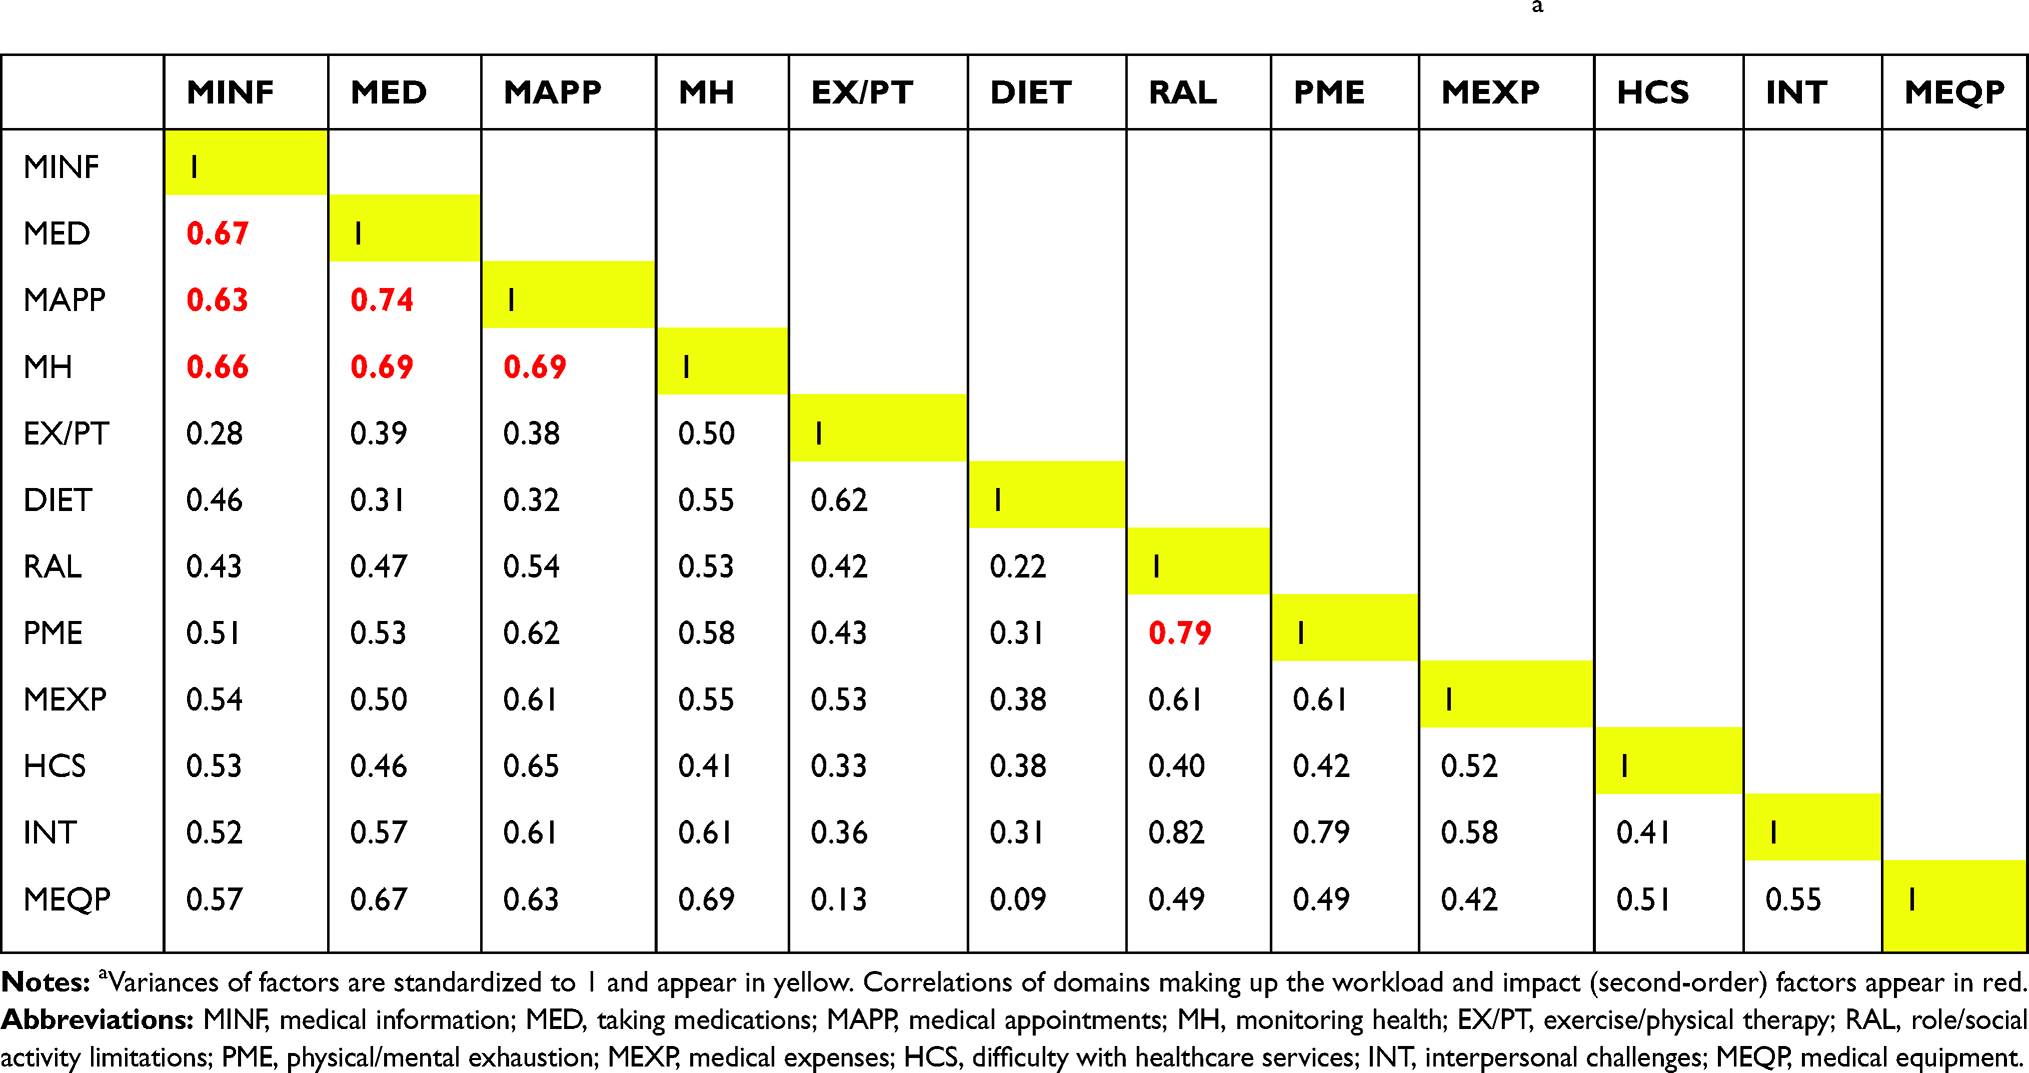 |
Table 3 Factor Correlations (Below Diagonal) and Variances (on Diagonal) of the 12-Factor Modela |
Confirmatory Factor Analyses (Second-Order CFA)
The second-order CFA tests the fit of a model specifying superordinate factors. If supported, this could justify greater parsimony in the reporting of PETS scores by combining closely related domains into aggregated index scores. Relatively high factor inter-correlations from the final first-order CFA model (see Table 3) as well as the similarity of content of these highly correlated domains justifies the testing of the two hypothesized superordinate factors of workload and impact. Workload consists of the medical information, medications, medical appointments, and monitoring health domains. Inter-correlations of these four domains ranged from r=0.63–0.74. Impact consists of the role/social activity limitations and physical/mental exhaustion domains. These domains were correlated at r=0.79.
The fit of the second-order CFA model was excellent (χ2(1,561)=2,177.1. P<0.001, CFI=0.987, RMSEA=0.030 [90% CI: 0.027–0.033], and SRMR=0.060). The item-to-factor loadings were almost identical as those of the first-order 12-factor model. When there were differences in item-to-factor loadings, they were small (≤0.10). Table 4 shows the second-order to first-order factor loadings, which were at least 0.57 across domains. The final factor model of the PETS version 2.0 featuring both first- and second-order (superordinate) factors appears in Figure 2.
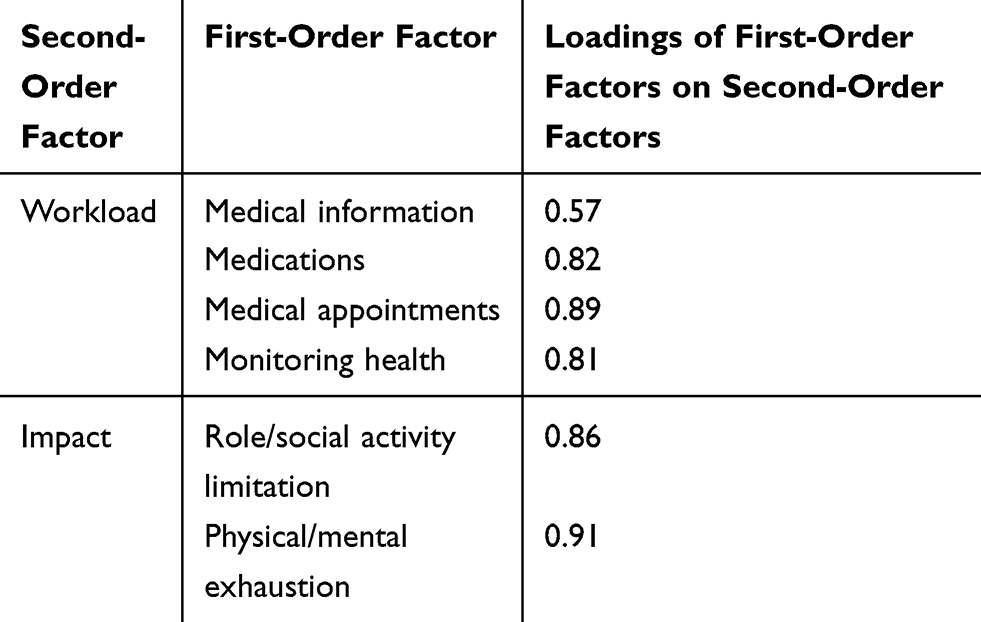 |
Table 4 Standardized First-Order to Second-Order Factor Loadings |
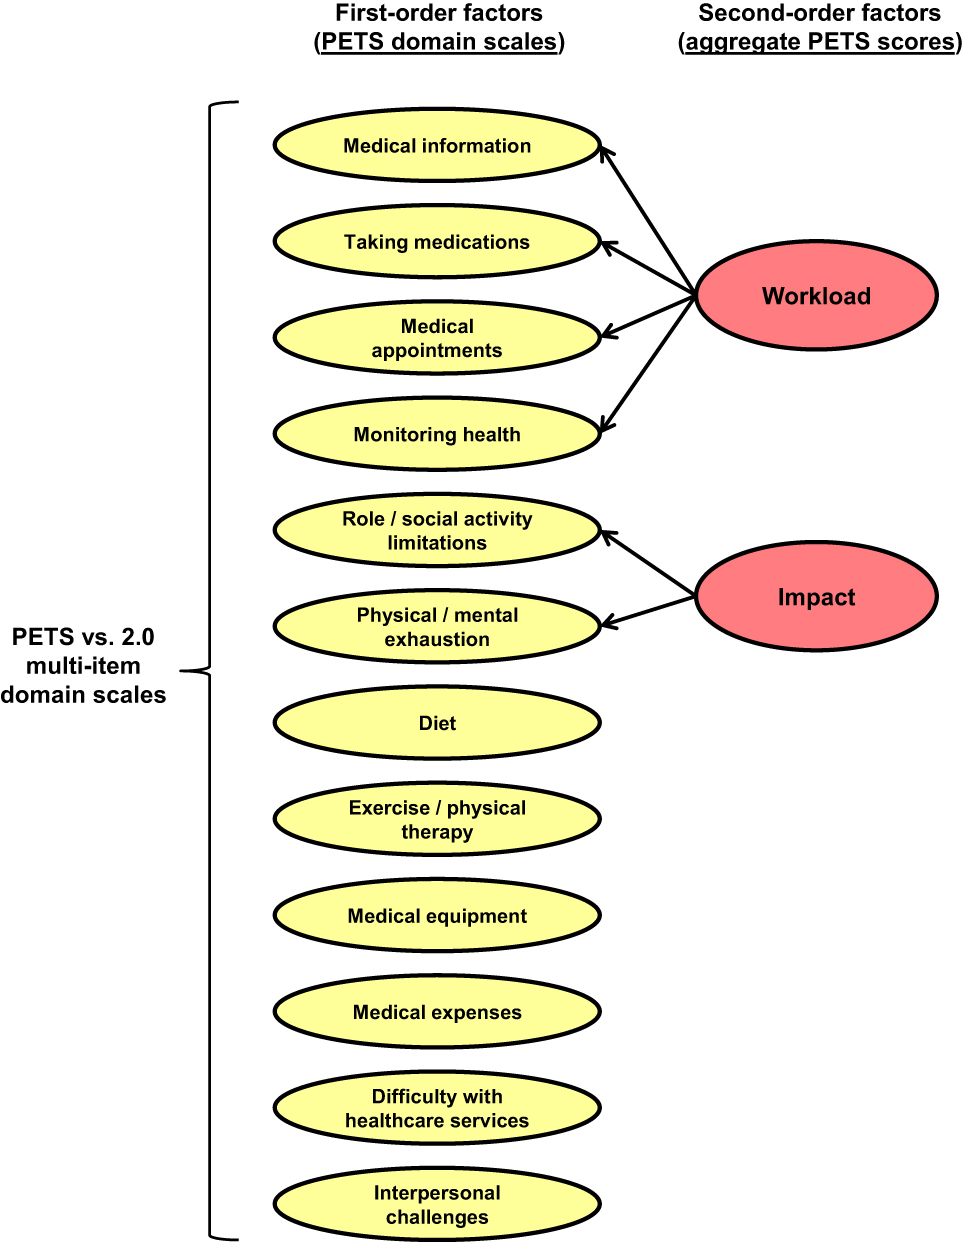 |
Figure 2 Second-order model of latent constructs. Abbreviation: PETS, Patient Experience with Treatment and Self-management. |
Bifactor Model for Workload and Impact
The bifactor graded response models were fit as a step toward conducting unidimensional DIF analyses on items within the two factors. For the workload construct, the data were fit to the bifactor model that included a general workload factor and four group factors (medical information, medications, medical appointments, and monitoring health). The preliminary evaluation of model fit suggested that the bifactor model fits the data for the workload construct well, especially with RMSEA and CFI:  (df)=304.41 (121), P<0.001; RMSEA=0.060 (90% CI: 0.052–0.068); CFI=0.98. All general factor loadings were at least 0.62, and all group factor loadings were above 0.30 (Table 5). The bifactor model fit statistics for impact were:
  (df)=2.96 (2), P=0.23; RMSEA=0.034 (90% CI: 0.000–0.107); CFI=0.99, with all measures of global fit in an excellent range. All general factor loadings were at least 0.67 (Table 6). All group factor loadings for physical/mental exhaustion were above 0.49. Two items from role/social activity limitation were constrained to load only on the general factor because their group factor loadings were close to 0. The other four items in role/social activity limitation had weaker loadings on their group factor, and stronger general factor loadings compared to the items in physical/mental exhaustion.
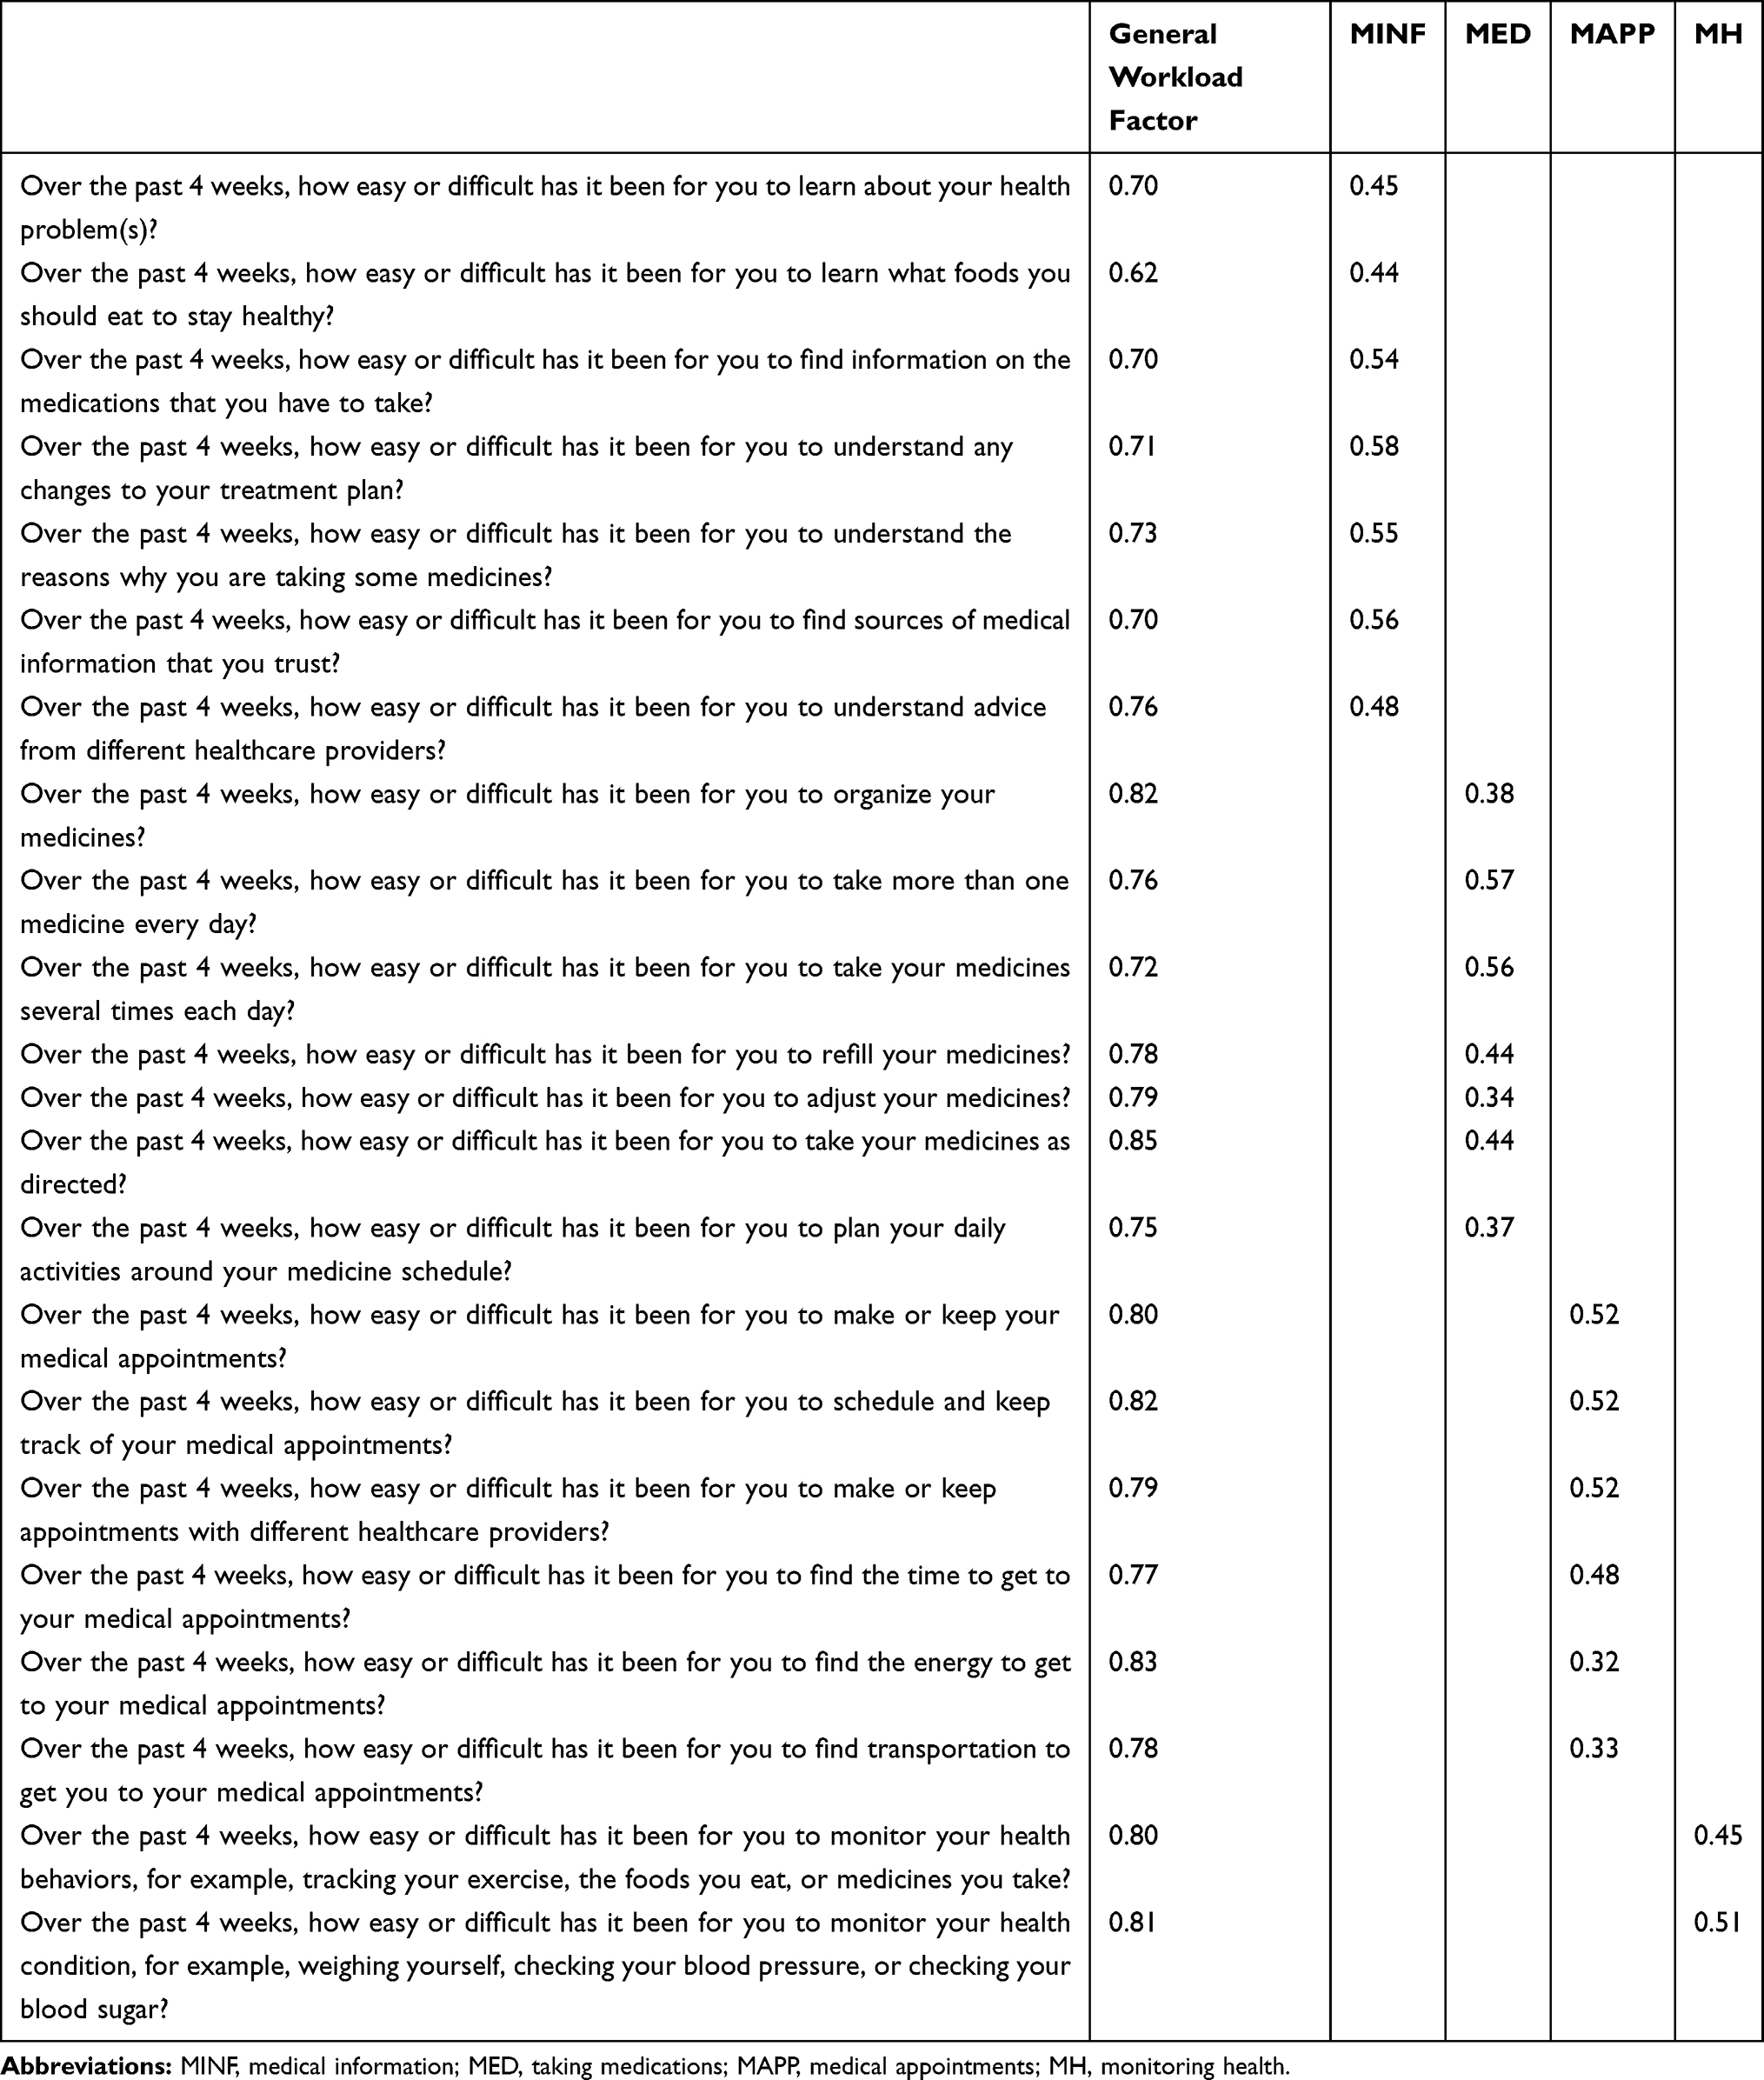 |
Table 5 Confirmatory Bifactor Model Loadings for Workload (Loadings in Blank Cells are 0) |
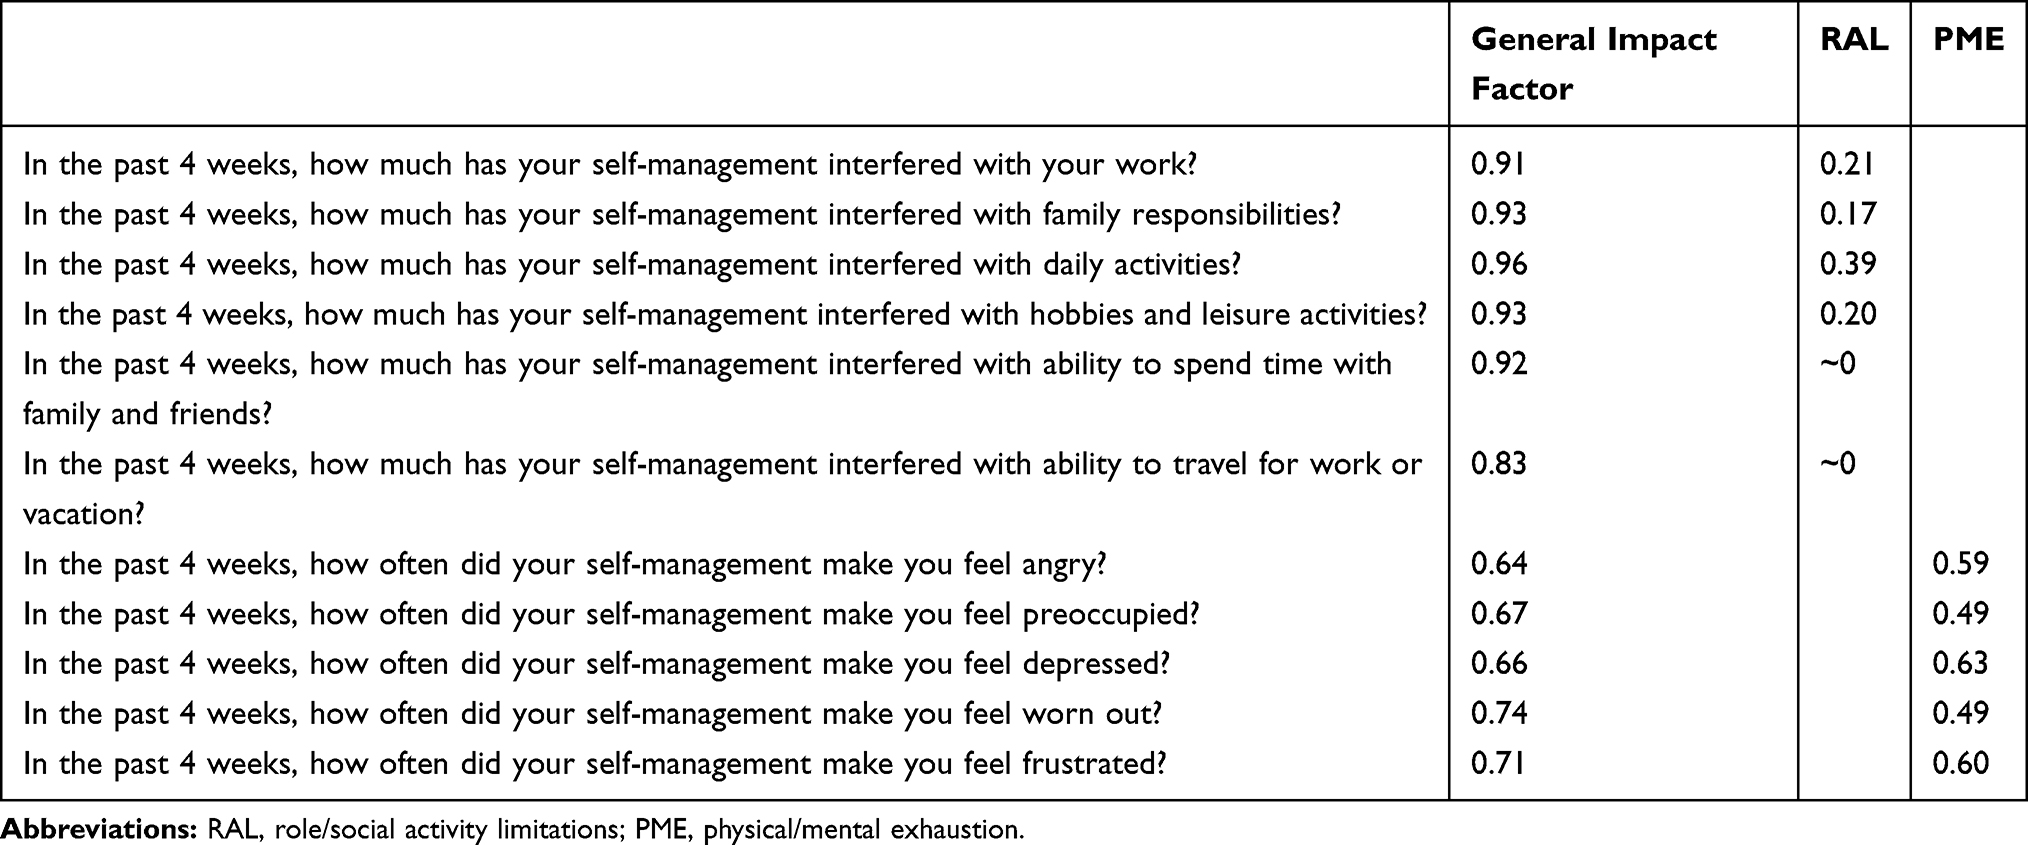 |
Table 6 Confirmatory Bifactor Model Loadings for Impact (Loadings in Blank Cells are Fixed to 0) |
General Factors in Workload and Impact
In both workload and impact, items had salient general factor loadings greater than 0.62 and 0.64, respectively (Tables 5 and 6). The ωH of workload was 0.89, reflecting a strong common factor, and ECV was 0.72, reflecting that the general factor is strong relative to the group factors. Findings were similar for impact, with ωH of 0.88 and ECV of 0.69. This evidence renders support for conducting DIF analyses by these two general factors.
Differential Item Functioning
For both workload and impact, no uniform, non-uniform, or overall DIF was found for any of the gender, education, and health literacy groups. All items in all analyses had a McFadden pseudo R2 change below the criterion that indicates DIF (<0.02). Given the number of analyses and volume of data produced, these results are available in the Supplementary data file (Section 1: DIF for workload items and Section 2: DIF for impact items).
Reliability
As shown in Table 2, all 12 multi-item PETS domain scales supported by the CFAs showed good internal consistency reliability with Cronbach’s alphas ranging from 0.80–0.94. This exceeds the 0.70 threshold for adequate reliability of health status measures used for group comparisons.24 Of the 100 initial survey responders, a retest administration of the PETS was received from 65 of them within 3 weeks of the initial survey (Median retest interval=18 days). The ICCs for the 14 PETS scales, including the two single-item indicators of medication bother, were as follows: rmedical information=0.71; rmedications=0.48; rbother with med. reliance=0.76; rbother with med. side effects=0.60; rmedical appointments=0.80; rmonitoring health=0.80; rdiet=0.80; rexercise/physical therapy=0.90; rmedical equipment=0.58; rinterpersonal challenges=0.36; rmedical expenses=0.77; rdifficulty with healthcare services=0.78; rrole/social activity limitations=0.79; rphysical/mental exhaustion=0.75. Note that the samples available for analysis in the diet, exercise/physical therapy, and medical equipment domains were low due to respondents screening out of the domain items (N =11, 18, and 25 for the three scales, respectively). Hence, the ICC estimates for these domains should be interpreted with caution. Test–retest reliability was adequate (above threshold)24 for all but the medications, medication side-effect bother, medical equipment, and interpersonal challenges domain scales.
Discussion
Our analysis provides support for the construct validity of version 2.0 of the PETS treatment burden measure. PETS version 2.0 extends our previously-validated 48-item version by 12 items, including three previously unanalyzed content domains.2 Overall, our confirmatory factor analyses supported a 12-factor model which is largely consistent with the patient-derived conceptual framework of treatment burden.1 Reliability of the domain scales supported by the CFA was adequate with good internal consistency observed in all of the multi-item scales. Furthermore, among all 14 scales, including the two single-item indicators, test–retest reliability was found to be acceptable in 10 of them.
In addition to confirming the conceptual structure of treatment burden articulated in the PETS measure, the excellent fit observed in the second-order CFA model along with high inter-domain correlations support the existence of two superordinate factors, representing underlying commonalities in relationships of certain PETS content domains. The ease/difficulty of seeking and understanding medical information, taking medications, monitoring one’s health, and making and maintaining medical appointments is reflected in a Workload dimension. The influence of self-management on one’s daily functioning and overall well-being is reflected in an Impact dimension. These findings are practically important because they provide justification for calculating and using aggregated index scores that combine scores of related PETS domains. While we do not advocate abandoning the individual domain scores that constitute each index, we do believe that these aggregate index scores will facilitate use of the measure by diminishing the number of scores to report. Furthermore, as with the previous version,2 since there is no calculated total score, users are free to select whichever PETS scales are best suited to their study or clinical setting. Finally, we also showed that items within workload and impact can be interpreted in the same way regardless of gender (male vs female), formal education status (college graduate vs not), or subjective health literacy (some difficulty understanding written medical information vs no difficulty). Hence, across at least these indicators, there is no evidence of differential item functioning on these PETS items.
There are other ways to improve the usability of the PETS and create a more parsimonious measure. First, the screening questions used for the diet, exercise/physical therapy, and medical equipment scales tend to produce a considerable amount of missing data. In a recent study to translate the PETS into Norwegian, respondents reported being confused by the screening questions to the extent that they felt uncertain as to whether they had answered the questions in these domains correctly.27 To alleviate confusion and mitigate the amount of missing data, we will drop these screening questions on future versions of the PETS. Instead, we will include a “not applicable” response option in the rating scale used for these items, similar to several other PETS domain scales. Second, we will set aside two domain scales that appear to be less related to most patients’ experience of treatment burden – the interpersonal challenges and medical equipment scales. Interpersonal challenges taps feelings of bother in relating to one’s social network regarding one’s healthcare needs (eg, “feeling dependent on others for healthcare needs,” “healthcare needs creating tension with others”). Problems in these areas are less frequently endorsed by patients. In this study, the selection of “not at all bothered” for the four items of this scale ranged from 54% to 72%. Hence, the range and variability of scores is likely to be restricted. Furthermore, interpersonal challenges are more reflective of a social moderator of treatment burden rather than an indicator of it. Regarding medical equipment, only 45% of respondents replied that they were using some type of medical equipment or device, similar to findings of our prior validation study.2 The diminished relevance of these domains justifies setting them aside in future versions of the PETS, though we will maintain these as ancillary scales of treatment burden for interested users.
Study Limitations
There are limitations of this study. First, with a 30% response rate to the survey, there may be selection bias in our sample. It is possible that people with the highest burden were less likely to respond. As treatment burden is inherently subjective, we have no way to know this for certain. However, in comparison to non-responders, survey responders did tend to be older, Caucasian, and diagnosed with more chronic conditions. Other studies of multimorbidity have shown that treatment burden tends to be higher in younger people.28,29 It will be important for future studies that use the PETS to include younger cohorts of working-aged adults, especially racial/ethnic minorities and persons from socially vulnerable groups such as those with low income, low education, or low health literacy. Second, our psychometric studies of the PETS have focused exclusively on patients living in the United States. At present, we have limited data from patients in other countries who may have experience with different healthcare systems. However, we are aware of ongoing studies using the PETS in patients across multiple countries and continents, including studies using new translated versions of the measure.27 Furthermore, the PETS measurement framework1,30 has informed the content of treatment burden measures developed in the UK and France.28,29 Third, few patients in this study (6%) had health conditions that were recently diagnosed (within a year of the survey). Responses to questions about perceived treatment burden may be different for those dealing with a new diagnosis. Fourth, the mailed-survey study design prevented us from being able to precisely control the time interval for the retest administration of the PETS. Some changes in treatment burden over time might have occurred for some which could explain why a few PETS domains featured suboptimal test–retest reliability. Future studies should establish a fixed and briefer interval for retest (eg, 2 days). Furthermore, there may also be value in determining the consistency of PETS scores across various modes of administration (eg, self- vs interviewer-administered) or comparing patient vs caregiver proxy assessments of treatment burden. Finally, conclusions about a lack of DIF on PETS items are limited to only those items analyzed in the present study (ie, items within the workload and impact factors).
Conclusions
Confirmatory factor analyses of the PETS version 2.0 (60 items: © 2016 Mayo Foundation for Medical Education and Research) supports the factorial construct validity of the measure. DIF analyses support that PETS items do not appear to be differentially interpreted across gender, formal education status, or subjective health literacy (no DIF). Two second-order factors were supported justifying aggregation of certain PETS domain scales into summary index scores for workload and impact. We recommend that investigators use these summary index scores in future reports, and consider using them in clinical trials of the measure, assessing clinical utility of these simplified metrics. The known-groups validity and responsiveness to change of all PETS version 2.0 scales and scores has been supported in a companion article to this study.31 Other modifications to facilitate use of the PETS include the removal of domain screening items and setting aside content that is less frequently endorsed and ancillary to the concept of treatment burden, such as questions concerning the use of medical equipment and interpersonal challenges with others. While such content can be held in reserve and made available to interested investigators, it will be removed from the base PETS measure. Overall, we strive to obtain a valid measure of treatment burden that is both comprehensive in coverage and easy to administer, score, and interpret. Note that while not publicly available, a de-identified dataset of the data analyzed for this study can be made available at reasonable request of the principal investigator of the project (D. Eton). All requests are subject to review by the principal investigator and study co-investigators and must be approved by the Mayo Foundation for Medical Education and Research.
Acknowledgments
The research reported in this manuscript was supported by the National Institute of Nursing Research of the National Institutes of Health (USA) under award number R01NR015441 (D. Eton, Principal investigator). The content is solely the responsibility of the authors and does not necessarily represent the official views of the National Institutes of Health. We thank Ms. Ann Harris and the Mayo Clinic Survey Research Center for formatting, distribution, and receipt of the survey. We also thank Ms. Kandace Lackore, Ms. Sarah Jenkins, and Mr. Richard Pendegraft for database support.
Disclosure
Dr Jennifer L. St. Sauver reports grants from National Institutes on Aging (USA), during the conduct of the study; grants from Exact Sciences, outside the submitted work. Dr Mark Linzer reports grants from the National Institutes of Health (NIH, USA), during the conduct of the study; grants from American Medical Association, American College of Physicians, Institute for Healthcare Improvement, American Board of Internal Medicine and NIH, outside the submitted work; in addition, Dr Linzer consults on a grant from Harvard University and received honoraria for Medical Grand Rounds on clinician worklife and burnout prevention from Harvard University and the University of Chicago. Dr David T. Eton reports grants from the NIH (USA), during the conduct of the study. The authors report no other conflicts of interest in this work.
References
1. Eton DT, Ridgeway JL, Egginton JS, et al. Finalizing a measurement framework for the burden of treatment in complex patients with chronic conditions. Patient Relat Outcome Meas. 2015;6:117–126. doi:10.2147/PROM.S78955
2. Eton DT, Yost KJ, Lai JS, et al. Development and validation of the patient experience with treatment and self-management (PETS): a patient-reported measure of treatment burden. Qual Life Res. 2017;26:489–503. doi:10.1007/s11136-016-1397-0
3. Rocca WA, Yawn BP, St Sauver JL, et al. History of the Rochester epidemiology project: half a century of medical records linkage in a US population. Mayo Clin Proc. 2012;87:1202–1213. doi:10.1016/j.mayocp.2012.08.012
4. St Sauver JL, Grossardt BR, Yawn BP, et al. Data resource profile: the Rochester epidemiology project (REP) medical records-linkage system. Int J Epidemiol. 2012;41:1614–1624. doi:10.1093/ije/dys195
5. Goodman RA, Posner SF, Huang ES, et al. Defining and measuring chronic conditions: imperatives for research, policy, program, and practice. Prev Chronic Dis. 2013;10:E66. doi:10.5888/pcd10.120239
6. U.S. Department of Health and Human Services. Multiple Chronic Conditions – A Strategic Framework: Optimum Health and Quality of Life for Individuals with Multiple Chronic Conditions. Washington, DC; December 2010.
7. Chew LD, Griffin JM, Partin MR, et al. Validation of screening questions for limited health literacy in a large VA outpatient population. J Gen Intern Med. 2008;23:561–566. doi:10.1007/s11606-008-0520-5
8. Hu L, Bentler PM. Cutoff criteria for fit indexes in covariance structure analysis: conventional criteria versus new alternatives. Struct Equ Modeling. 1999;6:1–55. doi:10.1080/10705519909540118
9. Arnau RC. Second-order factor analysis: methods and interpretation. Southwestern Psychological Association. New Orleans, LA: ERIC Document Reproduction Service ED 417 216; 1998.
10. Eton DT, Anderson RT, Cohn WF, et al. Risk factors for poor health-related quality of life in cancer survivors with multiple chronic conditions: exploring the role of treatment burden as a mediator. Patient Relat Outcome Meas. 2019;10:89–99. doi:10.2147/PROM.S191480
11. Schwartz CE, Zhang J, Michael W, et al. Reserve-building activities attenuate treatment burden in chronic illness: the mediating role of appraisal and social support. Health Psychol Open. 2018;5:2055102918773440. doi:10.1177/2055102918773440
12. Chalmers P. mirt: A multidimensional item response theory package for the R environment. J Stat Softw. 2012;48:1–29. doi:10.18637/jss.v048.i06
13. Cai L, Hansen M. Limited-information goodness-of-fit testing of hierarchical item factor models. Br J Math Stat Psychol. 2013;66:245–276. doi:10.1111/j.2044-8317.2012.02050.x
14. Browne MW, Cudeck R. Alternative ways of assessing model fit. Sociol Methods Res. 1992;21:230–258. doi:10.1177/0049124192021002005
15. Muller RO, Hancock GR. Best practices in structural equation modeling. In: Osborne J, editor. Best Practices in Quantitative Methods. Thousand Oaks, CA: Sage; 2008:488–508.
16. McDonald RP. Test Theory: A Unified Treatment. Mahwah, NJ: Lawrence Erlbaum Associates; 1999.
17. Reise SP. Invited paper: the rediscovery of bifactor measurement models. Multivariate Behav Res. 2012;47:667–696. doi:10.1080/00273171.2012.715555
18. Lai JS, Butt Z, Wagner L, et al. Evaluating the dimensionality of perceived cognitive function. J Pain Symptom Manage. 2009;37:982–995. doi:10.1016/j.jpainsymman.2008.07.012
19. Lai JS, Crane PK, Cella D. Factor analysis techniques for assessing sufficient unidimensionality of cancer related fatigue. Qual Life Res. 2006;15:1179–1190. doi:10.1007/s11136-006-0060-6
20. Choi SW, Gibbons LE, Crane PK. Lordif: an R package for detecting differential item functioning using iterative hybrid ordinal logistic regression/item response theory and Monte Carlo simulations. J Stat Softw. 2011;39:1–30. doi:10.18637/jss.v039.i08
21. Condon DM, Chapman R, Shaunfield S, et al. Does recall period matter? Comparing PROMIS physical function with no recall, 24-hr recall, and 7-day recall. Qual Life Res. 2020;29:745–753. doi:10.1007/s11136-019-02344-0
22. Taple BJ, Griffith JW, Wolf MS. Interview administration of PROMIS depression and anxiety short forms. Health Lit Res Pract. 2019;6:3196–e204.
23. Teresi JA, Ocepek-Welikson K, Kleinman M, et al. Analysis of differential item functioning in the depression item bank from the patient reported outcome measurement information system (PROMIS): an item response theory approach. Psychol Sci Q. 2009;51:148–180.
24. Frost MH, Reeve BB, Liepa AM, et al. What is sufficient evidence for the reliability and validity of patient-reported outcome measures? Value Health. 2007;10(Suppl 2):S94–S105. doi:10.1111/j.1524-4733.2007.00272.x
25. Streiner DL, Norman GR. Health Measurement Scales: A Practical Guide to Their Development and Use.
26. Qin S, Nelson L, McLeod L, et al. Assessing test-retest reliability of patient-reported outcome measures using intraclass correlation coefficients: recommendations for selecting and documenting the analytical formula. Qual Life Res. 2019;28:1029–1033. doi:10.1007/s11136-018-2076-0
27. Husebo AML, Morken IM, Eriksen KS, Nordfonn OK. The patient experience with treatment and self-management (PETS) questionnaire: translation and cultural adaption of the Norwegian version. BMC Med Res Methodol. 2018;18:147. doi:10.1186/s12874-018-0612-9
28. Duncan P, Murphy M, Man MS, et al. Development and validation of the multimorbidity treatment burden questionnaire (MTBQ). BMJ Open. 2018;8:e019413.
29. Tran VT, Montori VM, Eton DT, et al. Development and description of measurement properties of an instrument to assess treatment burden among patients with multiple chronic conditions. BMC Med. 2012;10:68. doi:10.1186/1741-7015-10-68
30. Eton DT, Ramalho de Oliveira D, Egginton JS, et al. Building a measurement framework of burden of treatment in complex patients with chronic conditions: a qualitative study. Patient Relat Outcome Meas. 2012;3:39–49. doi:10.2147/PROM.S34681
31. Eton DT, Lee MK, St Sauver JL, Anderson RT. Known-groups validity and responsiveness to change of the patient experience with treatment and self-management (PETS vs. 2.0): a patient-reported measure of treatment burden. Qual Life Res. 2020;29:3143–3154. doi:10.1007/s11136-020-02546-x
 © 2021 The Author(s). This work is published and licensed by Dove Medical Press Limited. The full terms of this license are available at https://www.dovepress.com/terms.php and incorporate the Creative Commons Attribution - Non Commercial (unported, v3.0) License.
By accessing the work you hereby accept the Terms. Non-commercial uses of the work are permitted without any further permission from Dove Medical Press Limited, provided the work is properly attributed. For permission for commercial use of this work, please see paragraphs 4.2 and 5 of our Terms.
© 2021 The Author(s). This work is published and licensed by Dove Medical Press Limited. The full terms of this license are available at https://www.dovepress.com/terms.php and incorporate the Creative Commons Attribution - Non Commercial (unported, v3.0) License.
By accessing the work you hereby accept the Terms. Non-commercial uses of the work are permitted without any further permission from Dove Medical Press Limited, provided the work is properly attributed. For permission for commercial use of this work, please see paragraphs 4.2 and 5 of our Terms.