Back to Journals » Research Reports in Clinical Cardiology » Volume 13
Computer-Aided Decision Support System for Diagnosis of Heart Diseases
Authors Simegn GL ![]() , Gebeyehu WB, Degu MZ
, Gebeyehu WB, Degu MZ
Received 14 March 2022
Accepted for publication 6 May 2022
Published 16 May 2022 Volume 2022:13 Pages 39—54
DOI https://doi.org/10.2147/RRCC.S366380
Checked for plagiarism Yes
Review by Single anonymous peer review
Peer reviewer comments 2
Editor who approved publication: Dr Richard Kones
Gizeaddis Lamesgin Simegn,1 Worku Birhanie Gebeyehu,2 Mizanu Zelalem Degu2
1School of Biomedical Engineering, Jimma Institute of Technology, Jimma University, Jimma, Ethiopia; 2Faculty of Computing, Jimma Institute of Technology, Jimma University, Jimma, Ethiopia
Correspondence: Gizeaddis Lamesgin Simegn, Tel +251913925481, Email [email protected]
Background: Cardiovascular diseases (CVDs) are the leading causes of death worldwide and the number of people dying from these diseases is steadily increasing. The rapid economic transformation leading to environmental changes and unhealthy lifestyles increase the risk factors and incidence of cardiovascular disease. The limited access to health facilities, lack of expert cardiologists, and lack of regular health check-up trends make CVD a major cause of mortality in low-resource settings. Computer-aided diagnosis using artificial intelligence techniques (AI) can help reduce the mortality rate by providing decision support to experts allowing early diagnosis and treatment.
Methods: In this paper, an AI-based computer-aided heart disease diagnosis decision support system has been proposed using clinical data, patient information, and electrocardiogram (ECG) data. The proposed system includes three modules: an ECG processor module that allows cardiologists to process and analyze the different waveforms, a machine learning-based heart disease prediction module based on patient information and clinical data, and a deep learning-based 18 heart conditions multiclass classification module using 12-lead ECG data. A user-friendly user interface has also been developed for ease of use of the proposed techniques.
Results: The heart disease prediction module was found to be 100% accurate in predicting heart disease based on clinical and patient information, and the multiclass classification module was 93.27% accurate, on average, in classifying heart conditions based on a 12-lead ECG signal. The ECG processor also provides quick diagnosis by analyzing important ECG waveforms and segments.
Conclusion: The proposed system may have the potential for facilitating heart disease diagnosis. The proposed method allows physicians to analyze and predict heart disease easily and early, based on the available resource, improving diagnosis accuracy and treatment planning.
Keywords: artificial intelligence, AI, clinical data, diagnosis, ECG signal, heart disease
Introduction
Cardiovascular diseases (CVDs) are groups of disorders of the heart and the blood vessels including heart coronary heart disease, cerebrovascular disease, peripheral arterial disease, rheumatic heart disease and other conditions. CVDs are the leading cause of death globally, taking an estimated 17.9 million lives each year and more than 75% of these deaths occur in low- and middle-income countries (LMICs).1 Even though evidence on the national burden of cardiovascular diseases (CVDs) is limited in Ethiopia, according to a systematic review conducted in 2014, the prevalence of CVD ranges from 7.2% to 24%.2 The trend of CVD and mortality attributed to CVD is still increasing in Ethiopia.3,4
The risk factors of CVDs could be lifestyle, age and family history (genetic risk).5–7 The most common behavioral risk factors include smoking, obesity, unhealthy diet, lack of physical exercise, and excessive alcohol consumption.1,7,8 Individuals with behavioral risk factors may experience symptoms such as high blood pressure, high blood glucose, high blood lipids, and being overweight or obese.1,9 Identification of risk factors of CVDs early can help prevent premature deaths. For continuous follow-up, accurate diagnosis and risk stratification of patients using a diagnostic laboratory in combination with radiology techniques plays a significant role.10
The common tests to diagnose CVDs include blood work, electrocardiogram (ECG), ambulatory monitoring, echocardiogram, cardiac CT and MRI, stress test, cardiac catheterization etc. However, accurate diagnosis requires analysis and integration of much laboratory data and patient information. Integrated data analysis through the manual procedure can be complex and time consuming, and also the diagnostic effectiveness is dependent on the physicians’ knowledge and experience which may sometimes lead to misdiagnosis. Moreover, in countries with limited resources, the diagnosis and treatment of CVDs is usually difficult, due to the unavailability of diagnostic apparatus, low physician-to-patient ratios, shortage of high quality medical expertise and infrastructure, resulting in poor prediction and treatment of heart patients.11,12 This burden can be reduced by Introducing clinical decision support systems that encompass a variety of tools to enhance decision making in healthcare.13,14 Artificial intelligence (AI), which is a simulation of human intelligence in machines that are programmed to mimic human thoughts and actions, has the potential to help clinicians make an informed decision in the diagnosis and management of CVDs by analyzing big data. AI based clinical decision support systems can be developed using traditional machine learning (ML) algorithms (a subset of AI that is used to build AI-driven applications) or deep learning algorithms that use large amounts of data and complex algorithms for model training.
To overcome the limitations of the manual diagnosis procedures and make use of the potential of AI for disease prediction, literature has proposed different heart disease predictive machine learning techniques based on Support Vector Machines (SVM), K-Nearest Neighbor (KNN), Naïve Bayes (NB), and Decision Tree (DT), deep learning models and others.9,15–25 For example, Detrano et al19 have used a logistic regression classification algorithm for heart disease detection and claimed a classification accuracy of 77.1%. Similarly, Kahramanli et al21 proposed a heart disease classification system integrating neural networks with an artificial neural network and claimed an accuracy of 82.4%. Likewise, Tomov et al23 came up with a deep neural network model for heart disease prediction, reporting an accuracy of 99% and 0.98 Matthews Correlation Coefficient (MCC). Ali et al25 proposed an expert system using stacked SVM for the prediction of heart disease and reported a 91.11% classification accuracy. To achieve improved clinical diagnosis, a fusion of multimodal data from ECG, clinical laboratory measurement, patient information, etc. are required. However, many of the automatic health disease diagnosis techniques proposed in the literature are either less accurate, and dependent on clinical data, or medical imaging data or ECG signals alone. The purpose of this research is therefore, to develop an integrated robust tool that allows physicians to analyze ECG signals acquired from patients and get a decision support in the prediction and classification of heart diseases using clinical data, patient information and a standard 12 lead ECG record.
Methods
The current work presents three heart disease diagnosis decision support modules: (1) heart disease prediction module that predicts the presence of heart disease using structured patient information and clinical data, (2) 12-Lead ECG based cardiac condition/abnormality classification which is designed to identify 18 types of cardiac conditions or abnormalities which indicate heart diseases from the 12-lead ECG record, and (3) ECG processor which is designed to process a single lead ECG record and quantifies the important waveform durations, amplitudes and slope. For the first module, structured patient information (age, gender, history of hypertension, etc.), and streaming clinical data (heart rate, blood pressure, etc.), were first processed and analysed. Then feature fusion of the structured data and streaming data was performed to train and validate a machine learning model for heart disease prediction. For the second module, 12-lead ECG data was first pre-processed for artifact removal and the data was used to train and validate a deep learning model (together with age and gender information) for multi-class classification of 18 cardiac conditions. In the third module, an ECG processor that denoises the signal, extracts the QRS complex and ECG waves, analyzes and calculates the ECG wave's amplitudes, duration, and slope as well as the heart rate was developed. Finally, a user-friendly web-based system was developed for ease of use of the proposed sub-systems. Figure 1 demonstrates the general framework of the proposed system.
 |
Figure 1 Summary of the proposed computer aided heart disease diagnosis tool. |
Data Collection
For the heart disease prediction system, a total of 1190 observations containing different attribute information including age, sex, chest pain type, blood pressure, cholesterol in mg/dl, blood sugar, maximum heart rate, etc. were acquired from a publicly available database (University of California Irvine (UCI) Machine Learning Repository)26 which was collected from 5 different heart datasets. Table 1 demonstrates the sample observations of 10 individuals. The data contains 45.5% people with heart disease and 54.5% normal people.
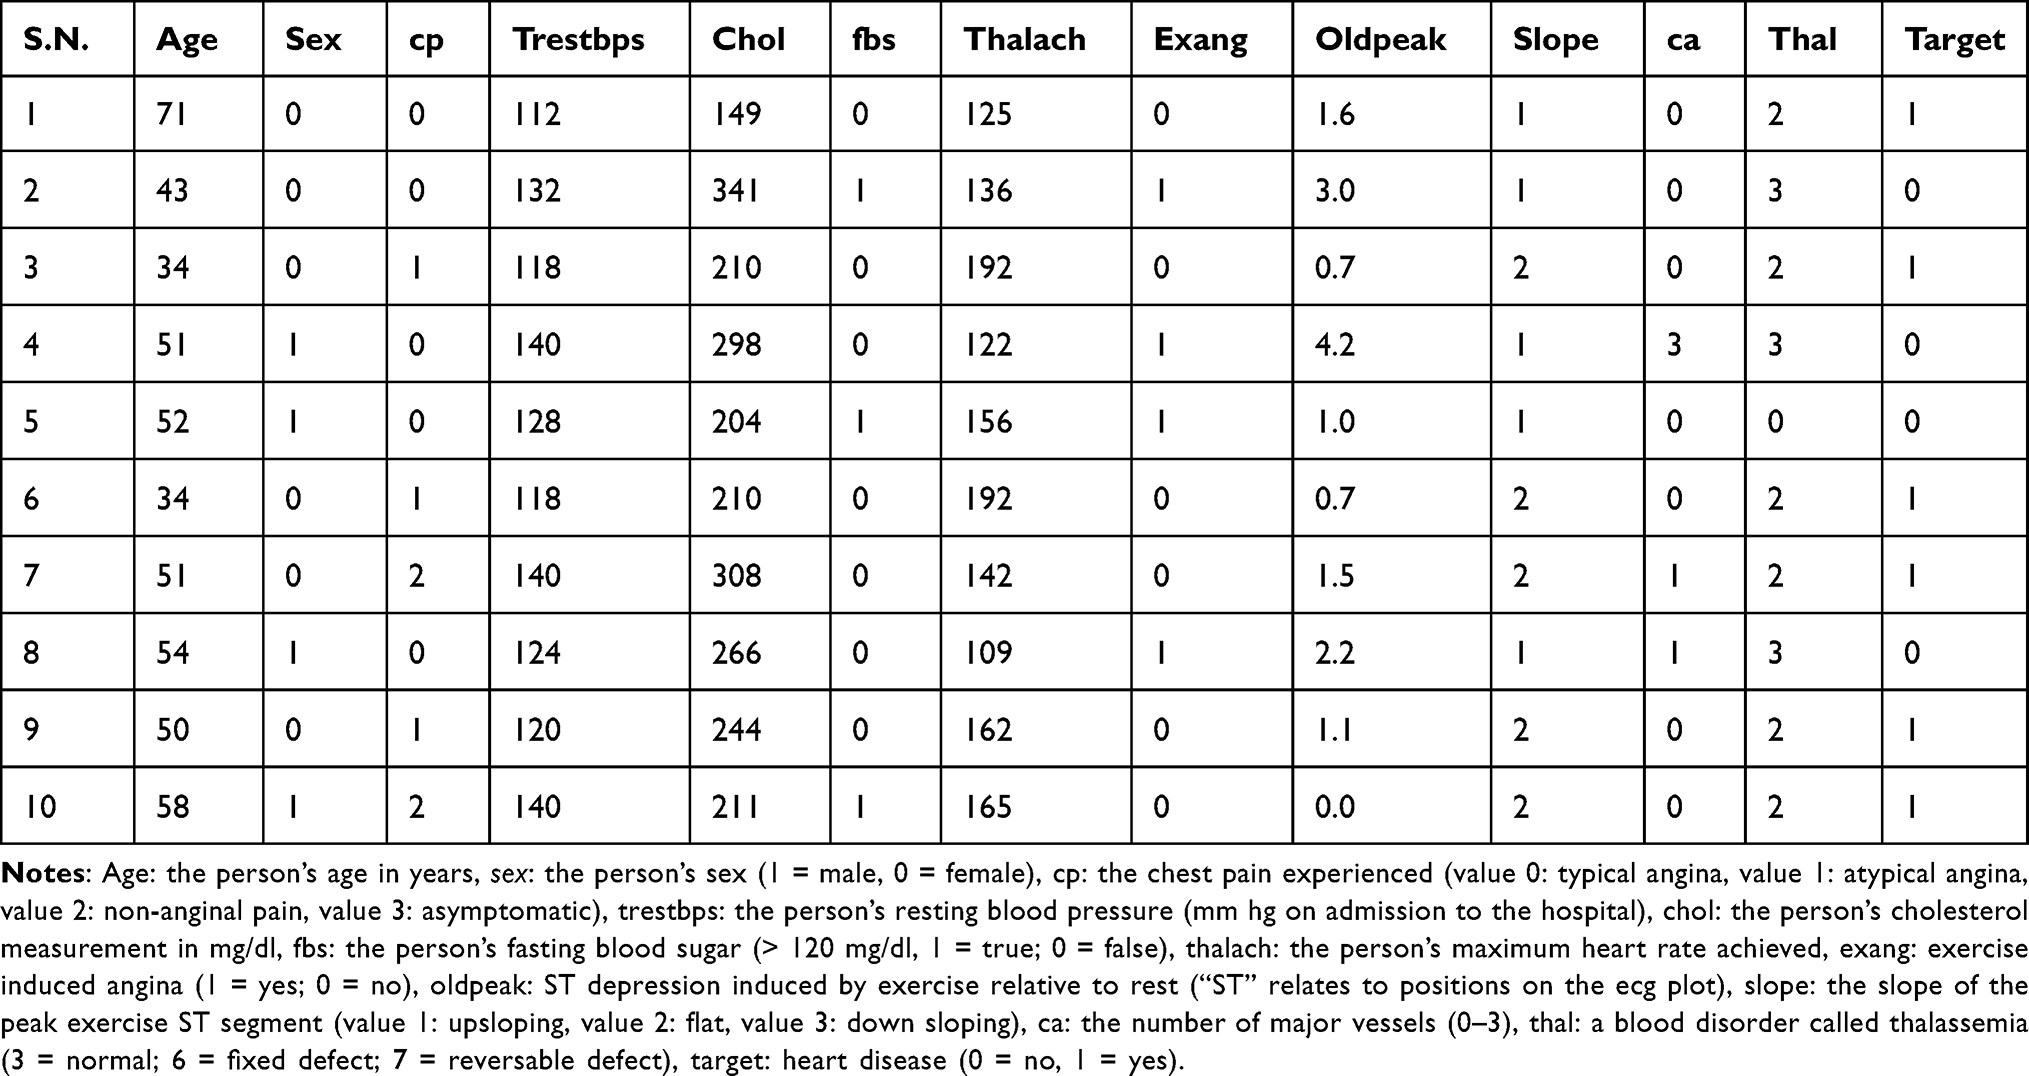 |
Table 1 Sample Observations Collected from 6 Heart Disease Patients and 4 Normal Individuals |
The 12-lead ECG data which was used to train the deep learning model for the multiclassification of 18 cardiac conditions, were gathered from 4 different publicly available datasets:27 The data consists of a total of 23,924 12-lead ECG recordings labeled with 18 major cardiac conditions. Demographic information such as age and sex were also included in the data. Table 2 demonstrates the heart disease/conditions and amount of data for each class.
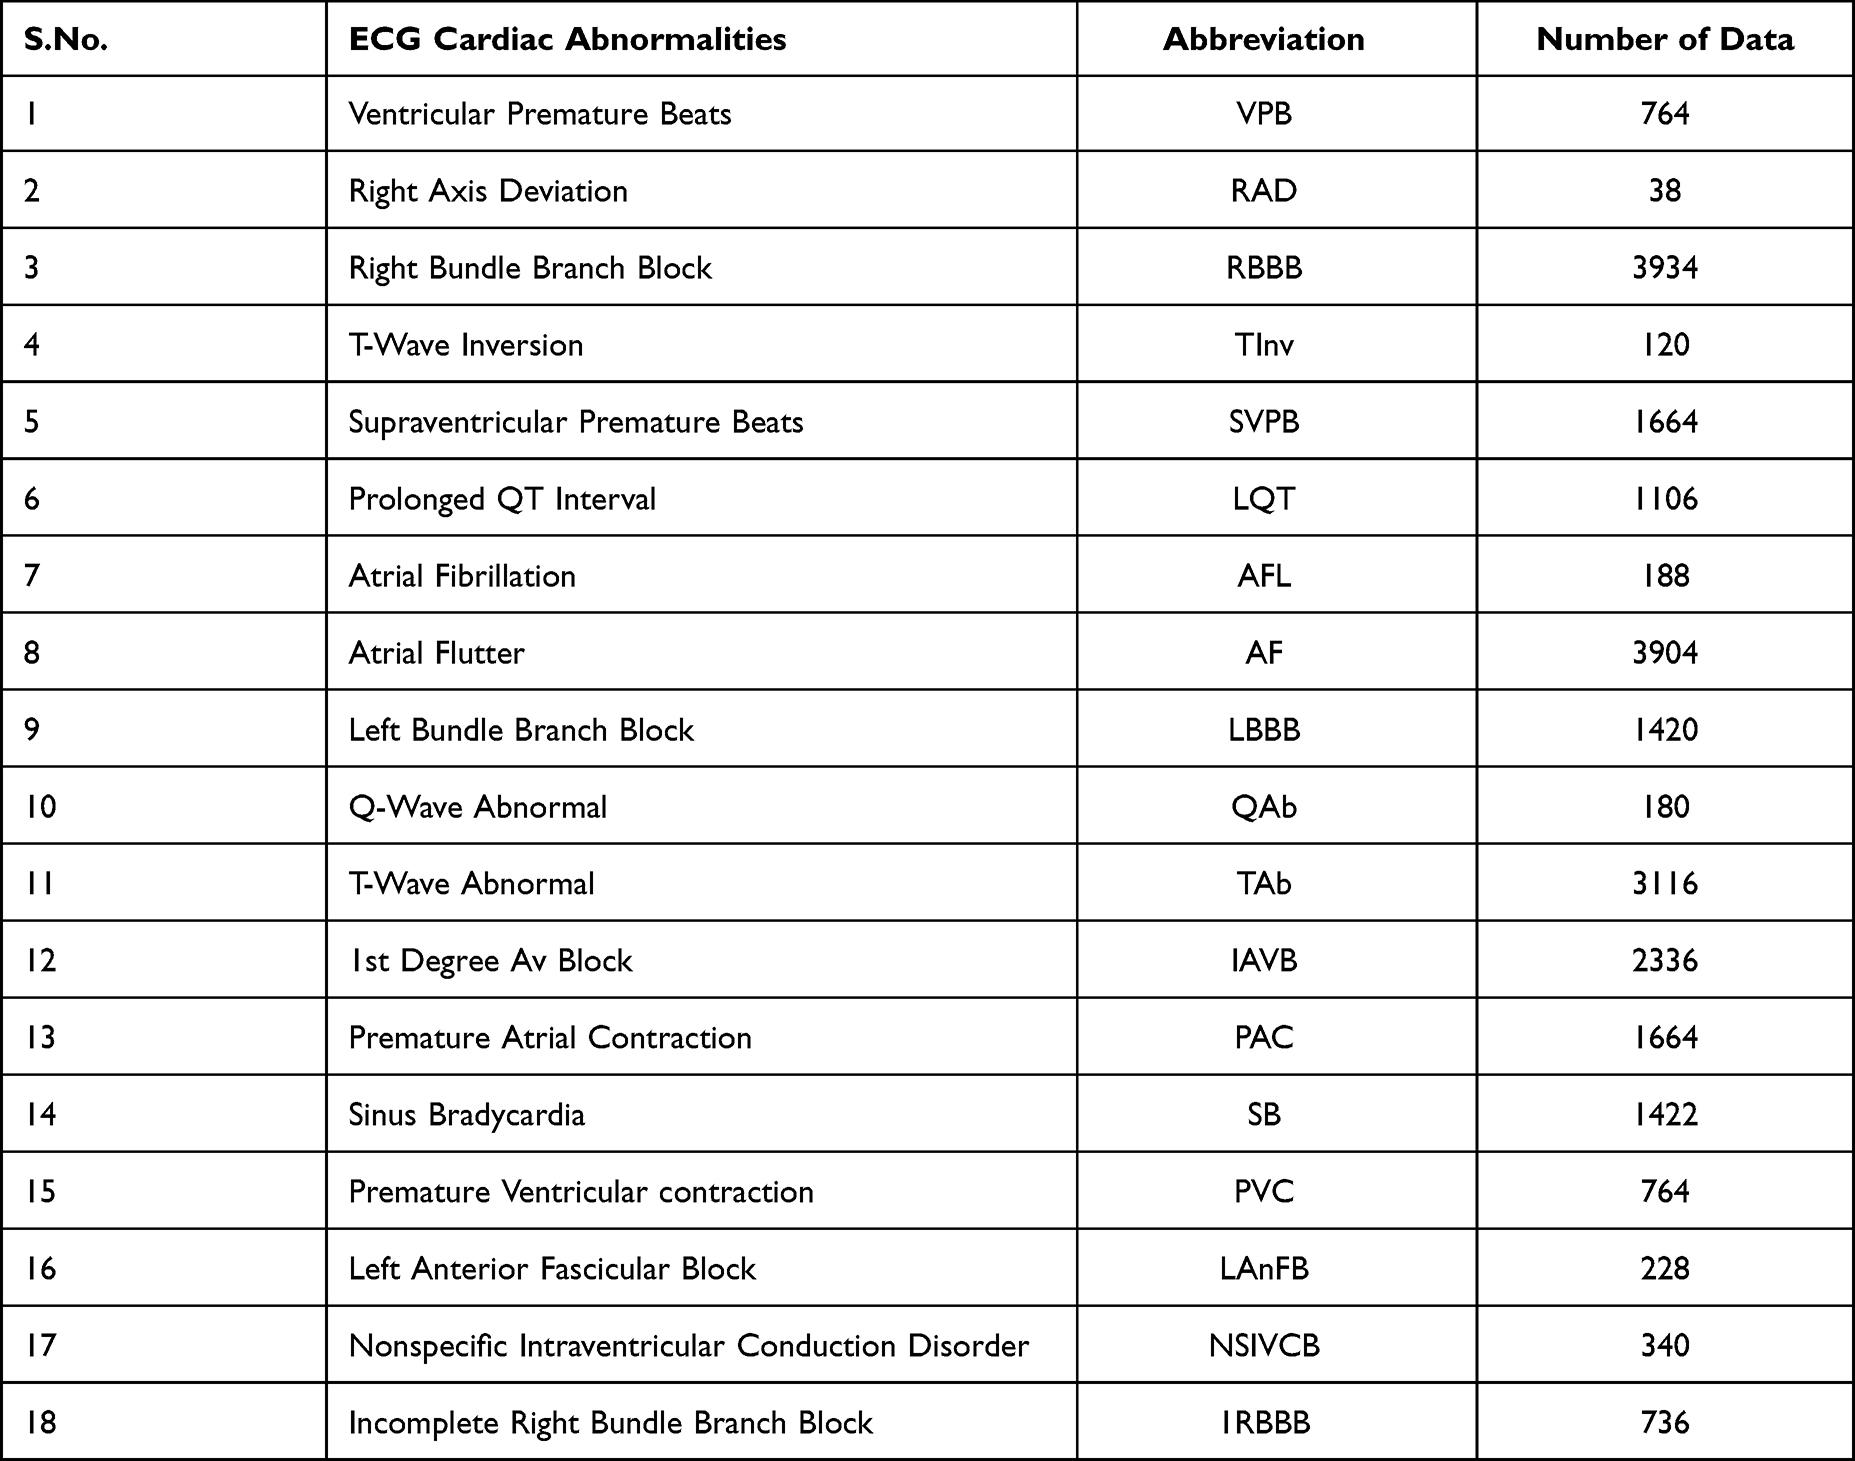 |
Table 2 The 12-Lead ECG Collected Data and Heart Disease/Conditions |
Data Preprocessing and Visualization
All the heart disease prediction dataset (patient information and clinical data) features were first one-hot encoded (features were converted into numeric values). After one-hot encoding, correlation between each pair of features was investigated to determine feature redundancy. Then a correlation matrix is computed to check the linear relationship between the variables, which is used to identify the highly correlated variables. High correlation magnitudes indicate that the variables contain similar information. The correlation filtering is intended to remove the redundant variables.
The gender and age information contained with the 12-lead ECG data, which was used for heart disease/conditions multiclassification, were also one-hot encoded prior to feeding to the model for training.
Training and Testing the Heart Disease Prediction Models
Two machine learning models (XGBoost and random forest), and an artificial neural network (ANN) deep learning model were trained and tested with the same attribute information for heart disease prediction. The best performing model was then selected for deployment.
XGBoost is a decision-tree-based ensemble Machine Learning algorithm that uses a gradient boosting framework. It is an optimized distributed gradient boosting library designed to be highly efficient, flexible and portable It implements machine learning algorithms under the Gradient Boosting framework. XGBoost provides a parallel tree boosting designed to be highly efficient, flexible and portable.28 In this paper, the XGBoost model was implemented with a learning rate of 0.01, L1 regularization value of 5, L2 regularization value of 2, and 2000 number of estimators or runs (model learning iterations). Similarly, random forest is one of the supervised machine learning algorithms that is usually used for both classification and regression purposes.29 It contains many decision trees that operate as an ensemble. In this paper, the random forest algorithm was implemented with 600 decision trees (estimators) and other default parameters.
For training the XGBoost and random forest models, initially, the data was randomly split into training set (80%) and test set (20%). Then, a 10-fold cross validation technique was applied on the training dataset, in which the training set was further split into 10 parts of equal size, and 9 parts were used for training and 1 part was used for validation. This process was repeated 10 times iteratively and the average of this accuracy was taken as the expected prediction accuracy.
The ANN was implemented using a standard feed-forward back-propagation neural network (BPNN) model. The network has three layers, an input layer with 13 neurons, hidden layer with 11 neurons and a 1 neuron output layer. A uniform kernel initializer, ReLu activation function in the input and hidden layer, the sigmoid activation function in the output layer, an Adam optimizer, and a binary cross entropy, batch size of 10 and 100 number of epochs were used in training this model. 80% of the data was used for training and the remaining 20% of the data was used for testing.
Training and Testing of the Multiclassification Model
For the classification of the 18-cardiac conditions/abnormalities from the 12-lead ECG data, a conventional neural network (CNN) was trained and validated. The model was designed to accept two separate inputs: (i) ECG signal and (ii) age and gender. For the feature extraction of the first input (ECG data), 3 one dimensional conventional neural networks (Conv1D) with 5000 input length and 12 steps were used. For the second input feature extraction two dense layers were used. The outputs of the first and second feature extracting blocks were then concatenated. Finally, a dense layer with 18 outputs was used for final classification. The model uses ReLu activation function for the conventional layers and sigmoid activation function for the dense layer, Adam as an optimizer, and a binary cross entropy loss function. The model was trained for 50 epochs and a batch size of 50. Figure 2 illustrates the simplified architecture of the proposed and the implemented CNN model.
 |
Figure 2 Simplified architecture of the heart disease classification model. Conv1Dx128: 1 dimensional CNN with 128 outputs, GlobAvPooling: 1 dimensional Global Average Pooling, DenseX18: dense layer with 18 outputs. |
ECG Processor
An ECG provides key information about the condition of the heart. Analysis based on ECG data is usually conducted after signal processing. ECG data processing techniques include noise removal, baseline correction, wave form and parameter extraction and abnormality detection. An ECG waveform consists of five basic waves called P, Q, R, S, and T-waves and sometimes U-waves. The P-wave indicates the successive depolarization of right atria and left atria, QRS complex indicates the ventricular depolarization, T-wave represents the ventricular repolarization and the U-wave represents the repolarization of the papillary muscles. The most important part of the ECG data analysis is the shape of the QRS complex which is the combination of three of the graphical deflections seen on the typical ECG.
Finite impulse response (FIR) digital filters using Kaiser window30 were designed and implemented to remove high frequency noise, low frequency noise, and powerline interference from the ECG data. The low pass and high pass filters were designed with 100 Hz and 0.5 Hz cutoff frequencies, respectively, and order of 100. Similarly, a notch filter with 50 Hz central frequency and order of 100 was designed for removal of the power line interference.
After noise removal, ECG feature extraction system was designed to extract important features including R-peak, PQST peaks and waves and each wave amplitudes and intervals. The Neurokit231 discrete wavelet method of ECG peaks detection package was used to extract and delineate the ECG peaks. After extraction of the required peaks, an algorithm was developed for calculation of ST depression, QRS duration, slope of ST segment, QT interval, amplitude of the R peak, amplitude of the Q peak, amplitude of P wave, amplitude of T wave, PR interval, corrected QT interval using Bazett formula32 and the average heart rate. These features are important indicators of the presence of heart disease or abnormality.
Results
Data Pre-Processing and Visualization
In the pre-processing stage, the different attribute information used for training the heart disease prediction model were converted into numeric values and analysed. As demonstrated in the correlation plot of Figure 3, chest pain, the maximum heart rate and slope of peak exercise ST segment are highly correlated with the target (having heart disease or not). Figure 4 demonstrates the number of people (in the collected data) with each chest pain type (angina) and the relation between the types of chest pain and heart disease. As indicated, 27.2% persons have chest pain type 0, 82% have chest pain type 1, 79.3% have chest pain type 2 and 69.5% have chest pain type 3. As demonstrated in Figure 4, those who have chest pain type 1 and chest pain type 2 are more likely to be affected by heart disease.
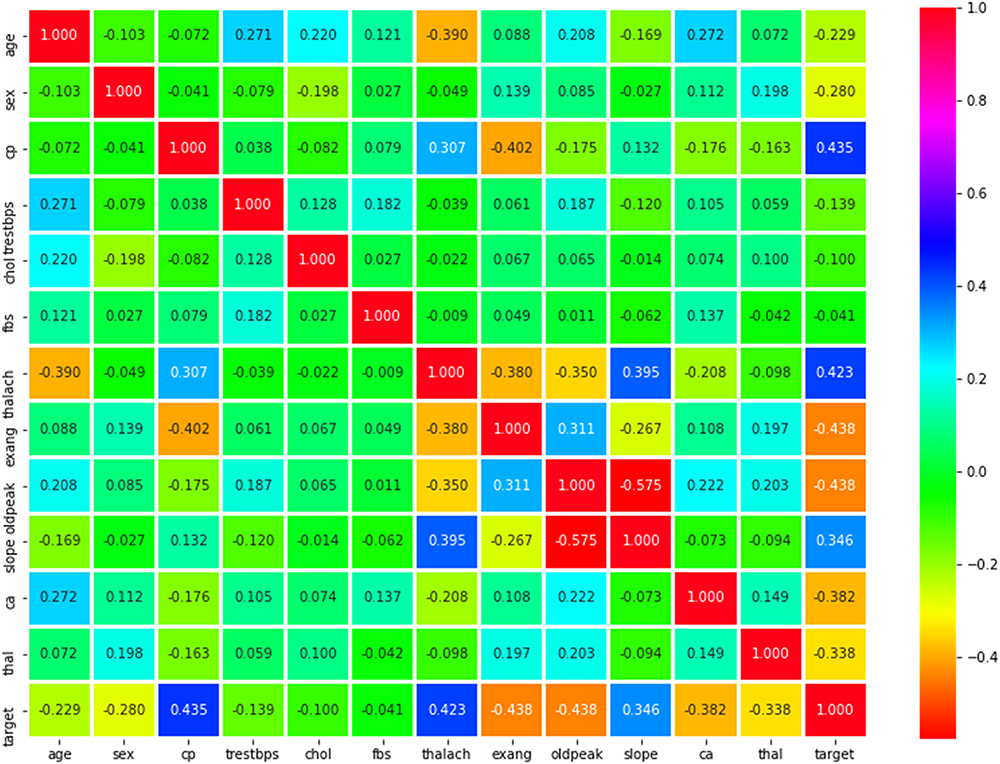 |
Figure 3 Correlation matrix between features (cp: the chest pain, trestbps: resting blood pressure, chol: cholesterol level, fbs: fasting blood sugar level, thalach: maximum heart rate, exang: exercise induced angina, oldpeak: ST depression induced by exercise relative to rest, slope: the slope of the peak exercise ST segment, ca: the number of major vessels, thal: a blood disorder called thalassemia, target: heart disease). |
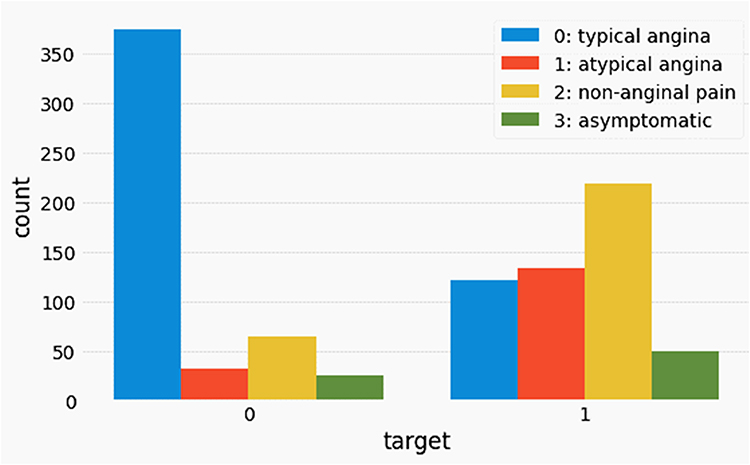 |
Figure 4 Data visualization demonstrating relation between types of chest pain and heart disease. |
Results of Heart Disease Prediction Models
Accuracy, precision, recall, F1-score and receiver operating characteristic (ROC) curve were used as performance evaluation metrics for model comparison. Accuracy, precision, recall and Fl-score are calculated from the actual and model predicted true positive, false positive, false negative, and true negative values.
Figures 5 and 6 show the ROC curves of XGBoost, ANN and random forest models trained using the patient information and clinical data for heart disease prediction. Each point on the ROC curve represents a sensitivity/specificity pair corresponding to a particular decision threshold. The area under an ROC curve (AUC) is a measure of the usefulness of a test and a greater area means a more useful test. AUC values of 0.98, 0.95 and 1 were obtained using the XGBoost, ANN and random forest models, respectively.
 |
Figure 5 ROC curves of (A) XGBoost and (B) neural network models trained using patient information and clinical data for heart disease prediction. |
 |
Figure 6 ROC curve of random forest model trained for heart disease prediction using patient information and clinical data. |
The summary of models’ performances on a test data are demonstrated in Table 3. As indicated in Figure 5 and Table 2, the random forest model outperforms the other models on predicting heart disease using the given data with an accuracy of 100%. Hence, the random forest model was selected deployed in our system for heart disease prediction.
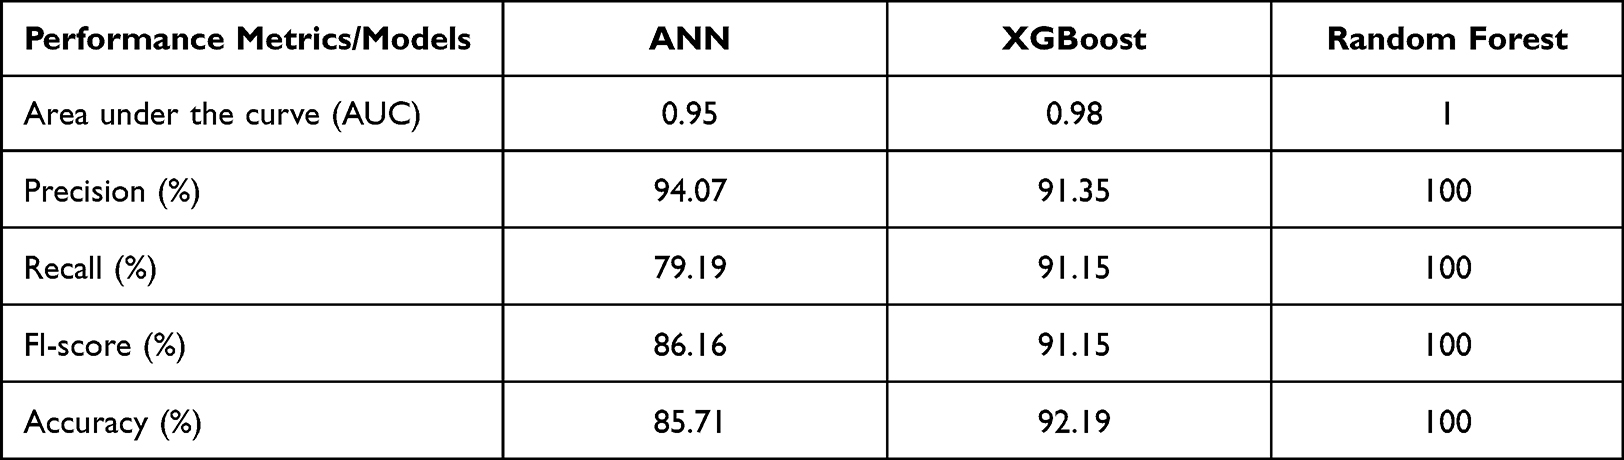 |
Table 3 Summary of Models’ Performance on Test Data for Prediction of Heart Disease |
Results of the Multiclassification Model
Figure 7 demonstrates the normalized confusion matrix of the multi-class classifier. The correct predictions for each class are expressed in the diagonal of the confusion matrix. The values in the off-diagonal illustrate the false positives and false negative results of the model. The model was found to be 93.27% accurate, on average, at classifying heart conditions.
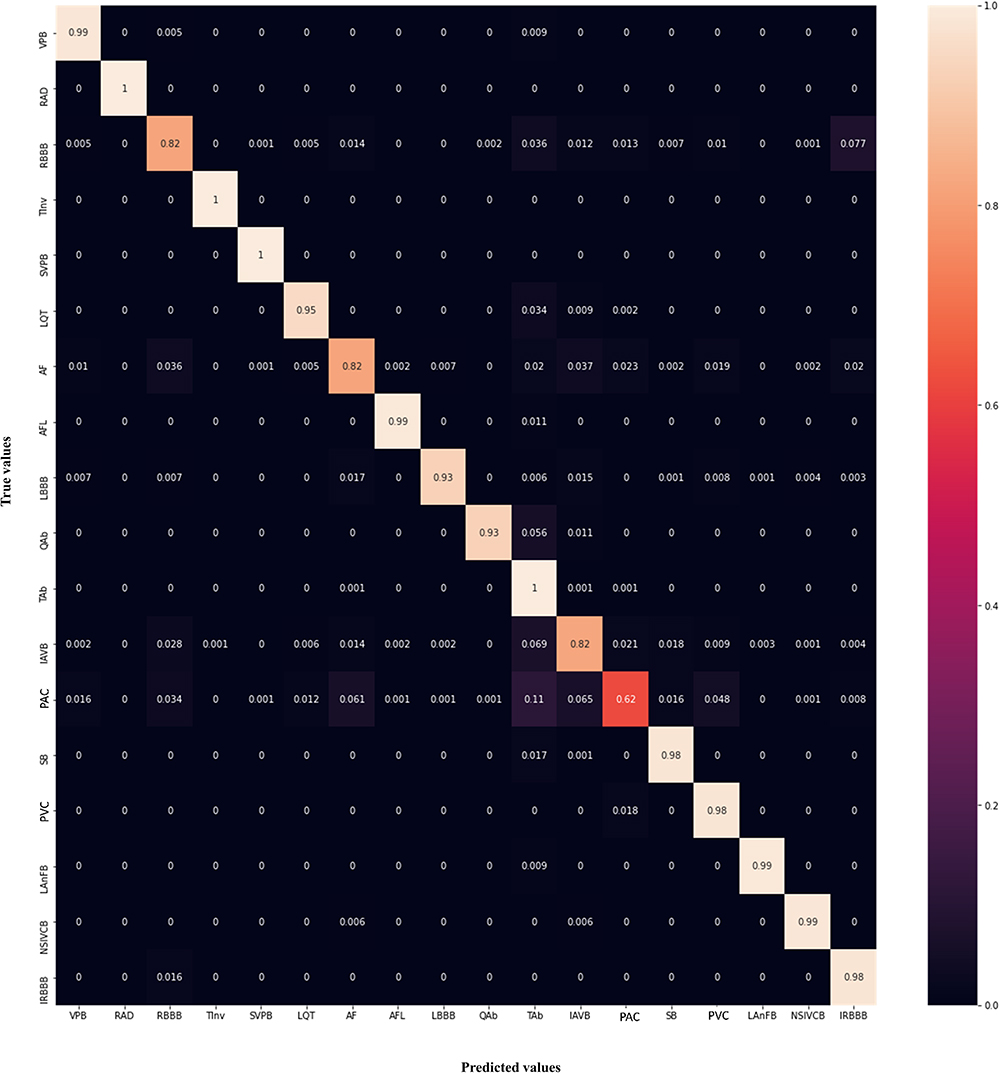 |
Figure 7 Normalized confusion matrix of the 12 lead ECG signal based multi-class classifier. |
ECG Processor
Figures 8A and B illustrate the raw ECG data and the processed signal (respectively) after removal of low-frequency, high-frequency and powerline interference noises. As demonstrated, the base line drift and high frequency noises, which are observed in the left signal are reduced in the processed signal. The detected R-peaks, PQST peaks, and delineation of each of the ECG waves are demonstrated in Figure 9. After extraction of the required peaks, an algorithm was developed and deployed in the web-based user interface for calculation of important indicators of heart abnormality including duration, slope and amplitude of ECG wave segments.
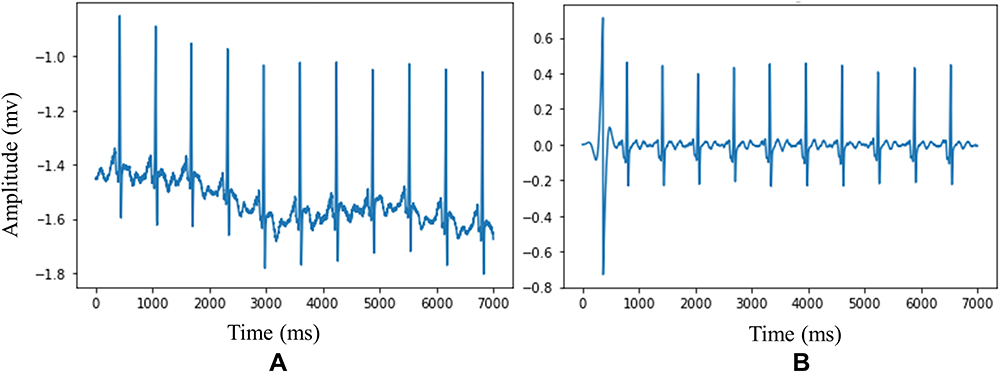 |
Figure 8 ECG signal noise removal (A) raw ECG signal (B) Noise filtered ECG signal. |
 |
Figure 9 ECG signal peak and wave extraction (A) ECG R-peaks detection (B) ECG PQST peaks detection (C) delineation of ECG waves. |
Web-Based User Interface (UI)
An integrated web-based user interface was developed for ease of use of the developed prediction systems and ECG signal processor. The developed user interface has three parts (modules), ECG processor, heart disease prediction, and heart disease classification from 12-lead ECG data. Using the ECG processor (Figure 10), users can upload a single lead ECG signal, enter the sampling frequency of the ECG signal, and by pressing the “Process” button, they can get the different ECG waveforms duration, slope and amplitude for quick diagnosis.
 |
Figure 10 ECG processor user interface (A) signal uploader (B) quantitative analysis of ECG waveforms. |
The heart prediction module accepts attribute information including age, sex, chest pain type, blood pressure, cholesterol level, fasting blood sugar, maximum heart rate, exercise induced angina, ST segment depression, the slope of the peak exercise ST segment, number of major vessels and a blood disorder called thalassemia. Then the system analyses the attributes and predicts whether the person has heart disease or not. Sample observations collected from a patient with heart disease, healthy person and the system’s predictions are demonstrated in Figure 11.
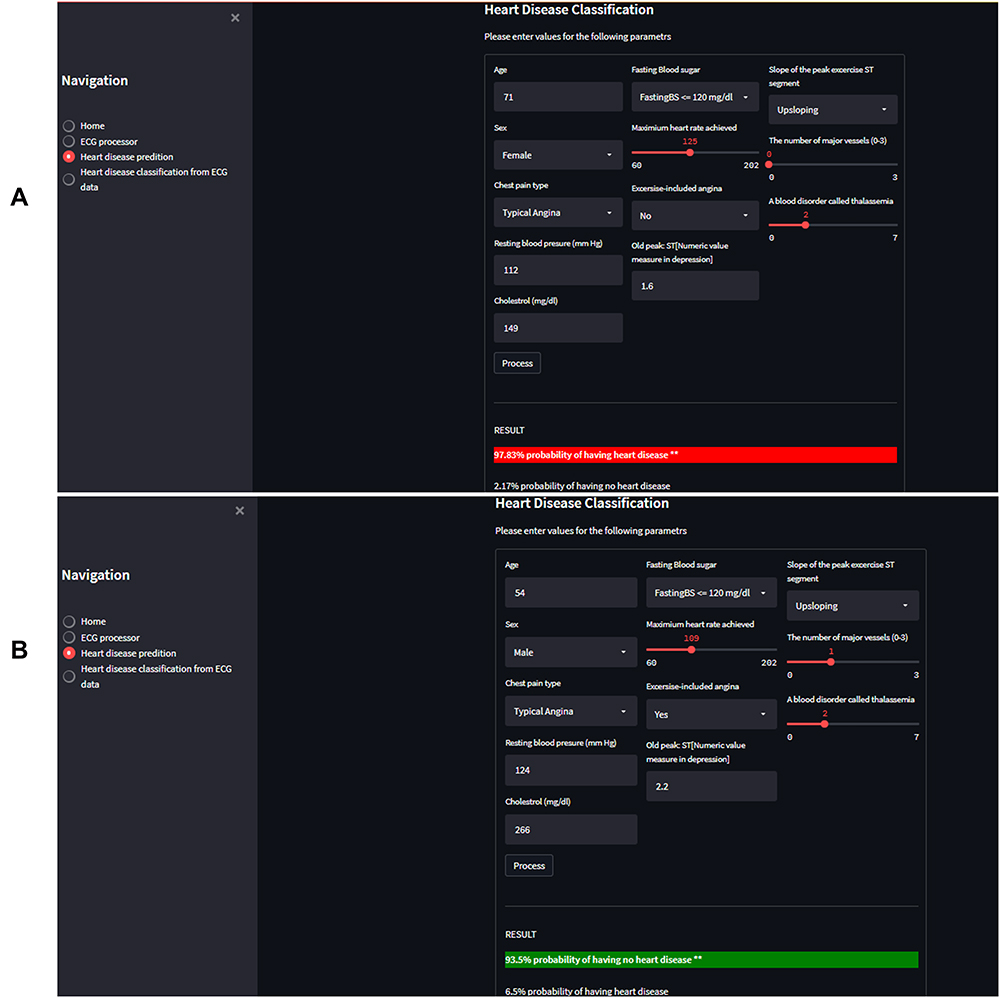 |
Figure 11 Heart-disease prediction user interface demonstrating typical observations (A) patient with heart disease and system’s prediction (B) healthy person and system’s prediction. |
Figure 12 demonstrates a snapshot of the heart disease classification user interface module based on a 12-lead ECG signal and patient information. The system accepts 12-lead ECG signal, the sampling frequency, gender and sex of the patient. Then, it analyzes the entered data and provides its top five predictions with the prediction percentile. This allows the cardiologist to use their expert knowledge and the system predictions to provide an informed final decision.
 |
Figure 12 User interface of Heart-disease classification using 12-lead ECG signal predicting a patient with “sinus tachycardia” cardiac condition. |
Discussion
Heart diseases are the leading cause of death globally. They are fatal diseases that are rapidly increasing in both developed and developing countries. Early diagnosis of heart disease with effective treatment can prevent death or slow down the clinical course. For efficient treatment planning, a variety of tests including laboratory, imaging and other non-invasive techniques are usually required. Physicians usually analyze results of different clinical laboratory tests, visualize and interpret ECG waveforms, measure ECG waveforms’ durations/intervals and amplitudes, and integrate all of these results to diagnose the type of heart disease. These traditional manual diagnosis procedures are time consuming, tedious, complex, and dependent on the physician's knowledge and experience which may sometimes lead to misdiagnosis.33 Due to the limited availability of medical diagnosing tools and medical experts in low-resource settings, diagnosis and cure of heart disease are more complex.11 Automating the manual diagnosis technique using AI-based predictive techniques could provide quick results helping physicians make informed decisions and reducing diagnosis errors.
To overcome the limitations of traditional manual diagnosis techniques for the diagnosis of heart disease, literature has attempted to develop different AI based predictive mechanisms using traditional machine learning and deep learning techniques.9,15–25,34–36 Even though the proposed techniques and the results reported are promising, they are designed to serve either a single purpose (eg, binary classification), or use a limited dataset type, or do not have a potential for translation or application into a clinical setting.
The purpose of this work was to design and develop an integrated heart diseases diagnosis decision support system that has a flexible application based on the available resources. The developed system was deployed on a user-friendly web-based application that includes three modules: ECG processor, heart disease prediction module and cardiac conditions/abnormality multiclassification module.
For the ECG processor module, different algorithms for signal noise removal, including removal of high and low frequency noise signal, baseline drift correction and power line interference removal have been designed and implemented. After signal pre-processing, a mechanism for ECG feature extraction including R-peak detection, PQST peak detection, ECG waves delineation and quantitative analysis of ECG wave segments were developed. As demonstrated in Figure 10, the ECG processor module allows users to load single lead ECG signal and perform quantitative analysis of important ECG wave segments for quick diagnosis. This module automates interpretation of ECG, which is inexpensive, widely affordable, and the most useful instrument in the diagnosis and prognosis of heart disease. The manual interpretation of ECG data is complex and exposed to intra- and interobserver variabilities.33 The developed system overcomes these challenges by providing an automatic quantitative assessment for informed decision making.
The second module, heart disease prediction system, uses different attribute information including age, sex and patient’s clinical data or observations, which are indicators of heart disease, and predicts whether the person has heart disease or not. The user interface (Figure 11) allows users to fill 12 important attribute information in to the system and predict the probability of having heart disease as a percentage. The percentile provides information to the patients/experts about the likelihood of having heart disease. This helps physicians to provide an informed decision and perform further diagnosis, and to the patients to take necessary actions to reduce behavioral risk factors and prevent life threats.
The third module (Figure 12), the 12-lead ECG based multiclassification system, enables users to load 12-lead ECG data, acquired from suspected heart disease patients, and provides predictions of the type of abnormality. It performs multiclassifications to discriminate the ECG data acquired from those of healthy individuals and patients with existing chronic heart conditions. Currently, 12-lead ECG is a standard method establishing cardiac disorders and used to determine the presence of arrhythmia, conduction defects, ischemia, and signs of structural heart diseases.37 The system provides top 5 predictions, among the 18 heart conditions, and their probability ranks based on the model’s prediction score. These also help physicians to provide an informed decision based on the results of the model predictions.
In summary, the system can be used for quick decision making based on the acquired ECG signal, or for prediction purpose based on the patient information and laboratory results, or for multiclassification of cardiac conditions based on a 12-lead ECG record, or for all purposes to provide an integrated diagnosis. The proposed system is designed to overcome the challenges of current manual heart disease diagnosis, providing physicians with reliable support, helping to minimize workload pressure while maximizing efficiency, allowing experts to perform informed patient specific diagnosis and treatment decisions. This work can also be used as the base for further AI-based heart disease diagnosis decision support system developments in the context of clinical adoption of computer aided diagnosis. We acknowledge that further experiments are required with real-world patients in order to fully validate the proposed system performance before translating it for a clinical application. Moreover, adding more data (both clinical and ECG data) may improve predictive accuracy.
Conclusion
This paper presents an integrated AI-based decision support tool for diagnosis and assessment of cardiac conditions. Different machine learning and deep learning models were trained, evaluated and compared using a variety of data collected from different sources. Best performing models were selected and deployed in a custom designed web-based user interface for the prediction of heart disease and multiclass classification of cardiac conditions. The developed system can provide a reference for clinical diagnosis, remove the opportunities for human error, saves time and money, and improves the diagnosis ability of clinicians for heart disease enabling timely decision making and treatment planning.
Our experimental results demonstrate that, the developed AI-based computer aided heart disease diagnosis system has the potential to improve diagnostic accuracy, and can be used as a decision support system, especially in those areas where both the means of diagnosis and experts are scarce.
Data Sharing Statement
The datasets used and/or analysed during the current study are available from publicly available UCI Machine Learning Repository (https://archive.ics.uci.edu/mL/index.php) or from the corresponding author on reasonable request.
Ethics Approval and Consent to Participate
This research did not involve humans, animals, or other subjects. According to Jimma University’s institutional review board (IRB), no formal ethics approval was required in this particular case.
Consent for Publication
This research did not involve humans, animals, or other subjects.
Acknowledgments
Resources required to conduct the study were provided by the school of Biomedical Engineering and faculty of computing, Jimma Institute of Technology, Jimma University.
Author Contributions
All authors made a significant contribution to the work reported, whether that is in the conception, study design, execution, acquisition of data, analysis and interpretation, or in all these areas; took part in drafting, revising or critically reviewing the article; gave final approval of the version to be published; have agreed on the journal to which the article has been submitted; and agree to be accountable for all aspects of the work.
Disclosure
The authors declare that they have no competing interests in this work.
References
1. World Health Organaization. Cardiovascular diseases (CVDs): World Health Organization; 2021 Available from: https://www.who.int/news-room/fact-sheets/detail/cardiovascular-diseases-(cvds).
2. Misganaw A, Mariam DH, Ali A, Araya T. Epidemiology of major non-communicable diseases in Ethiopia: a systematic review. J Health Popul Nutr. 2014;32(1):1–13.
3. Gebreyes YF, Goshu DY, Geletew TK, et al. Prevalence of high bloodpressure, hyperglycemia, dyslipidemia, metabolic syndrome and their determinants in Ethiopia: evidences from the national NCDs STEPS survey, 2015. PLoS One. 2018;13(5):e0194819. doi:10.1371/journal.pone.0194819
4. Tefera YG, Abegaz TM, Abebe TB, Mekuria AB. The changing trend of cardiovascular disease and its clinical characteristics in Ethiopia: hospital-based observational study. Vasc Health Risk Manag. 2017;13:143–151. doi:10.2147/VHRM.S131259
5. Hasbani NR, Ligthart S, Brown MR, et al. American Heart Association’s life’s simple 7: lifestyle recommendations, polygenic risk, and lifetime risk of coronary heart disease. Circulation. 2022;145(11):808–818. doi:10.1161/CIRCULATIONAHA.121.053730
6. Knowles JW, Ashley EA. Cardiovascular disease: the rise of the genetic risk score. PLoS Med. 2018;15(3):e1002546–e. doi:10.1371/journal.pmed.1002546
7. Said MA, Verweij N, van der Harst P. Associations of combined genetic and lifestyle risks with incident cardiovascular disease and diabetes in the UK Biobank Study. JAMA Cardiol. 2018;3(8):693–702. doi:10.1001/jamacardio.2018.1717
8. Rosiek A, Leksowski K. The risk factors and prevention of cardiovascular disease: the importance of electrocardiogram in the diagnosis and treatment of acute coronary syndrome. Ther Clin Risk Manag. 2016;12:1223–1229. doi:10.2147/TCRM.S107849
9. Das R, Turkoglu I, Sengur A. Effective diagnosis of heart disease through neural networks ensembles. Expert Syst Appl. 2009;36(4):7675–7680. doi:10.1016/j.eswa.2008.09.013
10. Müller MM, Griesmacher A. Rational diagnosis of cardiovascular disease. EJIFCC. 2003;14(2):95–103.
11. Yang H, Garibaldi JM. A hybrid model for automatic identification of risk factors for heart disease. J Biomed Inform. 2015;58(Suppl):S171–S82. doi:10.1016/j.jbi.2015.09.006
12. Coca A, Messerli FH, Benetos A, et al. Predicting stroke risk in hypertensive patients with coronary artery disease: a report from the INVEST. Stroke. 2008;39(2):343–348. doi:10.1161/STROKEAHA.107.495465
13. Kiyasseh D, Zhu T, Clifton D. The promise of clinical decision support systems targetting low-resource settings. IEEE Rev Biomed Eng. 2022;15:354–371. doi:10.1109/RBME.2020.3017868
14. Korom RR, Njue G. Clinical decision support systems in low resource settings. BMJ. 2020;371:m3962. doi:10.1136/bmj.m3962
15. Patel J, TejalUpadhyay D, Patel S. Heart disease prediction using machine learning and data mining technique. Heart Dis. 2015;7(1):129–137.
16. Haq AU, Li JP, Memon MH, Nazir S, Sun R. A hybrid intelligent system framework for the prediction of heart disease using machine learning algorithms. Mob Inform Sys. 2018;2018:3860146. doi:10.1155/2018/3860146
17. Khourdifi Y, Bahaj M. Heart disease prediction and classification using machine learning algorithms optimized by particle swarm optimization and ant colony optimization. Int J Intell Eng Syst. 2019;12:242–252. doi:10.22266/ijies2019.0228.24
18. Latha CBC, Jeeva SC. Improving the accuracy of prediction of heart disease risk based on ensemble classification techniques. Inform Med Unlocked. 2019;16:100203. doi:10.1016/j.imu.2019.100203
19. Detrano R, Janosi A, Steinbrunn W, et al. International application of a new probability algorithm for the diagnosis of coronary artery disease. Am J Cardiol. 1989;64(5):304–310. doi:10.1016/0002-9149(89)90524-9
20. Gudadhe M, Wankhade KK, Dongre SS. Decision support system for heart disease based on support vector machine and artificial neural network.
21. Kahramanli H, Allahverdi N. Design of a hybrid system for the diabetes and heart diseases. Expert Syst Appl. 2008;35(1–2):82–89. doi:10.1016/j.eswa.2007.06.004
22. Olaniyi EO, Oyedotun OK, Adnan K. Heart diseases diagnosis using neural networks arbitration. Int J Intell Syst Appl. 2015;7(12):72. doi:10.5815/ijisa.2015.12.08
23. Tomov N-S, Tomov S. On deep neural networks for detecting heart disease. arXiv preprint. 2018. doi:10.48550/arXiv.1808.07168
24. Muhammad Y, Tahir M, Hayat M, Chong KT. Early and accurate detection and diagnosis of heart disease using intelligent computational model. Sci Rep. 2020;10(1):19747. doi:10.1038/s41598-020-76635-9
25. Ali L, Niamat A, Khan JA, et al. An optimized stacked support vector machines based expert system for the effective prediction of heart failure. IEEE Access. 2019;7:54007–54014. doi:10.1109/ACCESS.2019.2909969
26. Dua D, Graff C. UCI Machine Learning Repository. Irvine, CA: University of California, School of Information and Computer Science; 2019.
27. Alday EAP, Gu A, Shah A, et al. Classification of 12-lead ECGs: the physionet/computing in cardiology challenge 2020. medRxiv. 2020;41(12):124003.
28. Chen T, Guestrin C, editors. Xgboost: a scalable tree boosting system.
29. Breiman L. Random Forests. Mach Learn. 2001;45(1):5–32. doi:10.1023/A:1010933404324
30. Kaiser J, Schafer R. On the use of the I 0-sinh window for spectrum analysis. IEEE Trans Acoust. 1980;28(1):105–107. doi:10.1109/TASSP.1980.1163349
31. Makowski D, Pham T, Lau ZJ, et al. NeuroKit2: a Python toolbox for neurophysiological signal processing. Behav Res Methods. 2021;53(4):1689–1696. doi:10.3758/s13428-020-01516-y
32. Bazett HC. An analysis of the time relations of electrocardiograms. Heart. 1920;7:353–370.
33. Allen LA, Stevenson LW, Grady KL, et al. Decision making in advanced heart failure: a scientific statement from the American Heart Association. Circulation. 2012;125(15):1928–1952. doi:10.1161/CIR.0b013e31824f2173
34. Methaila A, Kansal P, Arya H, Kumar P. Early heart disease prediction using data mining techniques. J Comput Sci Inf Tech. 2014;24:53–59.
35. Samuel OW, Asogbon GM, Sangaiah AK, Fang P, Li G. An integrated decision support system based on ANN and Fuzzy_AHP for heart failure risk prediction. Expert Syst Appl. 2017;68:163–172. doi:10.1016/j.eswa.2016.10.020
36. Nazir S, Shahzad S, Mahfooz S, Nazir M. Fuzzy logic based decision support system for component security evaluation. Int Arab J Inf Technol. 2018;15(2):224–231.
37. Kirchhoff P, Benussi S, Kotecha D, Ahlsson A, Atar D, Casadei B. ESC guidelines for the management of atrial fibrillation developed in collaboration with EACTS: the task force for the management of atrial fibrillation of the European Society of Cardiology (ESC) developed with the special contribution of the European Heart Rhythm Association (EHRA) of the ESC, endorsed by the European Stroke Organization (ESO). Eur J Cardiothorac Surg. 2016;50(5):e1–e88. doi:10.1093/ejcts/ezw313
 © 2022 The Author(s). This work is published and licensed by Dove Medical Press Limited. The
full terms of this license are available at https://www.dovepress.com/terms
and incorporate the Creative Commons Attribution
- Non Commercial (unported, 3.0) License.
By accessing the work you hereby accept the Terms. Non-commercial uses of the work are permitted
without any further permission from Dove Medical Press Limited, provided the work is properly
attributed. For permission for commercial use of this work, please see paragraphs 4.2 and 5 of our Terms.
© 2022 The Author(s). This work is published and licensed by Dove Medical Press Limited. The
full terms of this license are available at https://www.dovepress.com/terms
and incorporate the Creative Commons Attribution
- Non Commercial (unported, 3.0) License.
By accessing the work you hereby accept the Terms. Non-commercial uses of the work are permitted
without any further permission from Dove Medical Press Limited, provided the work is properly
attributed. For permission for commercial use of this work, please see paragraphs 4.2 and 5 of our Terms.
Recommended articles
Artificial Intelligence Analysis of Biofluid Markers in Age-Related Macular Degeneration: A Systematic Review
Pucchio A, Krance SH, Pur DR, Miranda RN, Felfeli T
Clinical Ophthalmology 2022, 16:2463-2476
Published Date: 7 August 2022
Radiologic Technology Students’ Perceptions on Adoption of Artificial Intelligence Technology in Radiology
Arif WM
International Journal of General Medicine 2024, 17:3129-3136
Published Date: 16 July 2024
Automatic Real-Time Detection and Diagnosis of Liver Tumor with Ultrasound

Wu CH, Sheu JC, Chou PL, Lee J, Nien HC
Journal of Hepatocellular Carcinoma 2025, 12:1599-1611
Published Date: 23 July 2025
Artificial Intelligence in the Management of Asthma: A Review of a New Frontier in Patient Care
Tan LD, Nguyen N, Lopez E, Peverini D, Shedd M, Alismail A, Nguyen HB
Journal of Asthma and Allergy 2025, 18:1179-1191
Published Date: 16 August 2025
A Review on the Applications of Artificial Intelligence for Diagnosing and Treating Cervical Cancer
Wu Y, Wang A
International Journal of Women's Health 2025, 17:3955-3970
Published Date: 29 October 2025