Back to Journals » Journal of Inflammation Research » Volume 14
Comprehensive Identification of Bridge Genes to Explain the Progression from Chronic Hepatitis B Virus Infection to Hepatocellular Carcinoma
Authors Nong W, Ma L, Lan B, Liu N, Yang H, Lao X, Deng Q, Huang Z
Received 4 January 2021
Accepted for publication 16 March 2021
Published 21 April 2021 Volume 2021:14 Pages 1613—1624
DOI https://doi.org/10.2147/JIR.S298977
Checked for plagiarism Yes
Review by Single anonymous peer review
Peer reviewer comments 2
Editor who approved publication: Professor Ning Quan
Wenwei Nong,1,* Liping Ma,2,* Biyang Lan,1 Ning Liu,1 Hongzhi Yang,1 Xiaoxia Lao,2 Qiaomei Deng,2 Zhihu Huang2
1Department of General Surgery, Affiliated Minzu Hospital of Guangxi Medical University, Nanning, People’s Republic of China; 2Department of Clinical Laboratory, Affiliated Minzu Hospital of Guangxi Medical University, Nanning, People’s Republic of China
*These authors contributed equally to this work
Correspondence: Zhihu Huang
Affiliated Minzu Hospital of Guangxi Medical University, Nanning, People’s Republic of China
Email [email protected]
Background: Hepatitis B virus infection co-occurs in 33% of individuals with hepatocellular carcinoma worldwide. However, the molecular link between hepatitis B virus and hepatocellular carcinoma is unknown. Thus, we aimed to elucidate molecular linkages underlying pathogenesis through in-depth data mining analysis.
Materials and Methods: Differentially expressed genes were identified from patients with chronic hepatitis B virus infection, hepatocellular carcinoma, or both. Gene set enrichment analysis revealed signaling pathways involving differentially expressed genes. Protein-protein interaction networks, protein crosstalk, and enrichment were analyzed to determine whether differentially expressed gene products might serve as a bridge from hepatitis B virus infection to hepatocellular carcinoma pathogenesis. Prognostic potential and transcriptional and post-transcriptional regulators of bridge genes were also examined.
Results: We identified vital bridge factors in hepatitis B virus infection-associated hepatocellular carcinoma. Differentially expressed genes were clustered into modules based on relative protein function. Signaling pathways associated with cancer, inflammation, immune system, and microenvironment showed significant crosstalk between modules. Thirty-two genes were dysregulated in hepatitis B virus infection-mediated hepatocellular carcinoma. CPEB3, RAB26, SLCO1B1, ST3GAL6 and XK had higher connectivity in the modular network, suggesting significant associations with survival. CDC20 and NUP107 were identified as driver genes as well as markers of poor prognosis.
Conclusion: Our results suggest that the sustained inflammatory environment created by hepatitis B virus infection is a risk factor for hepatocellular carcinoma. The identification of hepatitis B virus infection-related hepatocellular carcinoma bridge genes provides testable hypotheses about the pathogenesis of hepatocellular carcinoma.
Keywords: signaling pathways, molecular processes, protein-protein interactions, chronic hepatitis B virus infection, hepatocellular carcinoma
Introduction
Hepatocellular carcinoma (HCC) is the second leading cause of cancer-related death worldwide.1–3 Surgical treatments have been developed to complement standard treatments, such as hepatectomy, liver transplantation and palliative treatment. These surgical procedures have improved prognosis of patients with HCC, but the overall survival rate is still poor due to the high mortality rate.3 HCC onset typically occurs after prolonged liver disease and is associated with numerous risk factors, which include chronic infection with hepatitis B virus (HBV) or hepatitis C virus (HCV), alcohol abuse, and nonalcoholic fatty liver disease.4
A World Health Organization survey in 2015 showed that approximately 257 million people (3.5% of the global population) suffer from chronic HBV infection.5 Globally, HBV infection is a major driver of HCC development.6 This is particularly true in Asia, where HBV infection is endemic and 70–80% of Asians having chronic HBV infection suffers from HCC.7 In Africa, HBV-associated HCC remains a leading cause of death among young people.5 However, the molecular link between HBV and HCC is unknown.
The HBV genome can integrate into the host DNA, modifying host genes near the gene insertion point, which destabilizes the host genome and produces an oncogenic fusion protein.8 In addition to altering cell survival, chronic HBV infection changes the liver environment.9 HBV infection induces an immune response, leading to chronic liver inflammation and fibrosis. Not only does this deplete the local immune response, but it also creates hypertonic conditions in the liver that lead to shrinkage and dysfunction of hepatocytes. This microenvironment can promote hepatocyte mutations that trigger apoptosis and malignant transformation.10–13 However, the networks of genes that serve as a bridge from HBV-mediated liver inflammation to HCC development remain unclear.
To explore these networks, we analyzed gene expression profiles from patients with chronic HBV infection, HCC, or both. Differentially expressed genes (DEGs) were assigned to different modules based on predicted protein-protein interactions, and modules were identified that likely contribute to HBV-mediated HCC. Potential key bridging factors were confirmed by pathway enrichment and correlation with patient prognosis. Furthermore, potential transcriptional and post-transcriptional regulators of suspected bridge genes were identified. The results of these analyses may provide insights into the pathogenesis of HCC and help identify prognostic markers for earlier diagnosis.
Materials and Methods
Data Resources
To systematically analyze the molecular linkages between chronic HBV infection and HCC, we collected expression profiles of liver mRNA from the Gene Expression Omnibus. GSE8314813 contains 122 HBV-positive hepatitis patients and 6 normal control liver tissue samples, while GSE12124814 includes 70 HBV-positive HCC and 37 HBV-positive paracancerous liver tissue samples. All data were assessed using the Affymetrix Human Genome U133 Plus 2.0 Array. Next, high throughput RNA sequencing (RNA-seq) data from 341 HCC and 50 healthy samples were obtained from the Cancer Genome Atlas (TCGA) database. These HCC samples came from stage I (n = 171), stage II (87) or stages III–IV (83). The quality of the data samples was evaluated using principal component analysis (PCA).15
Identification of Differentially Expressed Genes (DEGs)
Genes differentially expressed (DEGs) among patients with HBV or HCC or both were calculated using the limma package16 in R. First the data underwent background correction. Then the “normalizebetweenarrays” function filtered the data based on levels of control and low-expression probes. We defined statistically significant DEGs as those with p < 0.05 and |log (fold change [FC]) | > 0.5.
For the RNA-seq gene expression profile data from TCGA, the 0 genes were filtered out by 50%, and the difference analysis was performed using degseq2.17 Each HCC sample, regardless of stage, was analyzed for differences from the corresponding control samples. DEGs that met a statistical threshold of p < 0.05 and |log2FC| > 0.5 were analyzed further.
Gene Set Enrichment Analysis
Gene set enrichment analysis (GSEA) software computed enrichment scores for DEGs.18 Briefly, genes were ranked by significance after a signal-to-noise test was performed. Overlap of genes across datasets increases the level of significance. The magnitude of either the increase or decrease in the statistical significance of each step corresponds to the degree of change in gene expression under each condition. Next, the statistical significance of the enrichment score was estimated using a phenotype-based displacement test procedure. Then, the enrichment score of each sample was normalized based on sample number size, resulting in a standardized enrichment score (NES). We also calculated the false discovery rate (FDR). The pathways were analyzed in detail if their NES was associated with p < 1.0 and nominal (NOM) p < 0.05.
Identification of Interactions Between HBV- and HCC-Related Proteins
All human protein-protein interactions were identified based on the STRING database,19 which indicated 405 916 interaction pairs involving 10,514 proteins. The union of inflammation and cancer DEGs was mapped onto the protein-protein interaction network and maximal centrality clique (MCC). The MCODE algorithm20 identified functional modules related to inflammation and cancer by applying default parameters and screening interaction pairs with a score >900. Cytoscape software21 visualized the interactions between HBV- and HCC-related proteins. The ClusterONE algorithm22 selected modules with degree > 30, and gene sets with p < 0.05 were considered important genes within the modules.
Analysis of Protein Crosstalk Between Chronic HBV Infection and HCC
We constructed a comprehensive protein pathway crosstalk network with 1000 random protein-protein interaction networks, where network size and the degree of each node remained constant. Significance of crosstalk for each pair of modules shared between HBV and HCC was calculated by p = n/N. The number of inter-module interaction pairs in N random networks (N = 1000) is estimated to be higher than the number of inter-module interaction pairs in the real system (denoted as n). When p < 0.01, then crosstalk module pairs are more significant than random. We found that the number of interaction pairs between modules was greater than the number of interaction pairs in a random background. Cytoscape software created complex relationship maps illustrating the crosstalk between the significant module genes.
Signaling Pathway Enrichment Analysis
The Clusterprofiler package23 in R used protein-protein interaction modules to enrich for pathways of the Kyoto Encyclopedia of Genes and Genomes (KEGG) (p cut-off = 0.01, q cutoff = 0.01). Subsequently, we extracted HBV- and HCC-associated signaling pathways and considered these to be molecular bridges between the two diseases at the functional and pathway levels. To further evaluate the potential diagnostic value of bridge genes for HBV-related HCC, receiver operating characteristic curve (ROC) analysis was performed using the pROC routine24 in R.
Pivot Analysis Predicts Transcriptional Regulators of Module Genes
Pivot nodes, which are nodes that interact with at least two modules, may be transcription factors or non-coding RNAs that regulate the expression of genes in modules related to HBV or HCC. The Python program identified pivot nodes, and significance (p < 0.01) was calculated using the hypergeometric test. This analysis allowed the prediction of regulators of bridge genes involved in HBV-associated HCC.
Molecular Docking Analysis
Docking is the process of bringing one molecule close to another. The PDB files of DOCK2 and its targets were downloaded from the Protein Data Bank (www.rcsb.org).25 The docking of DOCK2 and its targets was performed using hex 8.0.0.0 software,26 and the results were visualized using PyMOL software.27
Results
Clustering of Genes Involved in Viral Hepatitis Type B and HCC
We analyzed the quality of HBV, HCC, and HBV-associated HCC gene expression profiles and signaling pathways corresponding to groups (modules) of genes (Figure S1 and 2). HBV-associated genes were significantly involved in the ErbB and Wnt signaling pathways (Figure S2A). The different stages of HCC (I–IV) were significantly associated with genes involved in the following pathways: stage I, genes associated with the cell cycle; stage II, RNA polymerase; stage III, pyrimidine metabolism; and stage IV, Notch signaling (Figure S2B, Table S1). The HBV-associated HCC group contained genes significantly involved in ubiquitin-mediated proteolysis and basal transcription factors (Figure S2C).
Examination of significant DEGs identified 1555 in the HBV group (Figure 1A). The HBV-associated HCC group included 2386 significant DEGs (Figure 1B). Within the HCC group, stage I contained 9122 significant DEGS; stage II, 10,249; stage III, 10,347; and stage IV, 8723 (Figure 1C). There were 5823 genes shared among the 4 stages, and 901 of these genes were progressive up- or down-regulation moving from stage I to stage IV (Figure 1D). We found 65 genes shared among the three groups of patients with HBV, HCC or both, and these genes showed different expression levels across the three groups (Figure 1E). We hypothesized that these genes act as “bridges” to progress from chronic HBV infection to HCC.
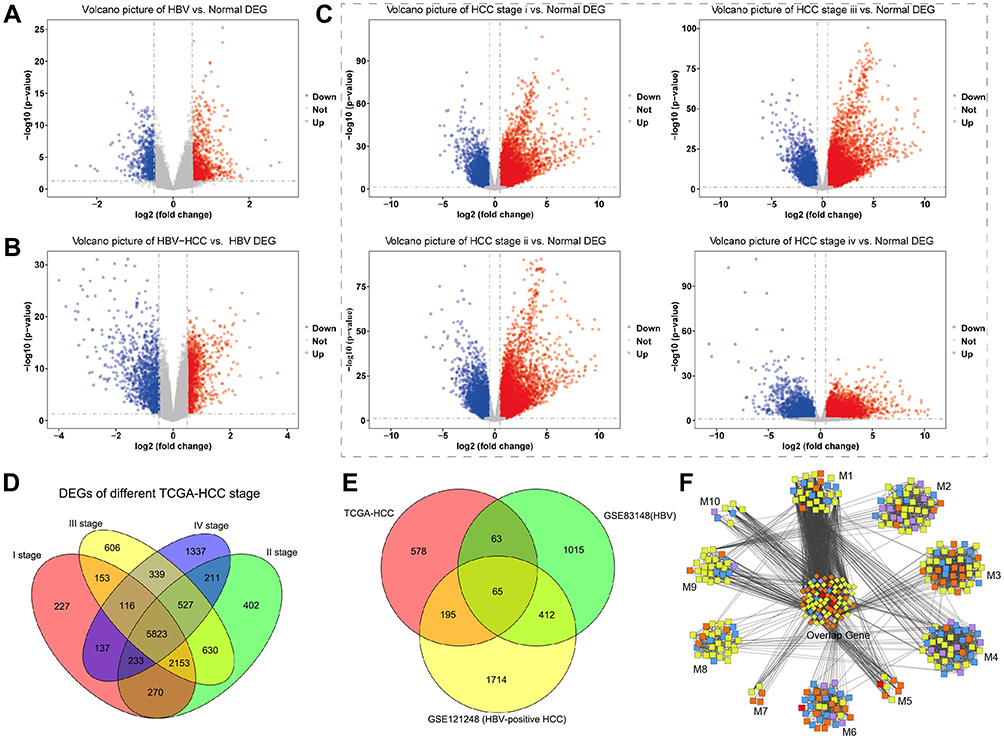 |
Figure 1 Genes differentially expressed in patients with HBV, HCC or both. Levels of mRNA were analyzed to identify differentially expressed genes, and results are shown as volcano plots comparing (A) HBV and healthy samples, (B) HBV-related HCC and healthy samples, or (C) stage-specific HCC and healthy samples. Red represents up-regulated genes, and blue represents down-regulated genes. (D) Venn diagram showing 5823 differentially expressed genes among stages I–IV of HCC. (E) Venn diagram showing 901 genes differentially regulated between disease and healthy states, and the subset of 65 genes shared among patients with HBV or HCC or both. (F) Differentially expressed genes clustered into 10 modules (M) based on protein-protein interactions. The middle cluster contains genes overlapping among all three groups (HBV, HCC, HBV-associated HCC). Red nodes contain differentially expressed genes present in all three groups; orange nodes, genes in two groups; blue nodes, genes only in HBV; yellow nodes, genes only in HBV-associated HCC; purple nodes, genes only in HCC. |
Interactions Between Proteins Encoded by Overlapping DEGs
We searched for genes that were differentially expressed in HBV or HBV-associated HCC or that were persistently dysregulated in HCC. These genes were then screened to determine whether the encoded proteins were potentially involved in progression from chronic HBV infection to HCC. A protein-protein interaction network based on 4042 genes showed that 352 genes clustered into 10 modules associated with dysfunction (Figure 1F). The DEGs associated with HBV and HCC clustered tightly within the same module, and all modules contained genes associated with HBC, HCC or HBV-associated HCC. This suggests that gene modules mediate a link between chronic HBV infection and HCC.
Significant Crosstalk and Shared Pathways Between Liver Inflammation and HCC
We examined connections among the 10 modules and found 7 with significant crosstalk (Figure 2A). The module M1 had the highest connectivity, suggesting that its genes may reveal critical insights into how liver inflammation may lead to HCC. KEGG pathway analysis revealed that two gene modules were involved in HCC (M7 and M5), progesterone-mediated oocyte maturation (M1 and M4), p53 signaling pathway (M1 and M3), Staphylococcus aureus infection (M3 and M6), and RNA transport (M1 and M2). We found that most of the signaling pathways associated with the module genes were related to microenvironment and infection immunity (Figure 2B), including glycolysis, TGF-beta signaling, and Kaposi sarcoma-associated herpesvirus infection.
 |
Figure 2 Protein crosstalk and signaling pathways associated with genes bridging chronic HBV infection and HCC. (A) Protein-protein interactions were assessed by measuring crosstalk between modules shared by HBV and HCC. Red nodes, module M1; blue nodes, M3; pink nodes, M5; green nodes, M6; yellow nodes, M7; orange nodes, M9; and purple nodes, M10. (B) KEGG analysis identified signalling pathways involving module genes from all groups. The most common pathways are related to cancer (orange arrow), infection (purple triangle), metabolism (green square), and immune system (red diamond). Yellow circles are labeled with their corresponding module number. |
Genes Bridging Chronic HBV Infection and HCC
We identified 65 DEGs whose expression was higher in HCC and HBV-associated HCC than in HBV (Figure 1E). Of these, we identified 32 showing sustained up- or down-regulation suggesting that they are critical for HBV-associated HCC (Figure 3A).
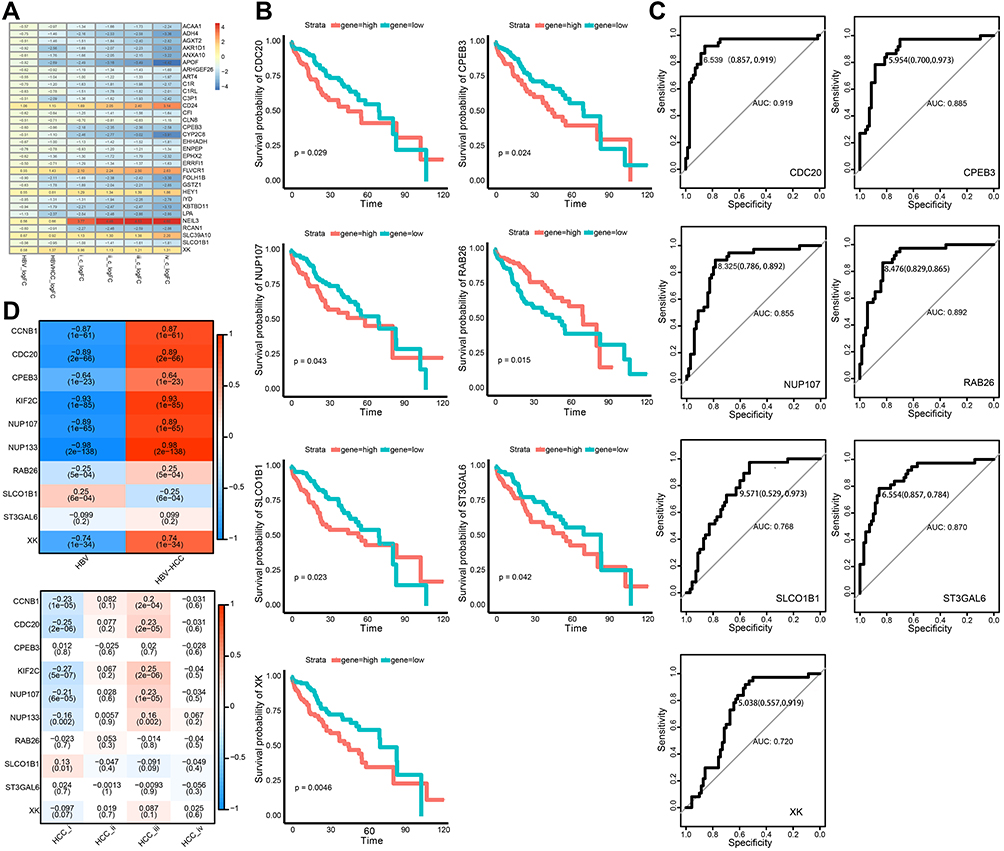 |
Figure 3 Identification of bridge genes for HBV-induced HCC. (A) Heatmap depicting 32 dysregulated genes in the progression from HBV to HCC. Red represents up-regulated and blue represents down-regulated. (B) Line graph depicting survival probabilities over time for HCC patients showing high or low expression of the respective gene. (C) Receiver operating characteristic curves showing prognostic potential of bridge genes in HBV-related HCC. (D) Heat map depicting correlations of bridge genes. Red stands for positive correlation and blue stands for negative correlation. |
Next, we analyzed network connectivity of the genes clustered into modules. Genes with higher connectivity are thought to have greater regulatory potential in the network. CDC20 had the maximum network connectivity. Other genes, including CCNB1, NUP133, KIF2C, and NUP107, also showed high connectivity. Moreover, we found that the drug Lomustine may target the protein product of the pivot gene CCNB1, based on the DRUGBANK database (https://go.drugbank.com/).
Genes with high network connectivity were considered to be potentially associated with patient prognosis. CPEB3, RAB26, SLCO1B1, ST3GAL6, XK, CDC20 and NUP107 were significantly linked to low survival rates in patients with HCC (Figure 3B). Cases with high expression of RAB26 showed better survival. The prognostic value of bridge genes in HBV-associated HCC was tested directly using ROC curves. CDC20 (area under ROC = 0.919) was a superior biomarker than other bridge genes (Figure 3C). Further analyses showed that bridge genes were significantly associated with phenotypic markers present in HBV and HCC liver tissue, including markers corresponding to different HCC stages (Figure 3D).
Non-Coding RNA and Transcriptional Factors Regulate Bridge Genes in HBV-Associated HCC
To explore the potential transcriptional regulation of bridge genes, we applied prediction analysis to the dysfunction modules based on transcriptional and post-transcriptional regulatory relationships. We found that a total of 202 microRNAs (miRNAs), 7 long non-coding RNAs (lncRNAs) and 44 transcription factors were associated with our modules. These equated to 2086 miRNA-module interaction pairs, 169 lncRNA-module interaction pairs, and 260 transcription factor-module interaction pairs.
In-depth analysis of these predicted interactions revealed that significant regulatory effects were exerted on the bridge gene CCNB1 by 28 miRNAs, 2 lncRNAs and 6 transcription factors (Figure 4). Three miRNAs and one lncRNA substantially regulated NUP107. NUP133 was significantly impacted by 10 miRNAs and 1 lncRNA. These transcription regulators may mediate the occurrence and development of HBV-associated HCC. Furthermore, to verify if there were targeted bindings among molecules shown in Figure 5, molecular docking was performed. Negative binding energy, which suggests possible binding, was identified for CCNB1 and YBX1 (energy = −700.656), CCNB1 and NFKB1 (energy = −727.3), CCNB1 and E2F4 (energy = −572.42), CCNB1 and 2EBT (energy = −641.16), CCNB1 and KLF5 (energy = −754.62), as well as CCNB1 and RELA (energy = −366.21) (Figure 5).
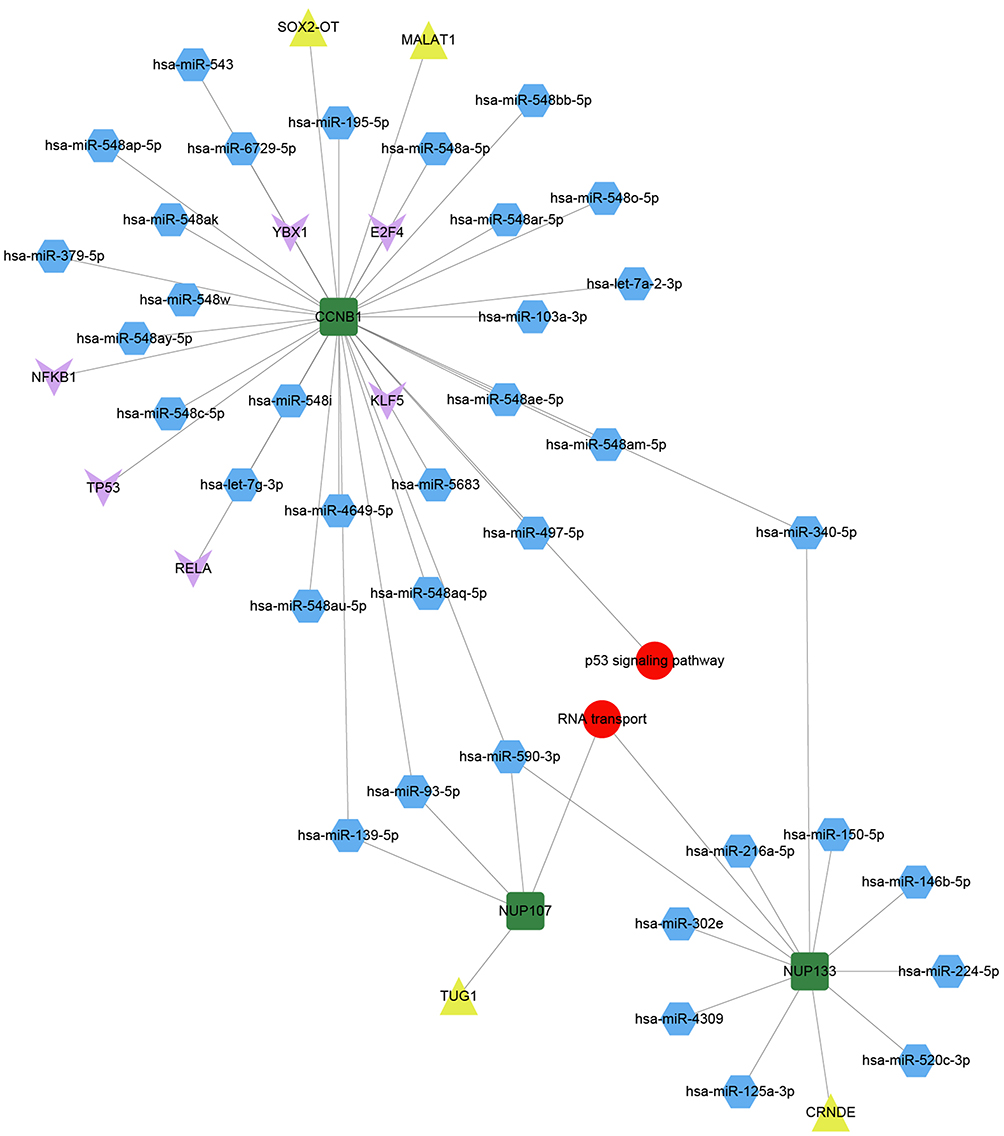 |
Figure 4 Pivot regulators of bridge genes within the module. Regulators interacting with multiple modules at least twice were identified as potential regulators of bridge genes. Green squares represent bridge genes in modules; blue hexagons, microRNAs; yellow triangles, long non-coding RNAs; pink arrows, transcription factors; and red circles, signaling pathways involved in bridge genes. |
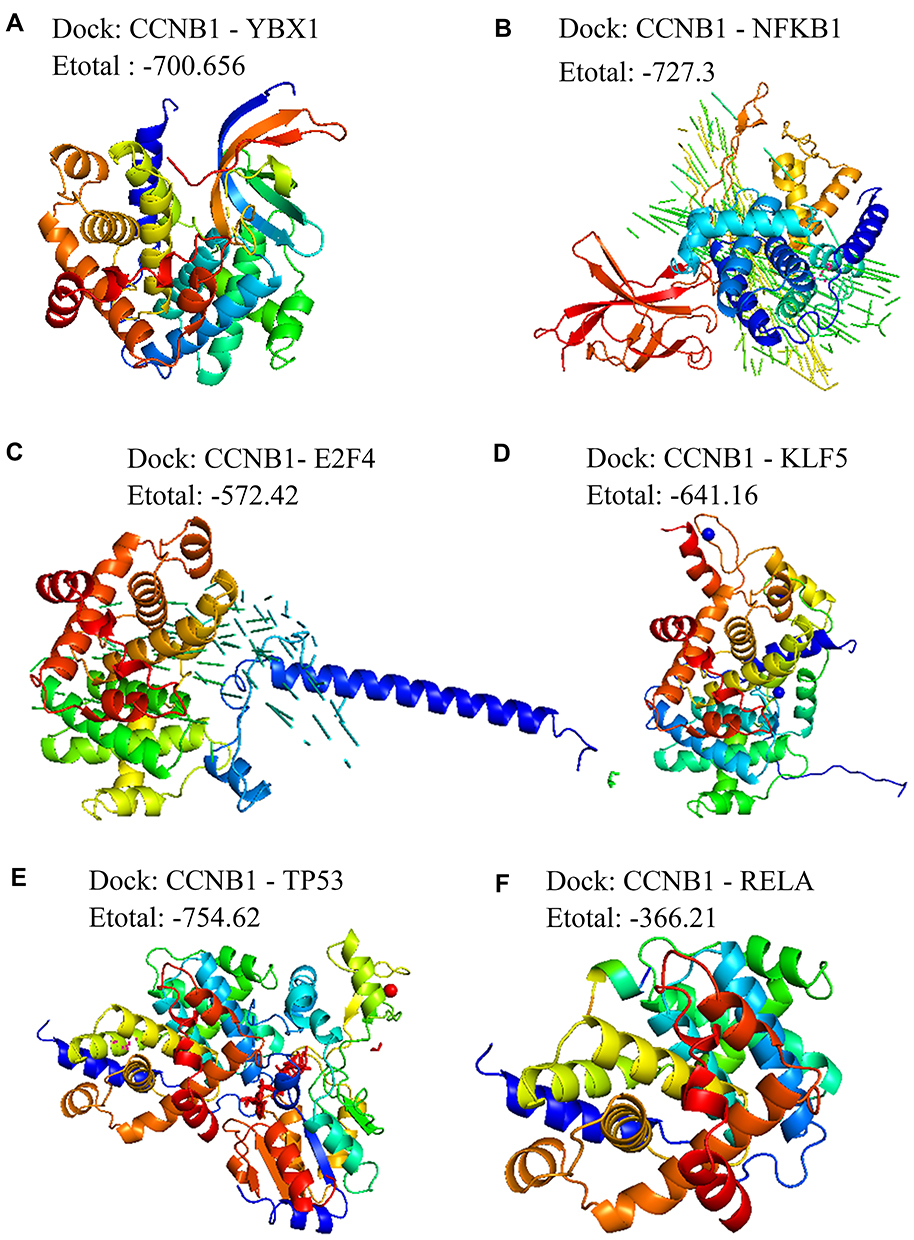 |
Figure 5 Molecular docking between pivot regulators and the bridge genes in the module. Docking of CCNB1 with (A) YBX1, (B) NFKB1, (C) E2F4, (D) KLF5, (E) TP53, or (F) RELA. |
Discussion
Approximately half of all HCC cases are associated with HBV, making it the most common cause of cancer worldwide.28 Therefore, the present study integrated resources from multiple databases to determine which genes may be responsible for the transition from HBV-induced liver inflammation to HCC onset. We assessed changes in gene transcription levels in healthy control patients and patients with HBV, HCC or both. Protein-protein interaction networks, crosstalk analysis, transcriptional regulation, and post-transcriptional regulation were combined to identify genes bridging chronic HBV infection and HBV-associated HCC. These findings provide new insights into the gene and protein interactions common to these diseases. The predicted upstream non-coding RNA and transcription factors provide numerous leads and hypotheses for subsequent research.
Our analyses found unique and overlapping DEGs in liver samples from patients with HBV, HCC or both. Then the corresponding proteins were examined for enrichment in molecular pathways and involvement in protein-protein interactions. Based on this, the DEGs were clustered into modules. Some genes were identified as key players in bridging HBV inflammation to HCC, including CDC20, CCNB1, and KIF. These genes have well established roles in HCC development. For example, CDC20 expression is elevated in HCC tissues compared to paracancerous tissue, and we and others showed that its expression is altered in HBV-positive HCC.29–31 Expression of both CCNB1 and KIF2 is associated with HCC stage.32,33 These genes and their encoded proteins are linked to poor prognosis and may be meaningful biomarkers for HCC diagnosis. In addition, molecular docking identified several potential binding partners of CCNB1: YBX1, NFKB1, E2F4, 2EBT, KLF5, and RELA.
We narrowed down the list of bridge factors by examining protein crosstalk, ie proteins shared or interacting across molecular pathways. We identified four pathways involving significant crosstalk: cancer-related signaling, inflammation-related signaling, immune-related signaling, and microenvironment-related signaling. N-acetyltransferase10 (NAT10), ubiquitin-binding enzyme E2T (UBE2T) and Bcl2-like protein 12 (Bcl2L12) were included in these pathways, and these genes have been implicated in HCC.34,35 The protein p53 was also identified, reflecting its well-established multi-faceted roles in cancer development.34 RNA transport plays a key role in the process of HBV-induced HCC and leads to further deterioration in HCC disease.36 Kinesin superfamily proteins (KIFs) largely serve as molecular motors on the microtubule system and transport various cellular proteins, potentially linking HBV infection to HCC.37 Identifying key genes and proteins responsible for bridging HBV to HCC development indicates how these diseases are related, which may improve our understanding of the pathogenesis of HBV-related HCC.38
Beyond understanding HBV-associated HCC pathogenesis, our analyses may also help identify prognostic markers to improve therapy and survival. We found 65 genes that were dysregulated among patients with HBV, HCC or HBV-related HCC, among which 32 were dysregulated during HBV-induced HCC onset. Five of these genes with large areas under the ROC curve have significant effects on the prognosis of HCC: CPEB3, RAB26, SLCO1B1, ST3GAL6, and XK. We hypothesize that these genes play an important role in the development of HBV-induced HCC. We found that CPEB3 can be targeted by miR-107, and the CPEB3-EGFR axis can be targeted by miR-452-3p. Both interactions promote HCC tumor growth,38,39 suggesting that CPEB3 is a novel tumor regulatory factor. RAB26 mediates targeted autophagy to play an important regulatory role in the tumor microenvironment.40 SLCO1B1 affects drug absorption, distribution, metabolism, and excretion in patients with HCC.41 ST3GAL6 appears to influence HCC cell growth, migration, and invasion.42 Finally, the Xkr 8 protein mediates the display of phosphatidylserine on the cell surface in response to apoptotic stimuli, which represents an “eat me” signal for phagocytes, giving Xkr 8 a significant regulatory role in the development of HCC.43 In summary, these genes affect prognosis of patients with HBV-related HCC via interactions with other genes.
Transcriptional and post-transcriptional regulation has been recognized as key factors in the development and progression of many cancers. To elucidate the transcriptional regulatory factors associated with the molecular links between the two diseases, we performed a pivotal regulator analysis. We found that the following regulators had significant regulatory effects on bridge factors in liver tissue of HCC patients: lncRNAs MALAT1, TUG1, and CRNDE; miRNAs miR-590-3p, miR-340-5p, miR-139-5p, and miR-93-5p; and transcription factors E2F4, NFKB1, and RELA. In addition, molecular docking identified YBX1, NFKB1, E2F4, 2EBT, KLF5, and RELA as potential binding partners of CCNB1, further supporting the pivot analysis. Interestingly, previous work has described a potential role for all these mediators in HBV-associated HCC development.44–46 For example, lncRNA-MALAT1 targets CCNB1 to block cancer stem cell development induced by the hepatitis B virus protein HBx through the PI3K/Akt signaling pathway.47,48 Hepatitis B virus promotes cancer cell migration by down-regulating miR-340-5p and up-regulating STAT3.49 Polymorphism in the NFKB gene and its promoter is significantly associated with the occurrence of liver cancer in patients chronically infected with HBV of genotype C.50,51 We propose that these factors are key regulators of the development of HBV-associated HCC. In-depth study of how these pivotal regulators modulate the expression of bridge genes will help us fully understand the pathogenesis of the disease.
There are some limitations in this study. Firstly, the data set used in this study is not very large and based on the same platform. In order to increase the robustness of the conclusions, we hope to verify the results of this study in a different batch and a larger data set in the future. Secondly, existing studies have shown that Hbx protein is related to the progress of HBV or HCC, but we have not studied it in this study. We hope to make up for this shortcoming in the next study. Thirdly, the results of this study are based on biological informatics analysis. Due to our lack of funding, we are currently unable to carry out further research. But this research provides a preliminary basis for us to carry out molecular experiments in the future. We also hope that molecular experiments can further confirm the results of this study in the future. Fourthly, the data that we collected did not report indicators about infection, so we considered viral infection to be absent. We hope that we can conduct the study based on a dataset including HCC patients without HBV or HCV infection.
Conclusions
We identified candidate bridge genes and proteins as well as their candidate regulators that may explain the progression from chronic HBV infection to HCC. These results provide testable hypotheses to guide research into HBV-associated HCC as well as efforts to identify diagnostic and prognostic markers.
Author Contributions
Zhihu Huang conceived and designed this study. Biyang Lan and Liping Ma provided study materials and patients. Hongzhi Yang, Xiaoxia Lao and Qiaomei Deng collected data. Wenwei Nong and Ning Liu analyzed and interpreted data. All authors contributed to data analysis, drafting or revising the article, have agreed on the journal to which the article will be submitted, gave final approval of the version to be published, and agree to be accountable for all aspects of the work.
Funding
This research was supported by the Guangxi Natural Science Foundation (No. 2018GXNSFAA050114).
Disclosure
The authors report no conflicts of interest for this work.
References
1. Wei Y, Ye W, Zhao W. Serum iron levels decreased in patients with HBV-related hepatocellular carcinoma, as a risk factor for the prognosis of HBV-related HCC. Front Physiol. 2018;9:66. doi:10.3389/fphys.2018.00066
2. Quoc NB, Phuong N, Ngan TK, Linh N, Cuong PH, Chau N. Expression of plasma hsa-miR122 in HBV-related hepatocellular carcinoma (HCC) in Vietnamese Patients. Microrna. 2018;7(2):92–99. doi:10.2174/2211536607666180427165114
3. Zhang G, Zhang G. Upregulation of FoxP4 in HCC promotes migration and invasion through regulation of EMT. Oncol Lett. 2019;17(4):3944–3951. doi:10.3892/ol.2019.10049
4. Zhang X, Kang C, Li N, et al. Identification of special key genes for alcohol-related hepatocellular carcinoma through bioinformatic analysis. PeerJ. 2019;7:e6375. doi:10.7717/peerj.6375
5. Lemoine M, Thursz MR. Battlefield against hepatitis B infection and HCC in Africa. J Hepatol. 2017;66(3):645–654. doi:10.1016/j.jhep.2016.10.013
6. Kulik L, El-Serag HB. Epidemiology and management of hepatocellular carcinoma. Gastroenterology. 2019;156(2):477–491.e1. doi:10.1053/j.gastro.2018.08.065
7. Rana MA, Ijaz B, Daud M, Tariq S, Nadeem T, Husnain T. Interplay of Wnt β-catenin pathway and miRNAs in HBV pathogenesis leading to HCC. Clin Res Hepatol Gastroenterol. 2019;43(4):373–386. doi:10.1016/j.clinre.2018.09.012
8. Christel P, Meunier A, Heller M, Torre JP, Peille CN. Mechanical properties and short-term in-vivo evaluation of yttrium-oxide-partially-stabilized zirconia. J Biomed Mater Res. 1989;23(1):45–61. doi:10.1002/jbm.820230105
9. Wang M, Xi D, Ning Q. Virus-induced hepatocellular carcinoma with special emphasis on HBV. Hepatol Int. 2017;11(2):171–180. doi:10.1007/s12072-016-9779-5
10. Busca A, Kumar A. Innate immune responses in hepatitis B virus (HBV) infection. Virol J. 2014;11(1):22. doi:10.1186/1743-422X-11-22
11. Wang L, Fan YX, Ding Y, et al. [The comparison of liver inflammation and fibrosis between chronic HBV and HCV infection]. Zhonghua Gan Zang Bing Za Zhi. 2017;25(6):419–423. Chinese. doi:10.3760/cma.j.issn.1007-3418.2017.06.006
12. Qin X, Li C, Guo T, et al. Upregulation of DARS2 by HBV promotes hepatocarcinogenesis through the miR-30e-5p/MAPK/NFAT5 pathway. J Exp Clin Cancer Res. 2017;36(1):148. doi:10.1186/s13046-017-0618-x
13. Reinehr R, Graf D, Fischer R, Schliess F, Häussinger D. Hyperosmolarity triggers CD95 membrane trafficking and sensitizes rat hepatocytes toward CD95L-induced apoptosis. Hepatology. 2002;36(3):602–614. doi:10.1053/jhep.2002.35447
14. Wang SM, Ooi LL, Hui KM. Identification and validation of a novel gene signature associated with the recurrence of human hepatocellular carcinoma. Clin Cancer Res. 2007;13(21):6275–6283. doi:10.1158/1078-0432.CCR-06-2236
15. David CC, Jacobs DJ. Principal component analysis: a method for determining the essential dynamics of proteins. Methods Mol Biol. 2014;1084:193–226. doi:10.1007/978-1-62703-658-0_11
16. Ritchie ME, Phipson B, Wu D, et al. limma powers differential expression analyses for RNA-sequencing and microarray studies. Nucleic Acids Res. 2015;43(7):e47. doi:10.1093/nar/gkv007
17. Love MI, Huber W, Anders S. Moderated estimation of fold change and dispersion for RNA-seq data with DESeq2. Genome Biol. 2014;15(12):550. doi:10.1186/s13059-014-0550-8
18. Subramanian A, Tamayo P, Mootha VK, et al. Gene set enrichment analysis: a knowledge-based approach for interpreting genome-wide expression profiles. Proc Natl Acad Sci U S A. 2005;102(43):15545–15550. doi:10.1073/pnas.0506580102
19. Szklarczyk D, Morris JH, Cook H, et al. The STRING database in 2017: quality-controlled protein-protein association networks, made broadly accessible. Nucleic Acids Res. 2017;45(D1):D362–362D368. doi:10.1093/nar/gkw937
20. Kellman P, Chung YC, Simonetti OP, McVeigh ER, Arai AE. Multi-contrast delayed enhancement provides improved contrast between myocardial infarction and blood pool. J Magn Reson Imaging. 2005;22(5):605–613. doi:10.1002/jmri.20426
21. Doncheva NT, Morris JH, Gorodkin J, Jensen LJ. Cytoscape StringApp: network analysis and visualization of proteomics data. J Proteome Res. 2019;18(2):623–632. doi:10.1021/acs.jproteome.8b00702
22. Maraziotis IA, Dimitrakopoulou K, Bezerianos A. An in silico method for detecting overlapping functional modules from composite biological networks. BMC Syst Biol. 2008;2(1):93. doi:10.1186/1752-0509-2-93
23. Yu G, Wang LG, Han Y, He QY. clusterProfiler: an R package for comparing biological themes among gene clusters. OMICS. 2012;16(5):284–287. doi:10.1089/omi.2011.0118
24. Robin X, Turck N, Hainard A, et al. pROC: an open-source package for R and S+ to analyze and compare ROC curves. BMC Bioinform. 2011;12(1):77. doi:10.1186/1471-2105-12-77
25. Burley SK, Berman HM, Kleywegt GJ, Markley JL, Nakamura H, Velankar S. Protein Data Bank (PDB): the single global macromolecular structure archive. Methods Mol Biol. 2017;1607:627–641. doi:10.1007/978-1-4939-7000-1_26
26. Macindoe G, Mavridis L, Venkatraman V, Devignes MD, Ritchie DW. HexServer: an FFT-based protein docking server powered by graphics processors. Nucleic Acids Res. 2010;38(Web Server):W445–W449. doi:10.1093/nar/gkq311
27. Mooers B. Shortcuts for faster image creation in PyMOL. Protein Sci. 2020;29(1):268–276. doi:10.1002/pro.3781
28. Pazgan-Simon M, Simon KA, Jarowicz E, Rotter K, Szymanek-Pasternak A, Zuwała-Jagiełło J. Hepatitis B virus treatment in hepatocellular carcinoma patients prolongs survival and reduces the risk of cancer recurrence. Clin Exp Hepatol. 2018;4(3):210–216. doi:10.5114/ceh.2018.78127
29. Zhuang L, Yang Z, Meng Z. Upregulation of BUB1B, CCNB1, CDC7, CDC20, and MCM3 in tumor tissues predicted worse overall survival and disease-free survival in hepatocellular carcinoma patients. Biomed Res Int. 2018;2018:7897346. doi:10.1155/2018/7897346
30. Yan H, Li Z, Shen Q, et al. Aberrant expression of cell cycle and material metabolism related genes contributes to hepatocellular carcinoma occurrence. Pathol Res Pract. 2017;213(4):316–321. doi:10.1016/j.prp.2017.01.019
31. Chen Z, Chen J, Huang X, et al. Identification of potential key genes for hepatitis B virus-associated hepatocellular carcinoma by bioinformatics analysis. J Comput Biol. 2019;26(5):485–494. doi:10.1089/cmb.2018.0244
32. Lerchner H, Ehgartner EM, Faschinger C, Hesse W. [Re-keratoplasty in a case of Sjögren syndrome]. Fortschr Ophthalmol. 1988;85(6):679–681. German.
33. Chai N, Xie HH, Yin JP, et al. FOXM1 promotes proliferation in human hepatocellular carcinoma cells by transcriptional activation of CCNB1. Biochem Biophys Res Commun. 2018;500(4):924–929. doi:10.1016/j.bbrc.2018.04.201
34. Li Q, Liu X, Jin K, et al. NAT10 is upregulated in hepatocellular carcinoma and enhances mutant p53 activity. BMC Cancer. 2017;17(1):605. doi:10.1186/s12885-017-3570-4
35. Liu LP, Yang M, Peng QZ, et al. UBE2T promotes hepatocellular carcinoma cell growth via ubiquitination of p53. Biochem Biophys Res Commun. 2017;493(1):20–27. doi:10.1016/j.bbrc.2017.09.091
36. McQuade RD, Ford D, Duffy RA, Chipkin RE, Iorio LC, Barnett A. Serotonergic component of SCH 23390: in vitro and in vivo binding analyses. Life Sci. 1988;43(23):1861–1869. doi:10.1016/s0024-3205(88)80003-1
37. Hirokawa N, Tanaka Y. Kinesin superfamily proteins (KIFs): various functions and their relevance for important phenomena in life and diseases. Exp Cell Res. 2015;334(1):16–25. doi:10.1016/j.yexcr.2015.02.016
38. Tang H, Zhang J, Yu Z, et al. Mir-452-3p: a potential tumor promoter that targets the CPEB3/EGFR axis in human hepatocellular carcinoma. Technol Cancer Res Treat. 2017;16(6):1136–1149. doi:10.1177/1533034617735931
39. Zou CD, Zhao WM, Wang XN, et al. MicroRNA-107: a novel promoter of tumor progression that targets the CPEB3/EGFR axis in human hepatocellular carcinoma. Oncotarget. 2016;7(1):266–278. doi:10.18632/oncotarget.5689
40. Dong W, He B, Qian H, et al. RAB26-dependent autophagy protects adherens junctional integrity in acute lung injury. Autophagy. 2018;14(10):1677–1692. doi:10.1080/15548627.2018.1476811
41. Hu DG, Marri S, McKinnon RA, Mackenzie PI, Meech R. Deregulation of the genes that are involved in drug absorption, distribution, metabolism, and excretion in hepatocellular carcinoma. J Pharmacol Exp Ther. 2019;368(3):363–381. doi:10.1124/jpet.118.255018
42. Sun M, Zhao X, Liang L, Pan X, Lv H, Zhao Y. Sialyltransferase ST3GAL6 mediates the effect of microRNA-26a on cell growth, migration, and invasion in hepatocellular carcinoma through the protein kinase B/mammalian target of rapamycin pathway. Cancer Sci. 2017;108(2):267–276. doi:10.1111/cas.13128
43. Suzuki J, Denning DP, Imanishi E, Horvitz HR, Nagata S. Xk-related protein 8 and CED-8 promote phosphatidylserine exposure in apoptotic cells. Science. 2013;341(6144):403–406. doi:10.1126/science.1236758
44. Calais G, Chauvet B, Garand G, Beutter P, Reynaud-Bougnoux A, Le Floch O. [Cancer of the tonsillar region. Role of irradiation in treatment]. Ann Radiol (Paris). 1989;32(7–8):555–559. French.
45. Chen Z, Yu C, Zhan L, Pan Y, Chen L, Sun C. LncRNA CRNDE promotes hepatic carcinoma cell proliferation, migration and invasion by suppressing miR-384. Am J Cancer Res. 2016;6(10):2299–2309.
46. Zhang F, Wang Q, Ye L, Feng Y, Zhang X. Hepatitis B virus X protein upregulates expression of calpain small subunit 1 via nuclear factor-kappaB/p65 in hepatoma cells. J Med Virol. 2010;82(6):920–928. doi:10.1002/jmv.21753
47. He B, Peng F, Li W, Jiang Y. Interaction of lncRNA-MALAT1 and miR-124 regulates HBx-induced cancer stem cell properties in HepG2 through PI3K/Akt signaling. J Cell Biochem. 2019;120(3):2908–2918. doi:10.1002/jcb.26823
48. Liu D, Zhu Y, Pang J, Weng X, Feng X, Guo Y. Knockdown of long non-coding RNA MALAT1 inhibits growth and motility of human hepatoma cells via modulation of miR-195. J Cell Biochem. 2018;119(2):1368–1380. doi:10.1002/jcb.26297
49. Xiong Q, Wu S, Wang J, et al. Hepatitis B virus promotes cancer cell migration by downregulating miR-340-5p expression to induce STAT3 overexpression. Cell Biosci. 2017;7:16. doi:10.1186/s13578-017-0144-8
50. He Y, Zhang H, Yin J, et al. IkappaBalpha gene promoter polymorphisms are associated with hepatocarcinogenesis in patients infected with hepatitis B virus genotype C. Carcinogenesis. 2009;30(11):1916–1922. doi:10.1093/carcin/bgp226
51. Zhang Q, Ji XW, Hou XM, et al. Effect of functional nuclear factor-kappaB genetic polymorphisms on hepatitis B virus persistence and their interactions with viral mutations on the risk of hepatocellular carcinoma. Ann Oncol. 2014;25(12):2413–2419. doi:10.1093/annonc/mdu451
 © 2021 The Author(s). This work is published and licensed by Dove Medical Press Limited. The
full terms of this license are available at https://www.dovepress.com/terms
and incorporate the Creative Commons Attribution
- Non Commercial (unported, 3.0) License.
By accessing the work you hereby accept the Terms. Non-commercial uses of the work are permitted
without any further permission from Dove Medical Press Limited, provided the work is properly
attributed. For permission for commercial use of this work, please see paragraphs 4.2 and 5 of our Terms.
© 2021 The Author(s). This work is published and licensed by Dove Medical Press Limited. The
full terms of this license are available at https://www.dovepress.com/terms
and incorporate the Creative Commons Attribution
- Non Commercial (unported, 3.0) License.
By accessing the work you hereby accept the Terms. Non-commercial uses of the work are permitted
without any further permission from Dove Medical Press Limited, provided the work is properly
attributed. For permission for commercial use of this work, please see paragraphs 4.2 and 5 of our Terms.