Back to Journals » Drug Design, Development and Therapy » Volume 17
Comprehensive Analysis to Identify Rh Family C Glycoprotein (RHCG) as the Causative Gene for Psoriasis and Search for Alternative Treatment Modalities
Authors Zhang Q, Liu J ![]() , Yao D, Shi JX, Liu YJ
, Yao D, Shi JX, Liu YJ ![]() , Wei YG, Guo S
, Wei YG, Guo S
Received 30 May 2023
Accepted for publication 17 August 2023
Published 28 August 2023 Volume 2023:17 Pages 2593—2611
DOI https://doi.org/10.2147/DDDT.S421300
Checked for plagiarism Yes
Review by Single anonymous peer review
Peer reviewer comments 2
Editor who approved publication: Professor Jianbo Sun
Qian Zhang,1,2,* Jia Liu,1,* Dan Yao,1,2 Jian-Xin Shi,1 Yuan-Jie Liu,2– 4 Yue-Gang Wei,1 Shun Guo1,2
1Department of Dermatology, Affiliated Hospital of Nanjing University of Chinese Medicine, Jiangsu Province Hospital of Chinese Medicine, Nanjing, Jiangsu, 210029, People’s Republic of China; 2No. 1 Clinical Medical College, Nanjing University of Chinese Medicine, Nanjing, Jiangsu, 210023, People’s Republic of China; 3Department of Oncology, Affiliated Hospital of Nanjing University of Chinese Medicine, Jiangsu Province Hospital of Chinese Medicine, Nanjing, Jiangsu, 210029, People’s Republic of China; 4Key Laboratory of Tumor System Biology of Traditional Chinese Medicine, Nanjing, Jiangsu, 210029, People’s Republic of China
*These authors contributed equally to this work
Correspondence: Shun Guo, Email [email protected]
Background: Psoriasis is a complex autoimmune disease. Frequent interactions between epidermal and immune cells are likely to be responsible for the strong heterogeneity of psoriasis. Therefore, our work aims to build on current knowledge and further search for new molecular mechanisms related to psoriasis pathogenesis in order to develop new targeted drugs.
Methods: Data from psoriasis samples were obtained from the Gene Expression Omnibus (GEO) database, and batch effects were corrected using the “Combat” algorithm in the “SVA” package. Functional annotation of differential genes in psoriasis was performed by Gene set enrichment analysis (GSEA). Core functional modules were identified using the Multiscale Embedded Gene Co-Expression Network Analysis (MEGENA) algorithm for selection from the differential gene interaction network. The expression and potential function of Rh Family C Glycoprotein (RHCG) was predicted in single cell data by the “Seurat” package and validated in psoriasis samples by multiplex immunofluorescence. In addition, the regulatory function of HOP Homeobox (HOPX) on RHCG in keratinocytes was confirmed using RNA interference. Using immune infiltration analysis, RHCG and DC cells were analyzed for their association. Finally, the molecular mechanisms of treatment of psoriasis using Tripterygii Radix (TR) and Cinnamomi Ramulus (CR) were explored through network pharmacology and experimental validation.
Results: Immune response (represented by C1_2) and collagen matrix formation (represented by C1_3) were identified as two important pathogenic factors in psoriasis and helped to define new biological subtypes of psoriasis. One important psoriasis hub gene, RHCG, was obtained and found to be closely associated with keratinocyte differentiation as well as DC cell maturation. And RHCG was regulated by HOPX in keratinocytes. In addition, the mechanism of action of CR and TR in the treatment of psoriasis was tentatively confirmed to be related to TRPV3, NFKB2, and YAP1.
Conclusions: Our study identifies a new causal disease gene (RHCG) and offers potential alternatives for the treatment of psoriasis.
Keywords: psoriasis, Rh family C glycoprotein, RHCG, DC cells, keratinocyte, traditional Chinese medicine
Introduction
Psoriasis, a chronic recurrent skin disease triggered by environmental factors, has an incidence of about two percent.1 The underlying pathogenesis of psoriasis stems from a complex interplay among immune cells, skin cells and many cytokines.2 The prevailing view is that abnormal expression of cytokines, including tumor necrosis factor (TNF) and interleukins (IL), leads to over-proliferation of keratinocytes and dysfunction of the immune system, which ultimately induces the visible skin phenotype.3
In recent years, various biologics targeting cytokines have gradually become the mainstay of treatment for moderate to severe psoriasis because of their ability to significantly alleviate clinical symptoms and improve patients’ quality of life.4,5
These include etanercept, adalimumab, certolizumab, and infliximab, which inhibit the action of tumor necrosis factor-1 (TNF-1). There are a number of other biologics inhibit cytokines, including those that inhibit the p40 subunits of IL-12 and IL-13 (ustekinumab), the p19 subunit of IL-23 (guselkumab, tildrakizumab, risankizumab, and mirikizumab), and IL-17 (secukinumab, ixekizumab, bimekizumab, and brodalumab). However, not all patients benefit from biologic therapies, and most have to endure frequent adverse events and relapses.6 The autoimmune cascade of psoriasis poses a great challenge to the treatment of psoriasis due to the wide range of biological effects involved.7 Therefore, there is an urgent need to find potential biomarkers to further decode the heterogeneity of psoriasis in order to select appropriate drugs for the individualized treatment of psoriasis.
In this study, we combined multiple datasets to identify the underlying biological mechanisms of psoriasis. RHCG, a gene not previously studied in the context of psoriasis, was identified as being associated with the disease and was found to correlate with keratinocyte differentiation status. In addition, we found a significant correlation between RHCG and the high abundance of activated dendritic (DC) cells. Activated DC cells are centrally located in the initiation of psoriasis.8 There is substantial evidence of aberrant immune cell infiltration in psoriasis, including DC cells, monocytes/macrophages and T cells, which produce abundant inflammatory mediators and drive abnormal proliferation and impaired differentiation of keratinocytes.9 Notably, RHCG are involved in the maturation of DC cells. In addition, the molecular mechanisms of Tripterygii Radix (TR) and Cinnamomi Ramulus (CR) in the treatment of psoriasis were initially explored using network pharmacology combined with experimental validation.
Materials and Methods
Identification of Differentially Expressed Genes (DEGs) in Psoriasis and Their Biological Functions
Published microarray data for patients with psoriasis, including GSE13355,10 GSE30999,11 and GSE14905,12 were obtained from the Gene Expression Omnibus (GEO) portal. The GSE13355, GSE30999, and GSE14905 samples were generated using the Affymetrix Human Genome U113 Plus 2.0 Array and included 176 skin samples with psoriasis, and 256 with normal skin. The “Combat” algorithm in the R package “SVA” (version 3.29.1) removed the batch effect among different GSE datasets. As part of the combined analysis, the “limma” package in R studio software (4.1.2) was used in order to investigate DEGs between lesioned skin and normal skin tissue,13 and the threshold is set at |logFC| >= 1 and an adjusted P value < 0.05. In order to predict the molecular mechanisms involved in psoriasis, the “simplifyEnrichment” package14 was used to perform semantic similarity calculations on enriched terms obtained based on the “clusterProfiler” package.15
Establishment of Co-Expression Networks Based on DEGs Matrix
The MEGENA package was used to build co-expression networks to identify complex associations among DEGs.16 After the fast planar filter network (PFN) was constructed, the significant gene pairs in it were calculated and the processed PFN was imported into the multiscale clustering analysis (MCA) to obtain significant gene modules.
Identification of Hub Genes of Co-Expression Networks and Biological Subtypes of Psoriasis
To identify central genes in significant gene modules, Protein-protein interaction (PPI) networks were drawn for C1_2 and C1_3 in MEGENA using Cytoscape software. Based on the ranking of degree values, the ten genes with the highest degree values were selected for further analysis using the cytoHubba plugin.17 By using the “ConsensusClusterPlus” package,18 which can quantitatively evaluate the number of possible clusters within a dataset, these 20 genes were further used to determine the biological subtypes of psoriasis. The k-values for clustering ranged from 2 to 6. The optimal values were determined by the Delta area under the consistency cumulative distribution function (CDF) curve and the consistency matrix, and the validity of the clustering was confirmed using principal component analysis (PCA). Heatmap was generated using the “pheatmap” function in the “pheatmap” package19 to show the expression differences of the 20 hub genes between different clusters.
Single Cell Analysis
Single-cell sequencing data of skin biopsies from psoriasis patients and healthy volunteers were downloaded from GSE151177 (GSM4567877, GSM4567878, GSM4567879, GSM4567880, GSM4567881, GSM4567882, GSM4567883, GSM4567884, GSM4567885, GSM4567886, GSM4567887, GSM4567888).20 Data from different samples were combined using “harmony” function in Seurat. All cells were subjected to strict quality control, specifically, cells with gene expression counts between 200 and 10,000 and mitochondrial percentages below 5 were selected for the next analysis. “FindVariableFeatures”, “ScaleData”, “RunPCA”, “FindNeighbors”, and “SCTransform” in Seurat V4 were used to perform standard single-cell data processing.20 The first 15 principal components were selected and the resolution was set to 0.5.
Cell type annotation information is generated by “SingleR” package based on reference data, and identification is assisted by marker genes.21 Cell trajectory analysis was performed using the R package “Monocle 3”,22 and cell stemness was assessed by CytoTRACE to determine the point of differentiation initiation.23 In addition, “CellChat” package was used to infer and visualize cell-to-cell interaction networks.24
Immune Analysis
The combined dataset was used to assess the abundance of immune cell infiltration in psoriasis using the Cibersort algorithm.25 Pearson method was used to calculate the relationship between immune cell abundance and gene expression.
Cell Culture
EpiLife medium was used for the culture of human foreskin keratinocytes (HEKn), obtained from ThermoFisher Scientific. Dulbecco’s modified Eagle’s medium (DMEM) with GlutaMax™ was used to culture HaCaT cells obtained from the Cell Center of the Chinese Academy of Sciences. At 37 °C with 5% CO2, all mediums were supplemented with 10% fetal bovine serum (FBS) and 100 U/ml penicillin and 100 g/ml streptomycin.
RNAi Plasmids Construction and Transfection
All lentiviral vectors were synthesized by GeneChem (Shanghai, China), which was used for both the overexpression and knockdown of HOPX. The viruses were developed, synthesized, and distributed by GeneChem Corporation. Incorporating the cells was done in accordance with the provider’s instructions. A recombinant lentiviral transduction via polybrene at a concentration of 2 mg/ml was performed on HEKn and HaCa cells, and cells that had been stably incorporated were identified by puromycin at a concentration of 1.5 mg/mL. Finally, western blot analysis was conducted to assess the incorporation efficiency of HOPX overexpression and knockdown.
Western Blotting
Protein concentrations were determined by Bradford assay following cell lysis in RIPA buffer. An SDS-PAGE separation of 10% or 8% was performed on samples weighing 20 µg each. Transferring proteins to PVDF membranes and blocking them with bovine serum albumin (5%) were carried out. A primary antibody probe was used to probe the blots overnight at 4C. Following three washes with 0.05% Tween 20 Tris-buffered saline, We measured the densities of the blots by using an electrochemiluminescence detection kit (ECL) and secondary antibodies. The β-actin protein was used as a reference.
Hematoxylin and Eosin (HE) Staining
We employed a kit and associated directions for HE staining. In short, following generation of 4-μm-thick tissue section, paraffin-embedding, fixation in 4% paraformaldehyde, a 1-min treatment with 5% acetic acid, 1-min de-waxing, ethanol hydration using a series of concentrations, 5-min hematoxylin staining at RT, 1-min eosin staining, routine dehydration, clearance, and sealing, pathological alterations within liver sections were assessed under an Olympus IX81 microscope (Japan).
Immunohistochemical (IHC) and Immunofluorescence (IF) Staining
In previous investigations, IHC and IF staining protocols had been developed,26,27 and Supplementary Table 1 presents the antibodies used. It was either based on prior studies or provider recommendations that antibody final concentrations were determined. Slides were incubated with primary antibodies after tissue sections were blocked with protein blocking solution. Two independent researchers scored IHC (intensity and extent of staining). We used a NIKON Eclipse Ni-E microscope (NIKON, Japan) to capture images, and the stains were graded as follows: : 0, negative; 1, weak; 2, moderate; and 3, strong. Based on the percentage of positive cells and negative cells in each sample, staining extent was graded as described previously.28 In order to calculate the IHC score (H-SCORE), the amount of stained cells and the intensity of the staining were combined.29 H-SCORE is a scale from 0 to 300, with a higher score indicating enhanced positivity.30
A 5% bovine serum albumin solution in phosphate-buffered saline (PBS) or a 0.1% Tween solution was used to block the tissue sections, prior to a primary antibody treatment overnight at 4 °C. After that, secondary antibodies were applied for one hour at 25 °C. We then stained the nuclei with 4’,6-diamidino-2-phenylindole (DAPI) for 3 minutes without light. Following this, four separate 5-min PBS rinses were performed, followed by a solution containing an IF quencher to seal. Finally, image capture and observation of IF staining were performed using an inverted IF microscopy from Olympus (Japan).
Network Pharmacology
All active ingredients of CR and TR were retrieved from the Traditional Chinese Medicine Systematic Pharmacology Database and Analysis Platform (TCMSP).31 To better screen the active compounds in the pairs, the candidate active ingredients of CR and TR were obtained with drug similarity (DL) ≥ 0.07 and oral bioavailability (OB) ≥ 30%. The Swiss Target Prediction tool was used for reliable target prediction by the structural information of the active ingredient in CR and TR obtained from PubChem,32,33 and the species is restricted to “Homo sapiens” and the probability is set as no less than 0.1. Targets relevant to psoriasis were obtained from DEGs. In addition, Gene ontology (GO) and Kyoto encyclopedia of genes and genomes (KEGG) functional enrichment analysis was performed using the clusterProfiler package of the R platform, and the screening criteria were set at p <= 0.05.15
Psoriasis Modeling and Drug Use
Imiquimod (IMQ) cream (including 5% IMQ) was purchased from 3M Health Care Co., Ltd. Mometasone Furoate cream was purchased from Bayer Pharmaceuticals Co., Ltd. TR and CR were purchased from Jiangsu Provincial Hospital of Chinese Medicine, affiliated Nanjing University of Traditional Chinese Medicine. All experiments were performed according to ARRIVE2.0 guidelines.34 The in-vivo experiments were authorized by the Animal Ethics Committee of Jiangsu Province Hospital of Chinese Medicine (Application No. 2019NL-119-02). Male BALB/c mice aged 6 to 8 weeks are from Beijing Institute of Biomedicine (Beijing, China; Certificate No. SYXK2019-0010). Mice were reproduced in the Experimental Animal Center of the Affiliated Hospital of Nanjing University of Chinese Medicine. All mice were placed in pathogen-free conditions and rested for one week.
Divide 36 mice into 9 groups. Sample-size estimation was performed based on degrees of freedom (E) before the animal experiments (E = total number of animals - number of groups). They are the model group, CR high-dose group, CR medium dose group, CR low dose group, TR high-dose group, TR medium dose group, TR low dose group, blank control group, and Momiasone Furoate Cream group (MFC). Expose the back of 36 mice to about 2*3cm area. The control group received appropriate Vaseline, while the other groups were externally coated with 62.5mg of imiquimod to establish an IMQ-induced psoriasis model. Crush the raw materials of TR and CR into small pieces. Add an appropriate amount of purified water and boil. Filter the soup and collect the filtrate. Boil and filter the solution again, mix the filtrate obtained after two filters, and concentrate it into different concentrations for external use. The model group (IMQ) was given physiological saline, the Momiasone Furoate Cream group (MFC) was given 200mg of Momiasone Furoate ointment for external use, the high-dose group of CR was given 2.34g/kg/day of CR, the medium dose group was given 1.17g/kg/day, and the low-dose group was given 0.585g/kg/day. The high-dose, medium dose, and low-dose groups of TR were administered 2.34g/kg/day, 1.17g/kg/day, and 0.585g/kg/day of TR, respectively. The Psoriasis Lesion Area and Severity Index (PASI) score was used daily to assess the degree of erythema, scale, and infiltration on the back skin of each group of mice. From the date of IMQ application (0.4ml/day), all treatments will be administered once a day for a week. After 7 days, mice were euthanized through cervical dislocation under pentobarbital sodium anesthesia, while skin and serum samples were collected.
Statistical Analysis
The Spearman correlation coefficients were used to determine potential links between variables. The t-test and the Mann-Whitney U-test (also known as the Wilcoxon rank sum test) were used to assess data with normal and non-normal distributions, respectively. We conducted Kruskal-Wallis and one-way ANOVA analyses for intra- and multi-group comparisons. As the significance standard, a two-tailed P value of 0.05 was used for all data analysis using R (http://www.r-project.org/).
Results
Identification of the Pathogenesis of Psoriasis
In order to fully understand the underlying biological mechanisms in the development of psoriasis, a total of 432 skin samples (including 256 normal skin and 176 psoriatic lesion samples) were collected and corrected for batch effects using the “combat” algorithm in the “SVA” toolkit. Figure 1A and B show the baseline levels of gene expression for each cohort before and after the batch effect correction, respectively. The results show that the post-processed data are suitable for subsequent analysis (Figure 1B). To characterize the molecular mechanisms associated with psoriasis, we obtained DEGs between lesioned psoriasis samples and non-lesioned samples, including 627 up-regulated genes and 471 down-regulated genes (Figure 1C, in lesioned psoriasis samples). Subsequently, GSEA was performed to annotate the function of the DEGs. On the one hand, for the GO-defined set of background genes, the psoriasis highly expressed genes had principal enrichment in immune and keratin biological processes, taking the “Positive Regulation of Immune Response”, “Innate lmmune Response”, “Positive Regulation of Nf Kappab Transcription Factor Activity”, “Keratinization”, and “Keratinocyte Differentiation” for example (Figure 1D). Synchronously, the psoriasis lowly expressed genes were mainly enriched in metabolic and muscle fibers-related pathways, including “Contractile Fiber”, “Fatty Acid Metabolic Process”, “Regulation of Fat Cell Differentiation”, “Muscle Tissue Development”, and “Regulation of Glucose Metabolic Process” (Figure 1E). On the other hand, cytokines and cytoskeleton/adhesion related pathways were respectively enriched in the psoriasis high and low expression group for KEGG gene sets (Figure 1F and G).
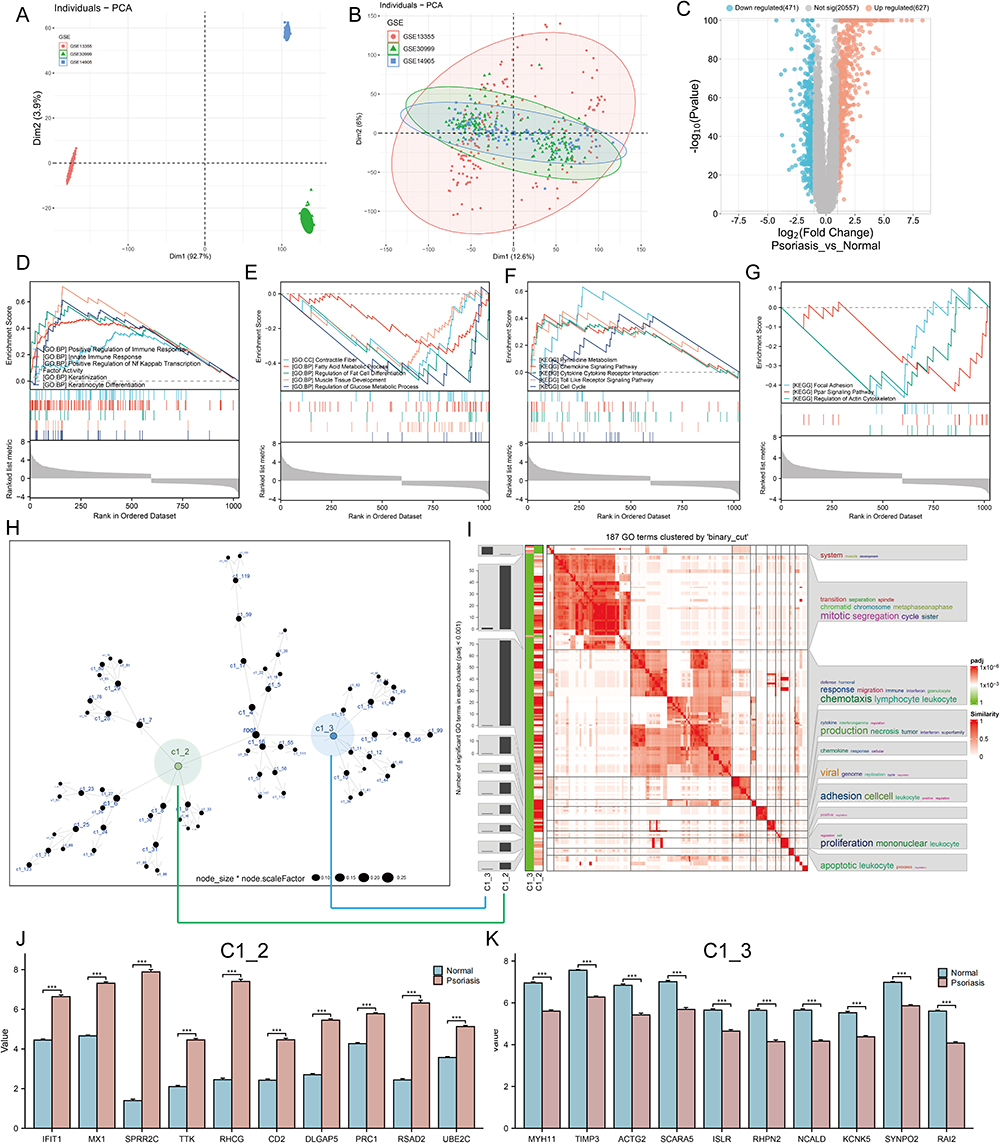 |
Figure 1 Identification of molecular mechanisms associated with psoriasis. (A and B) Principal component analysis (PCA) shows the gene expression distribution in 3 psoriasis cohort samples (GSE13355, GSE30999, and GSE14905) before (A) and after (B) batch effect correction. (C) Volcano plots showing the DEGs between lesioned psoriasis samples and non-lesioned skin samples in merged cohort. Red dots represent genes that are upregulated in lesions, blue dots indicate genes that are downregulated in lesions, and gray dots represent genes for which the differences are not statistically significant. (D–G) (D and E) Up (D) and down (E)-regulated GO pathways in lesioned psoriasis samples. Different gene sets are represented with lines of unique color. Only gene sets with adjusted p < 0.05 and FDR q < 0.1 were considered significant. Several major gene sets are shown in the plot. (F and G) Up (F) and down (G)-regulated KEGGpathways in non-lesioned skin samples, similar to (D and E). (H) Co-expression network representing DEGs in the merged dataset . Each node represents a module, and the larger the node, the more genes the module contains. The merged dataset includes GSE13355, GSE30999, and GSE14905. See also Figure S1. (I) The signaling pathways involved in C1_2 (associated with (H) by green line) and C1_3 (associated with (H) by blue line) were enriched using the “simplifyEnrichment” package. On the left, a bar chart illustrates the extent to which various GO terms have been enriched within different modules, and a heat map shows the clustering of 287 GO terms in the middle, and important GO terms are summarized in the word cloud on the right. A redder color indicates a higher similarity between GO terms and a lower P-value. (J and K) Differential expression of hub genes of C1_2 (J) and C1_3 (K) between normal and psoriasis samples in merged cohort (Kruskal-Wallis test). Asterisk represents P-value (***P < 0.001). |
Next, we constructed a MEGENA network using the DEGs identified above (Figure 1H). In total, we identified 72 co-expression modules, with the largest module C1_2 consisting of 538 genes, followed by C1_3 with 307 genes (Figure S1). Considering the unique salience of C1_2 and C1_3, we clustered the biological functions involved in both. Interestingly, C1_2 is enriched in multiple pathways including cytokines and immune responses, in contrast to C1_9 which is only enriched in muscle system development (Figure 1I). We speculated that C1_2 and C1_9 might represent two pathogenic mechanisms of psoriasis, respectively. Furthermore, CytoHubba selected ten pivotal genes with key roles in psoriasis in both gene modules: IFIT1, MX1, SPRR2C, TTK, RHCG, CD2, DLGAP5, PRC1, RSAD2, UBE2C for C1_2, and MYH11, TIMP3, ACTG2, SCARA5, ISLR, RHPN2, NCALD, KCNK5, SYNPO2, RAI2 for C1_3. Notably, hub genes in C1_2 were elevated in skin lesion, while the opposite was true for hub genes in C1_3 (P < 0.001, Figure 1J and K).
Identification of Novel Subtypes of Psoriasis
It is well known that the pathogenesis of psoriasis is complex and involves multiple regulatory mechanisms.35 In order to provide an effective strategy for the precise treatment of psoriasis, it is necessary to characterize the heterogeneity of psoriasis patients by identifying new biological subtypes. The 20 pivotal genes above were used to construct consensus clusters and identify biological subtypes of psoriasis. For the optimal clustering stability, the consistency matrix k = 2 was selected for sorting the merged cohort into two clusters, named Cluster 1 (C1) and Cluster 2 (C2) (Figure 2A–C and Figure S2). The consensus clustering was proved to be significant by principal component analysis (PCA) algorithm (Figure 2D). Interestingly, C1_2 hub genes were highly expressed in C2 compared with C1 (Figure 2E). To elucidate the underlying molecular mechanism differences, we then investigated the transcriptome variation between C1 and C2. As shown in Figure 2F, 54 genes were significantly upregulated and 51 genes were downregulated in C1 compared with C2. GSEA indicates that C1 is characterized by immune response and C2 by collagen fibers (cytoskeleton), further suggesting that the two mechanisms represented by C1_2 and C1_3 are psoriasis development-dependent (Figure 2G and H). Taken together, the results suggest that the pathogenesis of psoriasis is highly heterogeneous.
 |
Figure 2 Identification of novel biological subtypes of psoriasis based on hub genes of C1_2 and C1_3. (A and B) The cumulative distribution function curve (A) and Delta area (B) of hub genes of C1_2 and C1_3 in merged GEO cohort. (C) Heat map showing the sample clustering at K = 2 (the optimal cluster number). See also Figure S2. (D) The PCA plot for the merged dataset. C1, represented by light blue dots. C2, represented by dark blue triangles. (E) Heatmap showing the differential expression of hub genes of C1_2 (green box) and C1_3 (blue box) between C1 and C2. (F) Volcano plot of differentially expressed genes by comparing C1 and C2 in merged cohort. The red color indicates up-regulated genes in C1, blue indicates up-regulated genes in C2, and gray indicates genes without statistical significance. (G) GSEA enrichment analysis of the status of leading biological pathways in two biological phenotypes. On the left is the gene sets up-regulated in C1 (down-regulated in C2) and on the right is the gene sets down-regulated in C1 (up-regulated in C2). (H) Schematic diagram demonstrating that immune response (left) and collagen fibril organization (right) are two important molecular mechanisms in psoriasis. |
Identification of RHCG Upregulation in Keratinocytes and DC Cells
The diffusion of single-cell sequencing technology has strongly improved the understanding of psoriasis microenvironment.36,37 Our study characterized the expression pattern of hub genes using RNA sequences obtained from single cells to further understand their biological significance. t-Distributed Stochastic Neighbor Embedding (tSNE) and Uniform Manifold Approximation and Projection (UMAP) showed that 11 clusters were identified in the GSE151177 dataset (Figure 3A and B). SingleR was used to assign type annotation information to cell clusters (Figure 3C), and a heatmap displaying the cell markers of each type was generated (Figure 3D). Cell-cell interaction network indicates that there are complex interactions among different cell types (Figure 3E). The expression level of C1_2 and C1_3 hub genes at single cell level is illustrated in Figure 3F and G. We noted that RHCG and CD2 were most abundantly expressed, especially RHCG, which was upregulated in both keratinocytes and DC cells. It has been shown that CD2 is upregulated in psoriatic lesions and that blocking CD2 expression and thus antagonizing T-cell activation can result in improvement of psoriasis.38,39 However, studies on RHCG in psoriasis are lacking, only one bioinformatics analysis showed that RHCG may help to distinguish non-lesional from lesional samples.40 Therefore, we identified RHCG as the focus of next study.
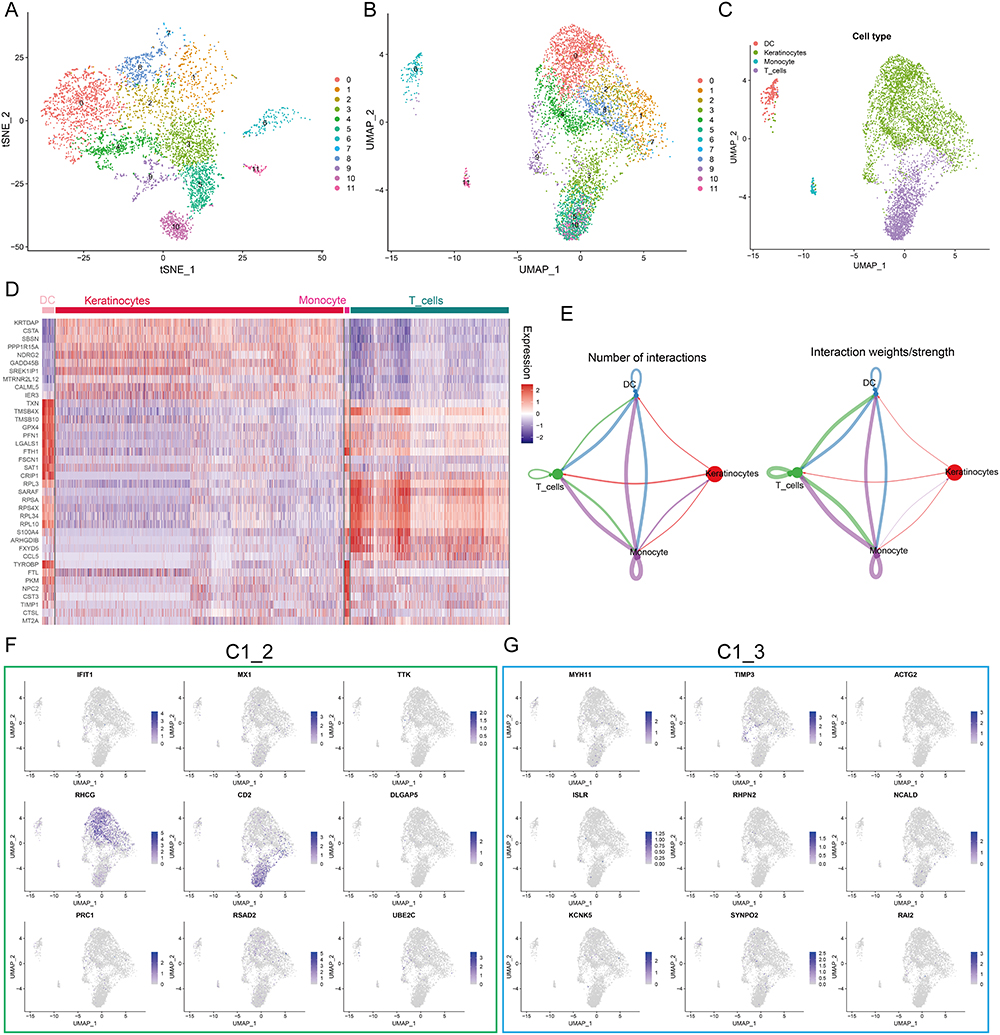 |
Figure 3 Expression profiles of hub genes at the single cell level. (A and B) t-Distributed Stochastic Neighbor Embedding (tSNE) (A) and Uniform manifold approximation and projection (UMAP) (B) dimensionality reduction analysis. 12 unique cell clusters were identified with highly variable features. (C) 4 cell types were identified by singleR and unique gene markers. (D) Heatmap showing the expression patterns of 4 cell types in skin samples. (E) Circle plot showing number and weight of potential ligand-receptor pairs between cell types predicted by Cellchat. (F and G) UMAP revealing the expression hub genes of C1_2 (F) and C1_3 (G). Higher expression is indicated with a bluer color. |
Identification of the Relationship Between RHCG and Pathogenic Keratinocytes in Psoriasis
Clustering analysis was then performed on all keratinocytes and three prominent subgroups were identified (Figure 4A). The expression profile heatmap showed that the three clusters had significantly different transcriptome profiles (Figure 4B). In addition, there was no significant differences among the proportion of non-lesional/lesional samples in the three clusters (Figure S3). The UMAP plot indicates that RHCG upregulates in cluster 0 and cluster 1 (Figure 4C). Known to all, psoriasis is characterized by an imbalance between proliferation and differentiation.41 The Psoriatic skin exhibit reduced expressions of differentiation markers (KRT1 and KRT10) and increased expressions of inflammatory cytokines.42–44 In addition, KRT16 and KRT17, which are markers of psoriasis, are identified to be upregulated in skin lesion tissues.42 Our data show that KRT1/10 is upregulated in cluster 2, while KRT16/17 is upregulated in cluster 1 (Figure S4). Considering that the most prominent feature of psoriasis is the hyperproliferation and distorted differentiation process of keratinocytes, the CytoTRACE analysis of all keratinocytes revealed that Cluster 0 had a significantly higher CytoTRACE score than the other clusters, implying that Cluster 0 was in the undifferentiated stage (Figure 4D and E). In order to further describe the molecular functions of Clusters 1 and 2, we performed GSEA. It is worth noting that Cluster 1 was enriched for DNA binding related signaling pathways, further suggesting a strong link between Cluster 1 and psoriasis (Figure S5). In addition, the metabolic patterns of the three clusters were distinct, with glucose metabolism and the TCA cycle being highly active in cluster 2, while sulfur metabolism and fatty acid biosynthesis were at higher levels in cluster 1 (Figure S6). We then conducted cell trajectory analysis using Monocle 3 to investigate the potential transition between the different clusters of keratinocytes. It can be seen from the pseudotime trajectory axis that Cluster 0 can transdifferentiate into Cluster 1 and Cluster 2 (Figure 4F). Trends in the pseudotime dynamic expression of RHCG and KRT1/10/16/17 are shown in Figure 4G and H. From Cluster 0 to Cluster 1, the expression levels of RHCG, KRT16, and KRT17 did not change significantly, while KRT1 and KRT10 were always maintained at low levels. From Cluster 0 to Cluster 2, the levels of RHCG, KRT16, and KRT17 showed the similar trend, while the levels of KRT1 and KRT10 showed the opposite trend. Interestingly, the results of the bulk data show a weak negative correlation between RHCG and KRT1/10 in both lesion and non-lesion tissues, while there is a stronger positive correlation between RHCG and KRT16/17 in lesion tissues compared to non-lesion tissues (Figure 4I and J). Multiplex immunofluorescence (mIF) confirmed that for lesion tissues, KRT1 was barely expressed, while RHCG was strongly expressed in regions of high KRT16 expression; for non-lesion tissues, KRT16 was barely expressed, and RHCG was at low levels in regions of high KRT1 expression (Figure 4K and L). These results suggest that RHCG is a potential unfavorable factor for psoriasis in keratinocytes.
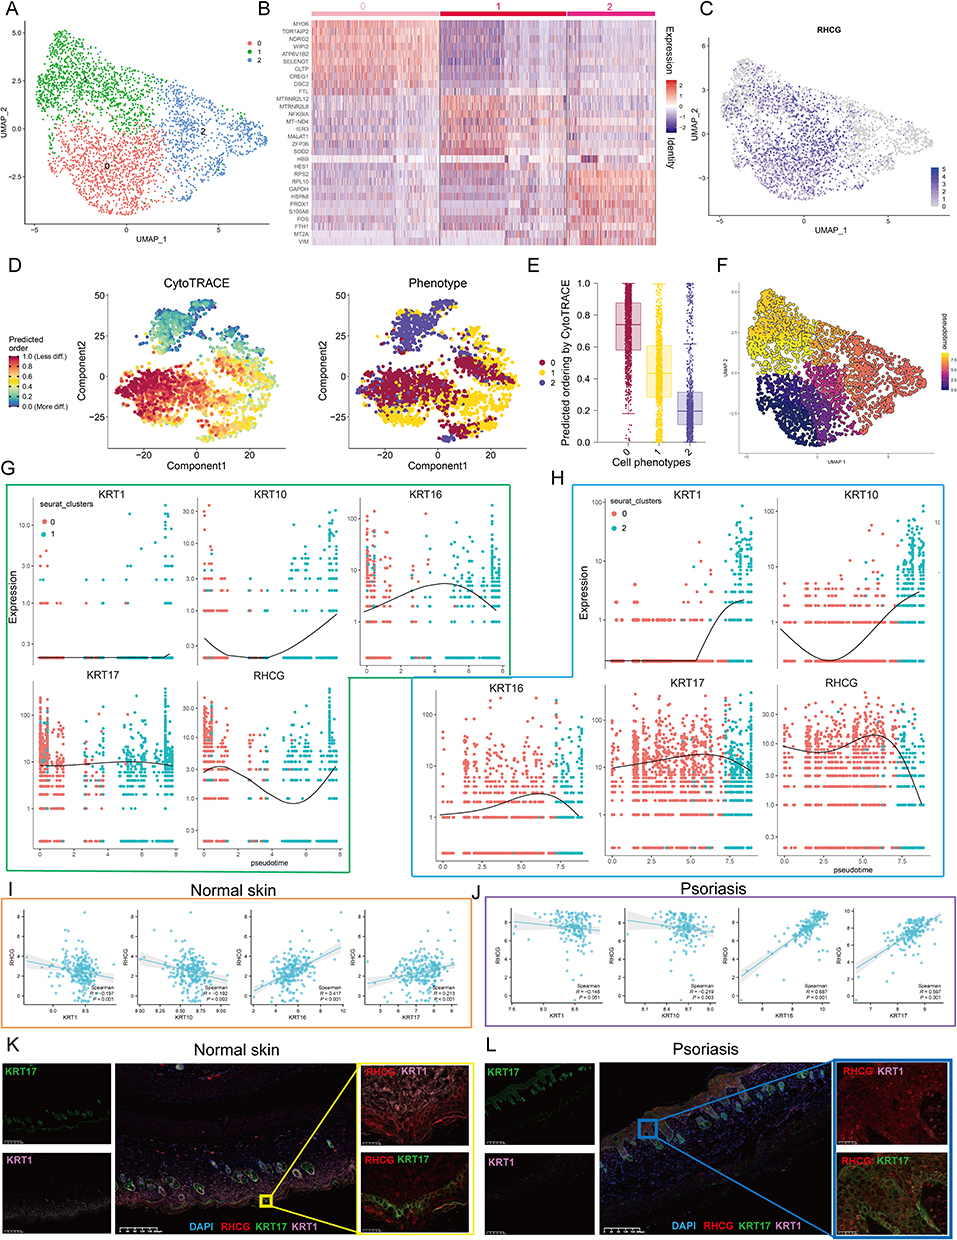 |
Figure 4 Cell clusters of keratinocytes and potential transition between cell clusters. (A) UMAP plot of all keratinocytes, colourcoded for three molecular clusters. See also Figures S3–S6. (B) Heatmap showing the expression patterns of 3 cell clusters in keratinocytes. (C) UMAP revealing the expression level of RHCG. (D) tSNE demonstrating the degree of differentiation of each keratinocyte cluster assessed by CytoTRACE. (E) Box plot showing the differentiation score of each keratinocyte cluster. (F) Monocle 3 pseudotime analysis for all keratinocytes. (G and H) Jitter plots showing the expression level of KRT1/10/16/17 and RHCG changing with pseudotime from Cluster 0 to Cluster 1 (G) and Cluster 2 (H). (I and J) The scatter plot demonstrating the correlation between RHCG and KRT1/10/16/17 in normal (I) and psoriatic skin (J) in merged GEO cohort. Spearman method was conducted. (K and L) Double IF staining images of RHCG and KRT1 and KRT16 in the mice normal (K) and psoriasis (L) samples biopsy. Scale bar, 100 mM. The representative views of co-staining were shown in the enlarged images at right (scale bar, 20 mM). |
Identification of HOPX and RHCG Co-Expression in Keratinocytes
To explore the possible mechanisms of RHCG action in psoriasis, we searched the genetic perturbation similarity analysis (GPSA) database for potential regulators upstream of RHCG. We obtained seven datasets which contained RHCG-related genetic perturbation data by filtering with keratinocytes (HEKn cell line) as the keyword (Figure 5A, Gene knock-out/down). The perturbation genes SUPT6H, HOPX, BRD4 were identified as being able to negatively regulate the expression of RHCG, and HNRNPA3, TOPBP1, POGLUT1, HNRNPK were identified as being able to positively regulate the expression of RHCG (Determine based on logFC, P < 0.001). We obtained potential target genes downstream of the perturbation genes in each dataset separately and performed GSEA to annotate their biological functions (Figure S7). We found that SUPT6H was associated with ribosomes, HOPX with PPAR signaling pathway, BRD4 with cytochrome P450; HNRNPA3 with DNA replication, TOPBP1/HNRNPK with lupus erythematosus, and POGLUT1 with cell cycle.
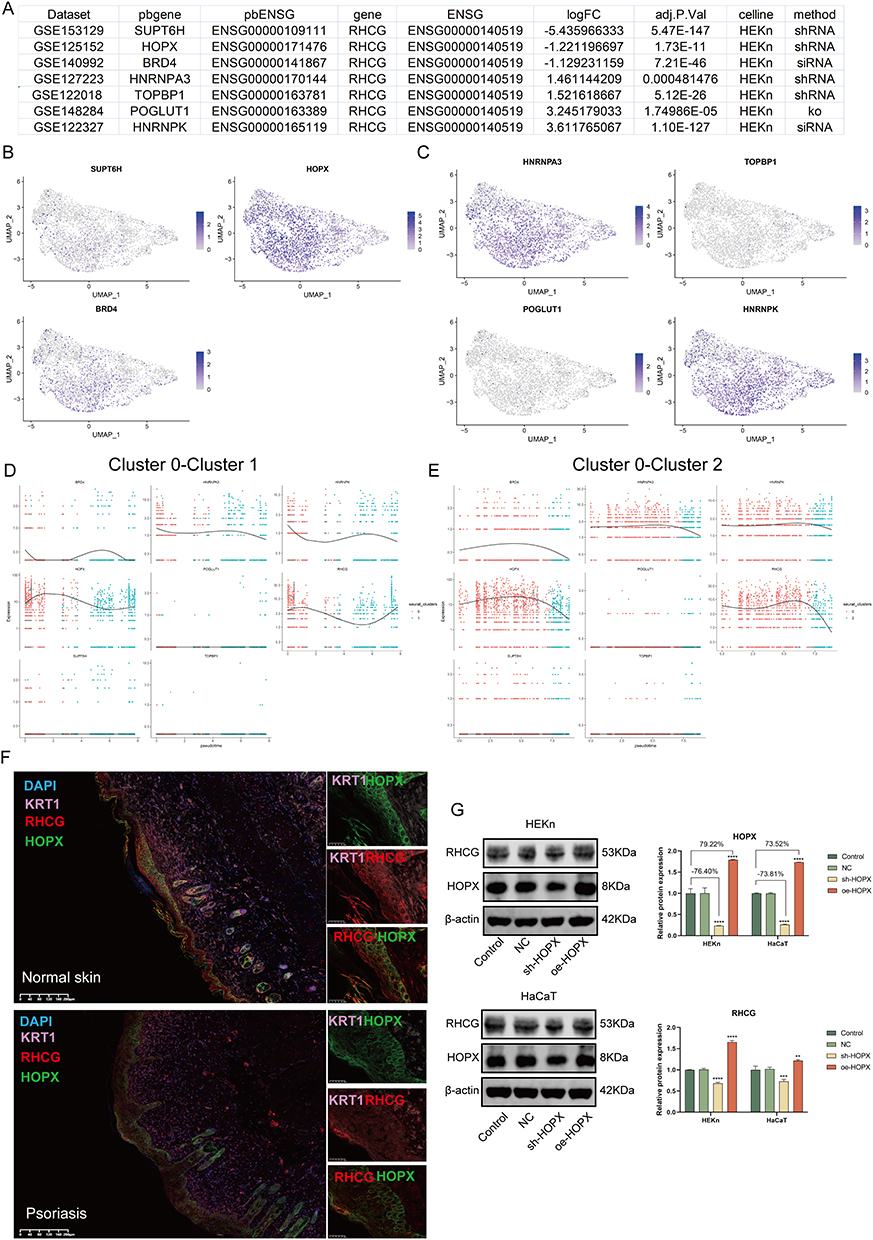 |
Figure 5 Identification of the regulation of RHCG levels by HOPX in keratinocytes. (A) Table diagram showing the basic profiles of seven genes with potential regulatory effects on RHCG (HEKn celline, human primary epidermal keratinocytes, data from seven independent datasets). Three of these genes (SUPT6H, HOPX, and BRD4) have a positive regulatory effect on RHCG and four (HNRNPA3, TOPBP1, POGLUT1, and HNRNPK) have a negative regulatory effect on RHCG. pbgene represents perturbation gene. See also Figure S7. (B and C) UMAP plot demonstrating the expression levels of three positively regulating genes (B) and four negatively regulating genes (C) in keratinocytes. See also Figure S8. (D and E) Jitter plots showing the expression level of seven pbgenes and RHCG changing with pseudotime from Cluster 0 to Cluster 1 (D) and Cluster 2 (E). See also Figure S8. (F) Double IF staining images of RHCG and HOPX in the psoriasis sample biopsy. Scale bar, 100 mM. The representative views of co-staining were shown in the enlarged images at right (scale bar, 20 mM). (G) Western blots of RHCG after si-HOPX treatment in HaCaT and HEKn cell lines. **P < 0.01, ***P < 0.001, ****P <0.0001. |
Next, we characterized the expression of the seven genes at the single cell level. We noted that HOPX was very consistent with RHCG and was mainly expressed in cluster 0 and cluster 1 (Figure 5B and C). Interestingly, the negative correlation between RHCG and HOPX was significantly attenuated in psoriasis samples compared to normal samples (Figure S8, red box; psoriasis sample, R = −0.100, P = 0.111; normal sample, R = −0.543, P < 0.001). HOPX is found to be localized in the granular layer of the epidermis and is able to regulate the late terminal differentiation of keratinocytes.45,46 The pseudotime dynamic expression trends of RHCG and HOPX are similar to each other during the differentiation of keratinocytes (Figure 5D and E). Multiplex immunofluorescence confirmed the co-localization of RHCG and HOPX in psoriatic lesion tissue (Figure 5F). Subsequently, we interfered with HOPX expression in HEKn and HaCaT cell lines and observed simultaneous changes in RHCG levels (Figure 5G, P <0.01). The results show that HOPX can modulate the expression of RHCG in keratinocytes.
Identification of the Relationship Between RHCG and DC Cells in Psoriasis
Here, we explored the potential significance of RHCG in DC cells. Cibersort was used to assess the abundance of immune cell infiltration in skin samples. As shown in Figure 6A, we found that activated DC cells were significantly upregulated in psoriatic lesions compared to healthy controls. Correlation analysis of 22 immune cell types in skin samples showed a significant positive correlation between RHCG and the abundance of activated DC cells (Figure 6B, P < 0.001). DC cells are activated and return from the dermis into the lymph nodes to activate helper T cells (Th) and promote Th cell differentiation in an interleukin-dependent manner, driving inflammatory information from the innate to the adaptive immune system and amplifying the inflammatory response.47 From the cellular communication network in Figure 3E, it appears that keratinocytes are able to release signals to DC cells to perform biological functions. We observed the presence of heterogeneity within DC cells and by re-clustering these cells, and a total of two sub-clusters were obtained as shown in Figure 6C. We confirmed the specific upregulation of the DC cell activation marker gene LAMP3, LY75, in cluster 0 (Figure 6D and E), and defined cluster 0 as mature DC cells and cluster 1 as semi-mature DC cells (Figure 6F). In the non-lesioned tissues, there was no correlation between RHCG and LAMP3, LY75, while in the lesioned tissues, RHCG and LAMP3 were significantly positively correlated (Figure S9, R = 0.530, P < 0.001). Interestingly, HOPX is upregulated in semi-mature DC cells (Figure 6G), in contrast to RHCG (Figure 6H). It is noteworthy that, as we have mentioned above, both have a consistent expression in keratinocytes. We speculate that the different co-expression patterns of the two genes in different cell types may be responsible for the lack of correlation between the two in the bulk data. Our data showed that RHCG was involved in the activation of DC cells (Figure 6I and J), and co-localized with LAMP3 in the skin lesion tissue (Figure 6K, mIF). To determine the specific role of RHCG in DC cell, we constructed RHCG-stabilised transfected cell lines and confirmed that RHCG promoted DC cell maturation (marked by LAMP3), whereas interfering with the expression of RHCG exhibited the opposite effect (Figure 6L and M, P < 0.0001).
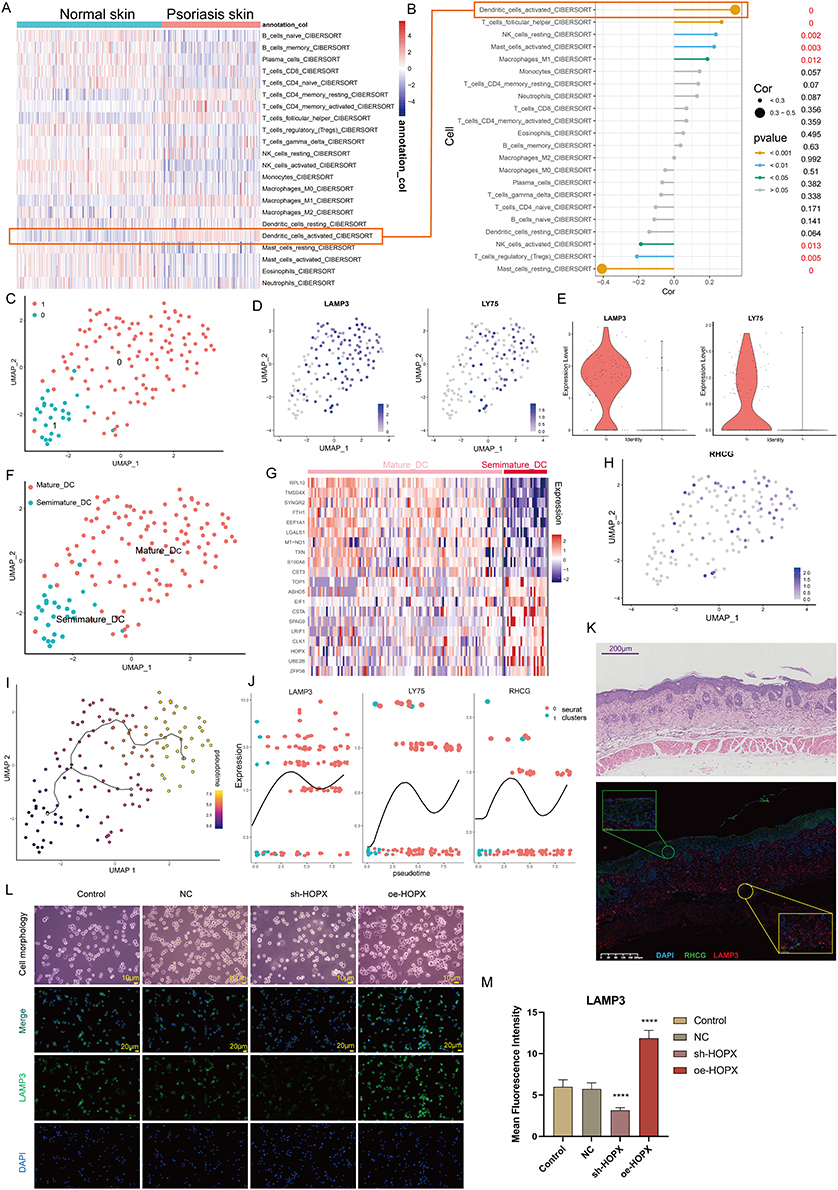 |
Figure 6 Identification of the association of RHCG with mature dendritic (DC) cells. (A) Heatmaps of abundance differences of 24 immune infiltrating cells between normal and psoriatic skin (Cibersort method). (B) Bubble plot showing the correlation between RHCG and 24 immune cells (Related to (A) with a red line). The X-axis represents the correlation coefficient and the Y-axis represents the different immune cells. Different P-value intervals are represented by different colors, and the larger the correlation coefficient, the larger the bubble. (C) UMAP plot showing that the 2 subclusters’ DC cell populations were re-clustered into (color coding). See also Figure S9. (D and E) UMAP (D) and violin (E) plot revealing the expression level of mature DC cell markers (LAMP3 and LY75). (F) Two DC cell subpopulations were defined as semi-mature and mature DC cells, respectively. (G) Heatmap showing the expression patterns of semi-mature and mature DC cells. (H) UMAP plot revealing the expression level of RHCG in DC cells. (I) Monocle 3 pseudotime analysis for all DC cells. (J) Jitter plots showing the expression level of LAMP3, LY75 and RHCG changing with pseudotime from semi-mature DC cells to mature DC cells. (K) Double IF staining images of RHCG and LAMP3 in the psoriasis sample biopsy. Scale bar, 100 mM. The representative views of co-staining were shown in the enlarged images at right (scale bar, 20 mM). (L and M) IF staining for LAMP3 (green) demonstrating the role of HOPX in the regulation of DC cell maturation. The morphological images were also provided. One way ANOVA, ****p < 0.0001. |
Identification of the Mechanisms of CR and TR in the Treatment of Psoriasis
A total of 848 potential targets of the active component of CR and TR were obtained from the database prediction screening. The components and corresponding targets were imported into the Cytoscape software to obtain the “active component-target” network diagram, as shown in Figure S10A (CR) and S10B (TR). GO and KEGGE enrichment analysis suggested that the mechanism of TR is related to calcium homeostasis and protease activity, while the mechanism of CR is related to adenylate cyclase regulation of G protein-coupled receptor signaling, steroid metabolism, and transcription factor activity (Figure S10C). We then obtained the intersecting genes from the DEGs in merged GEO dataset, from CR target genes, and from TR target genes (Figure S10D), including G6PD, TRPV3, YAP1, SQLE, FABP5, AR, HSD11B1, FABP4, RORC, NFKB1, NFKB2, ATP12A, and PIAS1 (Figure S10E). In vivo experiments have shown that both CR and TR have good therapeutic effects on psoriasis. Specifically, the efficacy of medium-dose TR and high-dose CR was the most significant (Figure 7A, phenotypical presentation photos of the mice back skin). The trends of Scab score, Erythema score, Infiltrate score, and PASI score for each group during the 7-day treatment period are shown in Figure 7B. HE staining showed that TR and CR were able to partially reverse the acanthosis in the epidermis, epidermal hyperplasia, and perivascular infiltration of the inflammatory cells increased by IMQ (Figure 7C). We also examined the expression of NFKB2, TRPV3, and YAP1 in the skin. Immunohistochemical staining also showed that TR and CR administration reduced the number of NFKB2, TRPV3, and YAP1 highly expressed cells in IMQ-induced psoriasis (Figure 7D). Notably, medium-dose TR and high-dose CR showed the best intervention effect (Figure 7E). In addition, we performed mIF experiments that further strengthened the evidence that CR and TR were able to inhibit NFKB2, TRPV3, and YAP1 expression (Figure S11). These results suggest that TR and CR administration effectively improved psoriasis symptoms, possibly by suppressing NFKB2, TRPV3, and YAP1 expression in vivo.
 |
Figure 7 Identification of the Mechanisms of Cinnamomi Ramulus (CR) and Tripterygii Radix (TR) in the Treatment of Psoriasis. (A) Representative photographs of the back of each group of mice. (B) Scab/Erythema/Infiltrate/psoriasis area severity index (PASI) score of each group for day1, day2, day3, day4, day4, day5, day6 and day7. Left: TR, Right: CR. (C) Skin lesions of each group were stained with HE (Magnification × 10, scale bars = 250 µm; Magnification × 40, scale bars = 50 µm). (D) Skin lesions of each group were stained with NFKB2, TRPV3, YAP1 (Magnification × 10, scale bars = 250 µm; Magnification × 40, scale bars = 50 µm). See also Figure S10. (E) Differences of NFKB2, TRPV3, YAP1 immunohistochemical staining intensity among nine groups as assessed by H-score (n = 4). One-way ANOVA was conducted. *P < 0.05, **P < 0.01, ***P < 0.001. Model, imiquimod; Low dose, 0.585 g/kg/day; medium dose, 1.17 g/kg/day; high dose, 2.34 g/kg/day. See also Figure S11. |
Discussion
Psoriasis is a chronic skin disease that is very common worldwide and occurs at any age. Not only does it place a heavy burden on the healthcare system, but it also takes a serious toll on the patient’s mental health and reduces the quality of life.1,48 With the rapid development of biological knowledge and technology, the resolution of disease pathogenesis factors has been greatly improved.3 As with most human diseases, psoriasis is heterogeneous and complex. As an immune-related, multi-mechanism inflammatory disease, its underlying etiology is unknown.2,49 Although the large-scale clinical use of biologics has brought benefits to many patients with psoriasis, the highly heterogeneous nature of psoriasis dictates that some patients do not respond to treatment.50 Thus, there is an urgent need to further elucidate the pathogenesis of psoriasis in order to provide potential biomarkers and develop targeted drugs.
In this study, we obtained DEGs between lesions and normal control tissues based on skin samples in public dataset (Merged from GSE13355, GSE30999, and GSE14905). functional annotation revealed that these genes are involved in very diverse biological signatures, suggesting the complexity of psoriasis. To seek significant functional modules in complex molecular networks, MEGENA was performed to demonstrate the relationships between genes and genes within the module and thus identify hub genes. Two remarkable modules (C1_2 and C1_3) were brought to our attention, interestingly, both involving distinct biological functions and showing completely opposite expression trends in psoriasis. We realized that the two may represent two separate pathogenic mechanisms of psoriasis. The biological characteristics of the different models may provide a theoretical basis for the delineation of psoriasis subtypes. Therefore, the “ConsensusClusterPlus” package was used to classify psoriasis biological subtypes into 2 categories, defined as C1 and C2, based on the pivotal genes of the two modules. Further analysis showed that C1 was significantly enriched in immune response-related signals, while C2 was significantly enriched in collagen- and extracellular matrix-related signals. Clinical evidence suggests increased levels of collagen in the non-injured skin of patients with psoriasis, accompanied by high proliferation levels of fibroblasts.51,52 In addition, hydroxyproline, a marker of tissue collagen degradation, has been found to be significantly elevated in patients with severe psoriasis.53 Importantly, immune factors and collagen are not independent of each other. There is evidence that some cytokines (IL-1/17 or TNF alpha) can promote collagen degradation.54,55 Moreover, keratinocytes of the psoriatic epidermis require different scaffolding proteins than healthy skin, and keratinocytes are actively involved in the regulation of the immune response in psoriatic skin.56 This information further implies a complex signaling cross-linkage in the psoriatic microenvironment.
To characterize the functions of the two gene modules, we show the expression profiles of the hub genes in a single-cell dataset. We found that RHCG (Rh Family C Glycoprotein) and CD2 in C1_2 are expressed at high levels in the skin microenvironment, suggesting a possible important function in the progression of psoriasis. As an autoimmune disease, activated memory T cells expressing CD2 are a key component in the pathogenesis of psoriasis.57 Established targeted drugs have been developed to modulate the function of CD2+ T cells and selectively induce their apoptosis to achieve improvement in psoriasis.58 RHCG belongs to the rhesus monkey (Rh) family and is widely expressed in the kidney, liver, central nervous system and gastrointestinal tract and is involved in the transmembrane transport of ammonia to maintain normal ammonia metabolism.59–61 To date, studies on the association of RHCG with psoriasis are very limited. We examined the correlation between the expression patterns of RHCG and four keratinocyte differentiation genes with pseudo-temporal order, respectively, and the results showed that RHCG is closely associated with the developmental state of keratinocytes. mIF confirmed the co-localization relationship between RHCG and KRT16 in lesion tissues, the latter also being considered as a marker of excessive proliferation of keratinocytes in psoriasis.62 We identified homeodomain-only protein (HOP) X as an upstream regulator of RHCG. HOPX has been found to induce changes in profilaggrin and loricrin expression and to regulate the level of keratinocyte differentiation.45
It is well known that psoriasis is a chronic immune-mediated inflammatory skin disease and progresses by maintaining a crosstalk between immune cells and keratinocytes.63,64 Specifically, in psoriasis, the autoimmune T-cell response is initiated by plasmacytoid dendritic cells (pDC, a subpopulation of dendritic cells), which are highly infiltrated in lesion tissue and activated to produce type I interferons (IFNs).8,65 In addition, DC cells secrete cytokines such as iNOS, IL-12, IL-23 and TNF-α to maintain the inflammatory response.66 Although extensive evidence suggests that DC cells are at a critical link in the pathogenesis of psoriasis, the function of specific DC cell subsets remains unclear.67 Our results indicate that a high percentage of DC cells in an activated state are present in psoriasis samples. And the correlation between RHCG and DC cells was valued by Pearson analysis. Further analysis showed that RHCG was involved in DC cell maturation, suggesting a complex role of RHCG in the molecular mechanisms of psoriasis. We believe that the different roles of RHCG in the different cell types are a microcosm of the heterogeneity of psoriasis.
Finally, we try to offer new alternatives for the treatment of psoriasis. A previous work by our team suggested that CR might be able to improve psoriasis through several signaling pathways related to metabolic, immune and inflammatory responses and aberrant angiogenesis.68 In addition, numerous studies have shown the remarkable efficacy of TR in improving the symptoms of psoriasis.69–72Therefore, we chose these two traditional Chinese herbs for our study. Network pharmacological analysis showed that both have potential regulatory effects on 13 proteins, G6PD, AR, HSD11B1, FABP4, FABP5, RORC, TRPV3, PIAS1, NFKB2, NFKB1, SQLE, YAP1, ATP12A. Among them, TRPV3, NFKB1/2, RORC, PIAS1, and YAP1 have been shown to be associated with the development of psoriasis, and our data suggest that TR and CR can significantly regulate the expression of TRPV3, NFKB2, and YAP1.
We acknowledge that there are some shortcomings in this study. This is a retrospective study. We wanted to observe the heterogeneity of psoriasis in as large a cohort as possible, and although we have tried to correct for batch effects as much as possible, it still has an impact on subsequent analyses that cannot be eliminated. Our data suggest that RHCG may play an important role in psoriasis, but the exact mechanism of action is lacking. In addition, low number of animals for in vivo conceptual experiments on drug efficacy is a limitation of this study. Our team is further investigating this topic.
Conclusion
Through bioinformatics analysis and experimental validation, we identified RHCG as a potential new biomarker for psoriasis, which may be a key molecule in the pathogenesis of psoriasis, and its further exploration may provide directions for the development of new targeted drugs. In addition, CR and TR may have potential as alternative therapies for psoriasis.
Data Sharing Statement
We declare that all the data in this article are authentic, valid, and available for use on reasonable request.
Ethics and Sample Collection
The study was approved by Affiliated Hospital of Nanjing University of Chinese Medicine, Ethics and Research Committee (approval number: 2019NL-119-02).
The requirement for ethical review for the use of public database data was specifically exempted by the IRB of the Affiliated Hospital of Nanjing University of Chinese Medicine
Consent for publication
All authors have given consent for publication.
Acknowledgments
The authors are grateful to Professor Xi Zou (Department of Oncology, Affiliated Hospital of Nanjing University of Traditional Chinese Medicine) for her generous help during the study.
Author Contributions
All authors made a significant contribution to the work reported, whether that is in the conception, study design, execution, acquisition of data, analysis and interpretation, or in all these areas; took part in drafting, revising or critically reviewing the article; gave final approval of the version to be published; have agreed on the journal to which the article has been submitted; and agree to be accountable for all aspects of the work.
Funding
The present study was supported by Natural Science Foundation of China (81603626), National Key R&D Program “Modernization of Chinese Medicine” Key Project (2018YFC1705304), and the sixth batch of national old Chinese medicine experts academic experience succession work project.
Disclosure
The authors declare no conflicts of interest in this work.
References
1. Griffiths CE. Psoriasis. Lancet. 2021;397(10281):1301–1315.
2. Griffiths CE, Barker JN. Pathogenesis and clinical features of psoriasis. Lancet. 2007;370(9583):263–271. doi:10.1016/S0140-6736(07)61128-3
3. Ji C, Wang H, Bao C, et al. Challenge of nail psoriasis: an update review. Clin Rev Allergy Immunol. 2021;61(3):377–402. doi:10.1007/s12016-021-08896-9
4. Armstrong AW, Read C. Pathophysiology, clinical presentation, and treatment of psoriasis: a review. Jama. 2020;323(19):1945–1960. doi:10.1001/jama.2020.4006
5. Tokuyama M, Mabuchi T. New treatment addressing the pathogenesis of psoriasis. Int J Mol Sci. 2020;21(20):7488. doi:10.3390/ijms21207488
6. Reid C, Griffiths CEM. Psoriasis and treatment: past, present and future aspects. Acta Derm Venereol. 2020;100(3):32. doi:10.2340/00015555-3386
7. Albaghdadi A. Current and under development treatment modalities of psoriasis: a review. Endocr Metab Immune Disord Drug Targets. 2017;17(3):189–199. doi:10.2174/1871530317666170804153751
8. Kamata M, Tada Y. Dendritic cells and macrophages in the pathogenesis of psoriasis. Front Immunol. 2022;13:941071. doi:10.3389/fimmu.2022.941071
9. Wang A, Bai Y. Dendritic cells: the driver of psoriasis. J Dermatol. 2020;47(2):104–113. doi:10.1111/1346-8138.15184
10. Luo Y, Luo Y, Chang J, et al. Identification of candidate biomarkers and pathways associated with psoriasis using bioinformatics analysis. Hereditas. 2020;157(1):30. doi:10.1186/s41065-020-00141-1
11. Zuo Y, Dai L, Li L, et al. ANGPTL4 regulates psoriasis via modulating hyperproliferation and inflammation of keratinocytes. Front Pharmacol. 2022;13:850967. doi:10.3389/fphar.2022.850967
12. Xing L, Wu T, Yu L, et al. Exploration of biomarkers of psoriasis through combined multiomics analysis. Mediators Inflamm. 2022;2022:7731082. doi:10.1155/2022/7731082
13. Ritchie ME, Phipson B, Wu D, et al. limma powers differential expression analyses for RNA-sequencing and microarray studies. Nucleic Acids Res. 2015;43(7):e47. doi:10.1093/nar/gkv007
14. Gu Z, Hübschmann D. Simplify enrichment: a bioconductor package for clustering and visualizing functional enrichment results. Genomics Proteomics Bioinformatics. 2022;21:190–202. doi:10.1016/j.gpb.2022.04.008
15. Yu G, Wang L-G, Han Y, et al. clusterProfiler: an R package for comparing biological themes among gene clusters. OMICS: A Journal of Integrative Biology. 2012;16(5):284–287. doi:10.1089/omi.2011.0118
16. Song WM, Zhang B. Multiscale embedded gene co-expression network analysis. PLoS Comput Biol. 2015;11(11):e1004574. doi:10.1371/journal.pcbi.1004574
17. Chin CH, Chen S-H, Wu -H-H, et al. cytoHubba: identifying hub objects and sub-networks from complex interactome. BMC Syst Biol. 2014;4(Suppl 4):S11. doi:10.1186/1752-0509-8-S4-S11
18. Wilkerson MD, Hayes DN. ConsensusClusterPlus: a class discovery tool with confidence assessments and item tracking. Bioinformatics. 2010;26(12):1572–1573. doi:10.1093/bioinformatics/btq170
19. Yao S, Liu T. Analysis of differential gene expression caused by cervical intraepithelial neoplasia based on GEO database. Oncol Lett. 2018;15(6):8319–8324. doi:10.3892/ol.2018.8403
20. Kim J, Lee J, Kim HJ, et al. Single-cell transcriptomics applied to emigrating cells from psoriasis elucidate pathogenic versus regulatory immune cell subsets. J Allergy Clin Immunol. 2021;148(5):1281–1292. doi:10.1016/j.jaci.2021.04.021
21. Aran D, Looney AP, Liu L, et al. Reference-based analysis of lung single-cell sequencing reveals a transitional profibrotic macrophage. Nat Immunol. 2019;20(2):163–172. doi:10.1038/s41590-018-0276-y
22. Zhai Y, Li G, Li R, et al. Single-Cell RNA-sequencing shift in the interaction pattern between glioma stem cells and immune cells during tumorigenesis. Front Immunol. 2020;11:581209. doi:10.3389/fimmu.2020.581209
23. Zhang Z, Wang Z-X, Chen Y-X, et al. Integrated analysis of single-cell and bulk RNA sequencing data reveals a pan-cancer stemness signature predicting immunotherapy response. Genome Med. 2022;14(1):45. doi:10.1186/s13073-022-01050-w
24. Jin S, Guerrero-Juarez CF, Zhang L, et al. Inference and analysis of cell-cell communication using CellChat. Nat Commun. 2021;12(1):1088. doi:10.1038/s41467-021-21246-9
25. Chen B, Khodadoust MS, Liu CL, et al. Profiling tumor infiltrating immune cells with CIBERSORT. Methods Mol Biol. 2018;1711:243–259.
26. Magaki S, Hojat SA, Wei B, et al. An introduction to the performance of immunohistochemistry. Methods Mol Biol. 2019;1897:289–298.
27. Im K, Mareninov S, Diaz MF, et al. An introduction to performing immunofluorescence staining. Methods Mol Biol. 2019;1897:299–311.
28. Liu YJ, Li J-P, Zhang Y, et al. FSTL3 is a prognostic biomarker in gastric cancer and is correlated with M2 macrophage infiltration. Onco Targets Ther. 2021;14:4099–4117. doi:10.2147/OTT.S314561
29. Huang P, Hu Y-D, Liu Y-J, et al. An analysis regarding the association between the nuclear pore complex (NPC) and hepatocellular carcinoma (HCC). J Hepatocell Carcinoma. 2023;10:959–978. doi:10.2147/JHC.S417501
30. Yang Y, Xiao M, Song Y, et al. H-score of 11β-hydroxylase and aldosterone synthase in the histopathological diagnosis of adrenocortical tumors. Endocrine. 2019;65(3):683–691. doi:10.1007/s12020-019-02022-8
31. Zhang J, Zhou Y, Ma Z. Multi-target mechanism of Tripteryguim wilfordii Hook for treatment of ankylosing spondylitis based on network pharmacology and molecular docking. Ann Med. 2021;53(1):1090–1098. doi:10.1080/07853890.2021.1918345
32. Wang Y, Zhang Y, Wang Y, et al. Using network pharmacology and molecular docking to explore the mechanism of Shan Ci Gu (Cremastra appendiculata) against non-small cell lung cancer. Front Chem. 2021;9:682862. doi:10.3389/fchem.2021.682862
33. Kim S, Chen J, Cheng T, et al. PubChem in 2021: new data content and improved web interfaces. Nucleic Acids Res. 2021;49(D1):D1388–d1395. doi:10.1093/nar/gkaa971
34. Percie du Sert N, Ahluwalia A, Alam S, et al. Reporting animal research: explanation and elaboration for the ARRIVE guidelines 2.0. PLoS Biol. 2020;18(7):e3000411. doi:10.1371/journal.pbio.3000411
35. Rendon A, Schäkel K. Psoriasis Pathogenesis and Treatment. Int J Mol Sci. 2019;20(6):1475. doi:10.3390/ijms20061475
36. Jovic D, Liang X, Zeng H, et al. Single-cell RNA sequencing technologies and applications: a brief overview. Clin Transl Med. 2022;12(3):e694. doi:10.1002/ctm2.694
37. Nakamizo S, Dutertre C-A, Khalilnezhad A, et al.. Single-cell analysis of human skin identifies CD14+ type 3 dendritic cells co-producing IL1B and IL23A in psoriasis. J Exp Med. 2021;218(9). doi:10.1084/jem.20202345
38. Langley RG, Papp K, Bissonnette R, et al. Safety profile of intravenous and subcutaneous siplizumab, an anti-CD2 monoclonal antibody, for the treatment of plaque psoriasis: results of two randomized, double-blind, placebo-controlled studies. Int J Dermatol. 2010;49(7):818–828. doi:10.1111/j.1365-4632.2010.04512.x
39. Krueger GG. Selective targeting of T cell subsets: focus on alefacept - a remittive therapy for psoriasis. Expert Opin Biol Ther. 2002;2(4):431–441. doi:10.1517/14712598.2.4.431
40. Xie S, Chen Z, Wang Q, et al. Comparisons of gene expression in normal, lesional, and non-lesional psoriatic skin using DNA microarray techniques. Int J Dermatol. 2014;53(10):1213–1220. doi:10.1111/ijd.12476
41. Thatikonda S, Pooladanda V, Sigalapalli DK, et al. Piperlongumine regulates epigenetic modulation and alleviates psoriasis-like skin inflammation via inhibition of hyperproliferation and inflammation. Cell Death Dis. 2020;11(1):21. doi:10.1038/s41419-019-2212-y
42. Zhang X, Yin M, Zhang LJ. Keratin 6, 16 and 17-critical barrier alarmin molecules in skin wounds and psoriasis. Cells. 2019;8(8):807. doi:10.3390/cells8080807
43. Roth W, Kumar V, Beer H-D, et al. Keratin 1 maintains skin integrity and participates in an inflammatory network in skin through interleukin-18. J Cell Sci. 2012;125(Pt 22):5269–5279. doi:10.1242/jcs.116574
44. Lambert S, Swindell WR, Tsoi LC, et al. Dual role of act1 in keratinocyte differentiation and host defense: TRAF3IP2 silencing alters keratinocyte differentiation and inhibits IL-17 responses. J Invest Dermatol. 2017;137(7):1501–1511. doi:10.1016/j.jid.2016.12.032
45. Obarzanek-Fojt M, Favre B, Kypriotou M, et al. Homeodomain-only protein HOP is a novel modulator of late differentiation in keratinocytes. Eur J Cell Biol. 2011;90(4):279–290. doi:10.1016/j.ejcb.2010.11.001
46. Chen SY, Ishii MA, Cheng B, et al. HOPX Is a ZNF750 target that promotes late epidermal differentiation. J Invest Dermatol. 2019;139(9):2039–2042.e2. doi:10.1016/j.jid.2019.03.1141
47. Song L, Dong G, Guo L, et al. The function of dendritic cells in modulating the host response. Mol Oral Microbiol. 2018;33(1):13–21. doi:10.1111/omi.12195
48. Langley RG, Krueger GG, Griffiths CE. Psoriasis: epidemiology, clinical features, and quality of life. Ann Rheum Dis. 2005;2(Suppl 2):8–23.
49. Grän F, Kerstan A, Serfling E, et al. Current developments in the immunology of psoriasis. Yale J Biol Med. 2020;93(1):97–110. doi:10.1038/jid.2012.339
50. Singh A, Easwari TS. Recent advances in psoriasis therapy: trends and future prospects. Curr Drug Targets. 2021;22(15):1760–1771. doi:10.2174/1389450122666210118103455
51. Koivukangas V, Kallionen M, Karvonen J, et al. Increased collagen synthesis in psoriasis in vivo. Arch Dermatol Res. 1995;287(2):171–175. doi:10.1007/BF01262327
52. Oikarinen A, Ala-Kokko L, Tamminen M, et al. Effect of long-term PUVA treatment of psoriasis on the collagen and elastin gene expression and growth of skin fibroblasts in vitro. Br J Dermatol. 1990;123(5):621–630. doi:10.1111/j.1365-2133.1990.tb01479.x
53. Srivastava AK, Khare P, Kumar Nagar H, et al. Hydroxyproline: a potential biochemical marker and its role in the pathogenesis of different diseases. Curr Protein Pept Sci. 2016;17(6):596–602. doi:10.2174/1389203717666151201192247
54. Fang Q, Liu X, Al-Mugotir M, et al. Thrombin and TNF-α/IL-1β synergistically induce fibroblast-mediated collagen gel degradation. Am J Respir Cell Mol Biol. 2006;35(6):714–721. doi:10.1165/rcmb.2005-0026OC
55. Ding J, Ghali O, Lencel P, et al. TNF-alpha and IL-1beta inhibit RUNX2 and collagen expression but increase alkaline phosphatase activity and mineralization in human mesenchymal stem cells. Life Sci. 2009;84(15–16):499–504. doi:10.1016/j.lfs.2009.01.013
56. Crawford M, Dagnino L. Scaffolding proteins in the development and maintenance of the epidermal permeability barrier. Tissue Barriers. 2017;5(4):e1341969. doi:10.1080/21688370.2017.1341969
57. Binder C, Cvetkovski F, Sellberg F, et al. CD2 Immunobiology. Front Immunol. 2020;11:1090. doi:10.3389/fimmu.2020.01090
58. Binder C, Sellberg F, Cvetkovski F, et al. Siplizumab, an Anti-CD2 monoclonal antibody, induces a unique set of immune modulatory effects compared to alemtuzumab and rabbit anti-thymocyte globulin in vitro. Front Immunol. 2020;11:592553. doi:10.3389/fimmu.2020.592553
59. Wagner CA, Devuyst O, Belge H, et al. The rhesus protein RhCG: a new perspective in ammonium transport and distal urinary acidification. Kidney Int. 2011;79(2):154–161. doi:10.1038/ki.2010.386
60. Eguchi K, Izumi Y, Yasuoka Y, et al. Regulation of Rhcg, an ammonia transporter, by aldosterone in the kidney. J Endocrinol. 2021;249(2):95–112. doi:10.1530/JOE-20-0267
61. Seshadri RM, Klein JD, Smith T, et al. Changes in subcellular distribution of the ammonia transporter, Rhcg, in response to chronic metabolic acidosis. Am J Physiol Renal Physiol. 2006;290(6):F1443–52. doi:10.1152/ajprenal.00459.2005
62. Lessard JC, Piña-Paz S, Rotty JD, et al. Keratin 16 regulates innate immunity in response to epidermal barrier breach. Proc Natl Acad Sci U S A. 2013;110(48):19537–19542. doi:10.1073/pnas.1309576110
63. Kamiya K, Kishimoto M, Sugai J, et al. Risk factors for the development of psoriasis. Int J Mol Sci. 2019;20(18):4347. doi:10.3390/ijms20184347
64. Lowes MA, Suárez-Fariñas M, Krueger JG. Immunology of psoriasis. Annu Rev Immunol. 2014;32:227–255. doi:10.1146/annurev-immunol-032713-120225
65. Albanesi C, Scarponi C, Bosisio D, et al. Immune functions and recruitment of plasmacytoid dendritic cells in psoriasis. Autoimmunity. 2010;43(3):215–219. doi:10.3109/08916930903510906
66. Brandum EP, Jørgensen AS, Rosenkilde MM, et al. Dendritic cells and CCR7 expression: an important factor for autoimmune diseases, chronic inflammation, and cancer. Int J Mol Sci. 2021;22(15):8340. doi:10.3390/ijms22158340
67. Vičić M, Kaštelan M, Brajac I, et al. Current concepts of psoriasis immunopathogenesis. Int J Mol Sci. 2021;22(21):11574. doi:10.3390/ijms222111574
68. Guo S, Zhou J-Y, Tan C, et al. Network pharmacology-based analysis on the mechanism of action of ephedrae herba-cinnamomi ramulus couplet medicines in the treatment for psoriasis. Med Sci Monit. 2021;27:e927421. doi:10.12659/MSM.927421
69. Ru Y, Li H, Zhang R, et al. Role of keratinocytes and immune cells in the anti-inflammatory effects of Tripterygium wilfordii Hook. f. in a murine model of psoriasis. Phytomedicine. 2020;77:153299. doi:10.1016/j.phymed.2020.153299
70. Han R, Rostami-Yazdi M, Gerdes S, et al. Triptolide in the treatment of psoriasis and other immune-mediated inflammatory diseases. Br J Clin Pharmacol. 2012;74(3):424–436. doi:10.1111/j.1365-2125.2012.04221.x
71. Liu L, Chen X, Lu Y, et al. Celastrol gel ameliorates imiquimod-induced psoriasis-like dermatitis in mice by targeting Langerhans cells. Bio Pharmaco. 2022;147:112644. doi:10.1016/j.biopha.2022.112644
72. Meng S, Sun L, Wang L, et al. Loading of water-insoluble celastrol into niosome hydrogels for improved topical permeation and anti-psoriasis activity. Colloids Surf B Biointerfaces. 2019;182:110352. doi:10.1016/j.colsurfb.2019.110352
 © 2023 The Author(s). This work is published and licensed by Dove Medical Press Limited. The
full terms of this license are available at https://www.dovepress.com/terms
and incorporate the Creative Commons Attribution
- Non Commercial (unported, 3.0) License.
By accessing the work you hereby accept the Terms. Non-commercial uses of the work are permitted
without any further permission from Dove Medical Press Limited, provided the work is properly
attributed. For permission for commercial use of this work, please see paragraphs 4.2 and 5 of our Terms.
© 2023 The Author(s). This work is published and licensed by Dove Medical Press Limited. The
full terms of this license are available at https://www.dovepress.com/terms
and incorporate the Creative Commons Attribution
- Non Commercial (unported, 3.0) License.
By accessing the work you hereby accept the Terms. Non-commercial uses of the work are permitted
without any further permission from Dove Medical Press Limited, provided the work is properly
attributed. For permission for commercial use of this work, please see paragraphs 4.2 and 5 of our Terms.