Back to Journals » Cancer Management and Research » Volume 13
Comprehensive Analysis to Identify Enhancer-Regulated Inflammation-Associated Genes in Lung Adenocarcinoma
Received 28 April 2021
Accepted for publication 31 August 2021
Published 11 September 2021 Volume 2021:13 Pages 7115—7129
DOI https://doi.org/10.2147/CMAR.S317922
Checked for plagiarism Yes
Review by Single anonymous peer review
Peer reviewer comments 2
Editor who approved publication: Dr Matthew Witek
Xi Li,1 Xinling Li,2 Lina Ding3
1Department of Medical Oncology, Beijing Chest Hospital, Capital Medical University, Beijing Tuberculosis and Thoracic Tumor Research Institute, Beijing, 101149, People’s Republic of China; 2Department of Biomedical Engineering, Georgia Institute of Technology, Atlanta, GA, 30332, USA; 3Key Laboratory of Henan Province for Drug Quality and Evaluation, Ministry of Education of China, School of Pharmaceutical Sciences, Zhengzhou University, Zhengzhou, Henan, 450001, People’s Republic of China
Correspondence: Lina Ding
Key Laboratory of Henan Province for Drug Quality and Evaluation, Ministry of Education of China, School of Pharmaceutical Sciences, Zhengzhou University, No. 100, Science Road, Zhengzhou, Henan, 450001, People’s Republic of China
Email [email protected]
Objective: The purpose of this study was to identify prognostic inflammatory markers regulated by enhancers in lung adenocarcinoma (LUAD).
Methods: Inflammatory indices of 490 LUAD patients in TCGA database were calculated using genomic variation analysis (GSVA). Patients were divided into high- and low-inflammatory index groups. Fraction of 22 infiltrating immune cells was estimated using the Cell type Identification By Estimating Relative Subsets Of RNA Transcripts (CIBERSORT). Gene set enrichment analysis (GSEA) was used to analyze gene enrichment. Differentially expressed genes were screened based on TCGA database. The H3K27ac ChIP-seq of A549 cells in GEO database (GSE42374) was analyzed to identify super enhancers. Kaplan–Meier method and multivariate Cox proportional hazards models were used for survival analysis. CCK8 and RT-qPCR were used for cellular level verification.
Results: Inflammation was associated with better outcome in LUAD patients. Anti-cancer immune cell fractions were upregulated in high-inflammatory index group. Genes enriched in inflammation-related signaling pathways were positively correlated with high-inflammatory index group. A total of 146 upregulated genes regulated by enhancers were screened, of which five genes including GDF10, HPGDS, ABCA8, SLIT3 and ADAMTS8 had significant influence on prognosis. ChIP-seq analysis showed that TGFβ+TNFα treatment promoted the enhancer activation of the five genes. Cellular experiments revealed that there was no significant effect of TGFβ treatment on the five genes expression. TNFα treatment upregulated the five genes expression, while the BET-bromodomain inhibitor JQ1 restored the effect of TNFα. Overexpression of the five genes significantly inhibited the proliferation of A549 and H1299 cells.
Conclusion: GDF10, HPGDS, ABCA8, SLIT3 and ADAMTS8 were identified as enhancer-regulated prognostic inflammation-related biomarkers, and the expression of these genes inhibited proliferation of LUAD cells.
Keywords: lung adenocarcinoma, prognosis, inflammation, enhancer
Introduction
Lung cancer is a common cancer worldwide, with incidence and mortality rates of 11.6% and 18.4%, respectively.1 There are approximately 1.3 million new diagnosed cases each year in the word.2 Lung adenocarcinoma (LUAD) is the most common histologic subtype, accounting for approximately 40% of lung cancers. Patients with lung cancer can be treated with surgery, radiotherapy, chemotherapy and targeted therapy. LUAD in early stage is not clinically distinct, so it is easy to be misdiagnosed. About 75% of LUAD patients are diagnosed at advanced stage and therefore cannot be treated with radical surgery.3 The survival rate of LUAD is only about 15%.3 Lung cancer treatment still suffers from the challenges of low cure rate and high recurrence rate.
Inflammation is an important marker of responsive host immunity, and is closely related to cancer development.4 Inflammatory immune microenvironment regulates tumor cell proliferation, angiogenesis, epithelial-to-mesenchymal transition (EMT) and metastasis.5 Inflammatory mediators are involved in the regulation of cancer progression. Nuclear factor-κB (NF-κB) is a factor linking chronic infection to increase cancer risk.6 Interferon-γ (IFN-γ) and IFN-α have anti-cancer effects.7,8 Transforming growth factor-β (TGF-β) facilitates tumor immune evasion and has pro-cancer effects.9 Whether inflammation promotes or inhibits cancer remains controversial. Studies show that inflammation index is an independent prognostic factor for patients with non-small cell lung cancer or small cell lung cancer after surgical resection.10–12 The prognosis of stage IA LUAD patients with low inflammatory index is unsatisfactory.11 In addition, low inflammatory index is associated with poor prognosis in metastatic non-small cell lung cancer.13 However, inflammatory prognostic marker genes in LUAD have not been explored in these studies. In this study, we aimed to identify and verify the prognostic marker genes associated with inflammation. Exploring reliable inflammatory-related prognostic biomarkers can help to advance theoretical research and clinical applications.
Currently, public databases, such as the Cancer Genome Atlas (TCGA, www.cancer.gov/tcga), provide excellent support for oncology research, not only to facilitate research into the molecular mechanisms of tumor development, but also to provide a basis for improved diagnosis and treatment.14–16 Screening for differentially expressed genes is helpful to identify new tumor markers. Enhancers are important elements in the regulation of gene expression. H3 lysine 27 acetylation (H3K27ac) activates enhancer and promotes gene transcription by enhancing promoter activity.17–19 Enhancers are highly conserved in tissues. Enhancer inactivation is associated with the development of multiple diseases, including cancer.20,21 Screening for differentially expressed genes regulated by enhancers can provide new perspectives to improve cancer diagnosis and treatment strategies.
In this study, we analyzed the relationship between inflammatory index and clinical features such as prognosis, and screened for enhancer-regulated inflammation-related genes. We further analyzed the relationship between these genes and prognosis of LUAD patients, and identified enhancer-regulated prognostic inflammation-related genes. Finally, the expression of enhancer-regulated prognostic inflammation-related genes, and the effect of these genes on cell proliferation was validated in LUAD cells. The aim of this study was to explore the prognostic inflammatory markers regulated by enhancers in LUAD.
Methods
Data Processing
The clinical information and RNA-seq data of 490 LUAD patients (dataset access number, TCGA-LUAD) were downloaded from TCGA database. The selection criteria were as follows: Patients with incomplete prognosis information were not enrolled; Included complete clinical information (including tumor stage, smoking status, age and sex). After screening, 458 patient samples were used for follow-up analysis. “Limma” package in R was applied for background correction and normalization of raw data.22 The RPKM values were used for the subsequent analysis.
Genomic Variation Analysis (GSVA)
Inflammatory index was calculated by GSVA algorithm with hallmark inflammatory response gene sets in the Molecular Signature Database v7.4 (MSigDB v7.4, http://software.broadinstitute.org/gsea/msigdb/index.jsp) as the reference gene sets.23 The “GSVA” package in R with GSVA method was applied in this study.
Mann–Whitney test was used to analyze the differences in inflammatory index between tumor vs normal, and smoking vs non-smoking groups. Kruskal–Wallis test was applied to assess the difference in inflammatory index among tumor stages. P<0.05 indicated a significant difference.
Analysis of Infiltrating Immune Cells Fraction
Estimation of the fraction of twenty-two infiltrating immune cells in high- and low-inflammatory index groups was applied using the Cell type Identification By Estimating Relative Subsets Of RNA Transcripts (CIBERSORT) web tool (https://cibersort.stanford.edu/) with LM22 (22 immune cell types) signature and 1000 permutations.24 Comparison of cell fraction between high- and low-inflammatory index groups were performed using Student’s t-test. P<0.05 indicated a significant difference.
Gene Set Enrichment Analysis (GSEA)
GSEA (http://software.broadinstitute.org/gsea/index.jsp) was used to analyze gene enrichment in inflammatory response-related and apoptosis pathways in high- and low-inflammatory index group.25 Gene sets of the MSigDB Hallmark collection were employed in this study. The nominal P<0.05, false discovery rate (FDR)<0.25 and normalized enrichment score (|NES|>1) indicated significant gene enrichment.
Identification of Differentially Expressed Genes and Enhancer-Regulated Genes
Differentially expressed genes in high-inflammatory index group compared with low-inflammatory index group were screened by “Limma” package in R. The cutoff values were FDR-corrected (Benjamini-Hochberg) P<0.01 and |log2 fold change (FC)|>1.
The H3K27ac ChIP-seq of A549 cells treated with TGFβ+TNFα and control A549 cells in GEO database (GSE42374) was analyzed. The “findPeaks” tool in HOMER algorithm was used to identify the H3K27ac enrichment regions. H3K27ac enriched regions were identified as enhancers. In ChIP-seq analysis, enhancers with more than 4-fold increase in H3K27ac enrichment in A549 cells treated with TGFβ+TNFα vs control A549 cells were identified as activated enhancers.
Survival Analysis
Overall survival analysis was carried out using Kaplan–Meier curves and Log rank test. To investigate the effect of inflammatory index on overall survival, a total of 458 LUAD patients from TCGA database were divided into high- and low-inflammatory index group based on to the median.
To investigate the effect of 146 upregulated genes regulated by enhancers on overall survival, patients with LUAD in TCGA were grouped into high- and low-expression group according to the quartiles.
Kaplan–Meier Plotter web tool (http://kmplot.com/analysis/) was used with default parameters to validate the effect of GDF10, HPGDS, ABCA8, SLIT3, ADAMTS8 and DNASE1L3 on overall survival, with patients were split by median.
Multivariate Cox proportional hazards analysis was performed using Kaplan–Meier Plotter web tool. Patients were split by “Auto select best cutoff”. Multivariate variables included “Stage”, “Gender”, “Smoking history” and “Selected gene”. FDR-corrected (Benjamini-Hochberg) P<0.05 was considered significant.
Cells
LUAD cell lines A549 and H1299 were obtained from American Type Culture Collection (ATCC, Manassas, VA, USA). A549 and H1299 cells were cultured in RPMI-1640 (Gibco, Grand Island, NY, USA) supplemented with 10% fetal bovine serum (Gibco), 1% penicillin (Gibco) and 1% streptomycin (Gibco) at 37°C, 5% CO2.
Cell Treatment
For TGFβ or TNFα treatment, A549 and H1299 cells were cultured with serum-free RPMI-1640 medium for 12 h, followed by stimulation with 5 ng/mL TGF‐β or 10 ng/mL TNFα for 24 h. For TGFβ or TNFα in combination with JQ1 treatment, cells were serum starved for 12 h, and then co-stimulated with 2 μM JQ1 and 5 ng/mL TGF-β or 10 ng/mL TNFα for 24 h.
Cell Transformation
The GDF10, HPGDS, ABCA8, SLIT3 and ADAMTS8 overexpression vectors were constructed using pcDNA3.1 plasmid (Addgene plasmid#128034; http://n2t.net/addgene:128034; RRID: Addgene_128034). The recombinant vectors and negative control vector (pcDNA3.1) were transfected into A549 and H1299 cells by Lipofectamine 3000 (Thermo Fischer Scientific, MA, USA) as the manufacturer's instruction.
RT-qPCR
Trizol reagent (Invitrogen, MD, USA) was applied for total RNA extraction. cDNA was obtained by reverse transcription using PrimeScript RT reagent kit (Takara, Dalian, China). RT-qPCR was performed by using SYBR Prime Script RT PCR kit (Takara). GAPDH was used as internal reference. 2−∆∆Ct method was applied for relative expression levels calculation. Primer sequences used in this study as follows: GDF10, forward: 5ʹ-GGACTTTGACGAGAAGACGATG-3ʹ, reverse: 5ʹ- TCTTAGGCATGGGGAACTCAC-3ʹ. HPGDS, forward: 5ʹ- ATGCGCCTCATCTTATGCAAG-3ʹ, reverse: 5ʹ- GGTTGTCTAACAGGTCAGGCT-3ʹ. ABCA8, forward: 5ʹ-TGAAATGGATGCCGATCCTTC-3ʹ, reverse: 5ʹ- AGTATTGCAGTGATTTGGCCTT-3ʹ. SLIT3, forward: 5ʹ-GTCAGCGTCATCGAGAGAGG-3ʹ, reverse: 5ʹ-TTCGGCGTGCTCTGGAAAAG-3ʹ. ADAMTS8, forward: 5ʹ-ACCAAGCGGTTTGTGTCTGAG-3ʹ, reverse: 5ʹ-AGAAGTTACGCAGTGTAAGCC-3ʹ. GAPDH, forward: 5ʹ-GGAGCGAGATCCCTCCAAAAT-3ʹ, reverse: 5ʹ-GGCTGTTGTCATACTTCTCATGG-3ʹ. Students’ t-test was applied to compare the differences between two groups. One way ANOVA of Tukey analysis was used for comparison of more than two groups. P<0.05 indicated a significant difference.
CCK-8
Cell Counting Kit-8 (CCK-8; Solarbio, Beijing, China) was used for cell proliferation analysis. A549 and H1299 cells were transfected and incubated for 48 h, then seeded into 96-well plates with 5×10³ cells/well. After the cells were cultured for 0, 1, 2 and 3 d, 10 μL of CCK8 regent was added into each well and incubated for 2 h at 37°C. Absorbance at 450 nm (OD450) was detected by a microplate reader (Thermo). One-way ANOVA of Tukey was used for multiple groups. P<0.05 represented significant difference.
Results
Relationship Between Inflammatory Index and Clinical Features in LUAD
The inflammatory index of 490 LUAD patients in TCGA database was calculated using GSVA algorithm. Patients were divided into high-inflammatory index group and low-inflammatory index group according to the median value. Kaplan–Meier curves were established to evaluate the effect of inflammation on prognosis. Overall survival of high-inflammatory index group was significantly higher than that of low-inflammatory index group (Figure 1A). It indicated that inflammatory index has important prognostic value for LUAD. The inflammatory index of LUAD tissue was significantly lower than that of normal tissue (Figure 1B). Additionally, inflammatory index of tumor stages showed a bimodal distribution (Figure 1C). Inflammation index decreased with stage increasing, whereas it was not statistically significant (Figure 1C). There was no significant difference in inflammatory index between smokers and non-smokers with LUAD (Figure 1D).
 |
Figure 1 Analysis of inflammatory index and clinical features in LUAD. (A) Patients were divided into high- and low-inflammatory index groups based on the median. Kaplan–Meier curves and Log rank test were used to analyze overall survival based on TCGA database. P<0.05 indicated a significant difference. (B) Analysis of the differences in inflammatory index between LUAD tissue and normal control tissue using Mann–Whitney test. P<0.05 indicated a significant difference. (C) Inflammatory indices for different stages of LUAD. Kruskal–Wallis test was carried out, with P<0.05. (D) Inflammatory indices for non-smoking and smoking LUAD patients. Mann–Whitney test was performed, with P<0.05. |
Inflammatory Index Was Associated with Immune Cell Infiltration, Inflammatory Signaling Pathways and Apoptosis in LUAD
To analyze the relationship between inflammation and cancer immunity, we analyzed the differences in immune cells infiltration in high- and low-inflammatory index groups using CIBERSORT online tool (https://cibersort.stanford.edu/). The infiltration of anti-cancer immune cells (CD8+T cells, CD4 memory activated T cells, activated NK cells, M1 macrophages, dendritic cells) as well as pro-cancer immune cell (M2 macrophages) was significantly elevated in high-inflammatory index group (Figure 2A).
 |
Figure 2 Relationship among inflammatory index, immune cell infiltration, inflammatory signaling pathways and apoptosis. (A) Cell fraction of infiltrating immune cells in high- and low-inflammatory index groups was analyzed using CIBERSORT (https://cibersort.stanford.edu/). Comparison of cell fraction was performed using Students’ t-test. *P<0.05, high-inflammatory index group vs low-inflammatory index group. (B–G) GSEA of “INFLAMMATORY_RESPONSE” (B), “APOPTOSIS” (C), “TNFA_SIGNALING_VIA_NFKB” (D), “ TGF_BETA_SIGNALING” (E), “ INTERFERON_GAMMA_RESPONSE” (F) and “ INTERFERON_ALPHA_RESPONSE” (G) in LUAD based on TCGA database. P<0.05 indicated significant. |
GSEA analysis was performed on inflammation-related signaling pathways and apoptosis pathway to compare the expression of genes in these pathways in high- and low-inflammatory index groups. The results showed that the genes in “INFLAMMATORY_RESPONSE” and “APOPTOSIS” pathways were strongly enriched in high-inflammatory index group (Figure 2B–C). However, genes in “INFLAMMATORY_RESPONSE” and “APOPTOSIS” pathways were negatively correlated with low inflammatory index (Figure 2B–C).
To screen out inflammatory signaling pathways associated with inflammatory index, all inflammation-related gene sets in MSigDB Hallmark set were analyzed, and the significant gene sets were screened out. A total of four signaling pathways, “TNFA_SIGNALING_VIA_NFKB”, “TGF_BETA_SIGNALING”, “INTERFERON_GAMMA_RESPONSE” and “INTERFERON_ALPHA_RESPONSE”, were significantly enriched in the high-inflammatory index group (Figure 2D–G).
Screening for Inflammation-Related Genes Regulated by Enhancers
Differentially expressed genes in high- and low-inflammatory index groups were analyzed based on TCGA database. As shown in the volcano diagram, a total of 396 upregulated genes and 151 downregulated genes were identified (Figure 3A). The top five up-regulated genes and the top five down-regulated genes were shown in the heatmap (Figure 3B).
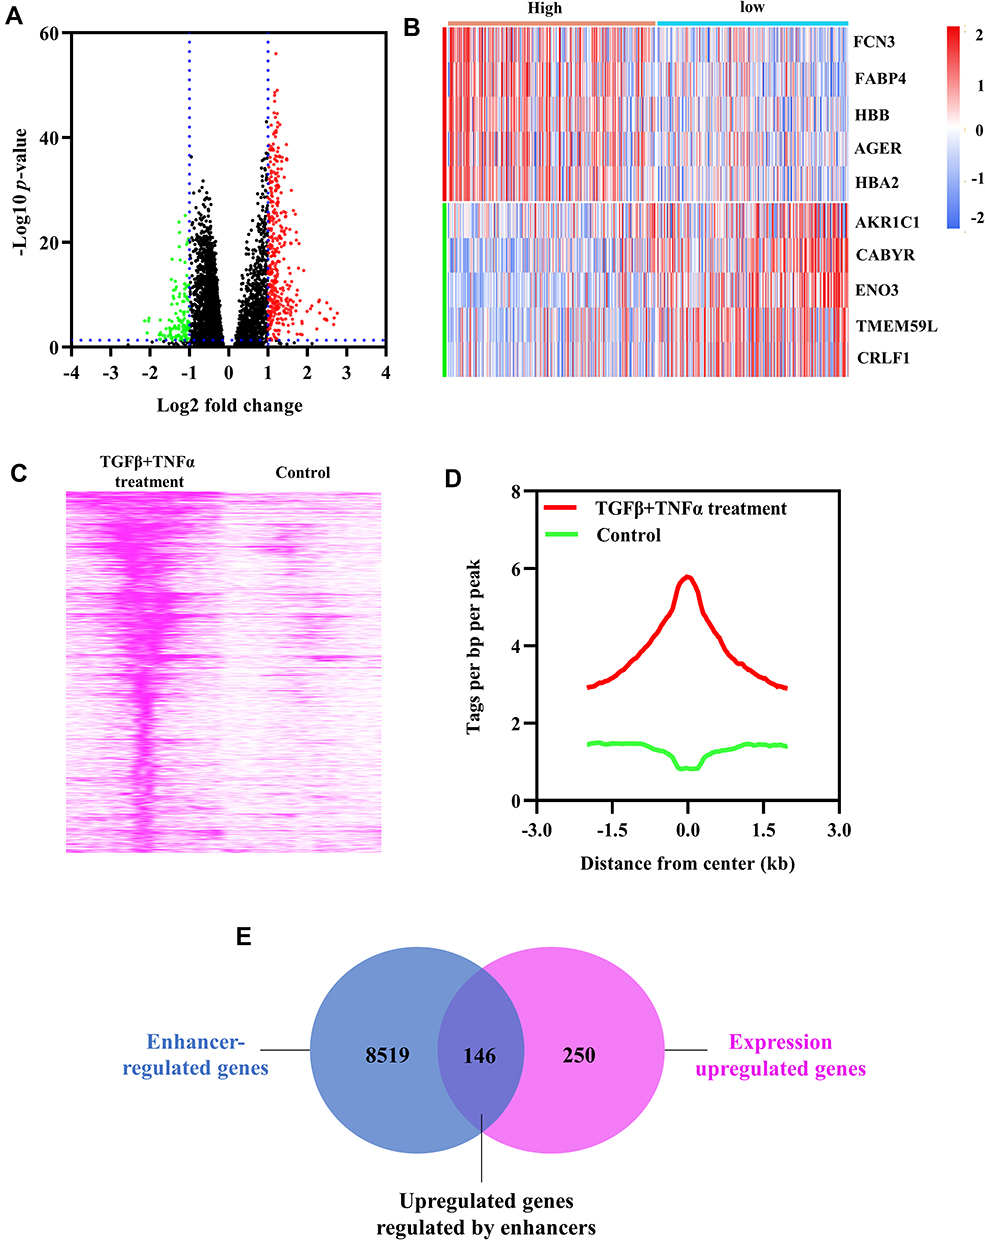 |
Figure 3 Identification of inflammation-related genes regulated by enhancers. (A) Volcano diagram of differentially expressed genes in high- vs low-inflammatory index groups. (B) Heatmap of the top 5 upregulated and downregulated genes. (C and D) Genome-wide H3K27ac peaks enrichment around H3K27ac peaks center (±3 kb) in A549 cells treated with or without TGFβ+TNFα using GSE42374. More than 4-fold increase in H3K27ac signal in A549 cells treated with TGFβ+TNFα vs A549 cells treated without TGFβ+TNFα were defined as activated H3K27ac peaks. (E) The intersection of enhancer-regulated genes and expression upregulated genes. |
We analyzed the genome-wide difference in H3K27ac peaks enrichment between A549 cells treated with/without TGFβ+TNFα. TGFβ+TNFα treatment increased the enrichment of 17,495 H3K27ac peaks in A549 cells (Figure 3C–D). In the ChIP-seq analysis, genes with more than 4-fold increase of H3K27ac enrichment were identified as enhancer-regulated genes. A total of 8665 enhancer-regulated genes were identified. The intersection of enhancer-regulated genes and expression upregulated genes was taken, and 146 upregulated genes regulated by enhancers were obtained (Figure 3E). These 146 candidate genes were used for subsequent analysis.
Identification of Inflammation-Related Genes Affecting Prognosis
The relationship between the 146 candidate genes expression and prognosis of LUAD patients in TCGA database was analyzed. The expression of a total of 6 genes, including GDF10, HPGDS, ABCA8, SLIT3, ADAMTS8 and DNASE1L3, had a significant effect on prognosis, and all of these genes showed satisfactory prognosis in patients with high expression (Figure 4). The prognostic impact of the 6 genes expression was further validated using the Kaplan–Meier Plotter web tool. Patients with high expression of GDF10, HPGDS, ABCA8, SLIT3 (also known as MEGF5) and ADAMTS8 have a better prognosis (Figure 5A–E), which was consistent with the results of TCGA database analysis. However, inconsistent with the results of TCGA database analysis, DNASE1L3 expression had no significant effect on prognosis (Figure 5F).
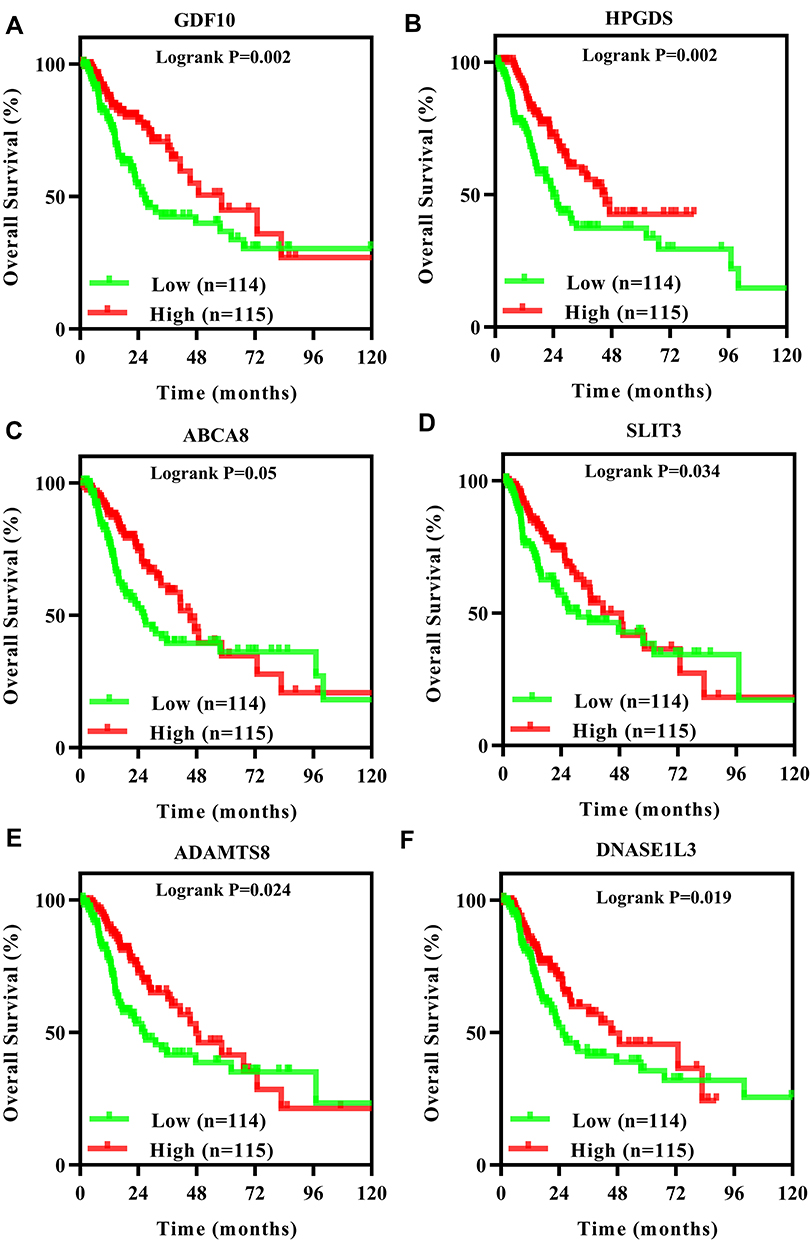 |
Figure 4 Overall survival analysis of GDF10 (A), HPGDS (B), ABCA8 (C), SLIT3 (D), ADAMTS8 (E) and DNASE1L3 (F) expression in LUAD patients in TCGA database. Kaplan–Meier methods and Log rank test were performed. Log-rank P<0.05 indicated a significant difference. |
 |
Figure 5 Overall survival curves based on GDF10 (A), HPGDS (B), ABCA8 (C), SLIT3 (D), ADAMTS8 (E) and DNASE1L3 (F) expression in patients with LUAD using Kaplan–Meier Plotter online tool. Log-rank P<0.05 indicated a significant difference. |
Multifactorial COX regression analysis was performed using the LUAD patients died as the dependent variable, and tumor stage, gender, smoking history, GDF10, HPGDS, ABCA8, SLIT3 and ADAMTS8 expression as the independent variables. The results showed that GDF10, HPGDS, ABCA8, SLIT3 and ADAMTS8 expression were independent risk factors affecting the prognosis of LUAD patients (Supplementary Table 1–5).
Determination of Prognostic Inflammation-Related Genes Regulated by Enhancer
We analyzed the H3K27ac peaks of GDF10, HPGDS, ABCA8, SLIT3 and ADAMTS8 in A549 cells treated with or without TGFβ+TNFα based on GSE42374 dataset. Strong H3K27ac peak signal was observed at GDF10, HPGDS, ABCA8, SLIT3 and ADAMTS8 in A549 cells treated with TGFβ+TNFα compared with control group (without TGFβ+TNFα treatment) (Figure 6A–E). Therefore, GDF10, HPGDS, ABCA8, SLIT3 and ADAMTS8 were identified as prognostic inflammation-related genes regulated by enhancers.
 |
Figure 6 Signal tracks for H3K27ac of GDF10 (A), HPGDS (B), ABCA8 (C), SLIT3 (D) and ADAMTS8 (E) in A549 cells treated with or without TGFβ+TNFα. |
Validation of the Effect of TGFβ and TNFα on the Expression of Enhancer-Regulated Prognostic Inflammation-Related Genes in LUAD Cells
To confirm whether GDF10, HPGDS, ABCA8, SLIT3 and ADAMTS8 expression were influenced by TGFβ and TNFα, A549 and H1299 cells were treated with TNFα or TGFβ. RT-qPCR revealed that TNFα treatment significantly increased the expression of GDF10, HPGDS, ABCA8, SLIT3 and ADAMTS8 in A549 and H1299 cells (Figure 7A–B). However, the change in GDF10, HPGDS, ABCA8, SLIT3 and ADAMTS8 expression in A549 and H1299 cells after TGFβ treatment was not significant (Figure 7A–B). To demonstrate that the expression of these genes is regulated by enhancers, cells were treated with the enhancer inhibitor JQ1 in combination with TNFα or TGFβ. As expected, JQ1 treatment restored the TNFα-induced upregulation of GDF10, HPGDS, ABCA8, SLIT3 and ADAMTS8 expression in A549 and H1299 cells (Figure 7C–D).
 |
Figure 7 Effect of TGFβ and TNFα treatment on the expression of enhancer-regulated prognostic inflammation-related genes. (A and B) A549 (A) and H1299 (B) cells were treated with 10 ng/mL TNFα or 5 ng/mL TGFβ. (C and D) A549 (C) and H1299 (D) cells were treated with 2 μM JQ1 combined with 10 ng/mL TNFα or 5 ng/mL TGFβ. The relative expression levels of GDF10, HPGDS, ABCA8, SLIT3 and ADAMTS8 were detected by RT-qPCR. *P<0.05, **P<0.01. One way ANOVA of Tukey analysis was used for comparison of more than two groups. P<0.05 indicated a significant difference. |
Prognostic Inflammation-Related Genes Regulated by Enhancers Inhibited the Proliferation of LUAD Cells
To further explore whether the enhancer-regulated prognostic inflammation-related genes affect cell proliferation, GDF10, HPGDS, ABCA8, SLIT3 and ADAMTS8 were overexpressed in A549 and H1299 cells, respectively. RT-qPCR was used to assess the overexpression efficiency (Figure 8A–B). CCK-8 assay suggested that overexpression of GDF10, HPGDS, ABCA8, SLIT3 and ADAMTS8 obviously inhibited cell proliferation (Figure 8C–D).
 |
Figure 8 Overexpression of enhancer-regulated prognostic inflammation-related genes inhibited cell proliferation. (A and B) RT-qPCR was used for GDF10, HPGDS, ABCA8, SLIT3 and ADAMTS8 overexpression validation in A549 (A) and H1299 (B) cells. Students’ t-test was applied to compare the differences between two groups. (C and D) CCK8 was performed to measure cell proliferation after GDF10, HPGDS, ABCA8, SLIT3 and ADAMTS8 overexpression. OE, overexpression. One way ANOVA of Tukey analysis was used to compare different groups. *P<0.05, **P<0.01. P<0.05 indicated a significant difference. |
Discussion
Studies have shown that inflammation is related to tumor development.7,26 Inflammation is usually assessed pathologically by hematoxylin and eosin staining (H&E) or immunohistochemistry (IHC) for the number of infiltrating mononuclear cells.27 However, the composition of tumor inflammatory microenvironment is complex, while these approaches (such as HE and IHC) do not provide a more comprehensive understanding of the relationship between inflammation and tumor progression. GSVA is a gene set enrichment method that estimates changes in pathway activity across samples in an unsupervised manner.23 GSVA method based on the hallmark inflammatory response gene sets and combined with a large sample size is beneficial to understand the relationship between inflammatory response and progression of LUAD in a more macroscopic way. Here, we calculated the inflammatory index of 490 LUAD patients in TCGA database by GSVA method, and examined the association between the level of inflammation with cancer aggressiveness and survival. Our findings suggested that high level of inflammation was associated with better outcome in LUAD patients, which were consistent with previous studies.10,11,13 We also found that the inflammation index tended to decrease with the increase of tumor stage, but it was not statistically significant. This phenomenon may be related to the dynamics and complexity of tumor inflammatory microenvironment. Although studies have shown that smoking is strongly associated with inflammatory responses in lung cancer.28 Our study did not find a relationship between inflammatory index and smoking status due to the complexity of the relationship between smoking and LUAD.
Immunity and inflammation are constituted essential features of tumor microenvironment. Our research found that the infiltration of anti-cancer immune cells (CD8+T cells, CD4 memory activated T cells, activated NK cells, M1 macrophages, dendritic cells) as well as pro-cancer immune cell (M2 macrophages) was significantly elevated in high-inflammatory index group. Tumor-infiltrating immune cells act as a “double-edged sword” for lung cancer development. On one hand, they attack and kill lung cancer cells to inhibit tumor progression. On the other hand, they screen for tumor cells that are better suited to survive in an immunologically active host or alter the tumor microenvironment, and are “assimilated” by lung cancer cells, ultimately promoting tumor progression.29 Complex molecular communication networks exist between key components of the inflammatory microenvironment and tumor cells.7 Our results showed that LUAD with high inflammatory index enriched not only anti-cancerous immune pathway such as IFN-α, IFN-γ response and apoptosis, but also pro-cancerous pathways such as TGF-β or TNF-α signaling.
The predictive role of gene expression patterns in LUAD on risk and prognosis has been reported in previous studies.30,31 However, global expression patterns based on inflammation-related genes have not been established in LUAD. Enhancers in cancer cells promote the transcriptional expression of oncogenes by interacting with promoters leading to tumorigenesis. Enhancer activity can influence the expression of oncogenes.32 Studies have demonstrated that the inflammatory factor TNF-α and TGF-β can cause abnormal activation of enhancers by activating the NF-κB signaling pathway in tumor cells.33,34 In the present study, 396 upregulated genes were identified, 146 of which were accompanied by upregulation of enhancer activity. Kaplan–Meier and multifactorial Cox regression analysis combined with ChIP analysis of H3K27ac peaks in A549 cells treated with/without TGFβ+TNFα suggested that GDF10, HPGDS, ABCA8, SLIT3 and ADAMTS8 were independent prognostic inflammation-related genes regulated by enhancers.
Growth differentiation factor 10 (GDF10), also known as BMP3B, usually functions as an oncogene, eg, GDF10 inhibits proliferation and EMT in breast cancer; GDF10 deficiency promotes chemoresistance and EMT in oral squamous carcinoma; GDF10 silencing promotes the development of lung cancer.35–37 However, the relationship between GDF10 and inflammatory response, and its oncogenic mechanisms in LUAD remains unclear. Studies have shown that hematopoietic prostaglandin D synthase (HPGDS) and slit guidance ligand 3 (SLIT3) suppress cell invasion and induce apoptosis in lung cancer.38 However, the relationship between these two genes and inflammation in LUAD is unclear. Liu et al found that ATP binding cassette subfamily A member 8 (ABCA8) inhibits the proliferation and metastasis of hepatocellular carcinoma.39 In addition, ABCA8 inhibits progression of prostate cancer, but promotes the progression of stomach adenocarcinoma.40,41 We have not found any studies on the regulation of LUAD progression or inflammation by ABCA8. Previous studies have shown that ADAM metallopeptidase with thrombospondin type 1 motif 8 (ADAMTS8) was downregulated in non-small cell lung cancer, which is consistent with our results.42,43 However, the relationship between ADAMTS8 and inflammation in LUAD is unclear. In the present study, we verified the regulation of TNFα and enhancers on the expression of GDF10, HPGDS, ABCA8, SLIT3 and ADAMTS8 at cellular level, and further validated that the inhibitory effect of these genes on the proliferation of LUAD cells.
Conclusion
In conclusion, by screening for inflammation-related genes and enhancer-regulated genes, 146 enhancer-regulated inflammation-related genes were obtained. Further prognostic analysis of these genes identified 5 prognostic inflammatory markers regulated by enhancers, including GDF10, HPGDS, ABCA8, SLIT3 and ADAMTS8. Finally, we demonstrated that GDF10, HPGDS, ABCA8, SLIT3 and ADAMTS8 expression were regulated by TNFα and enhancers, and the expression of these genes inhibited proliferation of LUAD cells. More detailed roles and regulatory mechanisms of GDF10, HPGDS, ABCA8, SLIT3 and ADAMTS8 in LUAD will be investigated in the future study.
Data Sharing Statement
All data were included in the article and detailed enquiries can be made by contacting the corresponding author.
Funding
This study was supported by The Beijing CSCO-Hengrui Oncology Research Foundation (Y-HR2018-119).
Disclosure
The authors declared that they have no conflicts of interest to this work.
References
1. Bray F, Ferlay J, Soerjomataram I, Siegel RL, Torre LA, Jemal A. Global cancer statistics 2018: GLOBOCAN estimates of incidence and mortality worldwide for 36 cancers in 185 countries. CA Cancer J Clin. 2018;68(6):394–424. doi:10.3322/caac.21492
2. Travis WD, Brambilla E, Nicholson AG, et al. The 2015 world health organization classification of lung tumors: impact of genetic, clinical and radiologic advances since the 2004 classification. J Thorac Oncol. 2015;10(9):1243–1260. doi:10.1097/JTO.0000000000000630
3. Siegel RL, Miller KD, Jemal A. Cancer statistics, 2015. CA Cancer J Clin. 2015;65(1):5–29. doi:10.3322/caac.21254
4. Mantovani A, Allavena P, Sica A, Balkwill F. Cancer-related inflammation. Nature. 2008;454(7203):436–444. doi:10.1038/nature07205
5. Shoji F, Kozuma Y, Toyokawa G, Yamazaki K, Takeo S. Complete blood cell count-derived inflammatory biomarkers in early-stage non-small-cell lung cancer. Ann Thorac Cardiovasc Surg. 2020;26(5):248–255. doi:10.5761/atcs.oa.19-00315
6. Taniguchi K, Karin M. NF-kappaB, inflammation, immunity and cancer: coming of age. Nat Rev Immunol. 2018;18(5):309–324.
7. Oshi M, Newman S, Tokumaru Y, et al. Inflammation is associated with worse outcome in the whole cohort but with better outcome in triple-negative subtype of breast cancer patients. J Immunol Res. 2020;2020:5618786. doi:10.1155/2020/5618786
8. Caraglia M, Dicitore A, Marra M, et al. Type I interferons: ancient peptides with still under-discovered anti-cancer properties. Protein Pept Lett. 2013;20(4):412–423.
9. Batlle E, Massague J. Transforming growth factor-beta signaling in immunity and cancer. Immunity. 2019;50(4):924–940. doi:10.1016/j.immuni.2019.03.024
10. Tomita M, Ayabe T, Nakamura K. The advanced lung cancer inflammation index is an independent prognostic factor after surgical resection in patients with non-small-cell lung cancer. Interact Cardiovasc Thorac Surg. 2018;26(2):288–292. doi:10.1093/icvts/ivx329
11. Kobayashi S, Karube Y, Inoue T, et al. Advanced lung cancer inflammation index predicts outcomes of patients with pathological stage IA lung adenocarcinoma following surgical resection. Ann Thorac Cardiovasc Surg. 2019;25(2):87–94. doi:10.5761/atcs.oa.18-00158
12. Hu Z, Wu W, Zhang X, et al. Advanced lung cancer inflammation index is a prognostic factor of patients with small-cell lung cancer following surgical resection. Cancer Manag Res. 2021;13:2047–2055. doi:10.2147/CMAR.S295952
13. Bacha S, Sghaier A, Habibech S, et al. Advanced lung cancer inflammation index: a prognostic score in patients with metastatic non-small cell lung cancer. Tunis Med. 2017;95(11):976–981.
14. Tomczak K, Czerwinska P, Wiznerowicz M. The Cancer Genome Atlas (TCGA): an immeasurable source of knowledge. Contemp Oncol. 2015;19(1A):A68–77.
15. Weinstein JN, Collisson EA, Mills GB, et al.; Cancer Genome Atlas Research, N. The cancer genome atlas pan-cancer analysis project. Nat Genet. 2013;45(10):1113–1120. doi:10.1038/ng.2764
16. Liu J, Li R, Liao X, Hu B, Yu J. Comprehensive investigation of the clinical significance and molecular mechanisms of plasmacytoma variant translocation 1 in sarcoma using genome-wide RNA sequencing data. J Cancer. 2019;10(20):4961–4977. doi:10.7150/jca.31675
17. Xie L, Song X, Lin H, et al. Aberrant activation of CYR61 enhancers in colorectal cancer development. J Exp Clin Cancer Res. 2019;38(1):213. doi:10.1186/s13046-019-1217-9
18. Spitz F, Furlong EE. Transcription factors: from enhancer binding to developmental control. Nat Rev Genet. 2012;13(9):613–626. doi:10.1038/nrg3207
19. Calo E, Wysocka J. Modification of enhancer chromatin: what, how, and why? Mol Cell. 2013;49(5):825–837. doi:10.1016/j.molcel.2013.01.038
20. Sur I, Taipale J. The role of enhancers in cancer. Nat Rev Cancer. 2016;16(8):483–493. doi:10.1038/nrc.2016.62
21. Herz HM. Enhancer deregulation in cancer and other diseases. Bioessays. 2016;38(10):1003–1015. doi:10.1002/bies.201600106
22. Ritchie ME, Phipson B, Wu D, et al. limma powers differential expression analyses for RNA-sequencing and microarray studies. Nucleic Acids Res. 2015;43(7):e47.
23. Hanzelmann S, Castelo R, Guinney J. GSVA: gene set variation analysis for microarray and RNA-seq data. BMC Bioinform. 2013;14(1):7. doi:10.1186/1471-2105-14-7
24. Newman AM, Liu CL, Green MR, et al. Robust enumeration of cell subsets from tissue expression profiles. Nat Methods. 2015;12(5):453–457. doi:10.1038/nmeth.3337
25. Subramanian A, Tamayo P, Mootha VK, et al. Gene set enrichment analysis: a knowledge-based approach for interpreting genome-wide expression profiles. Proc Natl Acad Sci USA. 2005;102(43):15545–15550. doi:10.1073/pnas.0506580102
26. Diakos CI, Charles KA, McMillan DC, Clarke SJ. Cancer-related inflammation and treatment effectiveness. Lancet Oncol. 2014;15(11):e493–e503. doi:10.1016/S1470-2045(14)70263-3
27. Salgado R, Denkert C, Demaria S, et al. The evaluation of tumor-infiltrating lymphocytes (TILs) in breast cancer: recommendations by an international TILs working group 2014. Ann Oncol. 2015;26(2):259–271. doi:10.1093/annonc/mdu450
28. Gomez-Larrauri A, Ouro A, Trueba M, Gomez-Munoz A. Regulation of cell growth, survival and migration by ceramide 1-phosphate - implications in lung cancer progression and inflammation. Cell Signal. 2021;83:109980. doi:10.1016/j.cellsig.2021.109980
29. Merlo A, Dalla Santa S, Dolcetti R, Zanovello P, Rosato A. Reverse immunoediting: when immunity is edited by antigen. Immunol Lett. 2016;175:16–20.
30. Li B, Cui Y, Diehn M, Li R. Development and validation of an individualized immune prognostic signature in early-stage nonsquamous non-small cell lung cancer. JAMA Oncol. 2017;3(11):1529–1537. doi:10.1001/jamaoncol.2017.1609
31. Ma Q, Xu Y, Liao H, et al. Identification and validation of key genes associated with non-small-cell lung cancer. J Cell Physiol. 2019;234(12):22742–22752. doi:10.1002/jcp.28839
32. Jia Q, Chen S, Tan Y, Li Y, Tang F. Oncogenic super-enhancer formation in tumorigenesis and its molecular mechanisms. Exp Mol Med. 2020;52(5):713–723. doi:10.1038/s12276-020-0428-7
33. Loh C, Park SH, Lee A, Yuan R, Ivashkiv LB, Kalliolias GD. TNF-induced inflammatory genes escape repression in fibroblast-like synoviocytes: transcriptomic and epigenomic analysis. Ann Rheum Dis. 2019;78(9):1205–1214. doi:10.1136/annrheumdis-2018-214783
34. Cieslik M, Hoang SA, Baranova N, et al. Epigenetic coordination of signaling pathways during the epithelial-mesenchymal transition. Epigenetics Chromatin. 2013;6(1):28. doi:10.1186/1756-8935-6-28
35. Zhou T, Yu L, Huang J, et al. GDF10 inhibits proliferation and epithelial-mesenchymal transition in triple-negative breast cancer via upregulation of Smad7. Aging. 2019;11(10):3298–3314. doi:10.18632/aging.101983
36. Cheng CW, Hsiao JR, Fan CC, et al. Loss of GDF10/BMP3b as a prognostic marker collaborates with TGFBR3 to enhance chemotherapy resistance and epithelial-mesenchymal transition in oral squamous cell carcinoma. Mol Carcinog. 2016;55(5):499–513. doi:10.1002/mc.22297
37. Dai Z, Popkie AP, Zhu WG, et al. Bone morphogenetic protein 3B silencing in non-small-cell lung cancer. Oncogene. 2004;23(20):3521–3529. doi:10.1038/sj.onc.1207441
38. Wang JJ, Mak OT. Induction of apoptosis in non-small cell lung carcinoma A549 cells by PGD(2) metabolite, 15d-PGJ(2). Cell Biol Int. 2011;35(11):1089–1096. doi:10.1042/CBI20100707
39. Cui Y, Liang S, Zhang S, et al. ABCA8 is regulated by miR-374b-5p and inhibits proliferation and metastasis of hepatocellular carcinoma through the ERK/ZEB1 pathway. J Exp Clin Cancer Res. 2020;39(1):90. doi:10.1186/s13046-020-01591-1
40. Guo Y, Wang ZW, Su WH, Chen J, Wang YL. Prognostic value and immune infiltrates of ABCA8 and FABP4 in stomach adenocarcinoma. Biomed Res Int. 2020;2020:4145164. doi:10.1155/2020/4145164
41. Demidenko R, Razanauskas D, Daniunaite K, Lazutka JR, Jankevicius F, Jarmalaite S. Frequent down-regulation of ABC transporter genes in prostate cancer. BMC Cancer. 2015;15(1):683. doi:10.1186/s12885-015-1689-8
42. Dunn JR, Panutsopulos D, Shaw MW, et al. METH-2 silencing and promoter hypermethylation in NSCLC. Br J Cancer. 2004;91(6):1149–1154. doi:10.1038/sj.bjc.6602107
43. Zhang Y, He RQ, Dang YW, et al. Comprehensive analysis of the long noncoding RNA HOXA11-AS gene interaction regulatory network in NSCLC cells. Cancer Cell Int. 2016;16(1):89. doi:10.1186/s12935-016-0366-6
 © 2021 The Author(s). This work is published and licensed by Dove Medical Press Limited. The
full terms of this license are available at https://www.dovepress.com/terms
and incorporate the Creative Commons Attribution
- Non Commercial (unported, 3.0) License.
By accessing the work you hereby accept the Terms. Non-commercial uses of the work are permitted
without any further permission from Dove Medical Press Limited, provided the work is properly
attributed. For permission for commercial use of this work, please see paragraphs 4.2 and 5 of our Terms.
© 2021 The Author(s). This work is published and licensed by Dove Medical Press Limited. The
full terms of this license are available at https://www.dovepress.com/terms
and incorporate the Creative Commons Attribution
- Non Commercial (unported, 3.0) License.
By accessing the work you hereby accept the Terms. Non-commercial uses of the work are permitted
without any further permission from Dove Medical Press Limited, provided the work is properly
attributed. For permission for commercial use of this work, please see paragraphs 4.2 and 5 of our Terms.