Back to Journals » International Journal of General Medicine » Volume 14
Comprehensive Analysis of the Prognostic Value and Immune Function of Immune Checkpoints in Stomach Adenocarcinoma
Received 3 July 2021
Accepted for publication 7 September 2021
Published 17 September 2021 Volume 2021:14 Pages 5807—5824
DOI https://doi.org/10.2147/IJGM.S325467
Checked for plagiarism Yes
Review by Single anonymous peer review
Peer reviewer comments 3
Editor who approved publication: Dr Scott Fraser
Kai Shen, Tong Liu
Department of General Surgery, Beijing Tongren Hospital, Capital Medical University, Beijing, People’s Republic of China
Correspondence: Tong Liu
Department of General Surgery, Beijing Tongren Hospital, Capital Medical University, Beijing, People’s Republic of China
Email [email protected]
Background: Stomach adenocarcinoma (STAD) is one of the most prevalent malignances and ranks fifth in incidence and third in the cancer-related deaths among all malignances. The prognosis of STAD is poor. Immunotherapy based on immune checkpoint blockade is ever-increasingly suggested as the most promising therapy strategy for STAD. However, the prognosis and therapy value of immune checkpoints in STAD is far from clarified.
Methods: In our study, bioinformatics methods were performed to explore the expression and prognosis value of immune checkpoints in STAD and their association with immune infiltration. qRT-PCR was performed to verify our result.
Results: Most of the immune checkpoints were upregulated in STAD. There were lots of genetic mutations among immune checkpoints in STAD, including missense_mutation, frame_shift_del et al. Interestingly, most of immune checkpoints were associated with drug sensitivity and drug resistance. Moreover, CD274, PVR, LGALS9, ICOSLG and CD70 were associated with the overall survival, post progression survival and first progression in STAD. The univariate and multivariate analysis revealed that CD70, ICOSLG, age, pTNM stage, and radiation therapy were independent factors affecting the prognosis of STAD patients. The expression of ICOSLG and CD70 was correlated with immune cells as well as immune biomarkers, including CD8+ T cells, CD4+ T cells, macrophage, neutrophils and dendritic cells.
Conclusion: All in all, our study performed a comprehensive analysis of the prognostic value and immune function of immune checkpoints in STAD, and our result suggested that immune checkpoint ICOSLG and CD70 serve as prognostic biomarkers and associate with immune infiltration in STAD.
Keywords: stomach adenocarcinoma, bioinformatics analysis, cancer immunotherapy, immune checkpoint
Introduction
Stomach adenocarcinoma (STAD) is one of the most prevalent malignances and ranks fifth in incidence and third in the cancer-related deaths among all malignances.1,2 Every year, approximately 951,600 initially diagnosed patients and approximately 723,100 STAD-related globally.2,3 Though some risk factors for STAD have been established, the molecular mechanism of the occurrence and progression of STAD is still far from clear.4 Moreover, the therapeutic measures for STAD are limited and the prognosis for STAD patients are poor, with the overall survival rate of STAD patients in advanced stage of only approximately 12 months.5 These alarming data suggested the urgent need of new prognostic biomarkers and therapeutic targets for STAD patients.
Immunotherapy based on immune checkpoint blockade is ever-increasingly suggested as the most promising therapies for STAD in addition to operative treatment, especially for patients with advanced STAD.6 Until now, various studies have been performed to identify immune checkpoints on a functional level. And many immune checkpoints have been established, including but not limited to PD-L1 (CD274), PD-L2 (PDCD1LG2), CD80, CD86, VTCN1, HHLA2, TNFRSF14, PVR, CD200, LGALS9, ICOSLG, TNFSF9, TNFSF4, CD70, TNFSF18, and CD48.7–9 Previous studies revealed that immune checkpoint PD-L1 and PD-L2 served as the therapeutic targets in many cancers.10,11 Moreover, some of these immune checkpoints served as the therapeutic targets in many cancers, including pancreatic cancer and breast cancer.9,12 Among these immune checkpoints, how many could serve as prognostic biomarkers and immunotherapy targets of STAD were still far from clarified, nevertheless.
In recent years, genomic research has become one of the most reliable means to accelerate the clinical and translational research and treatment of cancer. Accumulating studies have shown that immune checkpoints are closely associated with the immune infiltration, therapeutic effect and the prognosis of many tumor patients.9 Moreover, immune checkpoints can even be used as tumor biomarkers to predict the prognosis of cancer patients and guide the immunotherapy of cancer patients.9 Therefore, this study aims to clarify the expression and prognosis of immune checkpoints in STAD and its relationship with immune infiltration, and to propose more suitable strategies to improve the anti-immune performance of STAD by using high-throughput sequencing database.
Materials and Methods
TCGA and Oncomine
To analyze the clinical significance of immune checkpoints in STAD, gene expression profile for STAD patients were downloaded from the Cancer Genome Atlas (TCGA) database (https://cancergenome.nih.gov/) and Oncomine (https://www.oncomine.org/). In TCGA, TCGA STAD dataset (n=415) were isolated for analysis and corresponding clinical information including gender, tumor grade and survival status of these STAD patients were also downloaded and arranged.
Gene Expression Analysis
The gene expression of immune checkpoints was analyzed using Oncomine and TCGA STAD dataset (n=415). In oncomine, Student’s T-test was performed to compare the gene expression of immune checkpoints between normal tissues and STAD tissue with a p-value threshold of 0.05, a fold-change of 2. In TCGA, Student’s T-test was performed to compare the gene expression of immune checkpoints between normal tissues and STAD tissue. And Kruskal–Wallis test was used to analyze the gene expression of immune checkpoints in normal tissues and different group of STAD tissues. Statistical analyses were performed using R software v4.0.3 (R Foundation for Statistical Computing, Vienna, Austria). P-value of <0.05 was considered statistically significant.
Genetic Mutation Analysis
After downloaded the genetic mutation data, transcriptome data, and clinical data from the TCGA database, we analyzed and visualized mutation data using the “maftools” package in R software. Horizontal histogram showed the genes have the higher mutation frequency in STAD patients.
Drug Sensitivity Analysis
To analyze the correlation of gene expression of immune checkpoints and drug sensitivity, we collected 265 small molecules from Genomics of Drug Sensitivity in Cancer (GDSC). We downloaded the area under the dose–response curve (AUC) values for drugs and gene expression profiles for all cancer cell lines. The Pearson correlation coefficients of transcript levels and AUCs were normalized using Fisher<80><99>s Z transformation. A Bonferroni-corrected, two-tailed distribution with family-wise error rate less than 0.025 in each tail for z-scored. Pearson correlation coefficients of annotated drug-target pairs were compared to the same number of correlation pairs generated by randomly sampling correlations.
Enrichment Analysis of Immune Checkpoints
The functional annotation of immune checkpoints was analyzed with Gene Ontology (GO) analysis (biological processes (BP), molecular functions (MF), and cellular components (CC)) and Kyoto Encyclopedia of Genes and Genomes (KEGG) pathway. GO and KEGG pathway analyses were performed using DAVID and the results were visualized using R software v4.0.3. The P-value was set as 0.05. GO and KEGG pathway analysis were performed using all these immune checkpoints.
Survival Analysis
The high/low expression group of STAD was distinguished with the medium expression of immune checkpoints. The Kaplan–Meier survival analysis with Log rank test were applied to analyze the survival difference between above two groups. For Kaplan–Meier curves, p-values and hazard ratio (HR) with 95% confidence interval (CI) were generated by Log rank tests. All analytical methods above and R packages were performed using R software version v4.0.3 (The R Foundation for Statistical Computing, 2020). Moreover, univariate and multivariate cox regression analysis was performed to identify the proper terms to build the nomogram. The forest was used to show the P value, HR and 95% CI of each variable through “forestplot” R package. A nomogram was developed based on the results of multivariate Cox proportional hazards analysis to predict the X-year overall recurrence. The nomogram provided a graphical representation of the factors, which can be used to calculate the risk of recurrence for an individual patient by the points associated with each risk factor through ‘rms’ R package. p < 0.05 was considered as statistically significant.
qRT-PCR
Approved by the Ethics Committee of Beijing Tongren Hospital, we obtained 52 STAD tissues and normal gastric tissues from the patients obtained informed consent. Based on the 2010 American Joint Committee on Cancer (AJCC) staging system, three experienced pathologists evaluated histological diagnosis and tumor grade. TRIzol reagent (Invitrogen) was utilized in the isolation of total RNA of clinical tissues. Following the manufacturer´s instructions, cDNA was synthesized using PrimeScript RT-polymerase (Vazyme). This was followed by the performance of RT-qPCR with SYBR-Green Premix (Qiagen GmbH) using Glyceraldehyde-3-phosphate dehydrogenase (GAPDH) as an internal control. Supplementary Table 1 showed the primers of GAPDH and target genes. The expression of target genes was calculated with the 2−ΔΔCt method.
Immune Infiltration
The correlation between gene expression of immune checkpoints and the abundances of six immune infiltrates (B cells, CD4+ T cells, CD8+ T cells, Neutrophils, Macrophages, and Dendritic cells) are estimated by TIMER algorithm. Moreover, “SCNA” module of TIMER 2.0 (http://timer.cistrome.org/) provides the comparison of tumor infiltration levels among tumors with different somatic copy number alterations for immune checkpoints using Two-sided Wilcoxon rank-sum test. Spearman correlation analysis was performed to analyze the gene expression of immune checkpoints and the expression of immune biomarkers. A p-value of less than 0.05 was considered statistically significant.
Results
Defining Immune Checkpoints in STAD and Normal Tissue
We firstly detected the level of immune checkpoints in STAD in Oncomine and TCGA database. The results of Oncomine were shown in Figure 1 and Table 1. The data of Oncomine suggested upregulation of CD80, CD86, PVR, TNFSF4, and TNFSF9 in STAD tissues compared with normal tissues (Figure 1 and Table 1). To be more specific, two datasets indicated that CD80 expression was increased in STAD tissues with a fold change of 2.285 and 3.122 (all p<0.05).13 DErrico’s dataset revealed upregulation of CD86 in STAD tissues compared with normal tissues (p=4.93E-13).13 Moreover, DErrico’s dataset also suggested that PVR expression was increased in STAD tissues (p<0.05).13 Another dataset suggested that the expression of TNFSF4 and TNFSF9 were elevated in STAD tissues and the fold change were 3.231 and 2.472, respectively.14
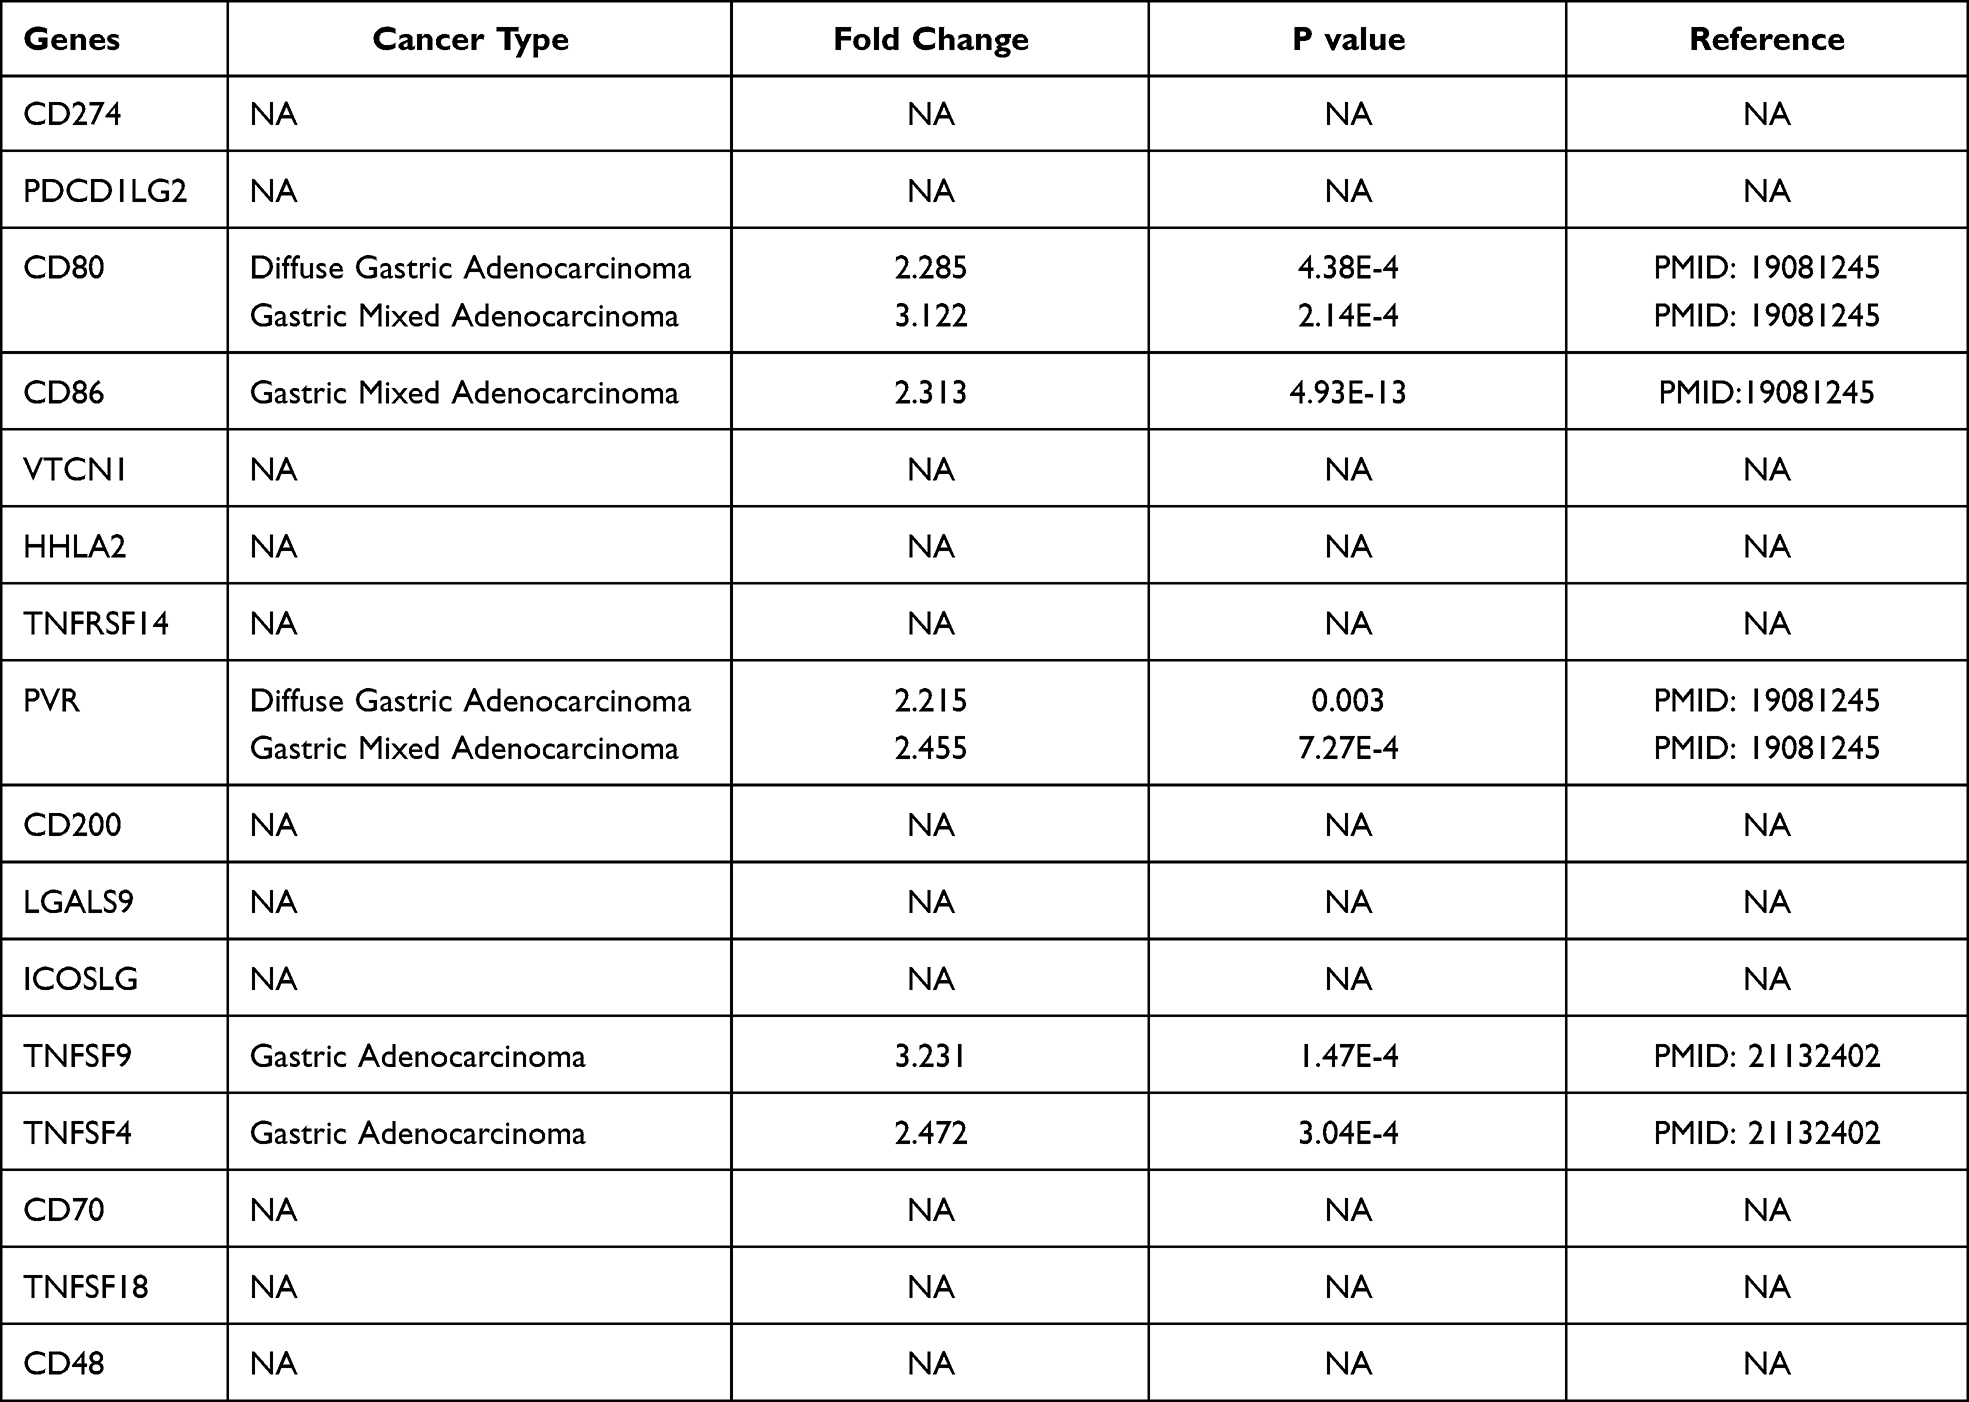 |
Table 1 The mRNA Levels of Immune Checkpoints in STAD Based on the Data of Oncomine |
 |
Figure 1 The mRNA level of immune checkpoints in STAD (Oncomine). The graph shows the numbers of datasets with statistically significant mRNA over-expression (red) or down-regulated expression (blue) of the target gene with a p-value of 0.05 and fold change of 2. The depth of color is related to the differential expression sequence of genes. Saturated red(blue) graph represents top1%, medium saturated red(blue) graph represents top5%, and white red(blue) graph represents top10%. |
We then analyzed the expression of immune checkpoints in STAD using TCGA dataset and the result was present in Figure 2. The data indicated that the level of CD274 (Figure 2A, p= 1.22E-03), PDCD1LG2 (Figure 2B, p=2.12E-08), CD80 (Figure 2C, p=7.11E-15), CD86 (Figure 2D, p=9.73E-13), VTCN1 (Figure 2E, p=7.70E-05), TNFRSF14 (Figure 2G, p=0.022), PVR (Figure 2H, p=2.71E-11), CD200 (Figure 2I, p=6.63E-08), LGALS9 (Supplementary Figure 1A, p=0.025), ICOSLG (Supplementary Figure 1B, p=2.61E-07), TNFSF9 (Supplementary Figure 1C, p<1E-12), TNFSF4 (Supplementary Figure 1D, p<1E-12), CD70 (Supplementary Figure 1E p=1.43E-04) and TNFSF18 (Supplementary Figure 1F, p=2.11E-09) were upregulated in tumor tissues in STAD compared with normal tissues. However, there is no difference in the expression of HHLA2 (Figure 2F, p=0.188) and CD48 (Supplementary Figure 1G, p=0.284) between STAD and normal tissues. These evidences demonstrate that the expression of immune checkpoints was extensively altered in STAD.
 |
Figure 2 The mRNA level of immune checkpoints in STAD. Box plots derived from TCGA STAD dataset comparing the expression of CD274 (A), PDCD1LG2 (B), CD80 (C), CD86 (D), VTCN1 (E), HHLA2 (F), TNFRSF14 (G), PVR (H), and CD200 (I) in STAD tissue and normal tissues. |
Gene Mutation Landscape, Correlation and Drug Sensitivity Analysis of Immune Checkpoints in STAD
As shown in Figure 3, oncoplot displays the gene mutation landscape of immune checkpoints in TCGA STAD cohort. Gene mutation landscape of immune checkpoints include missense_mutation, frame_shift_del, nonsense_mutation, in_frame_del, frame_shift_ins and multi_hit (Figure 3A). Single nucleotide polymorphism (SNP) and C>T mutation was the most common mutation types in variant type and SNV class, respectively (Figure 3B). Among this genes, the top five mutated genes were NECTIN2, CD86, CD80, HHLA2, VSIR and CD273 (Figure 3B). Correlation analysis demonstrated a moderate to high correlation in each member of immune checkpoints (Figure 3C). To verify whether the immune checkpoints could serve as therapy targets, an important way is to evaluate their association between with existed drug targets. Figure 3D shows the result of drug sensitivity analysis. And the data revealed that the expression of most of immune checkpoints were linked to drug sensitivity (negative correlation) and drug resistance (positive correlation) (Figure 3D).
 |
Figure 3 Genetic mutation landscape and drug sensitivity analysis of immune checkpoints in STAD. (A) Oncoplot displaying genetic mutation landscape of immune checkpoints in TCGA STAD cohort. (B) Cohort summary plot displaying distribution of variants according to variant classification, type and SNV class. Bottom part (from left to right) indicates mutation load for each sample, variant classification type. (C) A heat map of the correlation between each member of immune checkpoints. Red color represents positive correlation, blue color represents negative correlation. (D) The correlation between immune checkpoints and drug or small molecules. The Pearson correlation represent the immune checkpoints expression correlates with the drug. The positive correlation means that the gene high expression is resistant to the drug, vise verse. *p < 0.05, **p < 0.01. |
Enrichment Analysis of Immune Checkpoints in STAD
In order to clarify the potential function of immune checkpoints in STAD, enrichment analysis including GO and KEGG analysis were performed using all these 16 immune checkpoints. According to the results, these immune checkpoints were mainly related to T cell costimulation, positive regulation of activated T cell proliferation, immune response, negative regulation of interferon-gamma production, T cell activation, tumor necrosis factor-mediated signaling pathway, receptor binding, tumor necrosis factor receptor superfamily binding, tumor necrosis factor receptor binding, cytokine activity, receptor activity and cell adhesion molecule binding in GO analysis (Figure 4A). Moreover, KEGG pathways analysis revealed that these immune checkpoints were mainly related to cell adhesion molecules (CAMs), Cytokine-cytokine receptor interaction, Intestinal immune network for IgA production, immune response, JAK/STAT signaling pathways (Figure 4B). A PPI network constructed based on these immune checkpoints and revealed that they were associated with T cell costimulation, lymphocyte costimulation, regulation of lymphocyte and leukocyte activation, and T cell activation (Figure 5).
 |
Figure 4 The enrichment analysis of immune checkpoints in STAD. (A) Heatmap of GO enrichment in CC terms, BP terms and MF terms. (B) Heatmap of KEGG enriched terms. GO and KEGG pathway analysis were performed using all these 16 immune checkpoints. |
 |
Figure 5 Protein–protein interaction (PPI) network of immune checkpoints networks. PPI network and functional analysis indicating the gene set that was enriched in immune checkpoints networks. Different colors of the network edge indicate the bioinformatics methods applied: co-expression, website prediction, co-localization, shared protein domains, physical interaction, pathway and genetic interactions. The different colors for the network nodes indicate the biological functions of the set of enrichment genes. |
Prognosis Value of Immune Checkpoints in STAD
The prognosis value of immune checkpoints in STAD is shown in Table 2. Among these immune checkpoints, the expression of CD274, PVR, LGALS9, ICOSLG and CD70 were associated with all the overall survival (OS), post progression survival (PPS), and first progression (FP) in STAD patients. To be more specific, STAD patients with high PVR expression had a poor OS (p=0.011, HR (95% CI) =1.32 (1.06–1.64)), PPS (p=0.0015, HR (95% CI) =1.55 (1.18–2.05)) and FP (p=0.023, HR (95% CI)=1.32 (1.04–1.67)) (Figure 6A and Table 2). Moreover, STAD patients with high LGALS9 expression had a poor OS (p=4.9E-8, HR (95% CI) =1.6 (1.35–1.91)), PPS (p=5.4E-14, HR (95% CI) =2.36 (1.88–2.98)) and FP (p=2.3E-7, HR (95% CI)=1.71 (1.39–2.09)) (Figure 6B and Table 2). High ICOSLG expression STAD patients indicated a poor OS (p=0.026, HR (95% CI) =1.21 (1.02–1.44)), PPS (p=0.00015, HR (95% CI)=1.53 (1.23–1.91)) and FP (p=0.0028, HR (95% CI)=1.36 (1.11–1.66)) (Figure 7A and Table 2). As we could see in Figure 7B and Table 2, STAD patients with high CD70 expression had a poor OS (p=0.039, HR (95% CI) =1.2 (1.01–1.42)), PPS (p=0.00035, HR (95% CI) =1.49 (1.2–1.86)) and FP (p=0.44, HR (95% CI)=1.23 (1.01–1.5)) (Figure 7B and Table 2). We also observed that STAD patients with low CD274 expression had a poor OS (p=0.00029, HR (95% CI) =0.67 (0.54–0.83)), PPS (p=0.0045, HR (95% CI) =0.67 (0.51–0.89)) and FP (p=0.0012, HR (95% CI)=0.67 (0.63–0.86)) (Figure 7C and Table 2). These data suggested that CD274, PVR, LGALS9, ICOSLG and CD70 might serve as prognostic biomarkers in STAD.
 |
Table 2 Prognosis Value of Immune Checkpoints in STAD |
 |
Figure 6 The prognostic value of PVR/LGALS9 in STAD. (A) STAD patients with high mRNA level of PVR had a worse OS, PF and PPS. (B) STAD patients with high mRNA level of LGALS9 had a worse OS, PF and PPS. Abbreviations: HR, hazard Ratio; OS, overall survival; PPS, post progression survival; FP, first progression. |
 |
Figure 7 The prognostic value of LCOSLG/CD70/CD274 in STAD. (A) STAD patients with high mRNA level of ICOSLG had a worse OS, PF and PPS. (B) STAD patients with high mRNA level of CD70 had a worse OS, PF and PPS. (C) STAD patients with low mRNA level of CD274 had a worse OS, PF and PPS. Abbreviations: HR, hazard Ratio; OS, overall survival; PPS, post progression survival; FP, first progression. |
Building a Predictive Nomogram
We then resorted a nomogram to construct a predictive model, considering clinicopathologic features and potential prognostic biomarkers, to construct a clinically applicable method that could predict the survival probability of a patient. The univariate and multivariate analysis revealed that CD70, ICOSLG, age, pTNM stage, and radiation therapy were independent factors affecting the prognosis of STAD patients (Figure 8A and 8B). We generated a nomogram to predict the 1‐year, 3‐year OS, 5‐year OS rates in the discovery group using the Cox regression algorithm (Figure 8C). The calibration plots for the 1‐year and 3‐year OS rates were predicted relatively well compared with an ideal model in the entire cohort (Figure 8D).
 |
Figure 8 Univariate and multivariate cox regression of immune checkpoints in STAD. (A, B) Hazard ratio and P‐value of constituents involved in univariate and multivariate Cox regression and some parameters of the immune checkpoints. (C, D) Nomogram to predict the 1-y, 2-y and 3-y overall survival of STAD patients. Calibration curve for the overall survival nomogram model in the discovery group. A dashed diagonal line represents the ideal nomogram, and the blue line, red line and orange line represent the 1-y, 2-y and 3-y observed nomograms. |
Validation of the Expression and Overall Survival of CD70/ICOSLG in STAD
qRT-PCR was conducted to further confirm the expression of CD70/ICOSLG in STAD. As expected, the level of CD70 (p = 0.045, Figure 9A) and ICPOSLG (p < 0.001, Figure 9D) in STAD samples was upregulated versus normal tissues. Further analysis revealed that STAD patients with high CD70 expression (p = 0.019, Figure 9B) and ICOSLG expression (p = 0.045, Figure 9E) had a poor OS with an AUC of 0.73 (Figure 9C) and 0.702 (Figure 9F), respectively. The univariate and multivariate analysis revealed that CD70, ICOSLG, clinical stage, tumor grade, and nodal metastasis status were independent factors affecting the prognosis of STAD patients (Figure 9G–H).
 |
Figure 9 Validation of the expression and overall survival of CD70/ICOSLG in STAD. (A) the level of CD70 in STAD and normal tissues. OS curve of STAD patients with high/low CD70 expression (B) and ROC curve evaluating the predicting performance (C) in STAD. (D) the level of ICOSLG in STAD and normal tissues. OS curve of STAD patients with high/low ICOSLG expression (E) and ROC curve evaluating the predicting performance (F) in STAD. (G, H) Univariate and multivariate analysis considering CD70 and ICOSLG expression as well as clinical characters. |
The Association Between ICOSLG/CD70 and Clinicopathologic Features
Previous study revealed that CD70 and ICOSLG were independent factors affecting the prognosis of STAD patients. CD70 and ICOSLG may serve as prognostic biomarkers in STAD. Thus, CD70 and ICOSLG were select for further analysis. We then analyzed the association between the expression ICOSLG/CD70 and clinicopathologic feature. As shown in Figure 10A, female STAD patients and high tumor grade STAD patients had a high CD70 expression compared with Male STAD patients and low tumor grade STAD patients (all p<0.05). As for ICOSLG, STAD patients with high clinical stage had a high ICOSLG expression compared with STAD patients with low clinical stage (Figure 10B, p=0.0022).
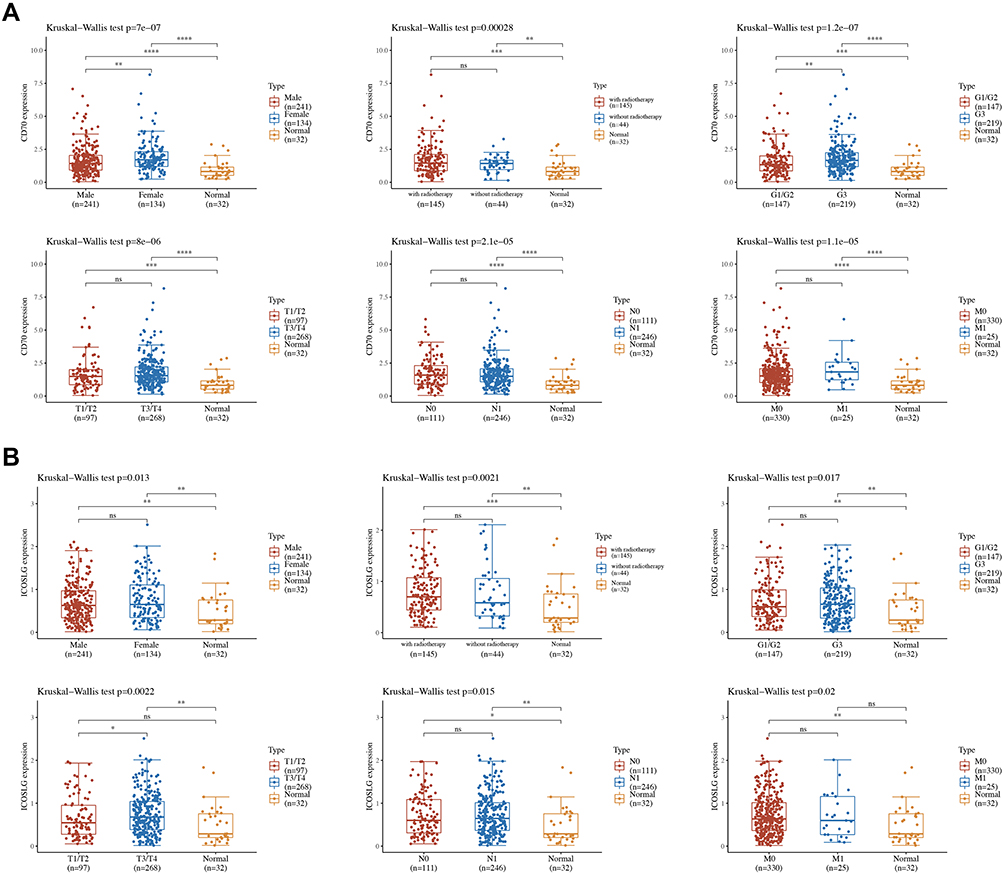 |
Figure 10 The expression of immune checkpoints in the subtypes of STAD tissues and normal tissues. (A) The expression distribution of subtypes of STAD tissues and normal tissues. (B) The expression distribution of subtypes of STAD tissues and normal tissues. The horizontal axis represents different groups of samples, the vertical axis represents the gene expression distribution, where different colors represent different groups, and the upper left corner represents the significance p-value test method. *p < 0.05, **p < 0.01, ***p < 0.01, ****p < 0.01. |
ICOSLG/CD70 Were Correlated with Immune Infiltration in STAD
Immune infiltration is an independent predictor of sentinel lymph node status and survival in cancers.15–17 We then also explore the correlation between the expression of ICOSLG and CD70 and immune infiltration in STAD. As shown in Figure 11A, the expression of ICOSLG was positively correlated with the abundance of CD8+ T cells (Cor=0.293, p=6.3E-9), CD4+ T cells (Cor=0.304, p=1.45E-9), B cell (Cor=0.235, p=3.94e-6), Macrophage (Cor=0.234, p=4.28E-6), Neutrophils (Cor=0.258, p=3.51E-7) and Dendritic cells (Cor=0.36, p=4.57E-13). Moreover, the expression of CD70 was correlated with the abundance of CD8+ T cells (Cor=0.328, p=6.22E-11), CD4+ T cells (Cor=0.163, p=1.50E-3), B cells (Cor=0.225, p=1.02E-5), Macrophage (Cor=0.364, p=2.67E-13), Neutrophils (Cor=0.29, p=8.55E-9) and Dendritic cells (Cor=0.462, p=1.79E-21) (Figure 11B). Further analysis revealed that SCNA of ICOSLG (Figure 11C) and CD70 (Figure 11D) could partially inhibit the immune infiltration in STAD.
 |
Figure 11 The correlation between immune checkpoints and immune infiltration (TIMER). (A) The correlation between ICOSLG expression and the abundance of CD8+ T cells, CD4+ T cells, Macrophage, Neutrophils and Dendritic cells. (B) The correlation between CD70 expression and the abundance of CD8+ T cells, CD4+ T cells, Macrophage, Neutrophils and Dendritic cells. (C) the correlation between SCNA of ICOSLG and immune cell infiltration. (D) the correlation between SCNA of CD70 and immune cell infiltration. (E, F). The correlation between immune checkpoints and the expression of immune biomarkers in STAD. Red color represents positive correlation, blue color represents negative correlation. *P < 0.05, **P < 0.01, ***P < 0.001. Abbreviation: SCNA, somatic copy number alterations. |
The association between ICOSLG and CD70 expression and gene markers of tumor-infiltrating immune cells was also analyzed. These gene markers of tumor-infiltrating immune cells included markers of CD8+ T cells, T cells (general), B cells, monocytes, TAMs, M1 macrophages, M2 macrophages, neutrophils, natural killer (NK) cells, dendritic cells (DCs), T-helper 1 (Th1) cells, T-helper 2 (Th2) cells, follicular helper T (Tfh) cells, T-helper 17 (Th17) cells, Tregs, and exhausted T cells. As a result, CD70 expression show positive correlation with most biomarkers of these immune cells while ICOSLG expression show positive correlation with certain biomarkers of these immune cells (Figure 11E and F and Table 3). These evidences indicated that CD70 and ICOSLG played a vital role in immune escape in the STAD microenvironment.
 |
Table 3 Correlation Analysis Between CD70/ICOSLG and Gene Biomarkers of Immune Cells in STAD |
Discussion
Immune checkpoints were associated with immune-related adverse events, thus affecting the clinical outcomes of cancer patients.18 Increasing evidences have shown that certain immune checkpoints could serve as prognostic biomarkers or the in some cancers, including renal cell carcinoma, STAD, non-small cell lung cancer and triple-negative breast cancers.19,20 However, the specific role of these immune checkpoints in the prognosis and therapy of STAD were still far from clarified. Therefore, this study aims to clarify the expression and prognosis of these immune checkpoints and their relationship with immune infiltration in STAD.
We first clarified the expression of these immune checkpoints in STAD. As a result, most of these immune checkpoints were altered in gene expression in STAD, including CD274, PDCD1LG2, CD80, CD86, VTCN1, TNFRSF14, PVR, CD200, LGALS9, ICOSLG, TNFSF9, TNFSF4, CD70 and TNFSF18. These expression-altered immune checkpoints may play a significant role in the oncogenesis and progression of STAD. We then performed functional enrichment analysis based on these immune checkpoints to clarify the potential function of gene. The results indicated that these immune checkpoints were mainly associated with immune response, negative regulation of interferon-gamma production, T cell activation, tumor necrosis factor-mediated signaling pathway, cell adhesion molecules (CAMs), Cytokine-cytokine receptor interaction, JAK/STAT signaling pathways. Interestingly, these functions were involved in the carcinogenesis, progression and tumor immune escape in STAD. Previous have indicated that JAK/STAT signaling pathways played a vital role in tumor cell proliferation, cycle, and apoptosis in STAD.21 T cell activation is an important mechanism in anti-tumor immunity.22,23
Another important finding of our study is that CD274, PVR, LGALS9, ICOSLG and CD70 may serve as prognostic biomarker in STAD and associated with the overall survival (OS), post progression survival (PPS), and first progression (FP) of STAD patients. Actually, these immune checkpoints have been suggested as prognostic other types of cancers. CD70 was a prognostic biomarker in malignant pleural mesothelioma predicting a worse prognosis.24 Another study suggested LGALS9 and TGFBR1 as novel biomarkers for the prognosis of pancreatic cancer.25 Li et al found that ICOSLG act as prognostic biomarker in esophageal squamous cell carcinoma associated with an unfavorable overall survival.26 In colorectal cancer, CD274 was suggested as prognosis biomarker and it could predict the response to anti-PD-1 therapy.27 Our study firstly clarified the prognosis of CD274, PVR, LGALS9, ICOSLG and CD70 in STAD. Moreover, univariate and multivariate analysis were performed and demonstrated that CD70, ICOSLG, age, pTNM stage, and radiation therapy were independent factors affecting the prognosis of STAD patients.
Our study also clarified the correlation between the expression of ICOSLG and CD70 and immune cells as well as immune biomarkers, including CD8+ T cells, CD4+ T cells, Macrophage, Neutrophils and Dendritic cells. Interestingly, these immune cells play an important role in tumor immune infiltration, anticancer immunity and prognosis. CD8+ T cells, as one of the primary effector cells of anticancer immunity, is a potential prognostic indicator of gastric cancer.28 Previous study also suggested that T Cells Modified with CD70 as an alternative cellular vaccine for antitumor immunity.29 Another study found that CD70 could tumor migration and macrophage infiltration in gliomas.29 Therefore, ICOSLG and CD70 may also exert a vital function in immunotherapy of STAD.
Some limitations could be found in our study. Firstly, most analysis was performed at mRNA level but not protein level and gene level. Furthermore, it would be better to validate our results by performing vivo and in vitro experiments. Immune checkpoints included in our study are incomplete. Moreover, the method of our study is not innovative enough and these bioinformatic analyses are applicable to any other cancer type.
All in all, our study performed a comprehensive analysis of the prognostic value and immune function of immune checkpoints in STAD, and our result suggested that immune checkpoint ICOSLG and CD70 serve as prognostic biomarkers and associate with immune infiltration in STAD.
Data Sharing Statement
The analyzed data sets generated during the study are available from the corresponding author on reasonable request.
Funding
There is no funding to report.
Disclosure
The authors declare that they have no conflicts of interest for this work.
References
1. Bray F, Ferlay J, Soerjomataram I, Siegel RL, Torre LA, Jemal A. Global cancer statistics 2018: GLOBOCAN estimates of incidence and mortality worldwide for 36 cancers in 185 countries. CA Cancer J Clin. 2018;68:394–424.
2. Nie Y, Liu L, Liu Q, Zhu X. Identification of a metabolic-related gene signature predicting the overall survival for patients with stomach adenocarcinoma. Peer J. 2021;9:e10908. doi:10.7717/peerj.10908
3. Bray F, Ferlay J, Soerjomataram I, Siegel RL, Torre LA, Jemal A. Global cancer statistics 2018: GLOBOCAN estimates of incidence and mortality worldwide for 36 cancers in 185 countries. CA Cancer J Clin. 2018;68(6):394–424. doi:10.3322/caac.21492
4. Liang LB, Huang XY, He H, Liu JY. Prognostic values of radiosensitivity genes and CD19 status in gastric cancer: a retrospective study using TCGA database. Pharmgenomics Pers Med. 2020;13:365–373.
5. Digklia A, Wagner AD. Advanced gastric cancer: current treatment landscape and future perspectives. World J Gastroenterol. 2016;22(8):2403–2414. doi:10.3748/wjg.v22.i8.2403
6. Chen H, Li K, Li Y, Xie P, He J, Zhang H. An integrative pan-cancer analysis of COPB1 based on data mining. Cancer Biomark. 2021;30(1):13–27. doi:10.3233/CBM-200398
7. Pardoll DM. The blockade of immune checkpoints in cancer immunotherapy. Nat Rev Cancer. 2012;12(4):252–264. doi:10.1038/nrc3239
8. Wei SC, Duffy CR, Allison JP. Fundamental mechanisms of immune checkpoint blockade therapy. Cancer Discov. 2018;8(9):1069–1086. doi:10.1158/2159-8290.CD-18-0367
9. Huang X, Tang T, Wang X, Bai X, Liang T. Calreticulin couples with immune checkpoints in pancreatic cancer. Clin Transl Med. 2020;10(1):36–44. doi:10.1002/ctm2.10
10. Dermani FK, Samadi P, Rahmani G, Kohlan AK, Najafi R. PD-1/PD-L1 immune checkpoint: potential target for cancer therapy. J Cell Physiol. 2019;234(2):1313–1325. doi:10.1002/jcp.27172
11. Miao YR, Thakkar KN, Qian J, et al. Neutralization of PD-L2 is essential for overcoming immune checkpoint blockade resistance in ovarian cancer. Clin Cancer Res. 2021;27:4435–4448. doi:10.1158/1078-0432.CCR-20-0482
12. Fang J, Chen F, Liu D, Gu F, Chen Z, Wang Y. Prognostic value of immune checkpoint molecules in breast cancer. Biosci Rep. 2020;40:BSR20201054.
13. D’Errico M, de Rinaldis E, Blasi MF, et al. Genome-wide expression profile of sporadic gastric cancers with microsatellite instability. Eur J Cancer. 2009;45:461–469. doi:10.1016/j.ejca.2008.10.032
14. Wang Q, Wen YG, Li DP, et al. Upregulated INHBA expression is associated with poor survival in gastric cancer. Med Oncol. 2012;29(1):77–83. doi:10.1007/s12032-010-9766-y
15. Liang F, Liang H, Li Z, Huang P. JAK3 is a potential biomarker and associated with immune infiltration in kidney renal clear cell carcinoma. Int Immunopharmacol. 2020;86:106706. doi:10.1016/j.intimp.2020.106706
16. Zeng Q, Sun S, Li Y, Li X, Li Z, Liang H. Identification of therapeutic targets and prognostic biomarkers among CXC chemokines in the renal cell carcinoma microenvironment. Front Oncol. 2019;9:1555. doi:10.3389/fonc.2019.01555
17. Zhou L, Li Y, Li Z, Huang Q. Mining therapeutic and prognostic significance of STATs in renal cell carcinoma with bioinformatics analysis. Genomics. 2020;112:4100–4114. doi:10.1016/j.ygeno.2020.06.032
18. Adda L, Batteux B, Saidak Z, et al. Effect of immune checkpoint inhibitor-induced rheumatic and musculoskeletal disorders on overall survival. Joint Bone Spine. 2021;88(4):105168. doi:10.1016/j.jbspin.2021.105168
19. Paderi A, Giorgione R, Giommoni E, et al. Association between immune related adverse events and outcome in patients with metastatic renal cell carcinoma treated with immune checkpoint inhibitors. Cancers. 2021;13:860.
20. Grandal B, Mangiardi-Veltin M, Laas E, et al. PD-L1 expression after neoadjuvant chemotherapy in triple-negative breast cancers is associated with aggressive residual disease, suggesting a potential for immunotherapy. Cancers. 2021;13:746.
21. Xiao C, Hong H, Yu H, et al. MiR-340 affects gastric cancer cell proliferation, cycle, and apoptosis through regulating SOCS3/JAK-STAT signaling pathway. Immunopharmacol Immunotoxicol. 2018;40(4):278–283. doi:10.1080/08923973.2018.1455208
22. Garg AD, Agostinis P. Cell death and immunity in cancer: from danger signals to mimicry of pathogen defense responses. Immunol Rev. 2017;280:126–148. doi:10.1111/imr.12574
23. Yin Z, Bai L, Li W, Zeng T, Tian H, Cui J. Targeting T cell metabolism in the tumor microenvironment: an anti-cancer therapeutic strategy. J Exp Clin Cancer Res. 2019;38(1):403. doi:10.1186/s13046-019-1409-3
24. Inaguma S, Lasota J, Czapiewski P, et al. CD70 expression correlates with a worse prognosis in malignant pleural mesothelioma patients via immune evasion and enhanced invasiveness. J Pathol. 2020;250(2):205–216. doi:10.1002/path.5361
25. Fan Y, Li T, Xu L, Kuang T. Comprehensive analysis of immunoinhibitors identifies LGALS9 and TGFBR1 as potential prognostic biomarkers for pancreatic cancer. Comput Math Methods Med. 2020;2020:6138039. doi:10.1155/2020/6138039
26. Li Y, Lu Z, Che Y, et al. Immune signature profiling identified predictive and prognostic factors for esophageal squamous cell carcinoma. Oncoimmunology. 2017;6:e1356147. doi:10.1080/2162402X.2017.1356147
27. Alexander PG, McMillan DC, Park JH. A meta-analysis of CD274 (PD-L1) assessment and prognosis in colorectal cancer and its role in predicting response to anti-PD-1 therapy. Crit Rev Oncol Hematol. 2021;157:103147. doi:10.1016/j.critrevonc.2020.103147
28. Li F, Sun Y, Huang J, Xu W, Liu J, Yuan Z. CD4/CD8 + T cells, DC subsets, Foxp3, and IDO expression are predictive indicators of gastric cancer prognosis. Cancer Med. 2019;8(17):7330–7344. doi:10.1002/cam4.2596
29. Lee SE, Shin AR, Sohn HJ, Cho HI, Kim TG. T cells modified with CD70 as an alternative cellular vaccine for antitumor immunity. Cancer Res Treat. 2020;52(3):747–763. doi:10.4143/crt.2019.721
 © 2021 The Author(s). This work is published and licensed by Dove Medical Press Limited. The
full terms of this license are available at https://www.dovepress.com/terms
and incorporate the Creative Commons Attribution
- Non Commercial (unported, 3.0) License.
By accessing the work you hereby accept the Terms. Non-commercial uses of the work are permitted
without any further permission from Dove Medical Press Limited, provided the work is properly
attributed. For permission for commercial use of this work, please see paragraphs 4.2 and 5 of our Terms.
© 2021 The Author(s). This work is published and licensed by Dove Medical Press Limited. The
full terms of this license are available at https://www.dovepress.com/terms
and incorporate the Creative Commons Attribution
- Non Commercial (unported, 3.0) License.
By accessing the work you hereby accept the Terms. Non-commercial uses of the work are permitted
without any further permission from Dove Medical Press Limited, provided the work is properly
attributed. For permission for commercial use of this work, please see paragraphs 4.2 and 5 of our Terms.