Back to Journals » International Journal of Chronic Obstructive Pulmonary Disease » Volume 18
Comprehensive Analysis of a Competing Endogenous RNA Co-Expression Network in Chronic Obstructive Pulmonary Disease
Authors Wang J, Xia B, Ma R, Ye Q
Received 14 August 2023
Accepted for publication 16 October 2023
Published 6 November 2023 Volume 2023:18 Pages 2417—2429
DOI https://doi.org/10.2147/COPD.S431041
Checked for plagiarism Yes
Review by Single anonymous peer review
Peer reviewer comments 2
Editor who approved publication: Dr Jill Ohar
Jingwei Wang,1,2,* Bowen Xia,3,* Ruimin Ma,1 Qiao Ye1,2
1Beijing Institute of Respiratory Medicine, Beijing Chaoyang Hospital, Capital Medical University, Beijing, People’s Republic of China; 2Department of Occupational Medicine and Toxicology, Clinical Center for Interstitial Lung Diseases, Beijing Chaoyang Hospital, Capital Medical University, Beijing, People’s Republic of China; 3Department of Urology, Beijing Chao-Yang Hospital, Capital Medical University, Beijing, People’s Republic of China
*These authors contributed equally to this work
Correspondence: Qiao Ye, Department of Occupational Medicine and Toxicology, Clinical Center for Interstitial Lung Diseases, Beijing Chaoyang Hospital, Capital Medical University, No. 8 Worker’s Stadium, Chaoyang District, Beijing, 100020, People’s Republic of China, Email [email protected]
Purpose: Chronic obstructive pulmonary disease (COPD) is the main cause of mortality world widely. Non-coding RNAs (lncRNAs) and associated competitive endogenous RNAs (ceRNAs) networks were recently proved to lead to mRNA gene expression downregulation but were still unclear in COPD. This study aims to investigate and elucidate the mechanisms underlying the involvement of ceRNA co-expression networks in COPD pathogenesis.
Methods: Obtained expression signature of data from the Gene Expression Omnibus database and compared the differentially expression of mRNAs and miRNAs between COPD patients and healthy smokers. Predicted the miRNA–lncRNA and miRNA–mRNA interaction using online library and employed CIBERSORT to measure the proportions of the 22 immune cells in the COPD and control groups.
Results: Established a ceRNA-network comprising 11 lncRNAs, 5 miRNAs, and 16 mRNAs. Using the weighted correlation network analysis method, we identified hub genes and hub miRNAs and obtained one core sub-network, XIST, FGD5-AS1, KCNQ1OT1, HOXA11-AS, LINC00667, H19, PRKCQ-AS1, NUTM2A-AS1/has-mir-454-3p/ZNF678, PRRG4. COPD patients had different proportions of immune cells than controls, and these variations were associated with the magnitude of pulmonary function parameters.
Conclusion: The ceRNA-network, particularly the core sub-network, may be a putative goal for COPD, in which specific immune cells were involved.
Keywords: chronic obstructive pulmonary disease, competing endogenous RNA network, microRNAs, miRNAs, CIBERSORT algorithm, gene expression omnibus
Introduction
Chronic obstructive pulmonary disease (COPD) is a complex respirator disorder featured by impaired expiratory airflow caused by airway and/or alveolar damage.1,2 Statistics show that COPD is responsible for more than three million deaths worldwide each year.3 In the latest national COPD epidemiological survey, the total prevalence of COPD as measured by spirometry was 8.6%, which is equivalent to 99.9 million patients with COPD in China.4 Previous research has suggested that genetic susceptibility may influence COPD immune response and increase the risk of COPD under the influence of environmental exposures.5–7 Further elucidating COPD pathogenesis and finding new biomarkers to improve treatment are important.
Non-coding RNAs (ncRNAs) are a class of transcripts that have been identified in the eukaryotic genome. Evidence suggests that ncRNAs are involved in numerous vital gene expression processes, such as chromatin remodelling/epigenetic memory, transcription, RNA splicing, editing, translation, and signal transduction.8,9 lncRNAs and miRNAs have been implicated in COPD.10 The competitive endogenous RNA (ceRNA) hypothesis postulates that specific ncRNAs, for example, lncRNAs and circular RNAs (circRNAs), transcripts with shared microRNA (miRNA) binding sites competing for post-transcriptional control, may be involved in the downregulation of mRNA gene expression.11 lncRNAs and their ceRNA-network have been demonstrated to be involved in the downregulation of mRNA gene expression in lung disorders.12,13 SNHG5-miR-132-PTEN and CASC2-miR-18a-5p-IGF1 axis may play a potential role in COPD,14,15 but ceRNA was still not explicated in COPD.
COPD induces lung tissue remodeling through sustained inflammatory responses of both congenital and adaptive immunity, in which neutrophils, macrophages, T lymphocytes and other inflammatory cells were involved.16,17 Infection, inflammation, tobacco smoke, and immune response were able to provoke pulmonary autoimmunity and accelerate the pathogenesis of COPD.18 Yet, the precise immunological pathway involved remains indistinct.
This article aimed to explore an integrated transcriptome bioinformatics analysis based on mRNA and miRNA sequences to identify the disease-associated ceRNA-network and related genes. Considering the potential role of immune cells, we linked immune status with COPD and explored its value in the microenvironment of the disease.
Materials and Methods
The GSE38974 data set was used to obtain the RNA sequencing results generated from lung tissue samples. The mRNA expression profiles including COPD patients (N = 23) and healthy smokers (N = 9), based on the GPL4133 platform, were enrolled for analysis. The miRNA expression profiles including COPD patients (N = 19) and healthy smokers (N = 8), based on the GPL16384 platform, were enrolled. All patients and healthy smokers in this study were active smokers. Our research was performed according to the flowchart presented in Figure 1. The flowchart of analysis thoughts was shown in Figure S1.
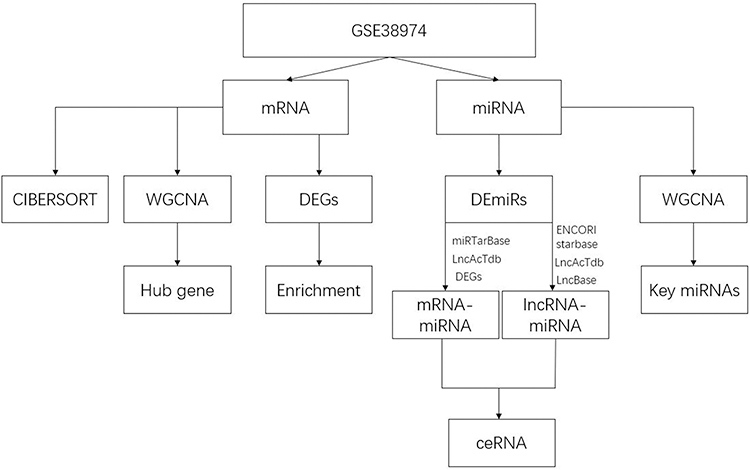 |
Figure 1 Flow chart of the data analysis. Abbreviations: DEG, differentially expressed genes; DEmiRs, differentially expressed miRNAs. |
Differential Expression Analysis
The GSE38974 data quality control was verified by principal component analysis (PCA). Differently expressed mRNAs (DEGs) and microRNAs (DEmiRs) were selected by difference analysis using the R package “limma” version 4.1.2. A significance threshold of p-value <0.05 and a fold change of | log2FC | >1 were adopted as the criteria for DEGs and DEmiRs. Furthermore, the “heatmap” and “ggplot2” packages were used to generate the heatmap, volcano plot, and box plot.
Functional Enrichment Analysis of DEGs
Gene Ontology (GO), Kyoto Encyclopedia of Genes and Genomes (KEGG), and Gene Set Enrichment Analysis (GSEA) pathway enrichment analysis were performed to determine the functional and molecular features of DEGs. The “ClusterProfiler” package of R software was used for enrichment analysis, in which preliminary analysis of the obtained DEGs was performed with systematic and comprehensive biological function notes attached.19 The GO term included biological processes (BP), cell components (CC), and molecular functions (MF). GO terms and KEGG pathways were deemed significant at a p-value of <0.05. For the visualization of the results, the R packages “enrichplot” and “GOplot” were utilized.
Construction of ceRNA-Network
Briefly, the construction of the ceRNA-network related to COPD can be divided into three stages. (a) Prediction of lncRNA–miRNA interactions: miRNA–lncRNA interactions can be predicted using the databases of starBase (v2.0),19 DIANA-LncBase (v3.0),20 Encyclopedia of RNA Interactomes (ENCORI) database and lncACTdb;21 (b) Prediction of miRNA–mRNA interactions: miRNA–mRNA interactions were obtained from shared miRTarBase 202022 and lncACTdb. miRTarBase predicted high-confidence functional miRNA–target interactions validated by reported assay and/or Western blot data. The miRNA–mRNA interactions were used to intersect with DEGs of GSE81292; (c) Construction of ceRNA-network: the predicted lncRNA–miRNA and miRNA–mRNA interactions were used to construct the lncRNA–miRNA–mRNA network. We used the R package “ggalluvial” to visualize the ceRNA-network by a Sankey plot.
Construction of a Weighted Gene Co-Expression Network
Weighted gene co-expression network analysis (WGCNA) is one of the most commonly used methods to construct modules and specific traits co-expression networks. The most variable upper 25% genes in GSE38974 mRNA and the whole gene of GSE38974 miRNA were selected for analysis.
First, we clustered the samples to evaluate whether there were any apparent outliers. Second, a weighted correlation network was calculated by constructing a pairwise correlation matrix between all gene pairs selected based on the variance. We chose the soft threshold power β values 5 for mRNAs and 4 for miRNA when the square value of the correlation coefficient reached 0.9 at the lowest power to build the scale-free topology model. Third, the Topological Overlap Measure was counted to reflect the overlap degree of shared neighbors, and we used hierarchical clustering and the dynamic tree cutting functions to perform the detection of module. Lastly, the module eigengene (ME) was defined as the first principal component of the gene module and can represent each module’s gene expression profiles.23 Gene significance and module membership linked modules with medical features. The top 30 genes in the modules related to the traits were hub genes, and it was built by STRING with visualization by Cytoscape.
Assessing the Distribution of Immune Cell Subtypes
CIBERSORT is a powerful immune infiltration analysis tool based on the deconvolution integration method,24 which is utilized to calculate the composition of varying immune cell species between COPD and control groups. This tool transforms a standardized gene expression matrix into the composition indices of 22 immune cell types. This algorithm was combined with the LM22 signature, and a sample of 1000 permutations with P < 0.05 was chosen for further analysis. The fractions of the 22 types of immune cells evaluated in each sample added up to 1. To display the ratio of different types of immune cells between COPD and control groups, a heat map was drawn via R software’s “pheatmap” package and a boxplot was generated using the R package “ggboxplot”. Additionally, the Wilcox rank-sum test was used to assess the association between the immune cells and the severity of Global Initiative for Chronic Obstructive Lung Disease (GOLD) stage.
Results
Differentially Expressed Genes
PCA was employed to assess the repeatability and quality of data within the groups. The repeatability and quality of data in GSE38974 was fine. In total, 622 DEGs (323 down-regulated and 299 up-regulated) were recognized in Figure 2A and B. 21 DEmiRNAs (14 down-regulated and 7 up-regulated) were recognized in Figure 2C and D. | log2FC| >1 and P-value <0.05 were used for the identification. DEGs functional enrichment analysis.
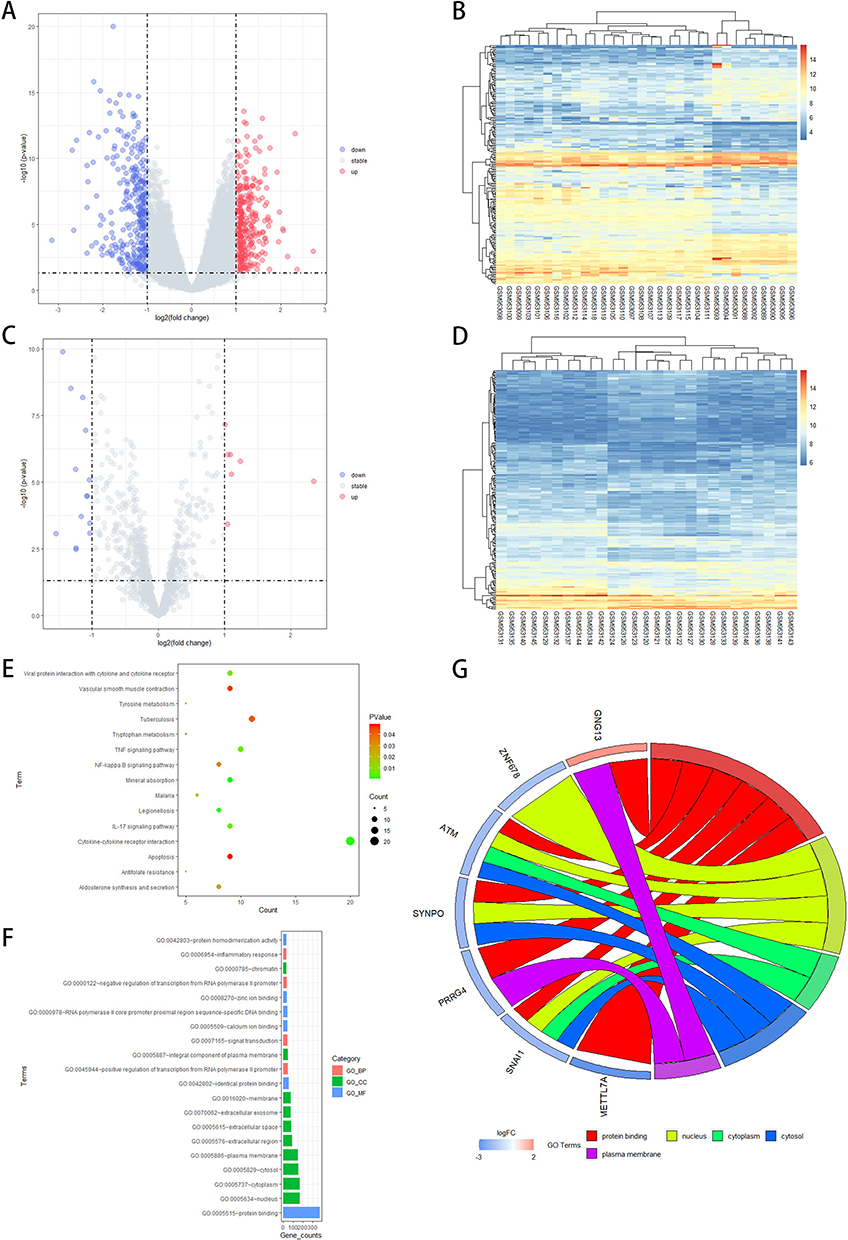 |
Figure 2 Differential expression analysis. (A) Volcano plots of DEGs; (B) Heatmap plots of DEGs; (C) Volcano plots of DEmiRs; (D) Heatmap plots of DEmiRs; (E) The top 15 KEGG pathways enrichment analysis of DEGs. The size of each circle represents the number of genes that are enriched in a particular pathway. The different color of each circle represents P-value. (F) The top 20 GO functional enrichment analyses of DEGs include biological process (BP), cellular component (CC), and molecular functions (MF) terms. The length of each bar represents the number of genes. The different color of each bar represents the analysis type. (G) GO terms Chord graph of DEGs. Abbreviations: DEG, differential expressed genes; DEmiRs, expressed miRNAs; KEGG, Kyoto Encyclopedia of Genes and Genomes; GO, gene ontology. |
As shown in Figure 2E–G, the enrichment result of GO-BP terms included “positive regulation of RNA polymerase II promoter transcription”, “signal transduction”, “negative regulation of RNA polymerase II promoter transcription”, and “regulation of cell–cell adhesion”. The top enrichment result of GO-CC terms involved “extracellular region”, “extracellular space”, and “cytoplasm”. And “receptor-ligand activity”, “signaling receptor activator activity”, and “DNA-binding transcription activator activity, RNA polymerase II-specific” were the main enrichment results of GO-MF terms. KEGG pathway analysis indicated that all DEGs were primarily clustered in “cytokine-cytokine receptor interaction”, “lipid and atherosclerosis”, “tuberculosis”, and “transcriptional mis-regulation in cancer”. The most significant of these enriched GO terms and KEGG pathways indicated the functional interactions of DEGs. The results of up- and down-regulated DEGs GO and KEGG analyses were presented in Figure S2. The GSEA revealed that the two major pathways involved are the Cytokine-Cytokine Receptor Interaction and the JAK-STAT Signaling Pathway, which was shown in Figure S3. The top 20 pathways involved in GSEA KEGG enrichment analysis were listed in Table S1. The hub genes of the pathways were determined using the Cystoscope plug-in “cytohubba” and listed in Table S2.
Construction of a ceRNA-Network
We further short-listed 12 lncRNAs and 58 mRNAs by the intersections predicted by the abovesaid database. mRNAs or lncRNAs without the same prediction results were discarded (Figure 3A and B). Considering that there was a certain association between lncRNAs and mRNAs, those that are were not related will also be filtered by the lnACTdb dataset. In the issue, a co-expression network of COPD comprising 11 lncRNAs, 5 miRNAs, and 16 mRNAs was established and graphically depicted via a Sankey plot (Figure 3C).
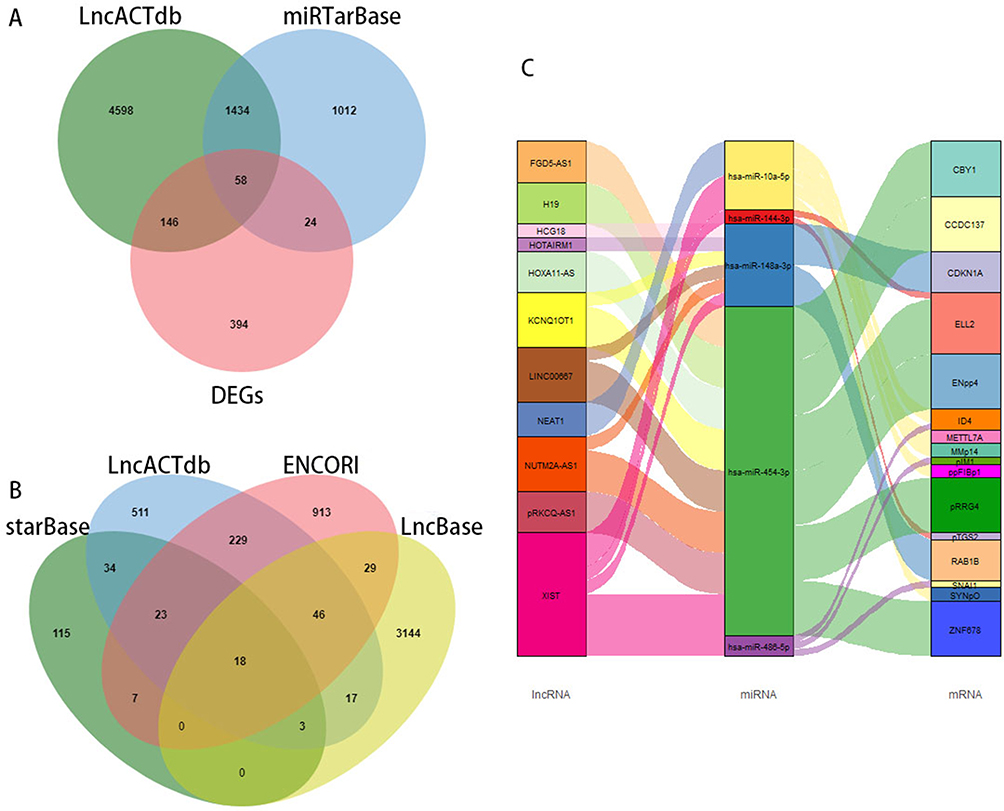 |
Figure 3 Construction of the ceRNA Co-expression network. (A) Predicted mRNAs in Venn plot the intersection of DEGs, miRTarBase, and LncACTdb; (B) Predicted lncRNAs in Venn plot by the overlap of starBase, LncBase, ENCORI, and LncACTdb; (C) The Sankey plot of ceRNA network constructed by lncRNA–miRNA–mRNA. |
WGCNA and Modules Construction
The top 25% of mRNAs with the most varying (N = 4937) were chosen for WGCNA network construction. If the genes showed similar expression patterns, they were divided into the same modules by hierarchical average linkage clustering. The selected soft threshold power was shown in Figure 4A for mRNAs. A dynamic tree-cutting algorithm and a merging threshold of 0.25 were utilized to identify eight modules (Figure 4B and C). Notably, the turquoise module was significantly correlated with COPD disease status (r = −0.88, P < 0.01). Figure 4D illustrated the significant association between the MM of the turquoise module and GS for COPD.
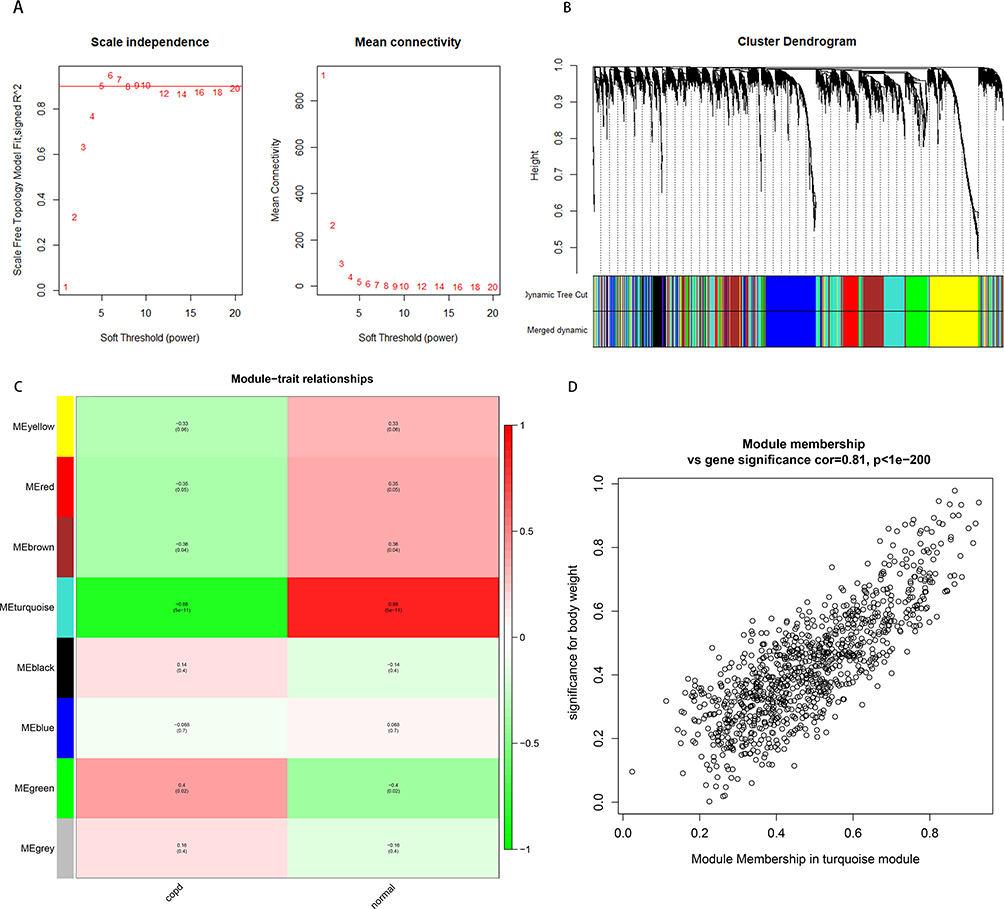 |
Figure 4 Construction of weighted gene co-expression network of mRNA. (A) The scale-free topology model fitting index for soft threshold powers (β) and the average connectivity for soft threshold powers. (B) Gene clustering tree dendrogram, with dissimilarity based on topological overlap in the mRNAs. Each color means one co-expressed module. (C) The heatmap of the 8 module which shows the relationship between module eigengenes and clinical traits. P-value was shown in each color cell. (D) Scatter plot of gene significance and module membership in the turquoise module. |
Similarly, all miRNAs were used for WGCNA network construction. The soft-threshold power of 4 was selected, as depicted in Figure 5A. Subsequently, a cluster dendrogram plot of the gene network was created and displayed in Figure 5B. This enabled the identification of six co-expression modules. Module trait correlation analysis demonstrated that the green module (r = 0.97, P < 0.01) exhibited a statistically significant association with COPD (Figure 5C). Additionally, Figure 5D featured the significant correlation between MM and GS for COPD in the green module.
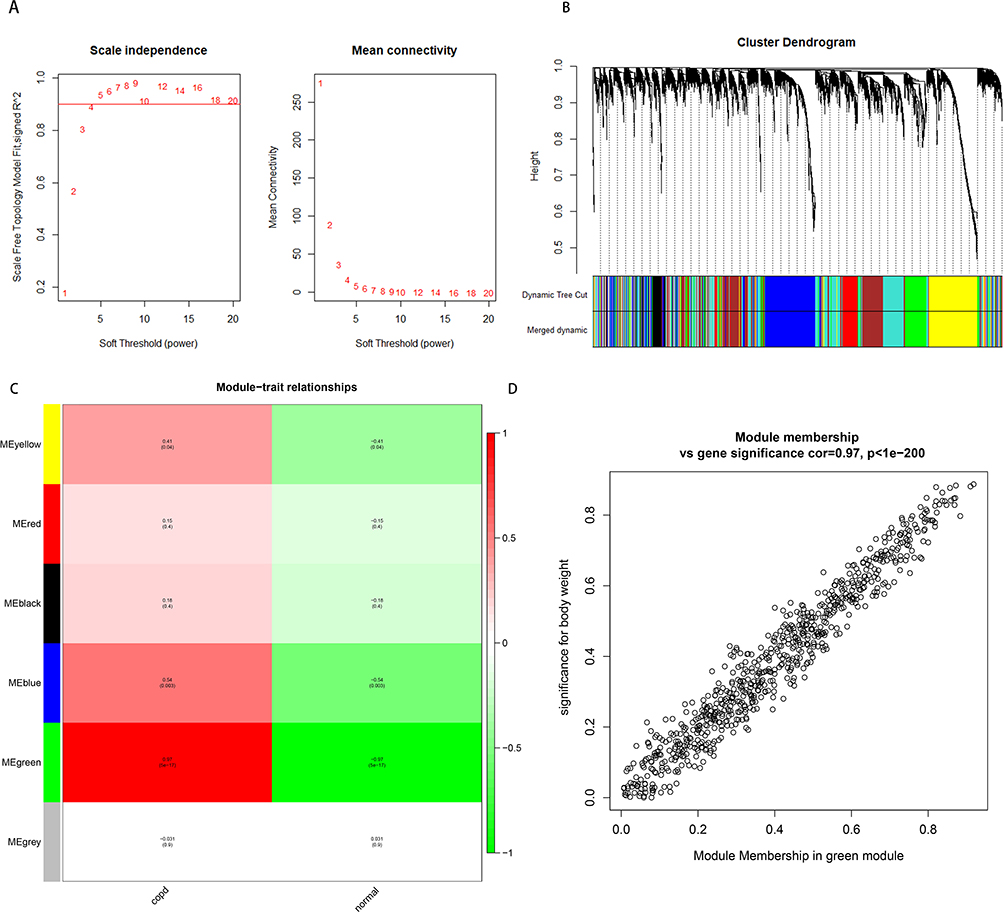 |
Figure 5 Construction of weighted gene co-expression network of miRNA. (A) Analysis of the scale-free topology model fitting index for soft threshold powers (β) and the average connectivity for soft threshold powers. (B) Gene clustering tree dendrogram, with the dissimilarity of topological overlap in the miRNAs. Each color means one co-expressed module. (C) The heatmap of 6 modules shows the relationship between model eigengenes and clinical traits. P-value is shown in each color cell. (D) Scatter plot of gene significance and module membership in green module. |
Sub-Networks
The interaction network of the 10 mRNAs in the ceRNA-network was organized by STRING and visualization by Cytoscape (Figure 6A). The most significantly enriched functions of the 10 mRNAs were summarized in Figure 6B. The shared values of mRNAs in the ceRNA-network and hub-genes recognized by WGCNA including METTL7A, ZNF678, and PRRG4 were visualized in Figure 6C. Their binding miRNAs (hsa-miR-454-3p and has-miR-486-5p) were among the hub miRNAs identified by WGCNA and DEmiRNAs. Moreover, ZNF678, PRRG4, METTL7A, hsa-miR-454-3p and has-miR-486-5p were related to the GOLD stage and FVC group by linear Regression, respectively (Figures S4–7). The linear relationship between mRNA and miRNA was depicted in Figure S8. We filtered the ZNF678, PRRG4 and hsa-miR-454-3p and by Least absolute shrinkage and selection operator regression as well in Figure S9. Thus, one core sub-network: XIST, FGD5-AS1, KCNQ1OT1, HOXA11-AS, LINC00667, H19, PRKCQ-AS1, NUTM2A-AS1/hsa-miR-454-3p/ZNF678, PRRG4 was found (Figure 6D).
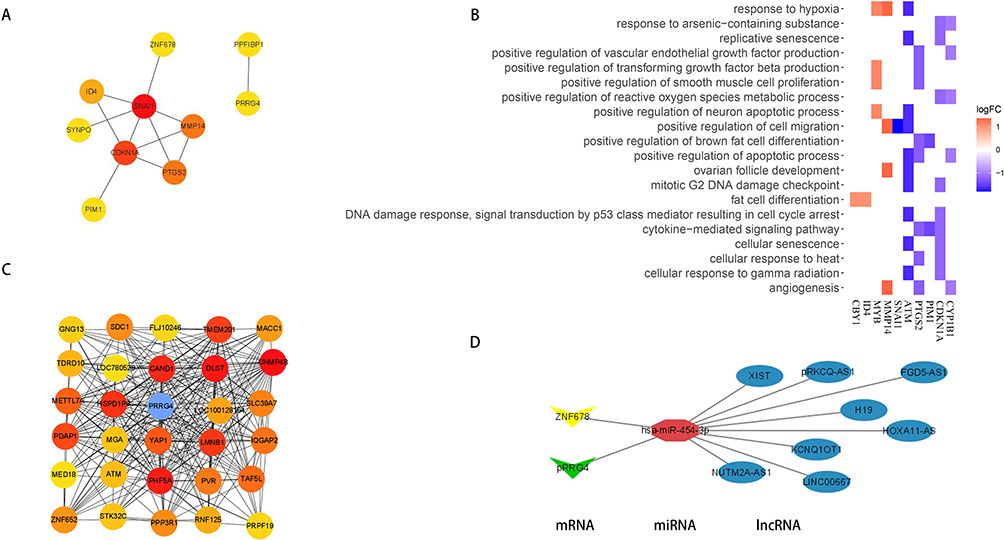 |
Figure 6 The core-ceRNA network of COPD. (A) PPI network of 10 mRNAs in the ceRNA network in Cytoscape software. (B) Heatmap of 10 mRNAs enrichment analysis results in ceRNA network. (C) Top 30 hub mRNAs in the weighted gene co-expression network turquoise module. The point where the mRNA in the ceRNA network overlap is marked in blue. (D) COPD’s core-ceRNA networks included XIST, FGD5-AS1, KCNQ1OT1, HOXA11-AS, LINC00667, H19, PRKCQ-AS1, NUTM2A-AS1/has-mir-454-3p/ZNF678, PRRG4. PPI, protein–protein interaction. |
To further confirm the differential expression levels of hub genes between the control and COPD groups, GSE47460, containing 91 healthy samples and 145 COPD samples, and GSE151052, including 40 healthy samples and 77 COPD samples, were employed. Figure S10 shows that the expression levels of PRRG4 were significantly different between the two groups in the GSE47460 dataset. The expression level of ZNF678 was not measured in this dataset. In the GSE151052 dataset, PRRG4, and ZNF678 were differentially expressed between the control and COPD groups. These results verified that PRRG4 and ZNF678 were the hub genes of COPD.
Immunity Cells Analysis
The proportion of 22 immune cells in all profiles was estimated using the CIBERSORT algorithm, where the p-values obtained for all profiles were <0.05. The proportions of 22 immune cells for all profiles were presented in Figure 7A. Monocytes, T cells CD4 naïve, M2 macrophages, and M0 macrophages constituted the preponderance (Figure 7B and C). In addition, a comparison between COPD and controls revealed differences in terms of immune cell proportions (Figure 7D). The boxplot demonstrated that the COPD group had higher proportions of monocytes and M0 macrophages, as well as lower proportions of resting T cell CD8, NK cells activated, M2 macrophages, and mast cell resting in comparison to the control group. Additionally, the proportions of T cell CD8, NK cells activated, and macrophages M0 were correlated with the GOLD stage of COPD.
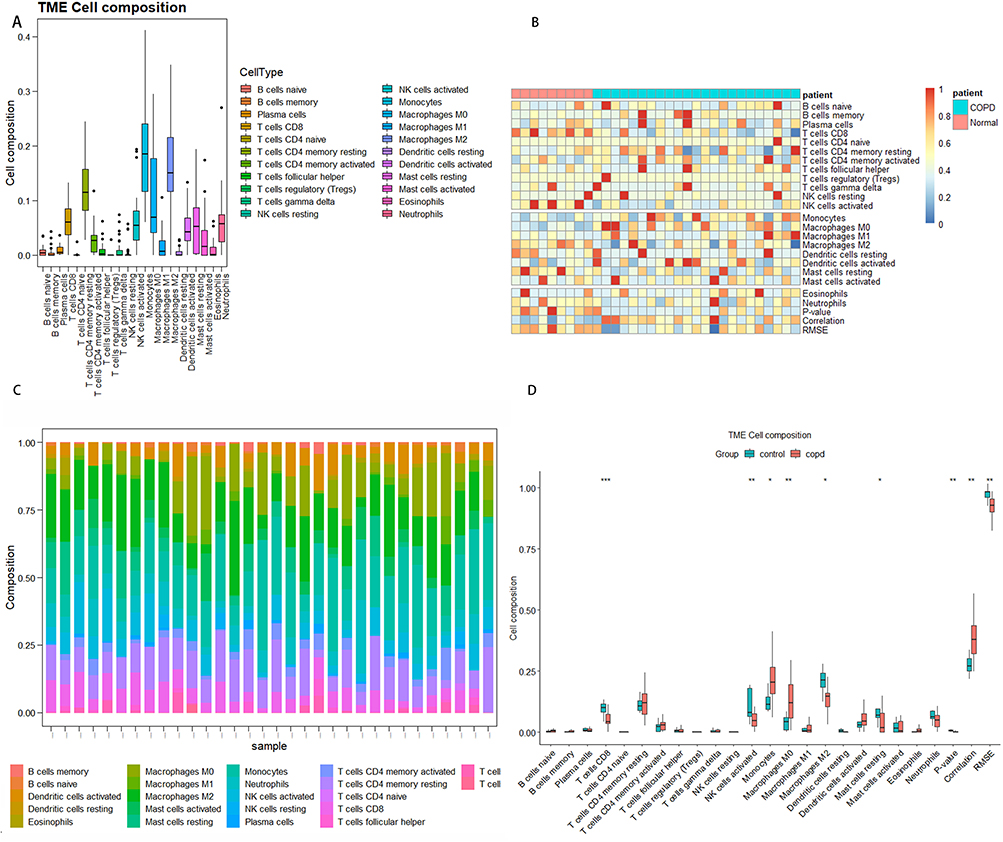 |
Figure 7 The profile of immune infiltration in COPD. (A) Boxplot of 22 immune cells composition in all groups. (B) Heatmap of the 22 immune cells between COPD and healthy smokers as controls. (C) The proportion of 22 immune cells in all groups. The column represents the samples, and the row represents the relative percentages of immune cells. (D) The boxplot shows the composition of different immune cell types between COPD and controls. Red represents COPD patients, while blue represents controls. *p<0.050, ** p<0.01, ***p<0.001. |
Discussion
COPD is a complicated disease that damages both lung parenchyma and extrapulmonary systems.25 Epigenetic mechanisms may play a role in the pathophysiology of COPD and may help to propose potential therapeutic targets.26,27 Compared with proteome biomarkers such as high-degree complex and dynamic proteoforms, RNAs, including mRNAs, lncRNAs, and miRNAs in a transcriptome, are more straightforward and relatively stable, which are able to be the RNA biomarkers for effective COPD management.28,29 In our research, expression profile data derived from the GEO dataset were compared between COPD patients and healthy smokers. To ensure reliable results, hub genes in COPD were identified using the WGCNA to identify connected nodes. Subsequently, a ceRNA-network was constructed, comprising 11 lncRNAs, 5 miRNAs, and 16 mRNAs. One core sub-network: XIST, FGD5-AS1, KCNQ1OT1, HOXA11-AS, LINC00667, H19, PRKCQ-AS1, NUTM2A-AS1/has-mir-454-3p/ZNF678, PRRG4 was obtained.
The COPD patients’ gene expression profiles were previously studied to explore the gene markers from public databases.30–32 ceRNA-network via DEGs analysis in primally of human small airway was constructed.33 In addition, DEGs analysis based on multiple gene expression dataset was also used to construct the ceRNA-network by mRNA expression data.32 However, the confounding factors may decrease the sensitivity and the specificity of the DEGs as the biomarkers for COPD. In comparison to other bioinformatics approaches, WGCNA results are more reliable and have greater clinical value due to the focus on correlations between clinical traits and co-expression modules.23 Genes clustered in the same module are presumed to be functionally related, thus making the outcome more dependable when the common value of DEGs and hub genes obtained through WGCNA is applied. By leveraging biologically related modules and hub genes, there is considerable potential for them to serve as predictive biomarkers for diagnosis or treatment.
The ceRNA-network hypothesis proposes a regulatory mechanism mediated by lncRNAs. In this theory, lncRNAs are used as an endogenous miRNA sponge to regulate mRNAs expression, which has enhanced our comprehension of the transcriptional-level mechanisms of some illnesses but still has disputes in COPD.34 We selected the interaction of miRNA–mRNA by using LncACTdb and miRTarBase database. Owing to the dearth of lncRNA sequencing data of COPD, multiple databases, such as ENCORI, starBase, LncACTdb, and LncBase, were employed to predict miRNA–lncRNA interactions. These databases are built on experimentally supported evidence or statistically predictions, and thus can be deemed reliable. Eventually, we obtained one core ceRNA-network: XIST, FGD5-AS1, KCNQ1OT1, HOXA11-AS, LINC00667, H19, PRKCQ-AS1, NUTM2A-AS1/has-mir-454-3p/ZNF678, PRRG4. The memberships of the ceRNA-network were potentially involved in various inflammation diseases.35,36 XIST was also proved to exacerbate rheumatoid arthritis and systemic lupus erythematosus.37,38 The function of lncRNAs as ceRNAs network was also verified to regulate miRNA–gene interactions in COPD.14,15
The impact of miR-454-3p on inflammation has been widely studied. Notably, lower expression of miR-454-3p was associated with decreased inflammation and regression of cirrhosis during treatment of hepatitis B virus infection.39 Inhibition of miR-454-3p is thought to induce M2 macrophage polarization in glioma.40 Meanwhile, the miR-454-3p suppression attenuated the viability of human aortic endothelial cells, while overexpression of miR-454-3p inhibited the apoptosis of HAEC-induced ox-LDL, thereby affecting the apoptosis of endothelial cells.41 Transmembrane gamma-carboxyglutamic acid protein 4 (PRRG 4), a protein-coding gene has been proved to promote the progression of breast cancer, and enhance metastasis.42 It can also promote autism symptoms of WAGR by perturbing these mechanisms in the developing human brain.43 A recent study also verified that PRRG4 was the main methylation marker of COPD,44 which is verified by our study as well. The potential mechanism of ZNF678 in COPD remains unclear. The susceptibility and severity of COPD vary between different genders.45 In this study, we conducted an analysis of the expression levels of hub mRNA and miRNA between male and female COPD patients. Our analysis revealed differential expression of has-miR-10a-5p and CCDC137 in male and female COPD patients (Figures S11 and 12).
This study revealed that, according to the results of the CIBERSORT algorithm, the lung tissues of COPD patients had higher proportions of monocytes, M0 macrophages, and resting T cell CD8 than healthy smokers, whereas the proportions of NK cells activated, M2 macrophages, and resting mast cell tended to be lower. And T cell CD8, NK cells activated, and macrophages M0 were associated with the severity of COPD. Recently, therapeutic medication that inhibited the inflammatory cascade, chemotaxis, or inflammatory cell activation plays a crucial role to delay the progression of airway remodeling in COPD and to promote the repair of the damaged airway.46 Our data suggested that the differential immune cells in COPD in comparison to controls may provide new targets for the treatment of COPD.
This study was limited by several factors. Firstly, the data for analysis was sourced from GEO online data, thus requiring further experiments to verify the results and assess their underlying medical value. Secondly, only miRNA and mRNA expression profiles of COPD patients were identified, suggesting the need for further research to explore the underlying mechanisms of the disease. Further lncRNA is warranted to verify our results. Thirdly, we did not confirm the interactions between miRNA and mRNA in the ceRNA network. Finally, the potential diagnostic and therapeutic roles of the ceRNA-network in COPD were not explored.
In future research endeavors, we intend to investigate the expression levels of these markers in both in vivo and in vitro experiments, as well as their potential involvement in the pathogenesis of COPD. Furthermore, we may focus on the ceRNA-network member as the diagnostic markers and as therapeutic targets as well. The data have provided clues for further research on the regulation of the potential miRNAs and mRNAs treatment targets in COPD.
Conclusion
Overall, this study centered on understanding the regulatory role of the ceRNA-network in COPD and identified reliable core-ceRNA interaction pairs. The results of the immune infiltration analysis further suggest that immune cells in the lung may indicate the progression of the disease and be involved in the progression of COPD. The study may provide new evidence for the pathogenesis of COPD, although the exact molecular mechanism and regulatory pathways of COPD still need to be further explored.
Data Sharing Statement
All the data used in this study were publicly available at Gene Expression Omnibus (GEO, https://www.ncbi.nlm.nih.gov/geo/).
Acknowledgments
We express our thanks to Miss Moyang Xu of University of Michigan, Ann Arbor, for polishing language and grammar of the manuscript.
Author Contributions
All authors made substantial contributions to conception and design, acquisition of data, or analysis and interpretation of data; took part in drafting the article or revising it critically for important intellectual content; agreed to submit to the current journal; gave final approval of the version to be published; and agree to be accountable for all aspects of the work.
Funding
No funding was received.
Disclosure
The authors report no conflicts of interest in this work.
References
1. Gonçalves I, Guimarães MJ, van Zeller M, Menezes F, Moita J, Simão P; GI DPOC-Grupo de Interesse na Doença Pulmonar Obstrutiva Crónica. Clinical and molecular markers in COPD. Pulmonology. 2018;24(4):250–259. doi:10.1016/j.pulmoe.2018.02.005
2. Halpin DMG, Criner GJ, Papi A, et al. Global initiative for the diagnosis, management, and prevention of chronic obstructive lung disease. The 2020 GOLD Science Committee Report on COVID-19 and chronic obstructive pulmonary disease. Am J Respir Crit Care Med. 2021;203(1):24–36. doi:10.1164/rccm.202009-3533SO
3. Rabe KF, Watz H. Chronic obstructive pulmonary disease. Lancet. 2017;389(10082):1931–1940. doi:10.1016/S0140-6736(17)31222-9
4. Wang C, Xu J, Yang L, et al.; China Pulmonary Health Study Group. Prevalence and risk factors of chronic obstructive pulmonary disease in China (the China Pulmonary Health [CPH] study): a national cross-sectional study. Lancet. 2018;391(10131):1706–1717. doi:10.1016/S0140-6736(18)30841-9
5. Fan Y, Xu W, Wang Y, Wang Y, Yu S, Ye Q. Association of occupational dust exposure with combined chronic obstructive pulmonary disease and pneumoconiosis: a cross-sectional study in China. BMJ Open. 2020;10(9):e038874. doi:10.1136/bmjopen-2020-038874
6. Fan Y, Ma R, Du X, Chai D, Yang S, Ye Q. Small airway dysfunction in pneumoconiosis: a cross-sectional study. BMC Pulm Med. 2022;22(1):167. doi:10.1186/s12890-022-01929-9
7. Silverman EK. Genetics of COPD. Annu Rev Physiol. 2020;82(1):413–431. doi:10.1146/annurev-physiol-021317-121224
8. Mattick JS, Makunin IV. Non-coding RNA. Hum Mol Genet. 2006;15(Suppl 1):R17–R29. doi:10.1093/hmg/ddl046
9. Anastasiadou E, Jacob LS, Slack FJ. Non-coding RNA networks in cancer. Nat Rev Cancer. 2018;18(1):5–18. doi:10.1038/nrc.2017.99
10. Li Y, Yin Z, Fan J, Zhang S, Yang W. The roles of exosomal miRNAs and lncRNAs in lung diseases. Signal Transduct Target Ther. 2019;4(1):47. doi:10.1038/s41392-019-0080-7
11. Thomson DW, Dinger ME. Endogenous microRNA sponges: evidence and controversy. Nat Rev Genet. 2016;17(5):272–283. doi:10.1038/nrg.2016.20
12. Wang Z, Qu S, Zhu J, Chen F, Ma L. Comprehensive analysis of lncRNA-associated competing endogenous RNA network and immune infiltration in idiopathic pulmonary fibrosis. J Thorac Dis. 2020;12(5):1856–1865. doi:10.21037/jtd-19-2842
13. Yan YM, Zheng JN, Wu LW, et al. Prediction of a competing endogenous RNA co-expression network by comprehensive methods in systemic sclerosis-related interstitial lung disease. Front Genet. 2021;12:633059. doi:10.3389/fgene.2021.633059
14. Shen Q, Zheng J, Wang X, Hu W, Jiang Y, Jiang Y. LncRNA SNHG5 regulates cell apoptosis and inflammation by miR-132/PTEN axis in COPD. Biomed Pharmacother. 2020;126:110016. doi:10.1016/j.biopha.2020.110016
15. Liu P, Zhang H, Zeng H, et al. LncRNA CASC2 is involved in the development of chronic obstructive pulmonary disease via targeting miR-18a-5p/IGF1 axis. Ther Adv Respir Dis. 2021;15:17534666211028072. doi:10.1177/17534666211028072
16. Feghali-Bostwick CA, Gadgil AS, Otterbein LE, et al. Autoantibodies in patients with chronic obstructive pulmonary disease. Am J Respir Crit Care Med. 2008;177(2):156–163. doi:10.1164/rccm.200701-014OC
17. Laucho-Contreras ME, Polverino F, Gupta K, et al. Protective role for club cell secretory protein-16 (CC16) in the development of COPD. Eur Respir J. 2015;45(6):1544–1556. doi:10.1183/09031936.00134214
18. Hogg JC, Timens W. The pathology of chronic obstructive pulmonary disease. Annu Rev Pathol. 2009;4(1):435–459. doi:10.1146/annurev.pathol.4.110807.092145
19. Li JH, Liu S, Zhou H, Qu LH, Yang JH. StarBase v2.0: decoding miRNA-ceRNA, miRNA-ncRNA and protein-RNA interaction networks from large-scale CLIP-Seq data. Nucleic Acids Res. 2014;42(Database issue):D92–D97. doi:10.1093/nar/gkt1248
20. Karagkouni D, Paraskevopoulou MD, Tastsoglou S, et al. DIANA-LncBase v3: indexing experimentally supported miRNA targets on non-coding transcripts. Nucleic Acids Res. 2020;48(D1):D101–D110. doi:10.1093/nar/gkz1036
21. Wang P, Li X, Gao Y, et al. LncACTdb 2.0: an updated database of experimentally supported ceRNA interactions curated from low- and high-throughput experiments. Nucleic Acids Res. 2019;47(D1):D121–D127. doi:10.1093/nar/gky1144
22. Huang HY, Lin YC, Li J, et al. miRTarBase 2020: updates to the experimentally validated microRNA-target interaction database. Nucleic Acids Res. 2020;48(D1):D148–D154.
23. Langfelder P, Horvath S. WGCNA: an R package for weighted correlation network analysis. BMC Bioinform. 2008;9(1):559. doi:10.1186/1471-2105-9-559
24. Newman AM, Liu CL, Green MR, et al. Robust enumeration of cell subsets from tissue expression profiles. Nat Methods. 2015;12(5):453–457. doi:10.1038/nmeth.3337
25. Han MK, Agusti A, Calverley PM, et al. Chronic obstructive pulmonary disease phenotypes: the future of COPD. Am J Respir Crit Care Med. 2010;182(5):598–604. doi:10.1164/rccm.200912-1843CC
26. Schamberger AC, Mise N, Meiners S, Eickelberg O. Epigenetic mechanisms in COPD: implications for pathogenesis and drug discovery. Expert Opin Drug Discov. 2014;9(6):609–628. doi:10.1517/17460441.2014.913020
27. Wu DD, Song J, Bartel S, Krauss-Etschmann S, Rots MG, Hylkema MN. The potential for targeted rewriting of epigenetic marks in COPD as a new therapeutic approach. Pharmacol Ther. 2018;182:1–14. doi:10.1016/j.pharmthera.2017.08.007
28. Serban KA, Pratte KA, Bowler RP. Protein biomarkers for COPD outcomes. Chest. 2021;159(6):2244–2253. doi:10.1016/j.chest.2021.01.004
29. Li N, Zhan X. Identification of clinical trait-related lncRNA and mRNA biomarkers with weighted gene co-expression network analysis as useful tool for personalized medicine in ovarian cancer. EPMA J. 2019;10(3):273–290. doi:10.1007/s13167-019-00175-0
30. Zeng N, Wang T, Chen M, et al. Cigarette smoke extract alters genome-wide profiles of circular RNAs and mRNAs in primary human small airway epithelial cells. J Cell Mol Med. 2019;23(8):5532–5541. doi:10.1111/jcmm.14436
31. Duan R, Niu H, Yu T, et al. Identification and bioinformatic analysis of circular RNA expression in peripheral blood mononuclear cells from patients with chronic obstructive pulmonary disease. Int J Chron Obstruct Pulmon Dis. 2020;15:1391–1401. doi:10.2147/COPD.S252896
32. Guan Q, Tian Y, Zhang Z, Zhang L, Zhao P, Li J. Identification of potential key genes in the pathogenesis of chronic obstructive pulmonary disease through bioinformatics analysis. Front Genet. 2021;12:754569. doi:10.3389/fgene.2021.754569
33. Rab A, Rowe SM, Raju SV, Bebok Z, Matalon S, Collawn JF. Cigarette smoke and CFTR: implications in the pathogenesis of COPD. Am J Physiol Lung Cell Mol Physiol. 2013;305(8):L530–L541. doi:10.1152/ajplung.00039.2013
34. Acha-Sagredo A, Uko B, Pantazi P, et al. Long non-coding RNA dysregulation is a frequent event in non-small cell lung carcinoma pathogenesis. Br J Cancer. 2020;122(7):1050–1058. doi:10.1038/s41416-020-0742-9
35. Chen H, Lan Z, Li Q, Li Y. Abnormal expression of long noncoding RNA FGD5-AS1 affects the development of periodontitis through regulating miR-142-3p/SOCS6/NF-κB pathway. Artif Cells Nanomed Biotechnol. 2019;47(1):2098–2106. doi:10.1080/21691401.2019.1620256
36. Ye B, Wu ZH, Tsui TY, et al. lncRNA KCNQ1OT1 suppresses the inflammation and proliferation of vascular smooth muscle cells through IκBa in intimal hyperplasia. Mol Ther Nucleic Acids. 2020;20:62–72. doi:10.1016/j.omtn.2020.01.032
37. Bost C, Arleevskaya MI, Brooks WH, Plaza S, Guery JC, Renaudineau Y. Long non-coding RNA Xist contribution in systemic lupus erythematosus and rheumatoid arthritis. Clin Immunol. 2022;236:108937. doi:10.1016/j.clim.2022.108937
38. Yu B, Qi Y, Li R, Shi Q, Satpathy AT, Chang HY. B cell-specific XIST complex enforces X-inactivation and restrains atypical B cells. Cell. 2021;184(7):1790–1803.e17. doi:10.1016/j.cell.2021.02.015
39. Orr C, Myers R, Li B, et al. Longitudinal analysis of serum microRNAs as predictors of cirrhosis regression during treatment of hepatitis B virus infection. Liver Int. 2020;40(7):1693–1700. doi:10.1111/liv.14474
40. Qi B, Yang C, Zhu Z, Chen H. EZH2-inhibited MicroRNA-454-3p promotes M2 macrophage polarization in glioma. Front Cell Dev Biol. 2020;8:574940. doi:10.3389/fcell.2020.574940
41. Liao L, Yang Q, Li H, Meng R, Li Y. Li Y. miR-454-3p prevents ox-LDL-induced apoptosis in HAECs by targeting TRPC3. Exp Ther Med. 2021;21(4):323. doi:10.3892/etm.2021.9754
42. Zhang L, Qin Y, Wu G, et al. PRRG4 promotes breast cancer metastasis through the recruitment of NEDD4 and downregulation of Robo1. Oncogene. 2020;39(49):7196–7208. doi:10.1038/s41388-020-01494-7
43. Justice ED, Barnum SJ, Kidd T. The WAGR syndrome gene PRRG4 is a functional homologue of the commissureless axon guidance gene. PLoS Genet. 2017;13(8):e1006865. doi:10.1371/journal.pgen.1006865
44. Lin J, Xue Y, Su W, Zhang Z, Wei Q, Huang T. Identification of Dysregulated mechanisms and candidate gene markers in chronic obstructive pulmonary disease. Int J Chron Obstruct Pulmon Dis. 2022;17:475–487. doi:10.2147/COPD.S349694
45. Ghosh B, Chengala PP, Shah S, et al. Cigarette smoke-induced injury induces distinct sex-specific transcriptional signatures in mice tracheal epithelial cells. Am J Physiol Lung Cell Mol Physiol. 2023;325(4):L467–L476. doi:10.1152/ajplung.00104.2023
46. Bu T, Wang LF, Yin YQ. How Do Innate immune cells contribute to airway remodeling in COPD progression? Int J Chron Obstruct Pulmon Dis. 2020;15:107–116. doi:10.2147/COPD.S235054
 © 2023 The Author(s). This work is published and licensed by Dove Medical Press Limited. The
full terms of this license are available at https://www.dovepress.com/terms
and incorporate the Creative Commons Attribution
- Non Commercial (unported, 3.0) License.
By accessing the work you hereby accept the Terms. Non-commercial uses of the work are permitted
without any further permission from Dove Medical Press Limited, provided the work is properly
attributed. For permission for commercial use of this work, please see paragraphs 4.2 and 5 of our Terms.
© 2023 The Author(s). This work is published and licensed by Dove Medical Press Limited. The
full terms of this license are available at https://www.dovepress.com/terms
and incorporate the Creative Commons Attribution
- Non Commercial (unported, 3.0) License.
By accessing the work you hereby accept the Terms. Non-commercial uses of the work are permitted
without any further permission from Dove Medical Press Limited, provided the work is properly
attributed. For permission for commercial use of this work, please see paragraphs 4.2 and 5 of our Terms.