Back to Journals » Clinical Epidemiology » Volume 15
Completeness and Representativeness of the PHARMO General Practitioner (GP) Data: A Comparison with National Statistics
Authors Overbeek JA ![]() , Swart KMA, Houben E
, Swart KMA, Houben E ![]() , Penning-van Beest FJA, Herings RMC
, Penning-van Beest FJA, Herings RMC
Received 15 September 2022
Accepted for publication 16 December 2022
Published 5 January 2023 Volume 2023:15 Pages 1—11
DOI https://doi.org/10.2147/CLEP.S389598
Checked for plagiarism Yes
Review by Single anonymous peer review
Peer reviewer comments 3
Editor who approved publication: Professor H Sorensen
Jetty A Overbeek, Karin MA Swart, Eline Houben, Fernie JA Penning-van Beest, Ron MC Herings
Department Research, PHARMO Institute for Drug Outcomes Research, Utrecht, the Netherlands
Correspondence: Jetty A Overbeek, Department Research, PHARMO Institute for Drug Outcomes Research, Van Deventerlaan 30-40, Utrecht, 3528 AE, the Netherlands, Tel +3130 7440 800, Email [email protected]
Purpose: When using incomplete or non-representative real-world data (RWD), bias is more likely to occur. The aim of the current study was to assess the completeness and representativeness of the PHARMO GP data for the Dutch population.
Patients and Methods: A cross-sectional study was performed. The PHARMO GP data comprise data from electronic health records registered by GPs. Data on the Dutch population were obtained from Statistics Netherlands (CBS), which offers publicly available data on several themes. The standardized difference (std.diff) was used to compare proportions between the PHARMO GP population and the Dutch population. An absolute std.diff > 0.2 was considered a difference.
Results: On January 1st, 2018, 3,466,321 persons were included in the PHARMO GP data (mean age: 41.6 years, 49.7% males). The sex and age distribution was similar to the Dutch population. The PHARMO GP data captured less not urbanized areas compared to the Dutch population (not urbanized areas: 9.4% vs 17.1% [std.diff: − 0.23]). Regarding medication use, only the pharmacological subgroups “viral vaccines” and “hormonal contraceptives for systemic use” differed (std.diff > 0.2); use in the GP data was more complete than in the Statistics Netherlands (CBS) data. No differences were observed regarding diagnoses.
Conclusion: The PHARMO GP data are representative of the Dutch population with regard to the demographic characteristics and diagnoses in primary care. Medication data in the PHARMO GP data are more complete than national statistics, and differences are related to reimbursement. Use of the data and interpretation of results based on these sources should be done with experts on the data sources, the Dutch healthcare system and (pharmaco)epidemiology.
Keywords: data quality, completeness, representativeness, RWD, real-world evidence, PHARMO GP data
Introduction
Evidence from real-world data (RWD) plays an increasing role in healthcare decisions.1 Real-world evidence (RWE) is evidence obtained from observational data generated during routine clinical practice. It can provide insight into the uptake, utilization, accessibility, effectiveness, long-term safety, real-world costs and cost-effectiveness of health products not often studied in clinical trials.2,3
However, when using incomplete or non-representative RWD, there is more potential for bias,4 especially when the outcome of interest or its early signs affect the probability of baseline selection.5 Therefore, the completeness and representativeness of RWD are pivotal to describe populations and treatments validly, to obtain generalizable results and to draw conclusions without selection and information bias.6
The PHARMO Data Network is a network of data from different primary and secondary healthcare settings in the Netherlands and is created and maintained by “Stichting Informatievoorziening voor Zorg en Onderzoek” (STIZON).7,8 The general practitioner (GP) data of the PHARMO Data Network is widely used for (pharmaco)epidemiological research in different therapeutic areas, such as oncology,9 diabetes,10 nephrology,11 cardiovascular diseases,12 and respiratory diseases.13 In the Dutch healthcare system, nearly every citizen is enrolled in the practice of a GP. In addition, the GP is gatekeeper to hospital- and specialist care. GP care in the Netherlands is considered to be a well-organized care system that provides comprehensive care for all citizens.14 Despite its many uses, its completeness and representativeness have not been described before.
The objective of the current study therefore was to assess the completeness and representativeness of the PHARMO GP data for the general Dutch population. Specifically, we compared demographic characteristics, medication use, diagnoses and death statistics from the PHARMO GP data with similar statistics from the Dutch population.
Materials and Methods
Study Design
The completeness and representativeness were determined using a cross-sectional design.
Study Period
The cross-sectional design was carried out three times; once at the beginning of the data collection (ie, 2006), once halfway through the data collection (ie, 2012), and once at the end of the data collection (ie, 2018). Demographic characteristics were determined at January 1st of each year. Medication and diagnoses were determined during the three different years (ie, between January 1st and December 31st).
Data Sources
PHARMO GP Data
GP data was obtained from the PHARMO Data Network,7 which comprises data from electronic patient records registered by GPs. The records include information on diagnoses and symptoms, laboratory test results, referrals to specialists and healthcare product/drug prescriptions. The prescription records include information on type of product, prescription date, strength, dosage regimen, quantity and route of administration. Drug prescriptions are coded according to the World Health Organisation (WHO) Anatomical Therapeutic Chemical (ATC) Classification System.15 Diagnoses and symptoms are coded according to the International Classification of Primary Care (ICPC), which can be mapped to International Classification of Diseases (ICD) codes, but can also be entered as free text.16 Since 2004, the GP data have experienced a substantial growth. On December 31st, 2004, it contained information from about 235 general practices with approximately 1 million registered people. By December 31st, 2020, this had grown to 879 practices with almost 5 million registered people. Currently, all practices have provided their data at least until December 31st, 2018.
Dutch Population
Data on the Dutch population was obtained from “Centraal Bureau voor de Statistiek” (CBS), hereafter referred to as Statistics Netherlands (CBS). Statistics Netherlands (CBS) is an autonomous agency with the mandate to collect and process data. It offers publicly available data from different sources on several themes, such as “Population” and “Health and welfare”. Tables and news releases are published daily with the latest information based on data from Statistics Netherlands (CBS).17 For the current study, the following data from Statistics Netherlands (CBS) was used: the population size by sex and age, the proportion of persons to whom drugs were dispensed, and the proportion of persons who were known to their own GP with certain complaints, symptoms or diseases.
Statistics Netherlands (CBS) obtains information on population numbers by sex and age from the population register of all Dutch municipalities.
The proportion of persons to whom drugs were dispensed is derived from the National Health Care Institute of the Netherlands. This institute receives national data from the health insurers about all drugs dispensed per person that are reimbursed by the basic health insurance.
The data regarding persons who were known to their own GP with certain complaints, symptoms or diseases come from the Nivel Primary Care Database (Nivel). Nivel uses routinely recorded data from healthcare providers to monitor health and utilization of health services in a sample of the Dutch population.18 In 2018, the Nivel Primary Care Database contained information from about 419 general practices with a total of about 1.7 million registered patients. The age and sex distribution of this sample was representative of the Dutch population.19 Data from the Nivel Primary Care Database is used for several purposes, including for the website VZinfo.nl, which provides information on public health and care commissioned by the Ministry of Health, Welfare and Sport.20
Representativeness of Demographic Characteristics
Sex, age, and degree of urbanisation at January 1st of 2006, 2012, and 2018 and death during 2006, 2012, and 2018 were determined among all people registered and alive in the GP data on January 1st of 2006, 2012, and 2018. Similar statistics were obtained from Statistics Netherlands (CBS).21 Because information regarding diagnoses was based on data from Nivel, the sex and age distribution of the Nivel population at January 1st of 2018 is presented as well. Degree of urbanisation was categorised in five degrees based on the surrounding address density per square kilometre. The surrounding address density is the average number of addresses per square kilometre with a radius of one kilometre.22 For both sources, the proportion of deaths was calculated by dividing the number of persons who died during the year by the number of people registered and alive in the source on January 1st of that year.
Completeness of Medication Data
As the medication data in Statistics Netherlands (CBS) and the PHARMO GP data already differ a priori (Statistics Netherlands (CBS) contains reimbursed medication and the PHARMO GP data contain prescribed medication), we cannot speak of representativeness, but we can study completeness.
In Statistics Netherlands (CBS), the proportion of persons to whom drugs were dispensed was calculated among the population of all patients who were registered in the “Basisregistratie Personen” (BRP), ie, Personal Records Database, at any time during the reporting year, by dividing the number of persons to whom drugs were dispensed that are reimbursed by the basic health insurance by the total number of persons.23 In the PHARMO GP data, the number of persons who were eligible anywhere in the reporting year and to whom a drug was prescribed by the GP was divided by the total number of persons who were eligible anywhere in the reporting year to obtain the proportion of persons to whom drugs were dispensed.
Analyses were performed at the most detailed level in order to prevent detailed differences from being smoothed out at a higher level. The most detailed available level in Statistics Netherlands (CBS) was the 3rd level of ATC codes (ie, pharmacological subgroup).
Representativeness of Diagnoses
The data from Statistics Netherlands (CBS) regarding the proportion of persons who were known to their own GP with certain complaints, symptoms or diseases come from Nivel.18 For this purpose, all activities of the GP around a particular complaint with which the patient approaches the GP, including prescriptions and referrals to other disciplines, have been processed into disease episodes. The methodology of constructing these disease episodes is described in more detail elsewhere.24 The proportion of people who had a diagnosis at any time during the year was calculated by dividing the number of people who had a diagnosis at any time during the year (defined as an open/active episode in the reporting year) by the number of person years of the population, ie, the total number of registered days of the population. In the PHARMO GP data, disease episodes were created for 2006, 2012 and 2018 and the proportion of people who had a diagnosis was calculated based on the same methodology as Nivel.24
Information was available in both Statistics Netherlands (CBS) and PHARMO GP data for 81 individual ICPC codes (eg, T90) and for 15 grouped ICPC codes (eg, K78-K80).
Statistical Analyses
For each year, the distribution of age, sex and degree of urbanisation and the proportion deceased in the PHARMO GP data were compared with the distributions of Statistics Netherlands (CBS) using the standardized difference (std.diff). Furthermore, the distribution of 5-year age groups per sex at January 1st in the GP data and the Netherlands is presented as population pyramids.
Per year and per pharmacological subgroup, the proportion of people with a prescription based on the PHARMO GP data was compared to the proportion of people with a dispensing based on Statistics Netherlands (CBS). Per year and per individual ICPC and grouped ICPCs, the proportion of people with a diagnosis based on PHARMO GP data was compared to the proportion of people with a diagnosis based on Statistics Netherlands (CBS). As we did not expect differences in the results between the studied years and to keep the number of tables and figures limited, only the results of 2018 are presented in tables and figures. The results of 2006 and 2012 are presented in the Supplementary File.
The completeness and representativeness were assessed by comparing the above mentioned proportions between the Statistics Netherlands (CBS) and the PHARMO GP data using the std.diff, a measure of the balance of characteristics between groups:
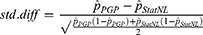
Where PGP = PHARMO GP data and StatNL = Statistics Netherlands (CBS). Absolute values of the std.diff of 0.2, 0.5, and 0.8 roughly correspond to small, medium, and large differences, respectively.25 In order to be somewhat conservative and detect small changes, differences with an absolute values of the std.diff >0.2 were considered to be incomplete or non-representative.
Results
During 2004–2020, the population of the PHARMO GP data increased from approximately 300,000 on January 1st, 2004 to almost 4.7 million on December 31st, 2020 (Figure 1). The median (interquartile range [IQR]) follow-up per person is 10.4 (5.1–14.0) years, resulting in more than 46 million person-years currently in the data.
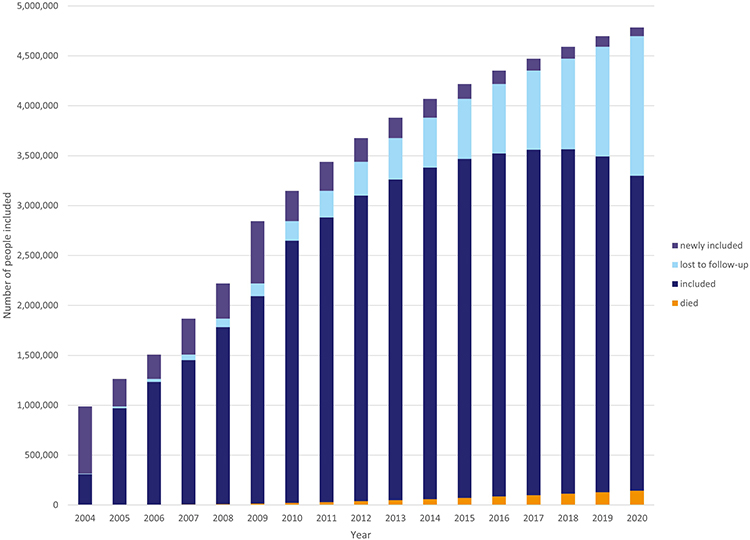 |
Figure 1 Number of persons registered in the PHARMO GP data at each year (2004–2020). |
Representativeness of Demographic Characteristics
In 2018, 80% (n = 3,578,528) of the included people were still active and 20% was lost to follow-up (ie, changed to a GP practice that was not (or no longer) participating in STIZON) or died. For the patients active at January 1st (N = 3,466,321), demographic characteristics were compared with those of the Dutch population and the Nivel population on January 1st, 2018 (Table 1). Figure 2 depicts the population pyramids of the population of the PHARMO GP data and the Dutch population.
 |
Table 1 Demographic Characteristics of the Population in PHARMO GP Data, the Netherlands and Nivel at January 1st, 2018 |
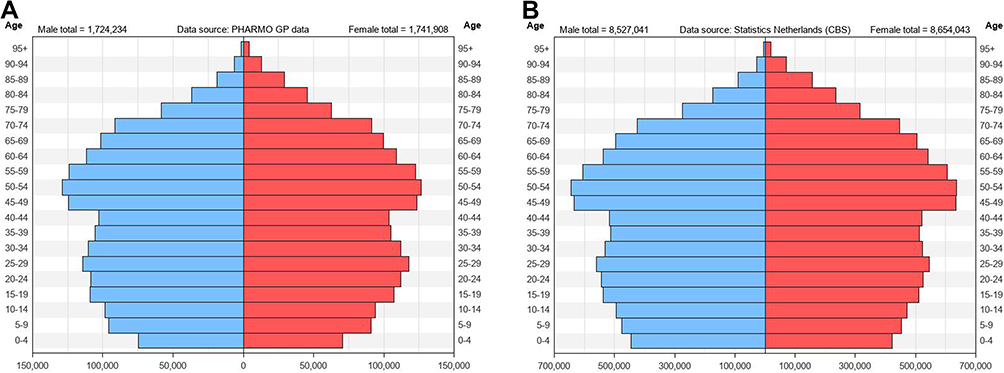 |
Figure 2 Population pyramid of the PHARMO GP population (A) and the Dutch population (B) at January 1st, 2018. |
The sex distribution in the GP population was representative of the Dutch population; half of the people were male (49.7% vs 49.6% [std.diff: 0.00]). The proportion of people 0–4 years in the GP data was slightly lower compared to the Dutch population, but not different according to the std.diff (4.2% vs 5.1% [std.diff: −0.04]). The PHARMO GP data captured less not urbanized areas compared to the Dutch population (not urbanized areas: 9.4% vs 17.1% [std.diff: −0.23]). Although no difference existed based on the std.diff, the proportion of deaths in 2018 in the Netherlands was two times higher than in 2018 in the GP data. For 2006 and 2012, similar results regarding demographic characteristics were observed.
Completeness of Medication Data
For 2006, the std.diffs for the different pharmacological subgroups ranged from −0.12 to 0.24. Only the subgroup “viral vaccines” differed between the PHARMO GP data and the Statistics Netherlands (CBS) data. Its use was more complete in the PHARMO GP data than in the Statistics Netherlands (CBS) data (3.3% vs 0.2% [absolute std.diff: 0.24]). For 2012, the std.diffs ranged from −0.08 to 0.30. Only the subgroups “viral vaccines” and “hormonal contraceptives for systemic use” differed between the PHARMO GP data and the Netherlands. Again, use of these subgroups was more complete in the PHARMO GP data (“viral vaccines”: 4.5% vs 0.1% [std.diff: 0.30] and “hormonal contraceptives for systemic use”: 7.9% vs 3.1% [std.diff: 0.21]). For 2018, the std.diffs ranged from −0.04 to 0.26. Figure 3 presents the percentage of persons with medicines of pharmacological subgroups in 2018. For presenting purposes, only pharmacological subgroups with an absolute std.diff ≥0.05 are presented. Again, only the subgroups “viral vaccines” and “hormonal contraceptives for systemic use” differed (std.diff: 0.26 for both subgroups) between the PHARMO GP data and the Statistics Netherlands (CBS) data and use was more complete in the PHARMO GP Data. In 2018, the overall use of hormonal contraceptives for systemic use was 2.1% in the Dutch population and 7.7% based on the PHARMO GP data. Less than 0.1% of the Dutch population was vaccinated with a viral vaccine in 2018 according to information from the National Health Care Institute of the Netherlands. Based on PHARMO GP data, this was 3.3%.
 |
Figure 3 Medication use per pharmacological subgroup (ATC 3rd level) in the PHARMO GP data and the Netherlands in 2018 with absolute std.diff ≥0.05. |
Representativeness of Diagnoses
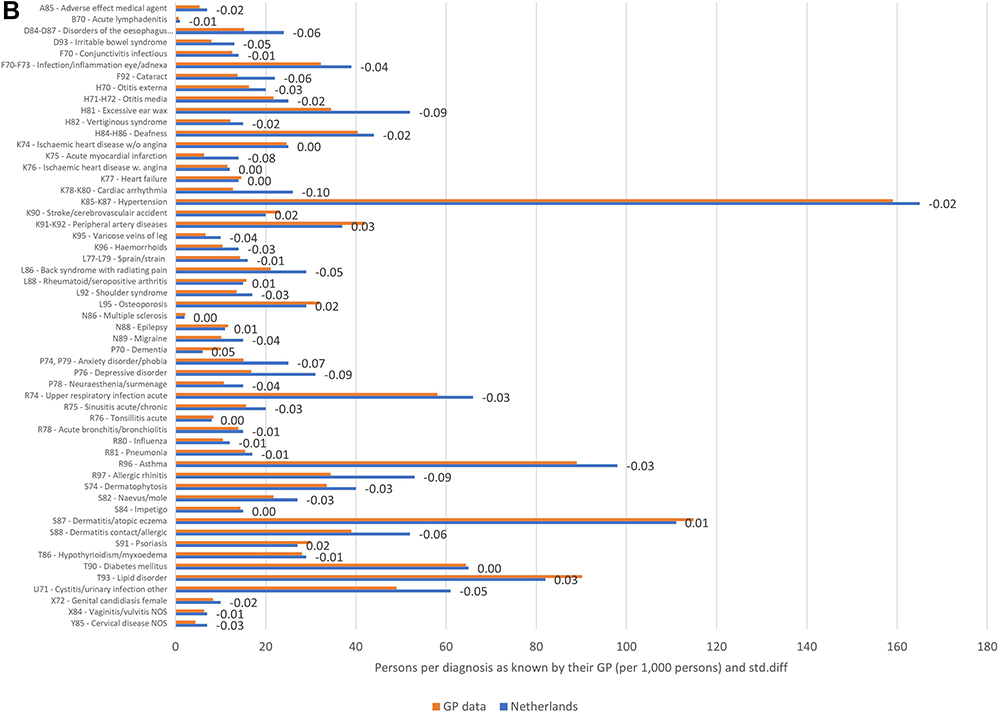
No information was available in Statistics Netherlands (CBS) regarding 2006. For 2012, the std.diffs for the individual and grouped ICPC codes ranged from −0.13 to 0.12. For 2018, the number of persons per 1000 persons with a diagnosis for “contraception (female)” was higher in the data from Statistics Netherlands (CBS) compared to the GP data (71 vs 43 per 1000 persons, retrospectively). Furthermore, the std.diffs for the individual and grouped ICPC codes ranged from −0.12 to 0.05. Figure 4 presents the number of persons per 1000 persons per diagnosis as known by their GP in 2018 (Figure 4A for symptoms and complaints and Figure 4B for diagnoses).
Figure 4 Continued. Figure 4 Symptoms and complaints (A) and diagnoses (B) per ICPC level in the PHARMO GP data and the Netherlands in 2018.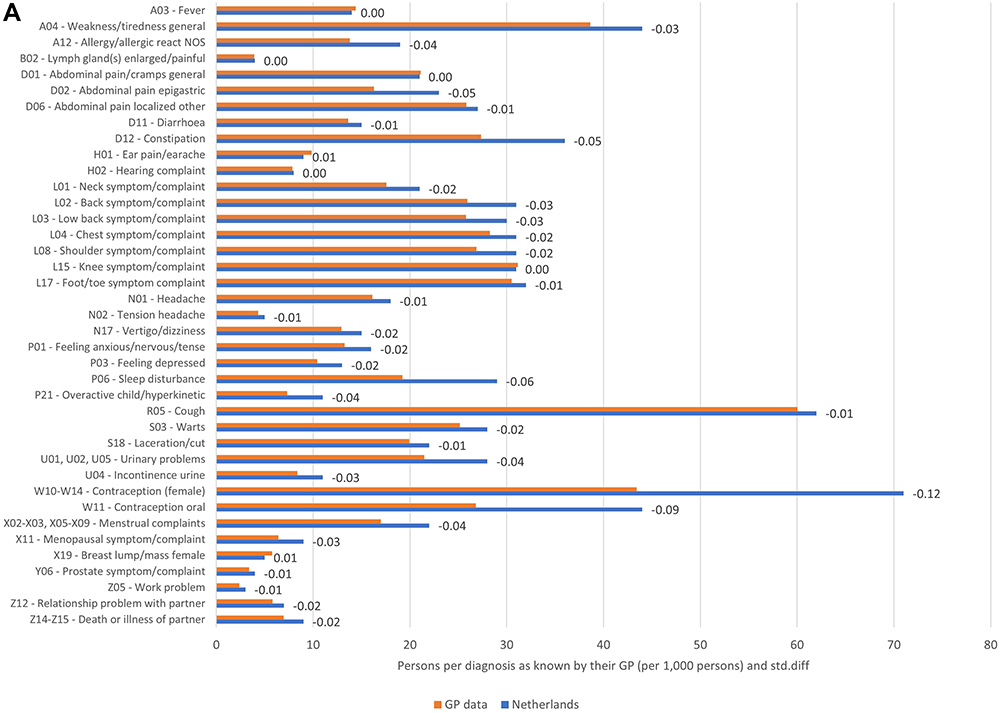
Discussion
The results of this cross-sectional study showed that the PHARMO GP data are representative of the Dutch population with regard to the demographic characteristics and diagnoses in primary care. Medication data in the PHARMO GP data are more complete than national statistics.
As of January 1st, 2018, ~20% of the Dutch population was registered as being present in the PHARMO GP data. As it is mandatory to be registered with a GP in the Netherlands, the PHARMO GP data include nearly all Dutch residents of the catchment area. With this study, we demonstrated that this 20% is representative of the entire Dutch population in terms of age and sex. For most degrees of urbanisation, there was no difference either, except for “not urbanized”. The PHARMO GP data captured less not urbanized areas compared to the Dutch population. Despite this difference, it is not likely that this will affect study results or conclusions using the PHARMO GP data, as the entire country of the Netherlands is highly urbanised.26 A large proportion of the Dutch live in cities or in the suburban centres around them. Rural areas are also largely in the direct sphere of influence of cities and residents make ample use of urban facilities.26 Although not considered as a difference based on the std.diff, the proportion of deaths in 2018 in the Netherlands was two times higher than in 2018 in the PHARMO GP data. This finding is in line with expectations, as persons who die are more often older and no longer under the care of a GP (ie, aged care). In 2019, about 40% of all deceased people were no longer under the care of a GP at the time of death.27
In the studied years, 2 of the 267 pharmacological subgroups were different based on the std.diff. The use of “viral vaccines” and “hormonal contraceptives for systemic use” in the PHARMO GP data was substantially higher than in the Dutch population according to the National Health Care Institute of the Netherlands, which is the source for mapping medication use in the Dutch population. For both subgroups, the observed differences are related to reimbursement. The National Health Care Institute receives data from the health insurers about all drugs dispensed per person that are reimbursed by the basic health insurance. The PHARMO GP data include both non-reimbursed and reimbursed medication. Based on information from the PHARMO GP data, where entire ATC codes are available, the majority of those vaccinated with a viral vaccination received an influenza vaccine (84%). In the Netherlands, the influenza vaccine is reimbursed for specific risk groups, but is not reimbursed through the basic health insurance law. These vaccines can therefore not be found in the tables of Statistics Netherlands (CBS) but are included in the PHARMO GP data. The difference in use for “hormonal contraceptives for systemic use” is explained by the fact that, since January 1st, 2011, its use is no longer reimbursed from the age of 21 years onwards (Figures S1, S4 and S8).28
In general, medication use in the PHARMO GP data was more complete than in the Statistics Netherlands (CBS) data. In addition to the aforementioned reimbursement explanation, there are other arguments as to why the results differ. The PHARMO GP data include prescribed medication, while the National Health Care Institute includes dispensed medication and not all prescribed medication is dispensed.29
Regarding the number of persons per diagnosis as known by their GP, no differences were observed between the PHARMO GP data and the Statistics Netherlands (CBS) data based on the std.diffs. The same methodology was used, and the underlying populations were similar in terms of age and sex. Statistics Netherlands (CBS) obtains the data regarding diagnoses from Nivel, which has information from about 1.7 million registered patients (10% of the Dutch population).19
Even though there were no differences based on the std.diffs, in general, the number of persons per diagnosis as known by their GP was higher based on Statistics Netherlands (CBS) than using PHARMO GP data, especially for the diagnoses regarding “contraception (female)”. The data from Statistics Netherlands (CBS) only include general practices with sufficient quality of the supplied data. Several quality criteria are applied in order to select these practices, for instance “registering an ICPC code in at least 70% of all care episodes/contacts with the GP practice”. As GPs are not obliged to record diagnoses with an ICPC, this quality criterion ensures that GPs, who fill in an ICPC code less frequently, do not decrease the number of persons per diagnosis as known by their GP when basing this on ICPC. However, it does not necessarily mean that the included practices fully record all diagnoses by entering the ICPC. When calculating the number of persons per diagnosis as known by their GP based on PHARMO GP data, these quality criteria were not applied, because the objective was to determine the completeness and representativeness of the entire PHARMO GP data. The quality criteria may also explain the difference between the diagnoses of “contraception (female)”.
Conclusion
Overall, the GP data of the PHARMO Data Network are representative of the Dutch population with regard to the demographic characteristics and diagnoses in primary care. Medication data in the PHARMO GP data are more complete than national statistics, which makes it a reliable source for studies to provide RWE. It remains important to consider whether the data from these sources are valid for the Dutch population as limitations do exist. When using data from Statistics Netherlands (CBS) or PHARMO GP data regarding medication use and/or diagnoses, it should be kept in mind that these data only concern primary care. Use of the data and interpretation of study results based on these sources should be done with experts on the data sources, the Dutch healthcare system and (pharmaco)epidemiology.
Data Sharing Statement
Requests for sharing study data must be made on specific grounds either with the aim to corroborate the study results in the interest of Public Health or in the context of an audit by a competent authority. Sufficient information needs to be provided to confirm that the request is made for one of the above-mentioned purposes, including a wound justification and, in case of a request with a view to corroborate study results, a protocol on the research for which the data will be used or a plan for quality control checks, as applicable.
Ethics Approval and Informed Consent
The institutional review board of STIZON, Utrecht, Netherlands approved the study (Document no.: CC2021-34, date: November 25th, 2021).
Acknowledgments
The authors would like to thank all the healthcare providers contributing information to the PHARMO Data Network.
Author Contributions
All authors made a significant contribution to the work reported, whether that is in the conception, study design, execution, acquisition of data, analysis and interpretation, or in all these areas; took part in drafting, revising or critically reviewing the article; gave final approval of the version to be published; have agreed on the journal to which the article has been submitted; and agree to be accountable for all aspects of the work.
Funding
This research did not receive any specific grant from funding agencies in the public, commercial, or not-for-profit sectors.
Disclosure
All authors are employees of the PHARMO Institute for Drug Outcomes Research. This independent research institute performs financially supported studies for government and related healthcare authorities and several pharmaceutical companies. JO and KS are also affiliated with Amsterdam UMC, location Vrije Universiteit Amsterdam, Department of General Practice. EH is also affiliated with Erasmus MC, Department of Obstetrics and Gynecology. RH is also affiliated with Amsterdam UMC, location Vrije Universiteit Amsterdam, Department of Epidemiology and Data Science. The authors report no other conflicts of interest in this work.
References
1. Arlett P, Kjaer J, Broich K, Cooke E. Real-world evidence in EU medicines regulation: enabling use and establishing value. Clin Pharmacol Ther. 2022;111(1):21–23. doi:10.1002/cpt.2479
2. Blommestein HM. The Added Value of Real-World Evidence. Erasmus Universiteit; 2015.
3. Mahendraratnam N, Mercon K, Gill M, Benzing L, McClellan MB. Understanding use of real-world data and real-world evidence to support regulatory decisions on medical product effectiveness. Clin Pharmacol Ther. 2022;111(1):150–154. doi:10.1002/cpt.2272
4. Weiskopf NG, Weng C. Methods and dimensions of electronic health record data quality assessment: enabling reuse for clinical research. J Am Med Inform Assoc. 2013;20(1):144–151. doi:10.1136/amiajnl-2011-000681
5. Richiardi L, Pizzi C, Pearce N. Commentary: representativeness is usually not necessary and often should be avoided. Int J Epidemiol. 2013;42(4):1018–1022. doi:10.1093/ije/dyt103
6. Song F, Zang C, Ma X, et al. The use of real-world data/evidence in regulatory submissions. Contemp Clin Trials. 2021;109:106521. doi:10.1016/j.cct.2021.106521
7. Kuiper JG, Bakker M, Penning-van Beest FJA, Herings RMC. Existing data sources for clinical epidemiology: the PHARMO database network. Clin Epidemiol. 2020;12:415–422. doi:10.2147/CLEP.S247575
8. Stichting Informatievoorziening voor Zorg en Onderzoek (STIZON). STIZON; 2022. Available from: https://stizon.nl/.
9. Kuiper JG, van Herk-Sukel MPP, Lemmens V, Kuipers EJ, Herings RMC. A steep increase in healthcare seeking behaviour in the last months before colorectal cancer diagnosis. BMC Fam Pract. 2021;22(1):121. doi:10.1186/s12875-021-01482-0
10. Birkeland KI, Bodegard J, Eriksson JW, et al. Heart failure and chronic kidney disease manifestation and mortality risk associations in type 2 diabetes: a large multinational cohort study. Diabetes Obes Metab. 2020;22(9):1607–1618. doi:10.1111/dom.14074
11. Sundstrom J, Bodegård J, Bollmann A, et al. Prevalence, outcomes, and cost of CKD in a contemporary population of 2·4 million patients from 11 countries: the CaReMe CKD Study. SSRN Electronic Journal. 2022. doi:10.2139/ssrn.4000580
12. Smits E, Andreotti F, Houben E, et al. Adherence and persistence with once-daily vs twice-daily direct oral anticoagulants among patients with atrial fibrillation: real-world analyses from the Netherlands, Italy and Germany. Drugs Real World Outcomes. 2022;9(2):199–209. doi:10.1007/s40801-021-00289-w
13. Overbeek JA, Penning-van Beest FJ, Balp MM, Dekhuijzen PN, Herings RM. Burden of exacerbations in patients with moderate to very severe COPD in the Netherlands: a real-life study. COPD. 2015;12(2):132–143. doi:10.3109/15412555.2014.898053
14. Faber MJ, Burgers JS, Westert GP. A sustainable primary care system: lessons from the Netherlands. J Ambul Care Manage. 2012;35(3):174–181. doi:10.1097/JAC.0b013e31823e83a4
15. WHO anatomical therapeutic chemical classification system; 2021. Available from: http://www.whocc.no/atc_ddd_index.
16. International classification of primary care 2021. Available from: https://www.nhg.org/themas/artikelen/icpc.
17. Statistics Netherlands (CBS). What does statistics Netherlands (CBS) do?; 2022. Available from: https://www.cbs.nl/nl-nl/over-ons/cbs-corporate-nieuws/wat-doet-het-cbs-.
18. Nivel. Nivel primary care database; 2021. Available from: https://www.nivel.nl/en/databases-and-panels.
19. Meijer W, Verberne L, Weesie Y, et al. Zorg door de huisarts - Nivel Zorgregistraties Eerste Lijn: Jaarcijfers 2018 en trendcijfers 2014–2018 [General practice care - Nivel Primary Care Database: Annual figures 2018 and trend figures 2014-2018]. 2019.
20. National Institute for Public Health and the Environment (RIVM). Informatie over Volksgezondheid en Zorg [Information on Public Health and Care]; 2022. Available from: https://www.vzinfo.nl/.
21. Bevolking; geslacht, leeftijd en burgerlijke staat, 1 januari [Population; sex, age and martial status, 1 January]. Available from: https://opendata.cbs.nl/statline/#/CBS/nl/dataset/7461bev/table?ts=1608626546519.
22. Statistics Netherlands (CBS). Degree of urbanisation; 2022. Available from: https://www.cbs.nl/en-gb/news/2007/07/young-people-live-in-cities-children-in-rural-areas/degree-of-urbanisation.
23. Personen met verstrekte geneesmiddelen; leeftijd en geslacht[Persons with dispensed drugs; age and sex]. Available from: https://opendata.cbs.nl/statline/#/CBS/nl/dataset/81071ned/table?ts=1625511252749.
24. Nielen MMJ, Spronk I, Davids R et al Estimating Morbidity Rates Based on Routine Electronic Health Records in Primary Care: Observational Study. JMIR Med Inform. 2019;7(3);e11929.
25. Austin PC. Using the standardized difference to compare the prevalence of a binary variable between two groups in observational research. Commun Stat. 2009;38(6):1228–1234. doi:10.1080/03610910902859574
26. PBL Netherlands Environmental Assessment Agency. Urbanisation and economy; 2022. Available from: https://www.pbl.nl/onderwerpen/verstedelijking-en-economie#:~:text=Nederland%20is%20een%20sterk%20verstedelijkt,volop%20gebruik%20van%20stedelijke%20voorzieningen.
27. Statistics Netherlands (CBS). Sterfte naar locatie van overlijden [Mortality by location of death]; 2020. Available from: https://www.cbs.nl/nl-nl/maatwerk/2020/37/sterfte-naar-locatie-van-overlijden.
28. Dutch Broadcasting Foundation (NOS). Pil komt niet terug in het basispakket [Oral contraceptive pill will not be covered again by the basic health insurance]; 2019. Available from: https://nos.nl/artikel/2291995-pil-komt-niet-terug-in-het-basispakket.
29. Gardner TL, Dovey SM, Tilyard MW, Gurr E. Differences between prescribed and dispensed medications. N Z Med J. 1996;109(1017):69–72.
 © 2023 The Author(s). This work is published and licensed by Dove Medical Press Limited. The
full terms of this license are available at https://www.dovepress.com/terms
and incorporate the Creative Commons Attribution
- Non Commercial (unported, 3.0) License.
By accessing the work you hereby accept the Terms. Non-commercial uses of the work are permitted
without any further permission from Dove Medical Press Limited, provided the work is properly
attributed. For permission for commercial use of this work, please see paragraphs 4.2 and 5 of our Terms.
© 2023 The Author(s). This work is published and licensed by Dove Medical Press Limited. The
full terms of this license are available at https://www.dovepress.com/terms
and incorporate the Creative Commons Attribution
- Non Commercial (unported, 3.0) License.
By accessing the work you hereby accept the Terms. Non-commercial uses of the work are permitted
without any further permission from Dove Medical Press Limited, provided the work is properly
attributed. For permission for commercial use of this work, please see paragraphs 4.2 and 5 of our Terms.