Back to Journals » Diabetes, Metabolic Syndrome and Obesity » Volume 12
Comparison of three meta-analytic methods using data from digital interventions on type 2 diabetes
Authors Kebede MM ![]() , Peters M
, Peters M ![]() , Heise TL
, Heise TL ![]() , Pischke CR
, Pischke CR
Received 13 July 2018
Accepted for publication 9 November 2018
Published 19 December 2018 Volume 2019:12 Pages 59—73
DOI https://doi.org/10.2147/DMSO.S180106
Checked for plagiarism Yes
Review by Single anonymous peer review
Peer reviewer comments 4
Editor who approved publication: Dr Konstantinos Tziomalos
Mihiretu M Kebede,1–3 Manuela Peters,1,2 Thomas L Heise,1,2 Claudia R Pischke2
1Department of Public Health, University of Bremen, Health Sciences, Bremen, Germany; 2Department of Prevention and Evaluation, Leibniz Institute for Prevention Research and Epidemiology – BIPS, Bremen, Germany; 3Department of Health Informatics, University of Gondar, College of Medicine and Health Science, Institute of Public Health, Gondar, Ethiopia
Aims: Pooling the effect sizes of randomized controlled trials (RCTs) from continuous outcomes, such as glycated hemoglobin level (HbA1c), is an important method in evidence syntheses. However, due to challenges related to baseline imbalances and pre/post correlations, simple analysis of change scores (SACS) and simple analysis of final values (SAFV) meta-analyses result in under- or overestimation of effect estimates. This study was aimed to compare pooled effect sizes estimated by Analysis of Covariance (ANCOVA), SACS, and SAFV meta-analyses, using the example of RCTs of digital interventions with HbA1c as the main outcome.
Materials and methods: Three databases were systematically searched for RCTs published from 1993 through June 2017. Two reviewers independently assessed titles and abstracts using predefined eligibility criteria, assessed study quality, and extracted data, with disagreements resolved by arbitration from a third reviewer.
Results: ANCOVA, SACS, and SAFV resulted in pooled HbA1c mean differences of –0.39% (95% CI: [–0.51, –0.26]), –0.39% (95% CI: [–0.51, –0.26]), and –0.34% (95% CI: [–0.48–0.19]), respectively. Removing studies with both high baseline imbalance (≥±0.2%) and pre/post correlation of ≥±0.6 resulted in a mean difference of –0.39% (95% CI: [–0.53, –0.26]), –0.40% (95% CI: [–0.54, –0.26]), and –0.33% (95% CI: [–0.48, –0.18]) with ANCOVA, SACS, and SAFV meta-analyses, respectively. Substantial heterogeneity was noted. Egger’s test for funnel plot symmetry did not indicate evidence of publication bias for all methods.
Conclusion: By all meta-analytic methods, digital interventions appear effective in reducing HbA1c in type 2 diabetes. The effort to adjust for baseline imbalance and pre/post correlation using ANCOVA relies on the level of detail reported from individual studies. Reporting detailed summary data and, ideally, access to individual patient data of intervention trials are essential.
Keywords: baseline imbalance, ANCOVA, change scores, final values, systematic reviews, HbA1c, diabetes, eHealth
Background
The number of published research doubles every 9 years,1 and its growth particularly in medicine and health care is exponential.2 In 2010, 11 systematic reviews and 75 trials were reported to be published every day. In this fast growing era of medical research publishing, being up-to-date in the latest medical and health care evidence is important but not easy.2
Medical or health care studies often deal with similar or related research questions at different locations, with different populations, at different time points. These studies are many in number, and their results are often diverse or sometimes contradictory.3 Importantly, medical and health care decisions require up-to-date and consolidated evidence. Meta-analysis offers a strategy to collect evidence available from individual studies and quantify the effect of interventions, prevalence of diseases, or risk factors associated with diseases.4
Rigorous meta-analyses are fundamental for estimating the true effects of interventions which guide clinical and public health practice.3,5,6 Most medical journals encourage or call for aggregation of evidence using meta-analyses and the number of meta-analyses in the medical research has exponentially grown from what it was in the 1990s.3,6 Meta-analysis has also become a very important aspect of diabetes research. A simple PubMed search on diabetes and meta-analysis resulted in about 10,000 meta-analyses articles published so far (https://www.ncbi.nlm.nih.gov/pubmed/?term=diabetes+and+(meta-analys*+ or+metaanalys*)).7
A well-conducted meta-analysis is a powerful tool for informing medicine and health care decisions.3,6,8 However, there are many challenges that meta-analyses authors face, for instance, clinical, methodological and statistical heterogeneity, publication bias, language barriers, outcome definitions, and statistical challenges.6,8,9 Meta-analyses of continuous outcomes are recognized to be more challenging than those with binary outcomes.10,11
In meta-analyses of continuous outcomes, mean difference (MD), standardized mean difference, and ratio of means are used as effect size measures. The choice of the two most commonly used effect size measures, ie, MD and standardized mean difference, of continuous outcomes is mainly determined by the scale of measurement. If the scale of measurement is similar as in glycated hemoglobin level (HbA1c), the MD can be used to aggregate effect sizes across studies. To pool the effect sizes of continuous outcomes, it is important to consider whether the baseline MD of the outcome data between the intervention and control groups is adequately balanced.12,13 In general, baseline imbalance can result from chance especially in small trials, or selection bias due to inadequate allocation concealment or poor randomization.14 Therefore, in meta-analysis, it is important to consider accounting for baseline imbalance and pre/post correlation.13,15–17 However, the meta-analyses available so far have by and large not taken into account a specific methodological challenge posed by baseline imbalances between groups.
None of the previous meta-analyses on digital interventions on type 2 diabetes that we have identified through scoping were adjusted for baseline imbalances and pre/post correlations. Meta-analyses of randomized control trials reporting continuous outcomes, such as HbA1c, with high baseline imbalances require adjustments using an Analyses of Covariance (ANCOVA effect size estimator, both at a pooled and individual study levels.13,15–17 ANCOVA produces a relatively more precise effect size estimate than simple analysis of change scores (SACS) and simple analysis of final values (SAFV).13,15,16
While there is methodological guidance available to employ ANCOVA effect size, the unavailability of summary data from randomized controlled trials (RCTs) or absence of individual participant data (IPD), as well as the complexity of the ANCOVA methodology, has limited its application to synthesize continuous outcomes in the medical literature.13,15–17 Although it is important to recognize that determining precise effect sizes is essential to understand the true effect of interventions to guide clinical and public health practice, to our knowledge, no study has applied ANCOVA to determine changes in HbA1c level effect sizes of digital interventions on type 2 diabetes. Therefore, this study was aimed to compute and compare changes in HbA1c effect sizes of digital interventions on type 2 diabetes using ANCOVA, SACS, and SAFV meta-analyses.
Materials and methods
This meta-analysis uses data from our recently completed systematic review and meta-analyses on digital interventions among poorly controlled type 2 diabetes mellitus (T2DM) patients.18 The detailed description of the protocol and the systematic review methods followed can be accessed elsewhere.18,19 Briefly, we searched three databases (MEDLINE via PubMed, ISI Web of Science via Thomson Reuters, and PsycINFO via OvidSP) for English language RCTs employing digital interventions among persons with poorly controlled type 2 diabetes, and published until the end of June 2017. Details of search strategy are available elsewhere.18,19 In this study, technology-based interventions delivered via mHealth, web-based applications, Personal Digital Assistant, tablet, computer, or other forms of eHealth applications were considered as digital interventions.18,20
Two authors (MK and MP) independently conducted title, abstract, and full-text screening using Covidence. Methodological quality assessment was conducted using the Cochrane Risk of Bias Assessment tool for RCTs.21 Two reviewers (MK and MP) independently conducted the risk of bias assessment by using Covidence22 and discussed quality ratings until consensus was reached. The risk of bias tool consists of seven domains which were rated as low, high, or unclear risk of bias. To rate “other sources of bias,” the recommendation by Fu et al13 was used, which focuses on the question whether the baseline distribution of participant characteristics and outcome data of both control and intervention groups are sufficiently described and balanced. Beside this, quality rating should include whether there was baseline imbalance and high rate of attrition. Therefore, quality ratings for this domain were downgraded if important baseline prognostic factors and outcome variables were not balanced in the included studies.13
Missing crude or pooled SD values were computed from the reported standard errors, confidence intervals, or from exact reported P-values using functions in Microsoft Excel. If an exact P-value was reported, depending on the statistical test used, we calculated z- or t-scores using the function normsinv(1 – P-value/2) or tinv(P-value, degree of freedom).13,23 Whenever SD could not be calculated from the reported data, we contacted the corresponding and the last authors. If no response was obtained, SD values were imputed using arithmetic means.13 Using this method, we computed the SD values for the follow-up mean HbA1c values from a study by Wakefield et al.24 One study25 reported median HbA1c with its range, but mean and SD values were not available from the authors. After contacting the corresponding author was not successful, we estimated the mean and SD values from the reported median and range using Hozo’s formula.26
Pre/post correlations were not reported in the majority of the studies. However, it is necessary to account for them in meta-analyzing the effect sizes of continuous outcomes.13,15 Our approach accounting for this issue was based on recommendations of previous methodological studies. If a study reported baseline and follow-up standard deviations (SDb and SDf), and standard deviation values for change scores (SDd), we computed pre/post correlation using 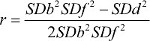 .13 Whenever, baseline and follow-up SD were not known, correlation was estimated from the pooled SD (SDp) and change score SD (SDd) values using
  .16
.16
Data syntheses and analysis
As highlighted in the previous sections, effect sizes of continuous outcomes with an inherently similar scale of measurement can be computed using three methods: SAFV, SACS, or using the ANCOVA effect size estimator.13,15–17 In comparison to MD computed through using either SAFV or SACS, the ANCOVA effect size estimator provides a more precise and unbiased effect size estimates.13,15–17 The ANCOVA effect size estimator reduces the bias that arises from baseline imbalance across the included studies and accounts for pre-/post-test correlation.13,15,17,27 In this systematic review, the absolute value of the mean baseline HbA1c differences between intervention and control groups in the included studies ranged from 0% to 0.64%, with only two RCTs having perfectly balanced MDs.28,29 Given no publication bias, if the two treatment groups are balanced, meta-analysis of baseline score differences between control and intervention groups produces a combined effect size estimate of close to zero.13 Therefore, we conducted a meta-analysis of the baseline MDs across the included studies. Further, random-effects meta-analysis of the baseline MDs resulted in a pooled HbA1c difference of 0.14% (95%CI: [–0.31, 0.59]). In addition, the computed pre/post correlation values ranged from –0.06 in a study by Ralston et al30 to 0.74 in a study by Torbjønsen et al.31 Hence, to adjust for the observed baseline imbalance and pre-/post-test correlation, ANCOVA effect size estimator was preferred to pool the mean HbA1c difference. If reported, ANCOVA effect size estimates were extracted directly from studies. Whether studies reported effect sizes using SACS, SAFV, or ANCOVA was also documented.
Assuming Xint and Xctrl are the baseline mean values of intervention and control groups while Yint and Yctrl are the follow-up mean values, the MD from SAFVs was computed as follows: SAFS = Yint - Yctrl, while MD from SACS was computed using SACS = (Yint - Yctrl) - (Xint - Xctrl). Moreover, an ANCOVA effect size estimate was modeled using ANCOVA = (Yint - Yctrl) - b (Xint - Xctrl), where β is a regression coefficient calculated by using  . SDy and SDx are the pooled SD values of the treatment and control groups.13,15 The variances of the final values, change scores, and ANCOVA effect size estimates were computed using equations by Jo McKenzie et al15 and Riley et al.17 Whenever there was no possibility to compute the ANCOVA effect size estimator, the reported change scores or final values were pooled with the ANCOVA effect size estimates, following the strategy documented in the existing methodology literature.13,15,17 If a study reported both SACS and final values, the estimate with a smaller effect size was combined with the ANCOVA effect size estimates. Practically, studies having zero or negligible baseline MD, equivalent or close to equivalent MD values were obtained using any of the three methods. Therefore, for studies having no or a negligible baseline difference, adding any of the three estimates in the meta-analysis yielded comparable pooled estimates.13,15
Meta-analyses
All meta-analyses were performed using Stata version 13. Studies that were judged as homogenous in terms of participants, type of interventions, and type and scale of measurement of the outcome were subsequently combined to determine the overall pooled effectiveness of digital interventions for reducing HbA1c levels.
For each study, we calculated three effect size measures using the “black-belt” ANCOVA, SACS, and SAFV approaches to compare individual and pooled effect size differences.
For all meta-analyses, observed statistical heterogeneity across studies was assessed with Cochrane’s chi-squared test. The degree of heterogeneity was quantified using the I2 statistic. In addition to statistical heterogeneity, the diversity of studies with respect to clinical and methodological aspects was assessed to choose from random- or fixed-effects meta-analysis. Hence, random-effects meta-analysis was used for all meta-analyses.32 Sensitivity analyses were performed by 1) dropping studies with baseline imbalance (baseline mean difference ≥±0.2, or ≥±0.3) and 2) removing studies having high pre/post correlations (>±0.7 and >±0.6).
For all the three meta-analytic methods, differences in the publication bias were compared using visual inspection of the funnel plots and statistically using Egger’s test with a P-value <0.1 indicating publication bias.33 The number of missing studies in the funnel plots was estimated using the “trim and fill” imputation method to determine the changes in effect size estimate across the three methods.34
Results
Study selection and characteristics
In total, 1,669 abstracts and titles were retrieved from the database search. Twenty-two studies fulfilled the inclusion criteria.24,25,28–31,35–50 Twenty-three arms of 21 RCTs were included in the quantitative syntheses. Two studies reported results of three-armed RCTs.31,41 All of the 21 control groups of the 21 RCTs received standard or usual care. The details of the study selection procedure and the PRISMA flowchart can be accessed in our previously reported meta-analysis.18
Studies included in our review were published between 2009 and 2017. A majority (n=9) of the studies were conducted in the United States. In the 23 intervention arms of the 21 RCTs, 3,787 patients were included and followed for an average of 7.3 months (SD=3.05). Average retention rate at a study end point was 89.4% (SD=10.0, range =75% to100%), whereas attrition rate was 10.6% (SD=10.0; Table 1). One study was judged to have low risk of bias on all dimensions of the Cochrane risk of bias assessment tool.50 Four studies were considered to have a high risk of bias on three domains.36,38,43,45
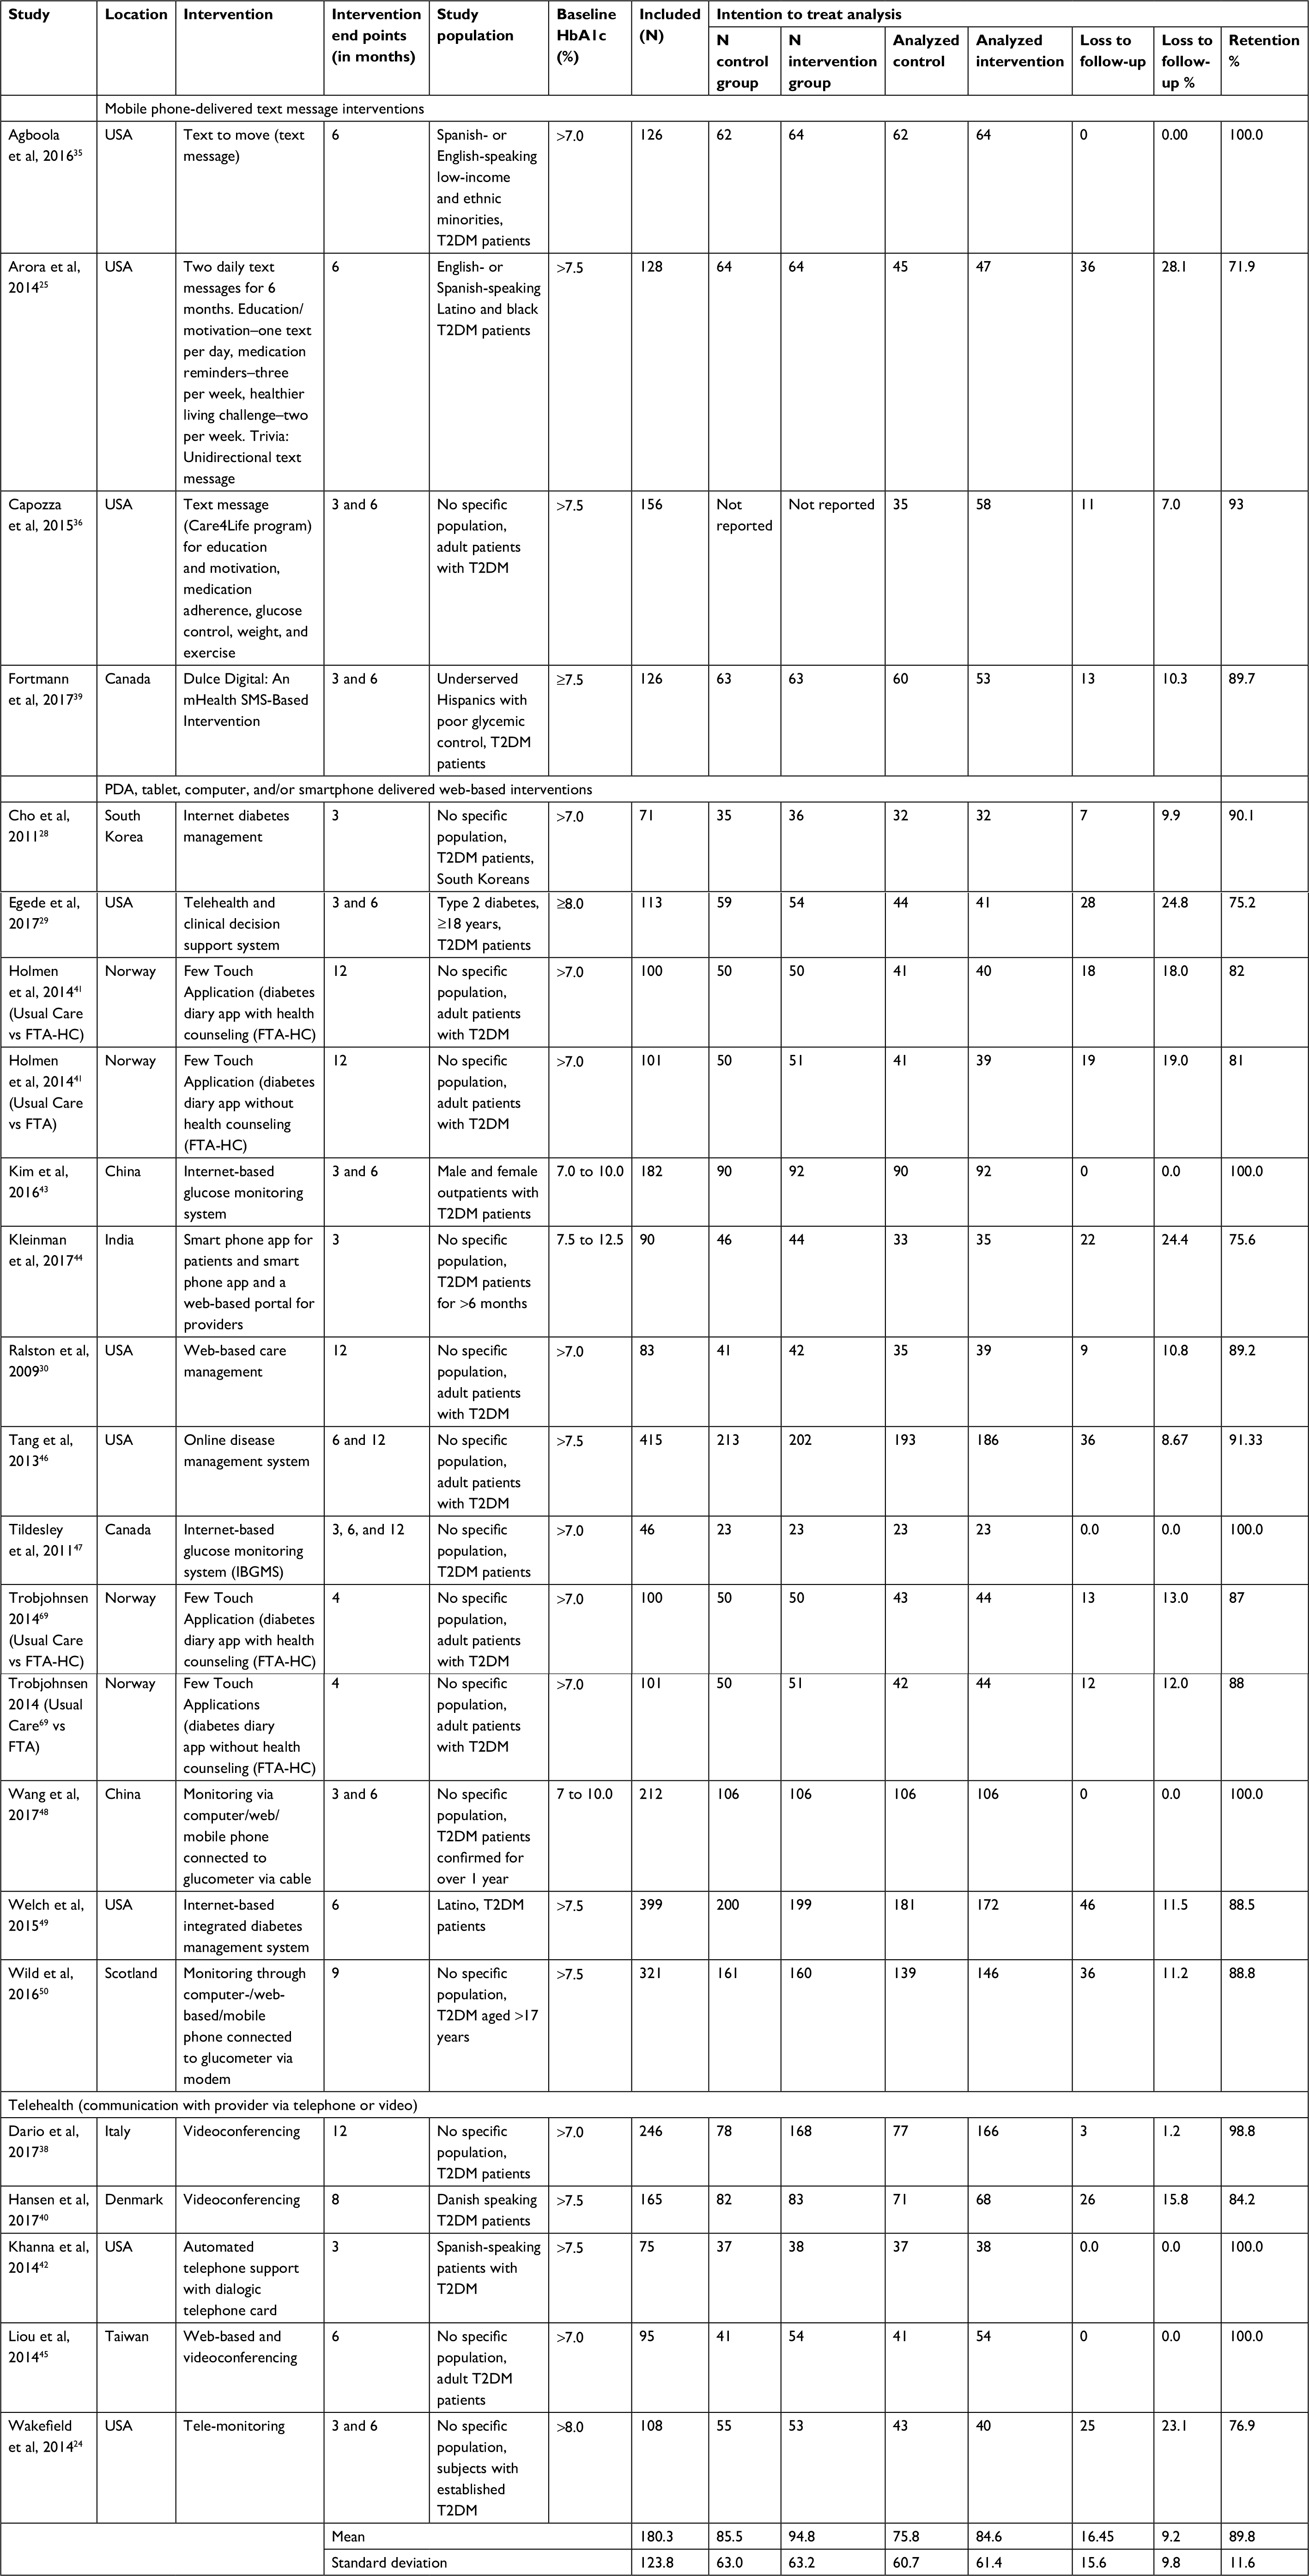 | Table 1 Characteristics of the included studies Abbreviations: FTA-HC, Few Touch Application (diabetes diary app with health counseling); HbA1c, glycated hemoglobin level; IBGMS, Internet-based glucose monitoring system; T2DM, type 2 diabetes mellitus. |
The mean HbA1c baseline difference of the studies included in the quantitative syntheses ranged from –0.2%24,41 to 0.64%.35 Only two RCTs29,37 had a perfect baseline balance with a mean HbA1c difference of 0.0%. The pooled baseline difference was 0.14% (95%CI: [–0.31, 0.59]).
Differences in individual and pooled effect sizes
Multivariate test of means showed that the MDs estimated using the three methods across the studies were not statistically different (Hotelling T2=4.65, Hotelling, F(2, 21)=2.22, Prob>F=0.134). Visual inspection of a box plot constructed using the individual studies’ MD values obtained using the three methods also did not indicate substantial differences (Figure 1).
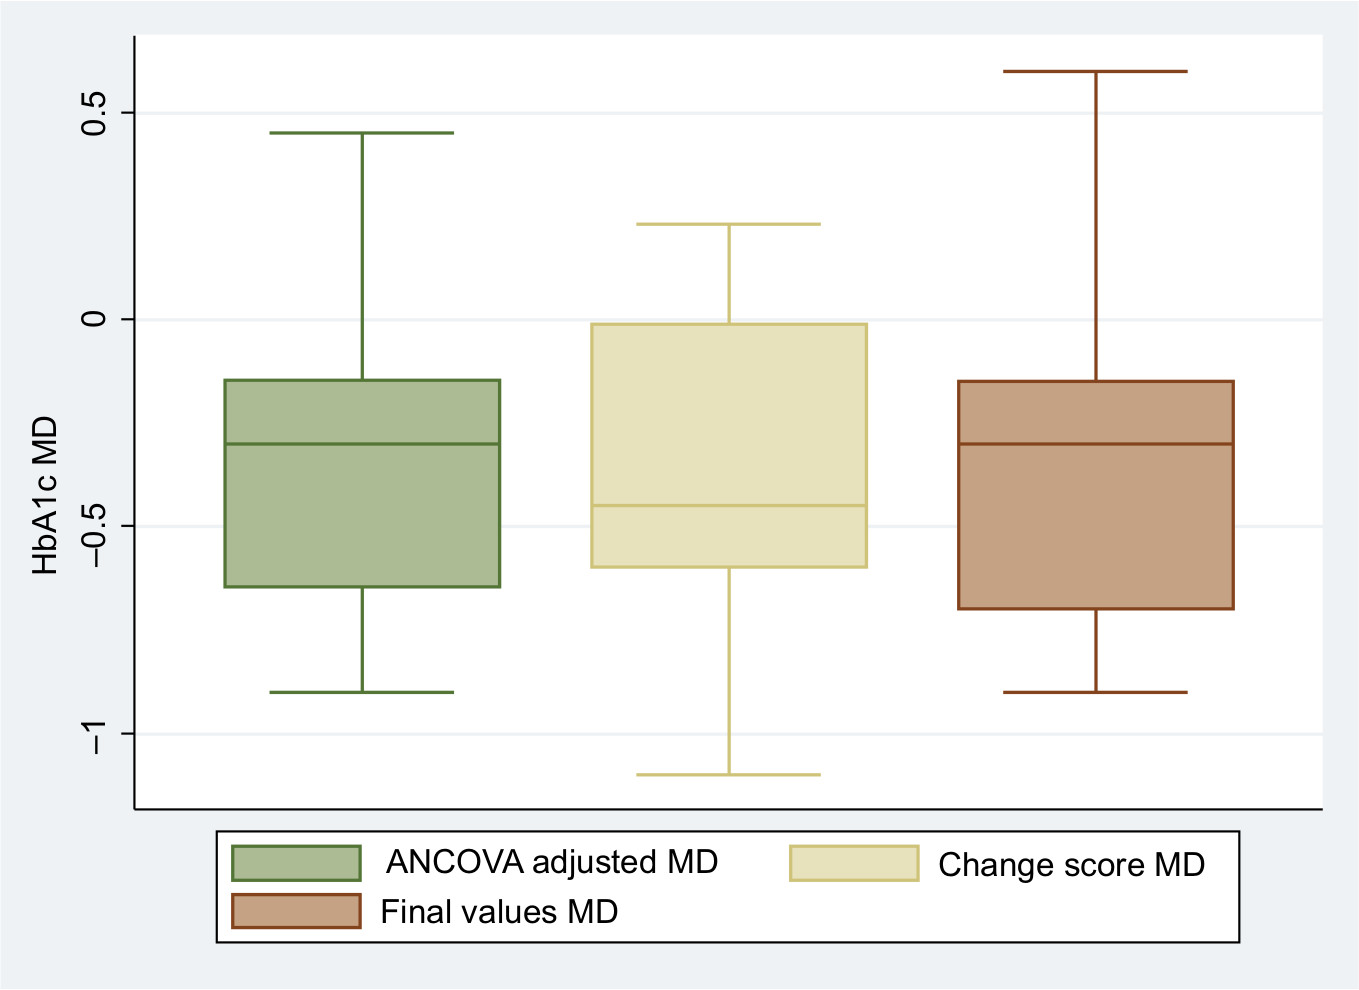 | Figure 1 Box plots of ANCOVA, change scores, and final values MDs. Abbreviations: ANCOVA, analysis of covariance; MD, mean difference. |
The pooled mean HbA1c difference calculated using the ANCOVA approach yielded a statistically significant pooled HbA1c reduction of –0.39% (95%CI: [–0.51, –0.26]) favoring the intervention group, with considerable heterogeneity statistic (I2=80.8%; Figure 2).
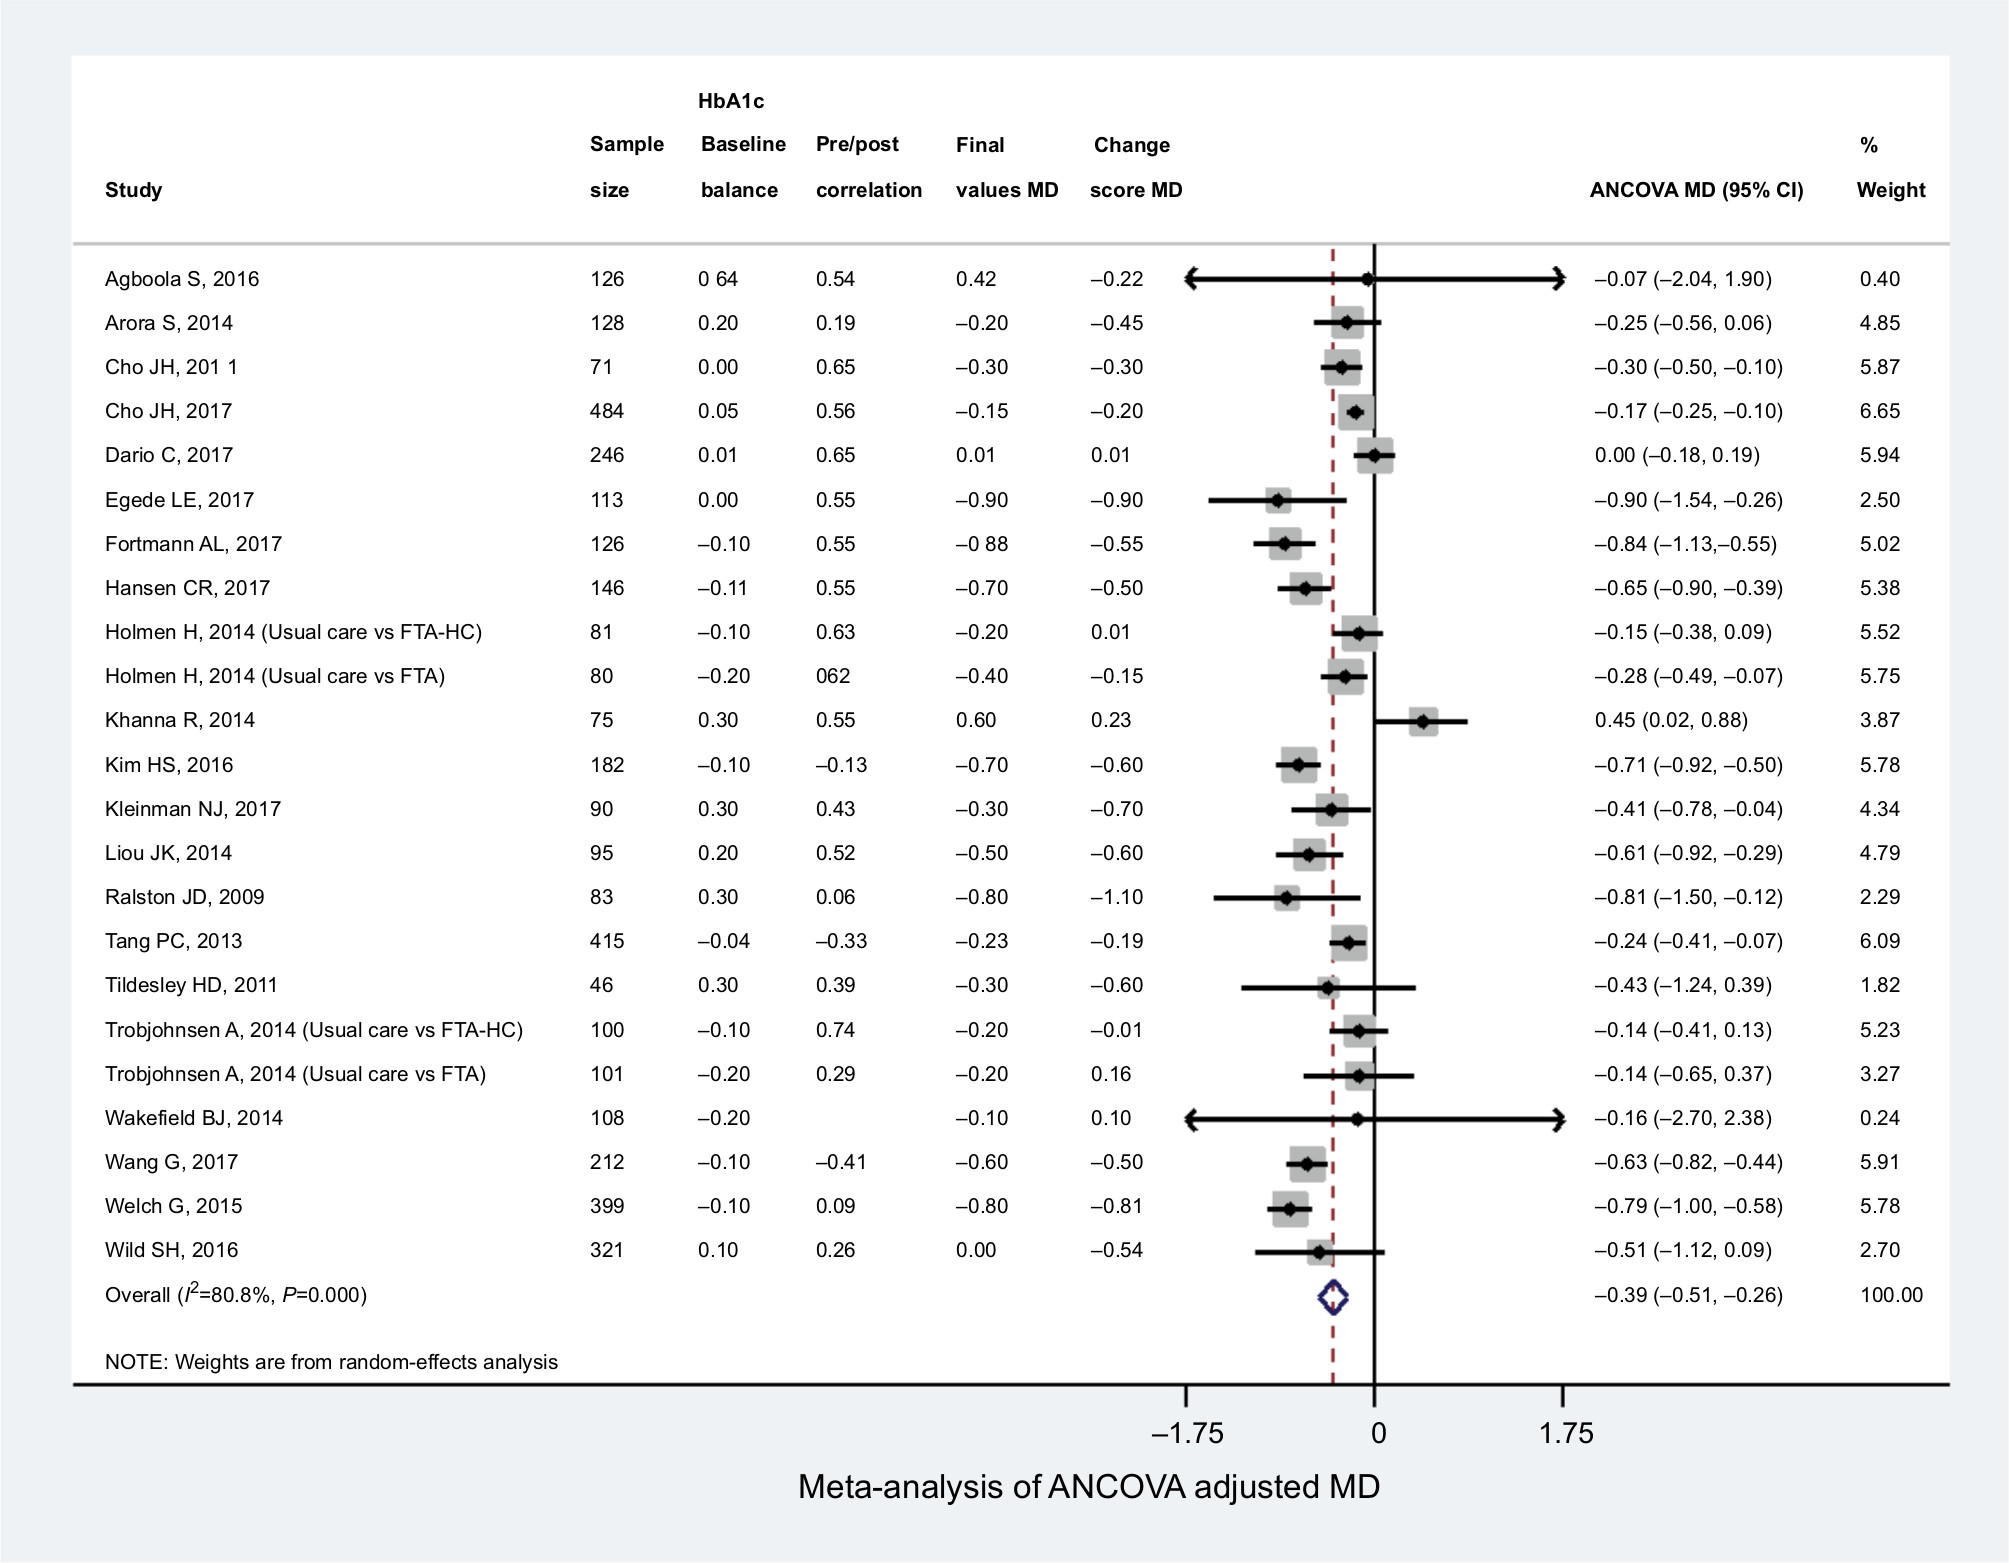 | Figure 2 Random-effects meta-analysis of ANCOVA adjusted MDs. Abbreviation: ANCOVA, analysis of covariance; FTA-HC, Few Touch Application (diabetes diary app with health counseling); MD, mean difference. |
MD aggregated using meta-analysis of change scores and final values also yielded statistically significant effect estimates ie, –0.39% (95%CI: [–0.51, –0.26]; Figure 3) and –0.34% (95%CI: [–0.48, –0.19]; Figure 4), respectively. The heterogeneity I2 statistics for change scores and final values meta-analyses were 32.3% and 64.5%, respectively. All of the above results are from the random effects meta-analysis. Considering the I2 statistics for change scores, we conducted a fixed-effects meta-analysis. The pooled MD was –0.37% (95%CI: [–0.468, –0.268]; Figure 5).
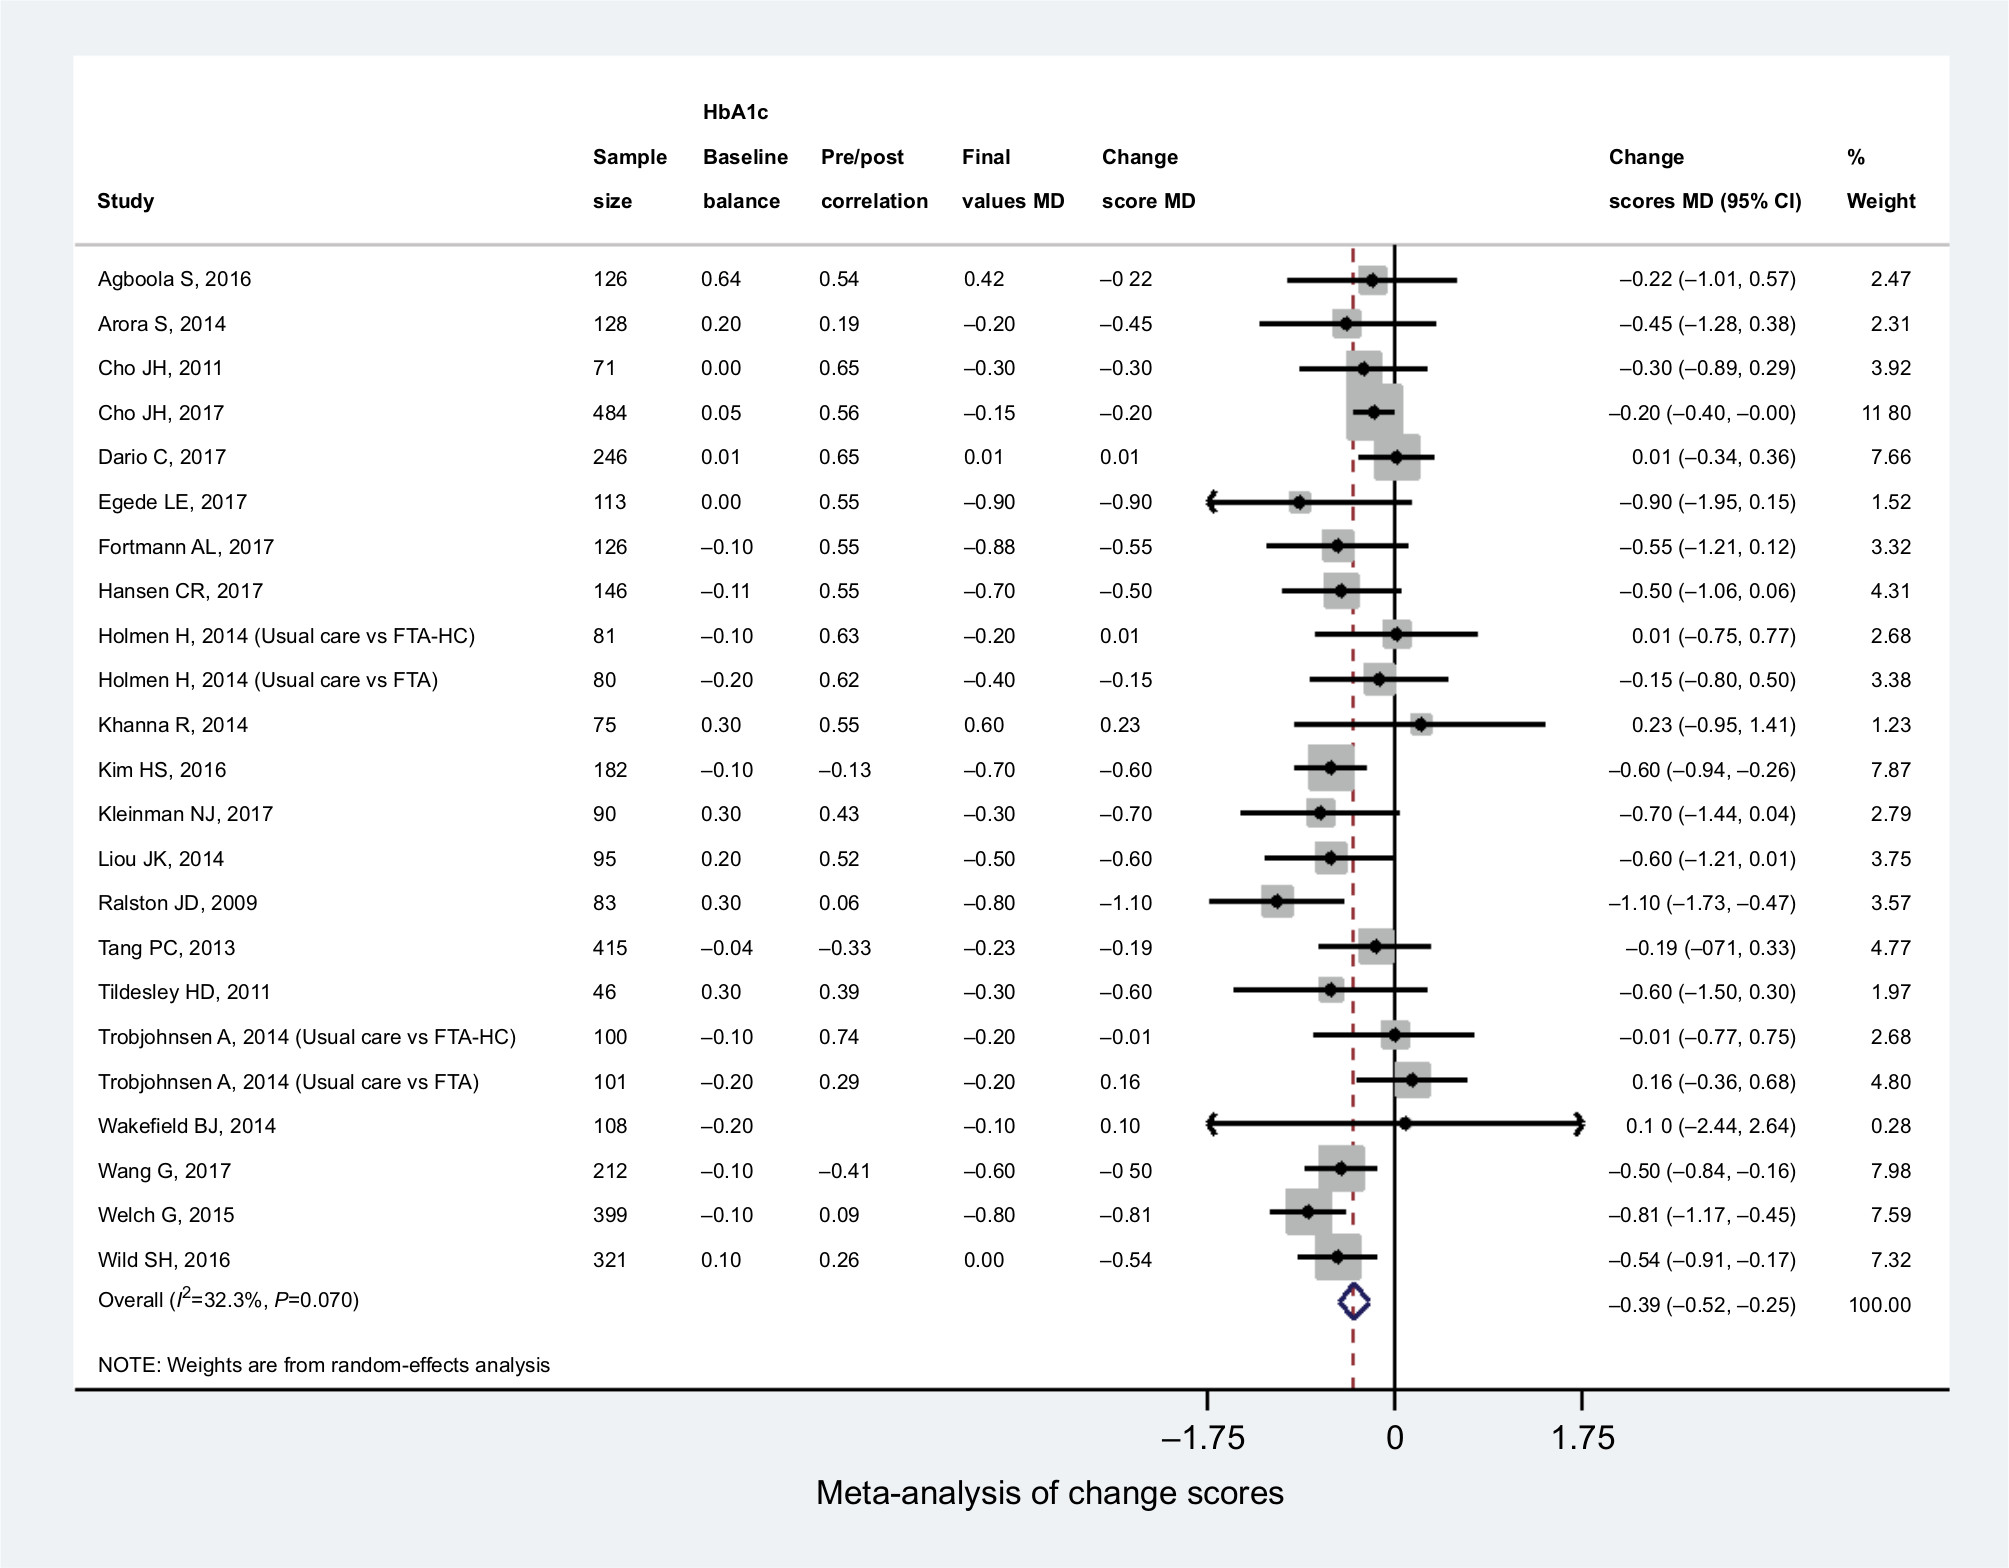 | Figure 3 Random-effects meta-analysis of change scores. Abbreviations: FTA-HC, Few Touch Application (diabetes diary app with health counseling); HbA1c, glycated hemoglobin level; MD, mean difference. |
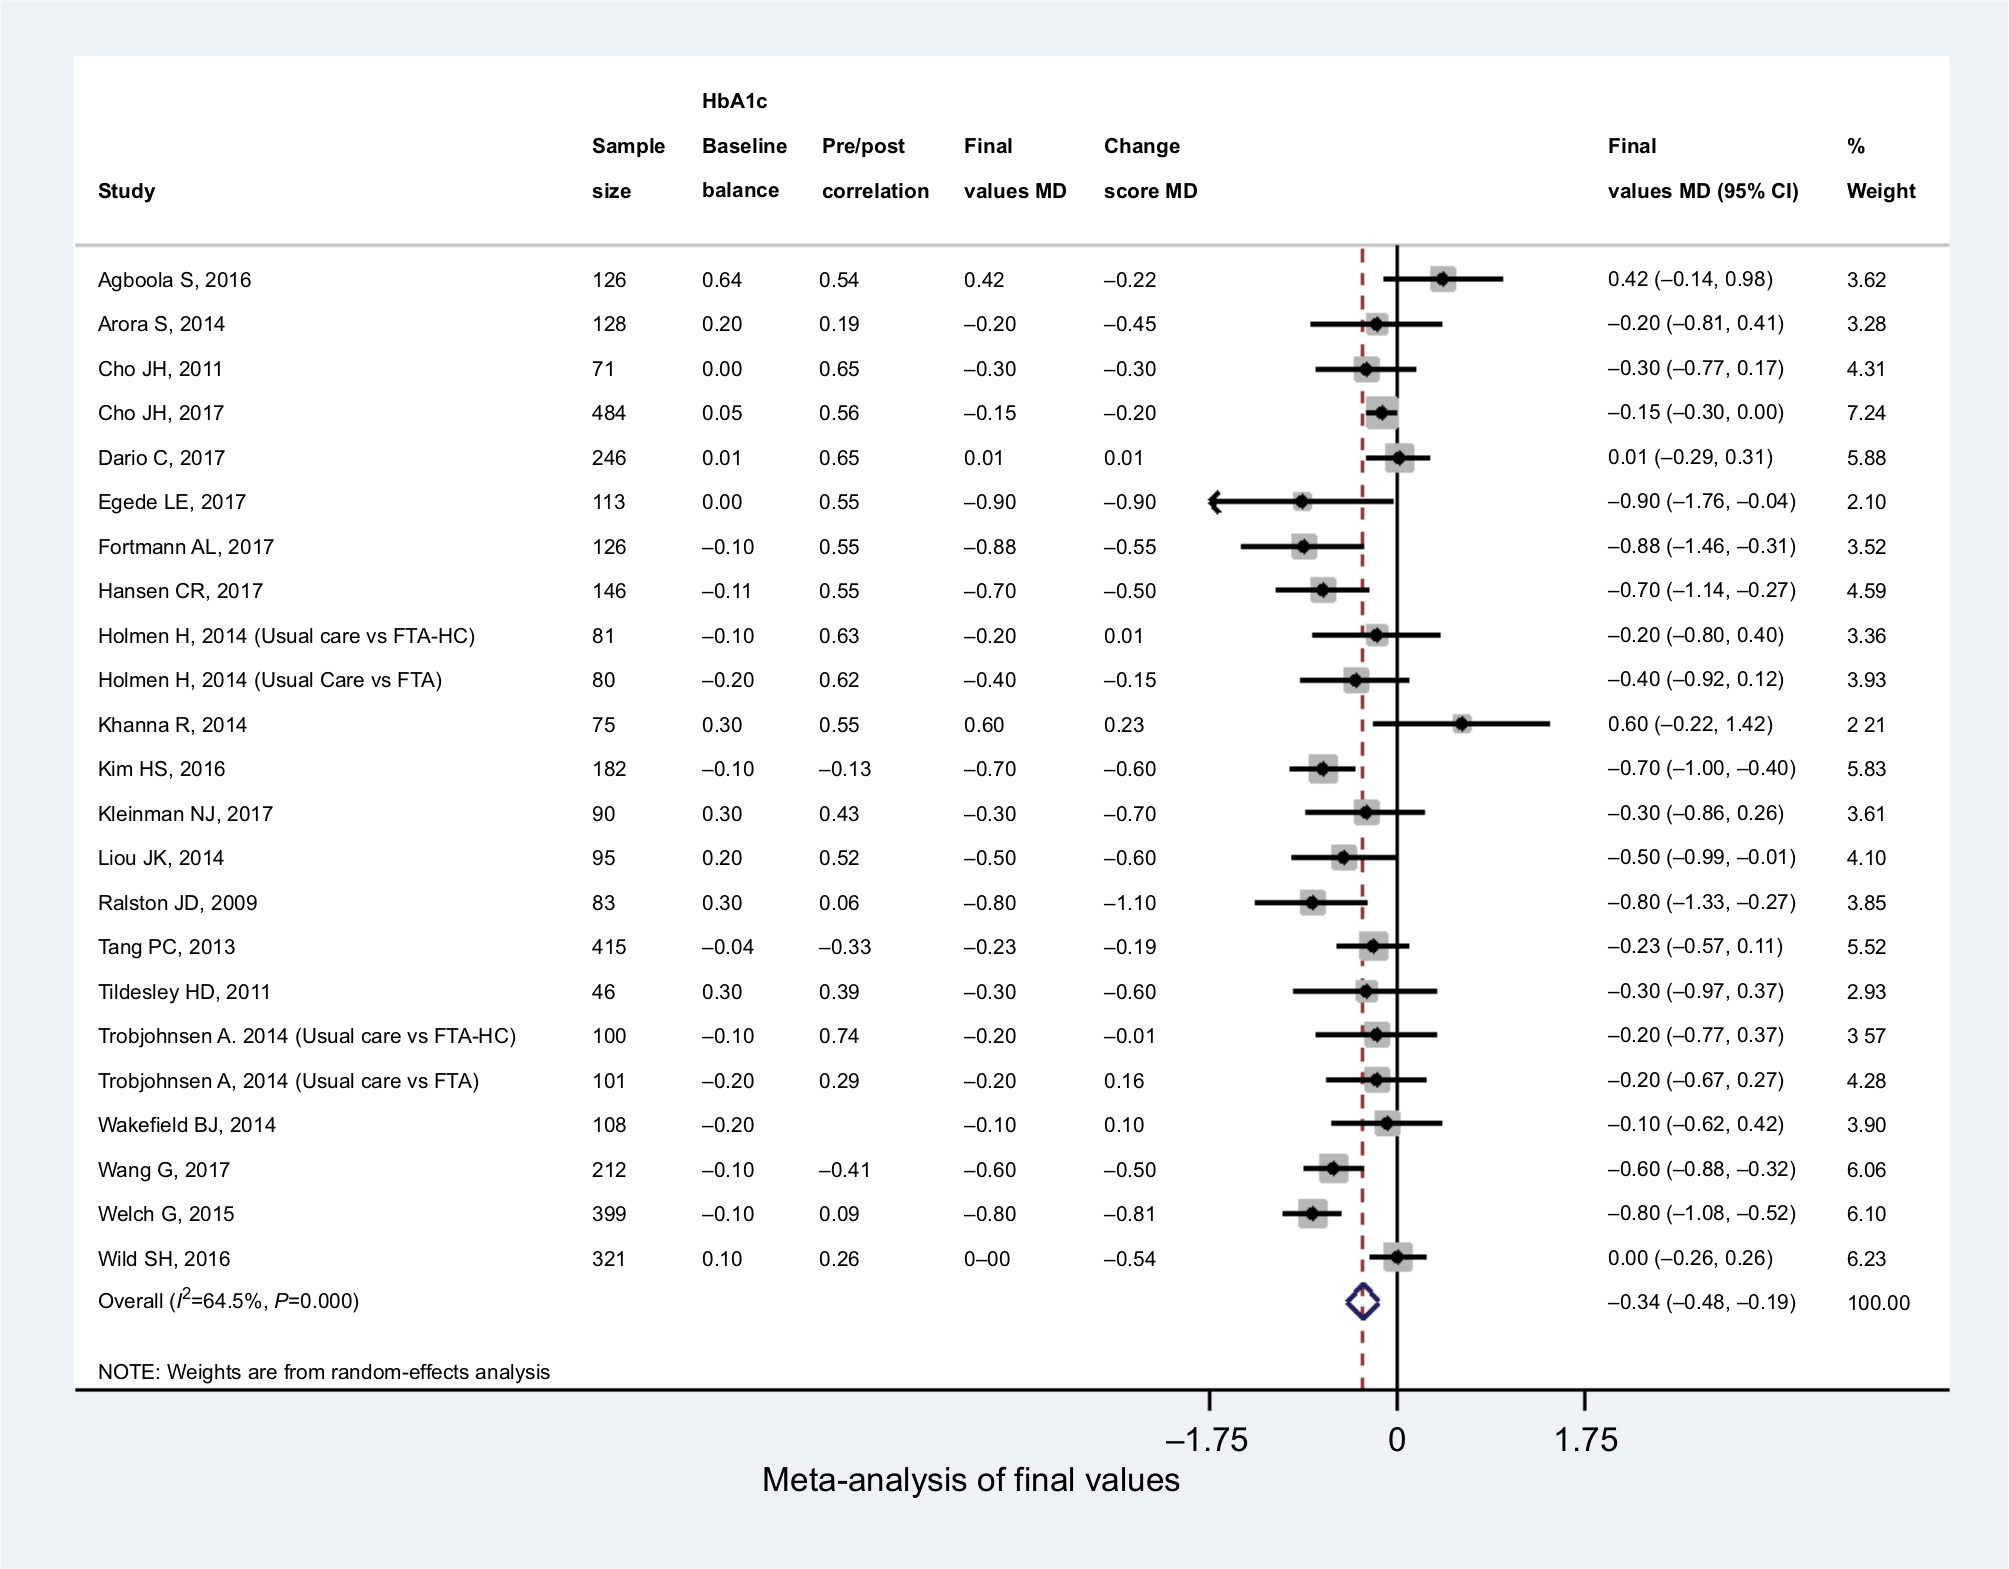 | Figure 4 Random-effects meta-analysis of final values. Abbreviations: FTA-HC, Few Touch Application (diabetes diary app with health counseling); HbA1c, glycated hemoglobin level; MD, mean difference. |
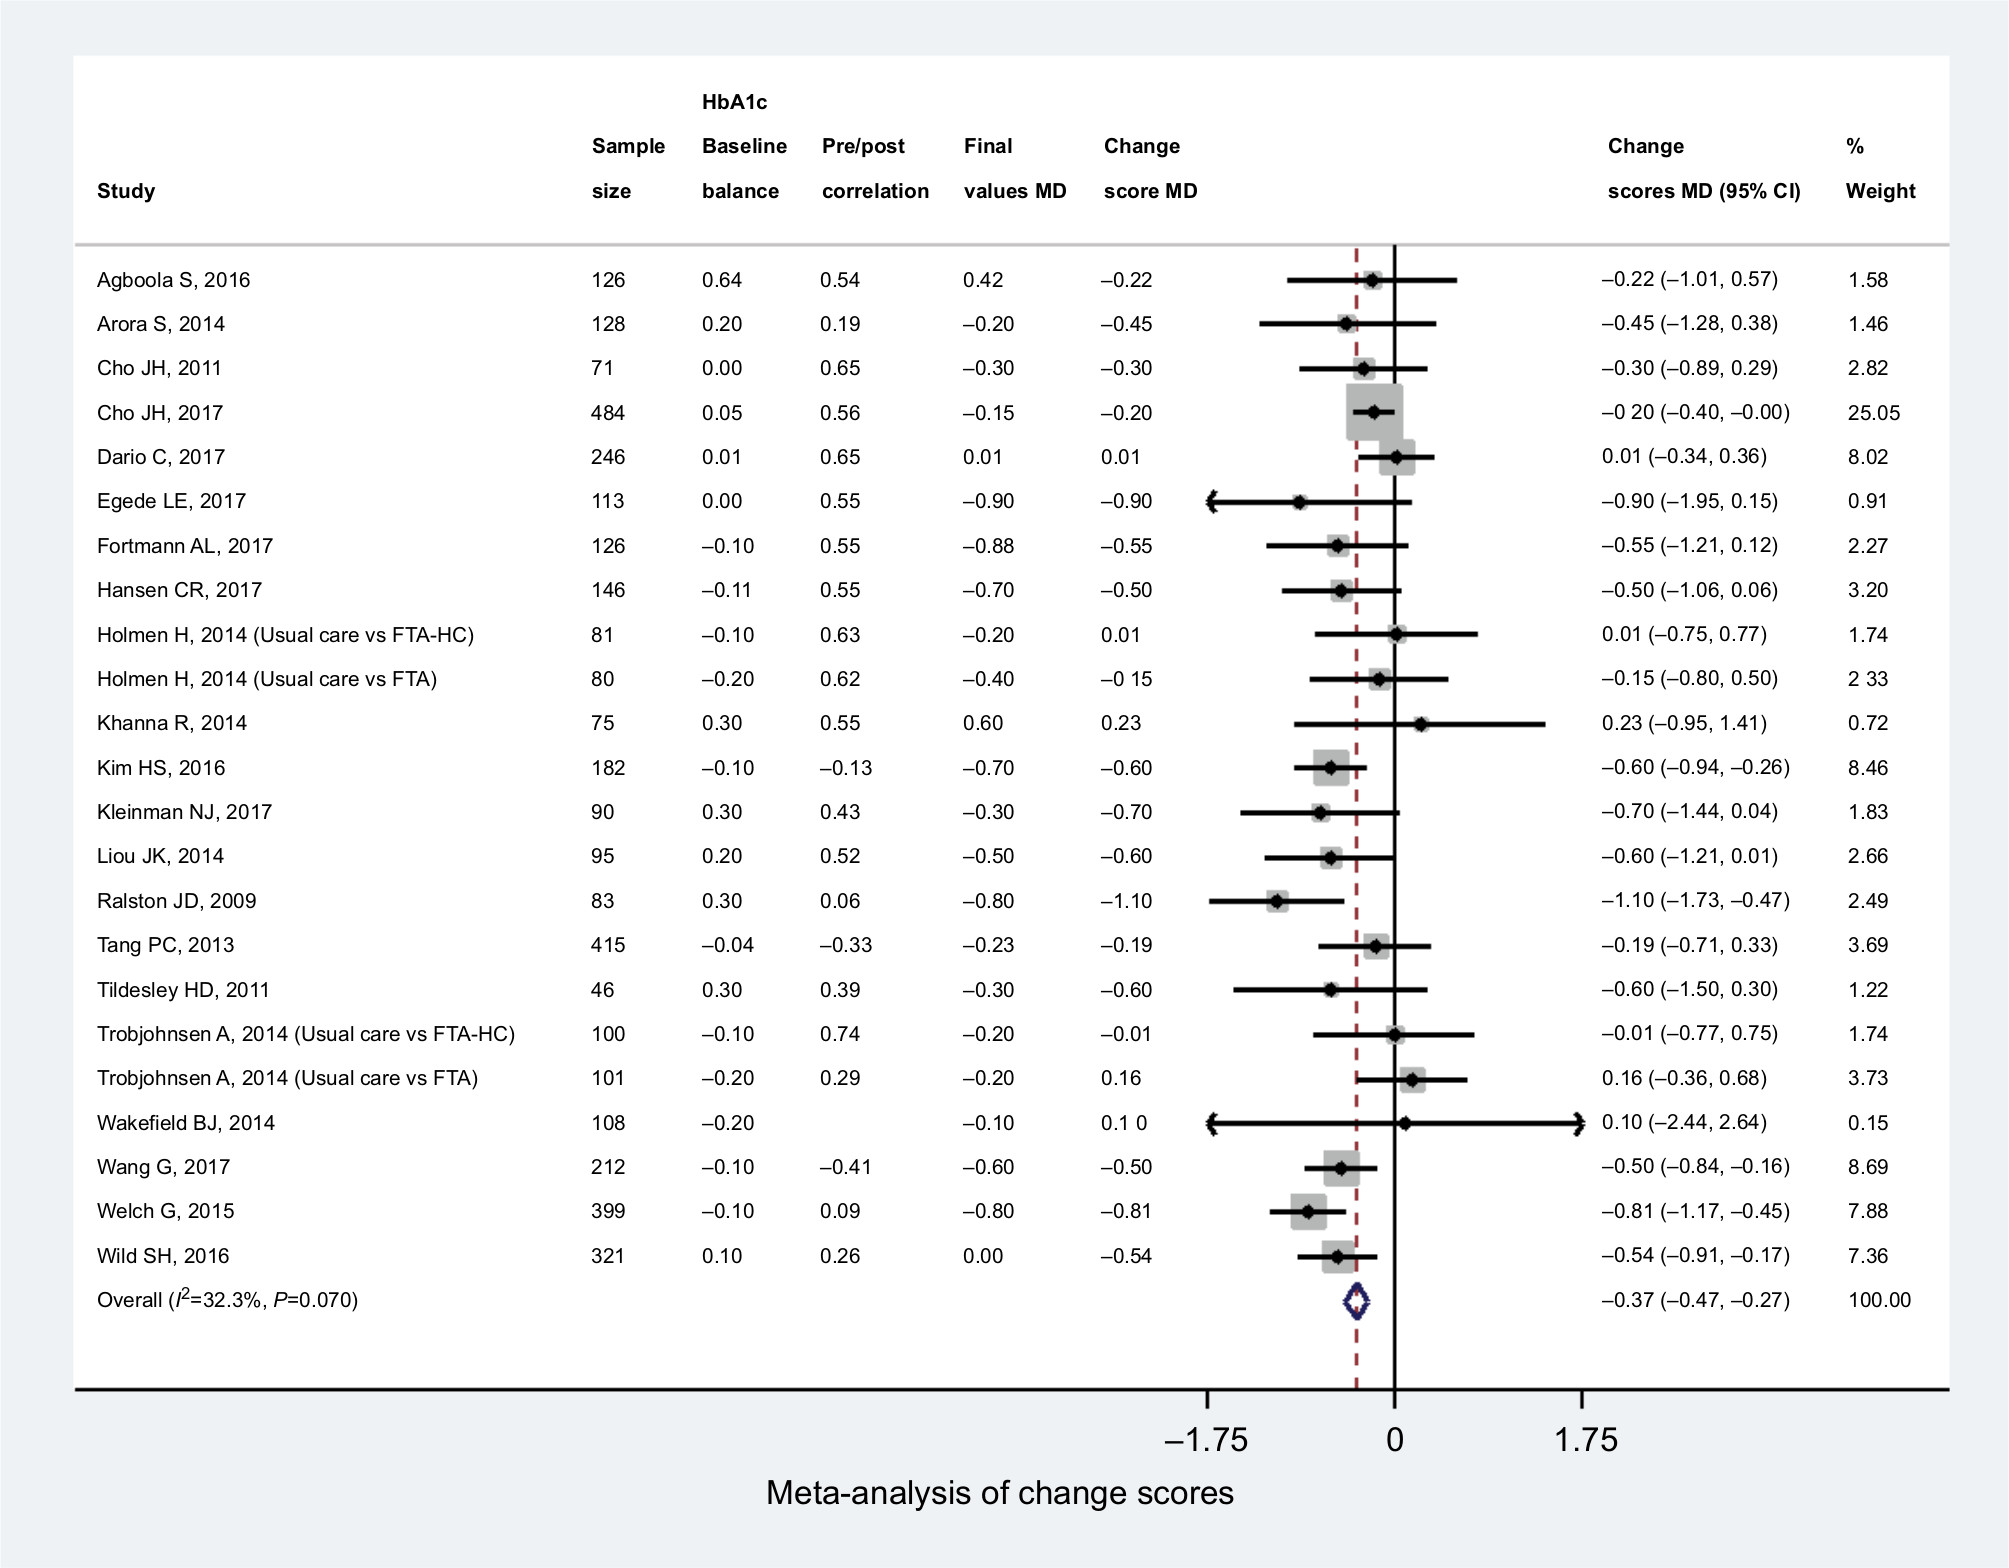 | Figure 5 Fixed-effects meta-analysis of change scores. Abbreviations: HbA1c, glycated hemoglobin level; MD, mean difference. |
Publication bias
Visual inspection of the funnel plots that were obtained using effect sizes of ANCOVA and SACS shows symmetry at the top of the plot, and there were studies missing at the bottom of the funnel plot indicating publication bias. However, a relatively symmetric funnel plot was obtained from effect sizes computed using SAFV (Figure 6).
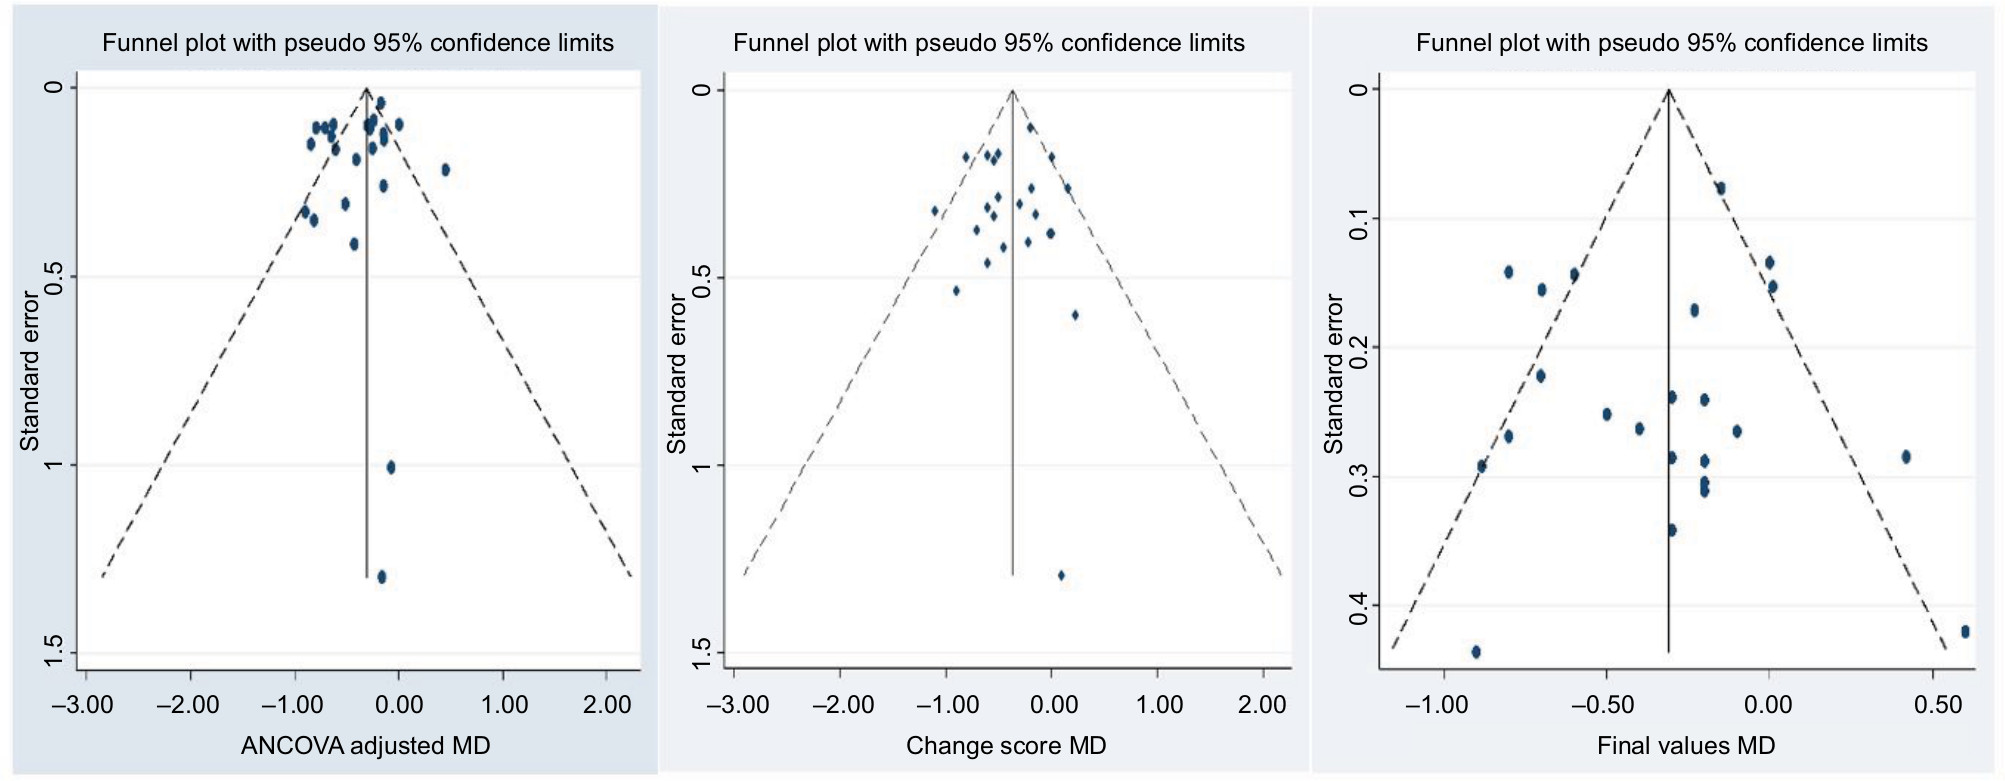 | Figure 6 Funnel plots for assessing publication bias. Abbreviation: MD, mean difference. |
Egger’s test for funnel plot symmetry obtained from the three methods suggested that there is not enough evidence for small-study effects (Table 2).
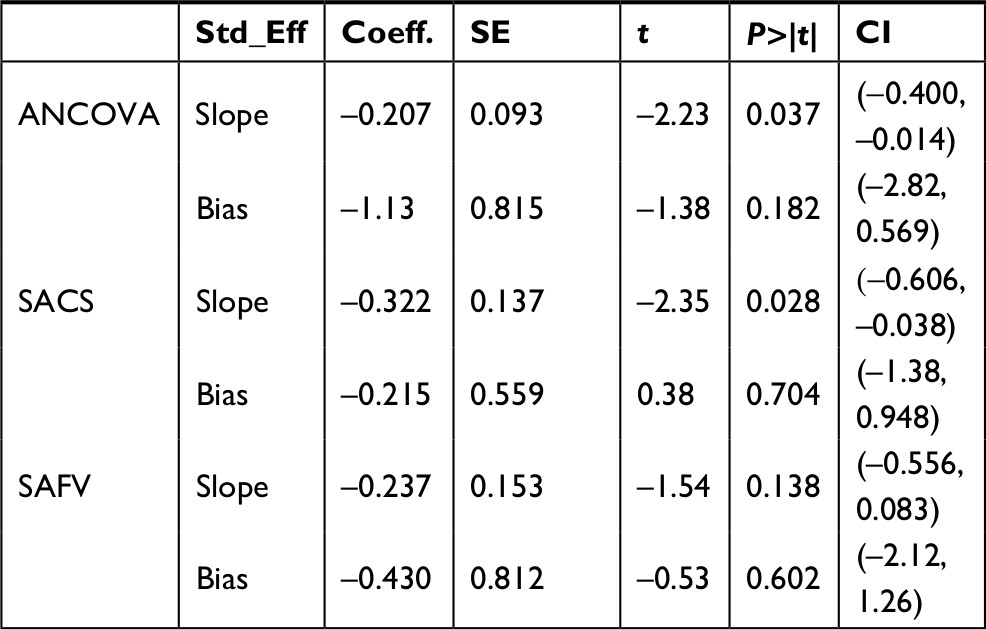 | Table 2 Egger’s test for assessing publication bias Abbreviations: ANCOVA, analysis of covariance; Coeff, coefficient; SACS, simple analysis of change score; SAFV, simple analysis of final values; Std_Eff, standard effect; SE, standard error. |
Performing the “trim and fill” test using effect sizes of ANCOVA and SAFV did not result in changes suggesting that the influence of publication bias was negligible. However, performing the “trim and fill” test using effect sizes obtained from SACS resulted in imputation of one study and the pooled HbA1c difference was changed into –0.40% (95%CI: −0.53,–0.26) using a random-effects meta-analysis.
Sensitivity analyses
We performed a sensitivity analysis by removing five studies with high baseline imbalance (≥±0.3) from the meta-analysis. The ANCOVA approach resulted in an MD of –0.41% (95%CI: [–0.54, –0.28]), while SAFV and SACS showed an MD of –0.37% (95%CI: [–0.52, –0.22]) and –0.35% (95%CI: [–0.45, –0.242]), respectively (see Supplementary material 1). Expectedly, the differences in the aggregated MDs across the three methods became less prominent when all studies having a baseline MD of ≥0.2 were removed from the meta-analyses. The ANCOVA approach resulted in an MD of –0.43% (95%CI: [–0.597, –0.27]), while SAFV and SACS show an MD of –0.40% (95%CI: [–0.59, –0.216]) and –0.39% (95%CI: [–0.55, –0.23]), respectively (see Supplementary material 1).
Additional sensitivity analyses were performed to check the effect of pre/post correlation on the effect size estimates obtained by the three methods. ANCOVA and SACS resulted in similar estimates but higher than SAFV effect size estimates after dropping studies with high pre/post correlation from the meta-analyses. Hence, ANCOVA and SACS resulted in a pooled effect size estimate of –0.40% (95%CI: [–0.53, –0.27]) and –0.40% (95%CI: [–0.54, –0.26]), respectively, while SAFV resulted in –0.34% (95%CI: [–0.49, –0.19]) after dropping one study with pre/post correlation value >0.7 (see Supplementary material 2). Similarly, dropping five studies with pre/post correlation value >±0.6 shows ANCOVA and SACS yielded a pooled effect size estimate of –0.47% (95%CI: [–0.64, –0.30]), –0.47% (95% CI: [–0.62, –0.32]) respectively, while SAFV provided –0.37% (95%CI: [–0.54, –0.20]; see Supplementary material 2). Meta-analyses performed by removing studies with both high baseline imbalance (≥±0.2%) and pre/post correlation of >±0.6 resulted in a pooled MD of –0.39% (95%CI: [–0.53, –0.26]), –0.40% (95%CI: [–0.54, –0.26]), and –0.33% (95%CI: [–0.48, –0.18]) using ANCOVA, SACS, and SAFV meta-analyses, respectively (see Supplementary material 2).
Discussion
This systematic review is the first to compare the effectiveness of digital interventions on changes in HbA1c levels by computing effect size estimates using SACS, SAFV, and ANCOVA adjusted MDs. This is also the first review to account for baseline imbalance and pre/post correlations using available robust statistical methods.
The pooled estimates obtained using the SACS, SAFV, and ANCOVA suggest clinically significant effects of digital interventions meaning reduced HbA1c levels of persons with poorly controlled T2DM. These findings reinforce the previously reported evidence regarding the beneficial effects of digital interventions.51–53 Digital interventions facilitate diabetes self-management by supporting patients with diabetes to keep track of their blood glucose, physical activity, nutrition, and other clinical and behavioral outcomes related with diabetes.54–65
Random-effects meta-analysis using ANCOVA and change scores provided identical effect size estimates. However, fixed-effects meta-analysis using change scores and comparing the results with ANCOVA and final values meta-analyses shows a slight difference in the pooled effect estimates acquired using the three methods. For all meta-analyses, the direction of the effect estimate remained unchanged. Sensitivity analyses performed by removing studies with higher baseline imbalance resulted in relatively similar pooled effect estimates across the three methods. This supports the recommendations in previous methodological literature pointing to the importance of adjusting for baseline MD using the ANCOVA approach in meta-analyses of trials with baseline imbalance.13,15,17 However, practical application of ANCOVA to synthesize effect sizes of continuous outcomes is complex due to the unavailability of summary data from RCTs or absence of IPD. Nevertheless, with available methodological guidance, it is possible to calculate ANCOVA adjusted MDs given that study authors report summary data for all intervention and control groups, such as baseline and follow-up mean values, as well as corresponding SDs, mean and SD values for changes over time, and finally sample sizes.13 Because the results of systematic reviews rely on the summary findings of individual studies, future RCTs, particularly those with baseline imbalance, need to be reported with extensive detail if they are to be included in more advanced meta-analyses. Beside this, publishing IPD with the results of the interventions will enhance transparency of the results at the primary study level and simplify evidence syntheses subsequently.
In this review, the heterogeneity I2 statistics computed using the three methods shows differences across the choice of meta-analytic methods. A lower heterogeneity estimate was obtained using SACS. Eyeball test on the forest plots of the three methods shows the confidence intervals of one study (a study by Khanna et al)42 deviates from the general pattern of the other studies on the plots. The deviation by this study gets smaller in the forest plot for SACS meta-analysis. This explains the reason why SACS has the lowest heterogeneity compared with ANCOVA and SAFV. Previously, Fu and Holmer described that there is no clear pattern of heterogeneity estimates among the three methods.12 Whether to use random-effects or fixed-effects meta-analyses can be statistically guided by the results of the I2 statistics.32 Which meta-analytic method produces decreased or increased heterogeneity statistics or whether there is a particular pattern across the three methods requires further research.
The results of publication bias assessment via an inspection of funnel plots were not consistent across the three methods. A relatively more symmetric funnel plot was constructed using the estimates obtained from the SAFV. However, funnel plots displayed for ANCOVA and SACS indicated the presence of symmetry at the top and studies missing at the lower half of the plot indicating a publication bias with regard to our sample of included studies. However, Egger’s test for all the three methods suggested that there was no evidence suggesting publication bias. Further publication bias analyses using “trim and fill” method did not impute any missing study for ANCOVA and SAFV. However, one missing study was imputed for the SACS. Literature regarding comparison of publication bias across the three meta-analytic methods is currently lacking.
Performing sensitivity analyses is important to check the robustness of estimates obtained from trials with baseline imbalance.13,66 Following this previously stated recommendation, we performed sensitivity analyses by removing studies with high baseline imbalance values. These analyses show that relatively comparable pooled estimates were obtained using ANCOVA, SACS, and SAFV meta-analyses. These results, in line with existing studies, suggest the importance of accounting for baseline imbalance by aggregating continuous outcome measures.12,13,27,67
ANCOVA and SACS yielded similar pooled estimates after removing studies with high pre/post correlation values from the meta-analyses. Similar to our result, existing evidence shows that when the value of pre/post correlation gets closer to 1.0, ANCOVA and SACS tend to produce similar effect size estimates.12,13,27 Inspecting individual study effect sizes obtained using the three methods also shows that, ANCOVA and SAFV tend to produce similar effect size estimates as correlation values approach zero.68
Limitations
The study has limitations. First, our search was limited to three databases only: MEDLINE, ISI Web of Science, and PsycINFO. We tried to check whether this had an impact on our search output. There was no noticeable difference compared with our preliminary search in additional search databases, such as EMBASE and CINAHL. Hence, we decided to focus on the three included databases, especially considering the workload to request and impute missing data which was crucial to answer our research questions of interest. Second, we did not consider unindexed databases and gray literature. Third, most of the studies did not report ANCOVA effect sizes. Our ANCOVA effect size calculation mainly relies on imputation from the reported data using robust statistical methods, but uncertainties remain.
Conclusion
All three meta-analytic methods show a significant effect of digital interventions on changing HbA1c levels. Analysis on the effect sizes computed for each study using the three methods did not differ significantly. However, some differences were noted among the pooled effect sizes applying different statistical methods by accounting for baseline imbalances of the outcome. Authors of future systematic reviews and meta-analyses should consider using ANCOVA to estimate effect sizes, at least for interventions with baseline imbalance. However, we recognize the statistical challenge of computing ANCOVA effect sizes, if the necessary data are not reported for individual studies. Hence, future RCTs, particularly those with baseline imbalance, should report ANCOVA effect sizes. In addition, publishing IPD along with the changes in the outcomes as a result of intervention participation is helpful to simplify robust evidence syntheses.
Data sharing statement
The data collected for this study can be received from the corresponding author.
Acknowledgments
We would like to thank our research librarian, Lara Christianson, for her support in developing the search strategy and optimizing it to each search database. We are grateful to Professor HajoZeeb, Professor Richard D Riley, Dr Jochen Wilhelm, Dr James E Pustejovsky, Professor Vanessa Didelez, and Dr Fleur Fritz for the methodological support. In addition, we are also very grateful to all corresponding authors of the individual studies for providing us with the data we requested. We disclose that the results of this study were presented as oral presentation at the 10th Biennial Joanna Briggs Institute Colloquium 2018 in Antwerp, Belgium.
Author contributions
MMK performed conceptualization, design, systematic literature search, title and abstract screening, quality assessment, data extraction, data analysis and interpretation of the data, and write-up. MP performed title and abstract screening, and quality assessment write-up. TLH and CRP performed conceptualization, extraction of the data, and critical review. All authors contributed toward data analysis, drafting and critically revising the paper, gave final approval of the version to be published and agree to be accountable for all aspects of the work.
Disclosure
The authors report no conflicts of interest in this work.
References
Lutz B, Rüdiger M. Growth rates of modern science: a bibliometric analysis based on the number of publications and cited references. J Assoc Inf Sci Technol. 2015;66(11):2215–2222. | ||
Bastian H, Glasziou P, Chalmers I. Seventy-five trials and eleven systematic reviews a day: how will we ever keep up? PLoS Med. 2010;7(9): e1000326. | ||
Haidich AB. Meta-analysis in medical research. Hippokratia. 2010;14(Suppl 1):29–37. | ||
Glass GV. Primary, secondary, and meta-analysis of research. Educ Res. 1976;5(10):3–8. | ||
Biondi-Zoccai G, Landoni G, Modena MG. A journey into clinical evidence: from case reports to mixed treatment comparisons. HSR Proc Intensive Care Cardiovasc Anesth. 2011;3(2):93–96. | ||
Greco T, Zangrillo A, Biondi-Zoccai G, Landoni G. Meta-analysis: pitfalls and hints. Heart Lung Vessel. 2013;5(4):219–225. | ||
PubMed. diabetes and (meta-analys* or metaanalys*) Secondary diabetes and (meta-analys* or metaanalys*); 2018. Available from: https://www.ncbi.nlm.nih.gov/pubmed/?term=diabetes+and+(meta-analys*+ or+metaanalys*). Accessed December 4, 2018. | ||
Shinogle JA. Methodological Challenges Associated with Meta-Analyses in Health Care and Behavioral Health Research. Baltimore, MD: University of Maryland; 2012. | ||
Lorenc T, Felix L, Petticrew M, et al. Meta-analysis, complexity, and heterogeneity: a qualitative interview study of researchers’ methodological values and practices. Syst Rev. 2016;5(1):192. | ||
Alahdab F, Zaiem F, Wang Z, Murad MH. Interpreting meta-analysis of continuous outcomes with pre and postvalues. Evid Based Med. 2016;21(4):139–140. | ||
Chogtu B, Magazine R, Bairy KL. Statin use and risk of diabetes mellitus. World J Diabetes. 2015;6(2):352–357. | ||
Fu R, Holmer HK. Change score or follow-up score? Choice of mean difference estimates could impact meta-analysis conclusions. J Clin Epidemiol. 2016;76:108–117. | ||
Fu R, Vandermeer BW, Shamliyan TA, et al. Handling continuous outcomes in quantitative synthesis. Methods Guide for Effectiveness and Comparative Effectiveness Reviews. Rockville, MD: Agency for Healthcare Research and Quality; 2008. | ||
William F, Rosenberger JML. Randomization in Clinical Trials: Theory and Practice. New York: Wiley; 2005. | ||
Mckenzie JE, Herbison GP, Deeks JJ. Impact of analysing continuous outcomes using final values, change scores and analysis of covariance on the performance of meta-analytic methods: a simulation study. Res Synth Methods. 2016;7(4):371–386. | ||
Morris SB, Deshon RP. Combining effect size estimates in meta-analysis with repeated measures and independent-groups designs. Psychol Methods. 2002;7(1):105–125. | ||
Riley RD, Kauser I, Bland M, et al. Meta-analysis of randomised trials with a continuous outcome according to baseline imbalance and availability of individual participant data. Stat Med. 2013;32(16):2747–2766. | ||
Kebede MM, Zeeb H, Peters M, Heise TL, Pischke CR. Effectiveness of digital interventions for improving glycemic control in persons with poorly controlled Type 2 diabetes: a systematic review, meta-analysis, and meta-regression analysis. Diabetes Technol Ther. 2018;20(11):767–782. | ||
Kebede M, Christianson L, Khan Z, Heise TL, Pischke CR. Effectiveness of behavioral change techniques employed in eHealth interventions designed to improve glycemic control in persons with poorly controlled type 2 diabetes: a systematic review and meta-analysis protocol. Syst Rev. 2017;6(1):211. | ||
Eysenbach G. What is e-health? J Med Internet Res. 2001;3(2):e20. | ||
Higgins JP, Altman DG, Gøtzsche PC, et al. The Cochrane Collaboration’s tool for assessing risk of bias in randomised trials. BMJ. 2011;343:d5928. | ||
Covidence systematic review software, Veritas Health Innovation, Melbourne, Australia. | ||
Higgins JPT, Green S. Cochrane Handbook for Systematic Reviews of Interventions; 2011. Available from: http://handbook-5-1.cochrane.org/. Accessed October 25, 2018. | ||
Wakefield BJ, Koopman RJ, Keplinger LE, et al. Effect of home telemonitoring on glycemic and blood pressure control in primary care clinic patients with diabetes. Telemed J E Health. 2014;20(3):199–205. | ||
Arora S, Peters AL, Burner E, Lam CN, Menchine M. Trial to examine text message-based mHealth in emergency department patients with diabetes (TExT-MED): a randomized controlled trial. Ann Emerg Med. 2014;63(6):745–754. | ||
Hozo SP, Djulbegovic B, Hozo I. Estimating the mean and variance from the median, range, and the size of a sample. BMC Med Res Methodol. 2005;5:13. | ||
Vickers AJ, Altman DG. Statistics notes: analysing controlled trials with baseline and follow up measurements. BMJ. 2001;323(7321):1123–1124. | ||
Cho JH, Kwon HS, Kim HS, Oh JA, Yoon KH. Effects on diabetes management of a health-care provider mediated, remote coaching system via a PDA-type glucometer and the Internet. J Telemed Telecare. 2011;17(7):365–370. | ||
Egede LE, Williams JS, Voronca DC, Knapp RG, Fernandes JK. Randomized controlled trial of technology-assisted case management in low income adults with type 2 diabetes. Diabetes Technol Ther. 2017;19(8):476–482. | ||
Ralston JD, Hirsch IB, Hoath J, Mullen M, Cheadle A, Goldberg HI. Web-based collaborative care for type 2 diabetes: a pilot randomized trial. Diabetes Care. 2009;32(2):234–239. | ||
Torbjørnsen A, Jenum AK, Småstuen MC, et al. A low-intensity mobile health intervention with and without health counseling for persons with Type 2 diabetes, part 1: baseline and short-term results from a randomized controlled trial in the Norwegian Part of RENEWING HEALTH. JMIR Mhealth Uhealth. 2014;2(4):e52. | ||
Higgins JP, Thompson SG, Deeks JJ, Altman DG. Measuring inconsistency in meta-analyses. BMJ. 2003;327(7414):557–560. | ||
Egger M, Davey Smith G, Schneider M, Minder C. Bias in meta-analysis detected by a simple, graphical test. BMJ. 1997;315(7109):629–634. | ||
Duval S. Tweedie R. A nonparametric “Trim and Fill” method of accounting for publication bias in meta-analysis. J Am Stat Assoc. 2000;95(449):89–98. | ||
Agboola S, Jethwani K, Lopez L, Searl M, O’Keefe S, Kvedar J. Text to move: a randomized controlled trial of a text-messaging program to improve physical activity behaviors in patients with Type 2 diabetes mellitus. J Med Internet Res. 2016;18(11):e307. | ||
Capozza K, Woolsey S, Georgsson M, et al. Going mobile with diabetes support: a randomized study of a text message-based personalized behavioral intervention for type 2 diabetes self-care. Diabetes Spectr. 2015;28(2):83–91. | ||
Cho JH, Kim HS, Yoo SH, et al. An Internet-based health gateway device for interactive communication and automatic data uploading: clinical efficacy for type 2 diabetes in a multi-centre trial. J Telemed Telecare. 2017;23(6):595–604. | ||
Dario C, Toffanin R, Calcaterra F, et al. Telemonitoring of Type 2 diabetes mellitus in Italy. Telemed J E Health. 2017;23(2):143–152. | ||
Fortmann AL, Gallo LC, Garcia MI, et al. Dulce digital: an mHealth SMS-based intervention improves glycemic control in Hispanics with Type 2 diabetes. Diabetes Care. 2017;40(10):1349–1355. | ||
Hansen CR, Perrild H, Koefoed BG, Zander M. Video consultations as add-on to standard care among patients with type 2 diabetes not responding to standard regimens: a randomized controlled trial. Eur J Endocrinol. 2017;176(6):727–736. | ||
Holmen H, Torbjørnsen A, Wahl AK, et al. A Mobile health intervention for self-management and lifestyle change for persons with Type 2 diabetes, part 2: One-year results from the Norwegian randomized controlled trial RENEWING HEALTH. JMIR Mhealth Uhealth. 2014;2(4):e57. | ||
Khanna R, Stoddard PJ, Gonzales EN, et al. An automated telephone nutrition support system for Spanish-speaking patients with diabetes. J Diabetes Sci Technol. 2014;8(6):1115–1120. | ||
Kim HS, Sun C, Yang SJ, et al. Randomized, open-label, parallel group study to evaluate the effect of internet-based glucose management system on subjects with diabetes in China. Telemed J E Health. 2016;22(8):666–674. | ||
Kleinman NJ, Shah A, Shah S, Phatak S, Viswanathan V. Improved medication adherence and frequency of blood glucose self-testing using an m-Health platform versus usual care in a multisite randomized clinical trial among people with Type 2 diabetes in India. Telemed J E Health. 2017;23(9):733–740. | ||
Liou JK, Soon MS, Chen CH, et al. Shared care combined with telecare improves glycemic control of diabetic patients in a rural underserved community. Telemed J E Health. 2014;20(2):175–178. | ||
Tang PC, Overhage JM, Chan AS, et al. Online disease management of diabetes: engaging and motivating patients online with enhanced resources-diabetes (EMPOWER-D), a randomized controlled trial. J Am Med Inform Assoc. 2013;20(3):526–534. | ||
Tildesley HD, Mazanderani AB, Chan JHM, Ross SA. Efficacy of A1C reduction using internet intervention in patients with Type 2 diabetes treated with insulin. Can J Diabetes. 2011;35(3):250–253. | ||
Wang G, Zhang Z, Feng Y, et al. Telemedicine in the management of Type 2 diabetes mellitus. Am J Med Sci. 2017;353(1):1–5. | ||
Welch G, Zagarins SE, Santiago-Kelly P, et al. An internet-based diabetes management platform improves team care and outcomes in an urban Latino population. Diabetes Care. 2015;38(4):561–567. | ||
Wild SH, Hanley J, Lewis SC, et al. Supported telemonitoring and glycemic control in people with Type 2 diabetes: the telescot diabetes pragmatic multicenter randomized controlled trial. PLOS Med. 2016;13(7):e1002163. | ||
Alharbi NS, Alsubki N, Jones S, et al. Impact of information technology-based interventions for Type 2 diabetes mellitus on glycemic control: a systematic review and meta-analysis. J Med Internet Res. 2016;18(11):e310. | ||
Zhai YK, Zhu WJ, Cai YL, Sun DX, Zhao J. Clinical- and cost-effectiveness of telemedicine in type 2 diabetes mellitus: a systematic review and meta-analysis. Medicine. 2014;93(28):e312. | ||
Verhoeven F, van Gemert-Pijnen L, Dijkstra K, Nijland N, Seydel E, Steehouder M. The contribution of teleconsultation and videoconferencing to diabetes care: a systematic literature review. J Med Internet Res. 2007;9(5):e37. | ||
Tricco AC, Ivers NM, Grimshaw JM, et al. Effectiveness of quality improvement strategies on the management of diabetes: a systematic review and meta-analysis. Lancet. 2012;379(9833):2252–2261. | ||
Su D, Zhou J, Kelley MS, et al. Does telemedicine improve treatment outcomes for diabetes? A meta-analysis of results from 55 randomized controlled trials. Diabetes Res Clin Pract. 2016;116:136–148. | ||
Stratton IM, Adler AI, Neil HA, et al. Association of glycaemia with macrovascular and microvascular complications of type 2 diabetes (UKPDS 35): prospective observational study. BMJ. 2000;321(7258):405–412. | ||
Farmer AJ, Mcsharry J, Rowbotham S, Mcgowan L, Ricci-Cabello I, French DP. Effects of interventions promoting monitoring of medication use and brief messaging on medication adherence for people with Type 2 diabetes: a systematic review of randomized trials. Diabet Med. 2016;33(5):565–579. | ||
Cheng L, Sit JW, Choi KC, et al. Effectiveness of interactive self-management interventions in individuals with poorly controlled Type 2 diabetes: a meta-analysis of randomized controlled trials. Worldviews Evid Based Nurs. 2017;14(1):65–73. | ||
Avery L, Flynn D, van Wersch A, Sniehotta FF, Trenell MI. Changing physical activity behavior in type 2 diabetes: a systematic review and meta-analysis of behavioral interventions. Diabetes Care. 2012;35(12):2681–2689. | ||
Baron J, Mcbain H, Newman S. The impact of mobile monitoring technologies on glycosylated hemoglobin in diabetes: a systematic review. J Diabetes Sci Technol. 2012;6(5):1185–1196. | ||
Kirwan M, Vandelanotte C, Fenning A, Duncan MJ. Diabetes self-management smartphone application for adults with type 1 diabetes: randomized controlled trial. J Med Internet Res. 2013;15(11):e235. | ||
El-Gayar O, Timsina P, Nawar N, Eid W. Mobile applications for diabetes self-management: status and potential. J Diabetes Sci Technol. 2013;7(1):247–262. | ||
Williams JP, Schroeder D. Popular glucose tracking apps and use of mHealth by Latinos with diabetes: review. JMIR Mhealth Uhealth. 2015;3(3):e84. | ||
Ryan EA, Holland J, Stroulia E, et al. Improved A1C levels in Type 1 diabetes with Smartphone app use. Can J Diabetes. 2017;41(1):33–40. | ||
Kebede MM, Liedtke TP, Möllers T, Pischke CR. Characterizing active ingredients of eHealth interventions targeting persons with poorly controlled Type 2 diabetes mellitus using the behavior change techniques taxonomy: scoping review. J Med Internet Res. 2017;19(10): e348. | ||
Aiello F, Attanasio M, Tinè F. Assessing covariate imbalance in meta-analysis studies. Stat Med. 2011;30(22):2671–2682. | ||
Trowman R, Dumville JC, Torgerson DJ, Cranny G. The impact of trial baseline imbalances should be considered in systematic reviews: a methodological case study. J Clin Epidemiol. 2007;60(12):1229–1233. | ||
Mckenzie J. Meta-analysis of continuous data: final values, change scores, and ANCOVA. In: Cochrane Statistical Methods Training Course: Addressing advanced issues in meta-analytical techniques; March 4–5, 2010; Cardiff, UK. | ||
Torbjornsen A, Jenum AK, Smastuen MC, et al. A Low-Intensity Mobile Health Intervention With and Without Health Counseling for Persons With Type 2 Diabetes, Part 1: Baseline and Short-Term Results From a Randomized Controlled Trial in the Norwegian Part of RENEWING HEALTH. JMIR mhealth uhealth. 2014;2(4):e52. doi:10.2196/mhealth.3535 |
 © 2018 The Author(s). This work is published and licensed by Dove Medical Press Limited. The
full terms of this license are available at https://www.dovepress.com/terms
and incorporate the Creative Commons Attribution
- Non Commercial (unported, 3.0) License.
By accessing the work you hereby accept the Terms. Non-commercial uses of the work are permitted
without any further permission from Dove Medical Press Limited, provided the work is properly
attributed. For permission for commercial use of this work, please see paragraphs 4.2 and 5 of our Terms.
© 2018 The Author(s). This work is published and licensed by Dove Medical Press Limited. The
full terms of this license are available at https://www.dovepress.com/terms
and incorporate the Creative Commons Attribution
- Non Commercial (unported, 3.0) License.
By accessing the work you hereby accept the Terms. Non-commercial uses of the work are permitted
without any further permission from Dove Medical Press Limited, provided the work is properly
attributed. For permission for commercial use of this work, please see paragraphs 4.2 and 5 of our Terms.