Back to Journals » OncoTargets and Therapy » Volume 14
Comparative Transcriptome Provides a Systematic Perspective on Epstein–Barr Virus-Associated Gastric Carcinoma Cell Lines
Authors Huang JT ![]() , Chen JN, Bi YH, Gong LP, Zhang JY, DU Y, Shao CK
, Chen JN, Bi YH, Gong LP, Zhang JY, DU Y, Shao CK
Received 3 August 2021
Accepted for publication 12 October 2021
Published 23 October 2021 Volume 2021:14 Pages 5169—5182
DOI https://doi.org/10.2147/OTT.S332513
Checked for plagiarism Yes
Review by Single anonymous peer review
Peer reviewer comments 2
Editor who approved publication: Dr Arseniy Yuzhalin
Jun-Ting Huang,1,2 Jian-Ning Chen,1 Yuan-Hua Bi,1 Li-Ping Gong,1 Jing-Yue Zhang,1 Yu DU,1 Chun-Kui Shao1
1Department of Pathology, The Third Affiliated Hospital, Sun Yat-sen University, Guangzhou, People’s Republic of China; 2Department of Emergency, The First Affiliated Hospital, Guangzhou Medical University, Guangzhou, People’s Republic of China
Correspondence: Chun-Kui Shao
Department of Pathology, The Third Affiliated Hospital, Sun Yat-sen University, No. 500 Tian He Road, Guangzhou, 510000, People’s Republic of China
Email [email protected]
Purpose: Epstein–Barr virus (EBV) is widely recognised to cause various tumours, and EBV-associated gastric carcinoma (EBVaGC) is a special type of GC. It has obviously different clinical features and pathological manifestations from EBV-negative gastric carcinoma, but its progression remains elusive. The underlying cancer progression of viral infection detected by genome-wide transcriptome analysis has been demonstrated in numerous diseases.
Methods: We performed comparative RNA sequencing to identify gene expression signatures between GC and EBVaGC cell lines. The differentially expressed (DE) genes were analysed using gene ontology and pathway enrichment.
Results: A total of 4438 DE mRNAs, 3650 DE long non-coding RNAs (lncRNAs), and 248 DE circular RNAs (circRNAs) were detected in GC cells after EBV infection, most of which were highly related to oncogenesis. Likewise, EBV-coding RNA and non-coding RNA were also well-supplemented in EBVaGC. According to bioinformatics, DE mRNAs may contribute to the completion of EBV-infected host cells and modulate mitosis. Binding to actin and participating in adherens junctions to promote contact between the virus and cells are a potential function of DE lncRNAs. The roles of DE circRNAs were enriched in DNA repair and protein modification, and a typical example of this is acting as an miRNA sponge. The establishment of a circRNA-miRNA-mRNA network helps to determine the key elements in the progression of EBVaGC.
Conclusion: This study is the first to systematically reveal the transcriptome landscape of EBVaGC, which will provide an essential resource for genomic, genetic, and molecular mechanisms in the future.
Keywords: transcriptome, RNA-sequencing, bioinformatics, regulatory network, EBV-associated gastric cancer
Introduction
Epstein–Barr virus (EBV), formally known as human gammaherpesvirus 4, is one of the most common viruses in humans, infecting nearly 90% of adults and providing adaptive immunity. EBV infection can lead to the occurrence of a variety of diseases, such as B-cell-related diseases including infectious mononucleosis and Burkitt lymphoma, and epithelial-related diseases such as nasopharyngeal carcinoma and gastric carcinoma (GC).1 EBV encoded small RNA (EBER) was detected by in situ hybridisation (ISH) in gastric cancer tissue, which was defined as EBV-associated gastric carcinoma (EBVaGC). A number of clinical studies have shown that EBVaGC accounts for 10% of global GC cases,2 with nearly 95,000 new cases of EBVaGC occurring worldwide each year.3 In 2014, the Cancer Genome Atlas (TCGA) working group reported a new classification of GC divided into four subtypes: Epstein–Barr virus positive, microsatellite unstable (MSI), genomically stable (GS), and chromosomal instability (CIN),4 further emphasising that EBVaGC is an independent molecular type of GC. EBVaGC compared with EBV-negative gastric carcinoma (EBVnGC) has significantly different clinicopathological features: mostly occurring in males and younger individuals, with better prognosis, located in the cardia and gastric fundus, showing lymphocyte infiltration, and having a general diffuse histological type. The aforementioned cases indicate that EBVaGC may have a unique cancer progression in EBVnGC. However, there is no specific treatment for EBVaGC, and the molecular mechanisms remain largely unknown.
Noncoding RNA (ncRNA) is a class molecule that cannot be translated into protein, because it has no function and for a long time was known as “junk RNA”–a product of spurious transcription.5 There is increasing evidence that ncRNAs are involved in almost every aspect of biological and pathological processes, and many ncRNA have been redefined as functional, including microRNAs (miRNAs), long non-coding RNAs (lncRNAs), and circular RNAs (circRNAs).6 In our previous miRNA sequencing studies, it was found that EBV miRNAs could promote the metastasis of EBVaGC by targeting APC and DKK1 and activating the Wnt signalling pathway. Moreover, differential expression of EBV miRNA was significantly associated with lymph node metastasis and 5-year overall survival.7 To the best of our knowledge, the expression profile of the whole transcriptome has not yet been reported in EBVaGC, particularly in lncRNAs and circRNAs, and their relationship to mRNA. Therefore, we first infected human GC cell line AGS with EBV to construct the AGS-EBV cell line and then sequenced the expression profiles of mRNAs, lncRNAs, and circRNAs in the AGS and AGS-EBV groups. The functions of the RNA were analysed using Gene Ontology (GO), Kyoto Encyclopaedia of Genes and Genomes (KEGG), and Reactome. Finally, the circRNA-miRNA-mRNA network was constructed to identify key genes that might contribute to the progression of EBVaGC.
Materials and Methods
Cell Culture and RNA Isolation
AGS is an EBV-negative human GC cell line. The AGS-EBV cell line was established from AGS cells co-cultivated with Akata cells using the cell-to-cell contact method8 described as AGS cell infection with a recombinant EBV strain. All cells were cultured in RPMI-1640 medium (Gibco, USA) containing 10% foetal bovine serum (FBS; Gibco) at 37 °C with 5% CO2. Total RNA was extracted from cultured cells using TRIzol reagent (Invitrogen, Carlsbad, CA, USA) according to the manufacturer’s instructions. The RNA extracts were stored at ‑80 °C.
Successful Establishment of AGS-EBV Model
We cultured Akata cells that could be modified to produce recombinant EBV, and the recombinant viral DNA contained the neomycin resistance gene (Neor) and green fluorescent protein (GFP) for easy screening and observation. We then used goat anti-IgG to induce EBV in Akata cells from the latent to active state for 24 h, followed by co-incubation with AGS cells for 48 h. Finally, Akata cells were washed with RPMI, and 500 μg/mL G418 (Gibco) was added to RPMI to select for retention of the EBV episome. GFP in cells was observed by fluorescence microscopy to identify the EBV-positive AGS cell line (AGS-EBV).
RNA Sequencing
The reads were first mapped to the latest UCSC transcript set using Bowtie2 version 2.1.0, and the gene expression level was estimated using RSEM v1.2.15. Whole-genome sequencing reads were mapped to the EBV reference genome (NC_007605). For lncRNA expression analysis, we used the transcripts set from Lncipedia (http://www.lncipedia.org). TMM (trimmed mean of M-values) was used to normalise gene expression. Differentially expressed (DE) genes were identified using edgeR. Genes showing altered expression with p < 0.05 and more than 1.5-fold changes were considered differentially expressed. For circRNA expression analysis, the reads were mapped to the genome using STAR, and DCC was used to identify the cirRNA and to estimate circRNA expression. TMM (trimmed mean of M-values) was used to normalise gene expression. DE genes were identified using EdgeR.
GO Analysis
GO analysis (http://www.geneontology.org) was used to set up the gene annotations. The DE transcriptome was classified into GO terms, including biological process (BP), cellular component (CC), and molecular function (MF). Fisher’s exact test was applied for the GO analysis with a significant P-value calculated, and FDR was used to correct the P-values.
KEGG and Reactome Pathway Analysis
Kyoto Encyclopaedia of Genes and Genomes (KEGG) (https://www.kegg.jp) and Reactome (http://reactome.org) pathway analyses were utilized to describe the genes’ attributes. Fisher’s exact test was used to select the significant pathway, and the threshold of significance was defined as FDR < 0.05. To assess the main functional pathways of EBVaGC, DE genes were assessed by GO annotation, KEGG, and Reactome pathway analyses using the cluster Profiler package in R.9
GO Tree
The GO is structured as a directed acyclic graph, and each term defines the relationships to one or more other terms. The GO tree was built using the GO gene annotation terms. In the GO analysis based on up-down DE genes, significant GO items (p < 0.01) were selected to construct a topology plot. This was a more convenient visual method to summarise the influence functions in this study.10
Real-Time Quantitative Polymerase Chain Reaction Verification of DE Genes
Based on the comprehensive analysis of sequencing data and existing databases, qRT-PCR was performed to verify the transcriptome sequencing results of 12 genes that may be involved in viral infection and regulation of cell growth, cell cycle, and cell apoptosis. Premier software (version 6.0) was used to design the qPCR primers, which were synthesised by Sangon Biotech Company. β-actin was used as an internal reference gene, as shown in the Supplementary Material.
Prediction of circRNA-miRNA and miRNA-mRNA Interaction
MiRanda (http://www.microrna.org) was used to predict the miRNA target of the circRNA, and the DE circRNAs within all comparisons were annotated in detail with the circRNA-miRNA interaction information. miRNA target genes were obtained from miRBase (www.mirbase.org) to construct the miRNA-mRNA interactions. R software (http://www.r-project.org/) was used to generate the network.
Statistical Analysis
All statistical analyses were performed using SPSS software (version 20.0; IBM, SPSS, USA). One-way analysis of variance (ANOVA) was used to analyse the difference in expression levels between groups, followed by Student’s t-test. Linear correlation analysis was used to verify the consistency of trends between the q-PCR and RNA-seq results. A P value ≤ 0.05 and fold change of 1.5 were considered statistically significant.
Results
Whole Transcriptome Sequence Analysis
First, whole-genome sequencing reads were mapped to the human reference genome (UCSC hg19) and the EBV reference genome (NC_007605). The workflow of the overall data analysis is shown in Figure s1. Total RNA was extracted from AGS and AGS-EBV, and valid reads were obtained after rRNA depletion. Reads were mapped to the genome using TopHat211 to analyse the expression of mRNAs and lncRNAs. The remaining unmapped reads were subjected to circRNA prediction algorithm to identify the circRNA expression profile, and then the circRNA-miRNA network was constructed by the pair’s prediction between circRNA and its potential target miRNA. Finally, all DE mRNA, lncRNA, and circRNA functional enrichment analyses were performed by GO, and KEGG and Reactome Function enrichment analysis was performed to predict potential biological functions of the differentially expressed genes.
In this experimental process, we found that most reads were mapped to the coding region, untranslated region (UTR), and intronic regions, while reads mapped to intergenic regions had the lowest abundance (Figure 1A). Interestingly, perhaps due to EBV infection stress, the total mapped read of AGS-EBV cells was higher (9.9 x 10⁷ vs 8.0×10⁷) than that in the AGS cells, and also appeared in separate region reads. Although the number of reads varied, the dataset distribution had a great degree of standardisation. As shown in Figure 1B, the median of log2 ratios among the six samples was almost the same after normalisation, indicating that the expression distribution was closed. Furthermore, based on their expression value (fragments per kilobase of transcript per million or FPKM) by mapping all transcripts to the reference genome, we created a circos-plot to present the DE mRNAs, lncRNAs, and circRNAs between AGS-EBV and uninfected cells (Figure 1C).
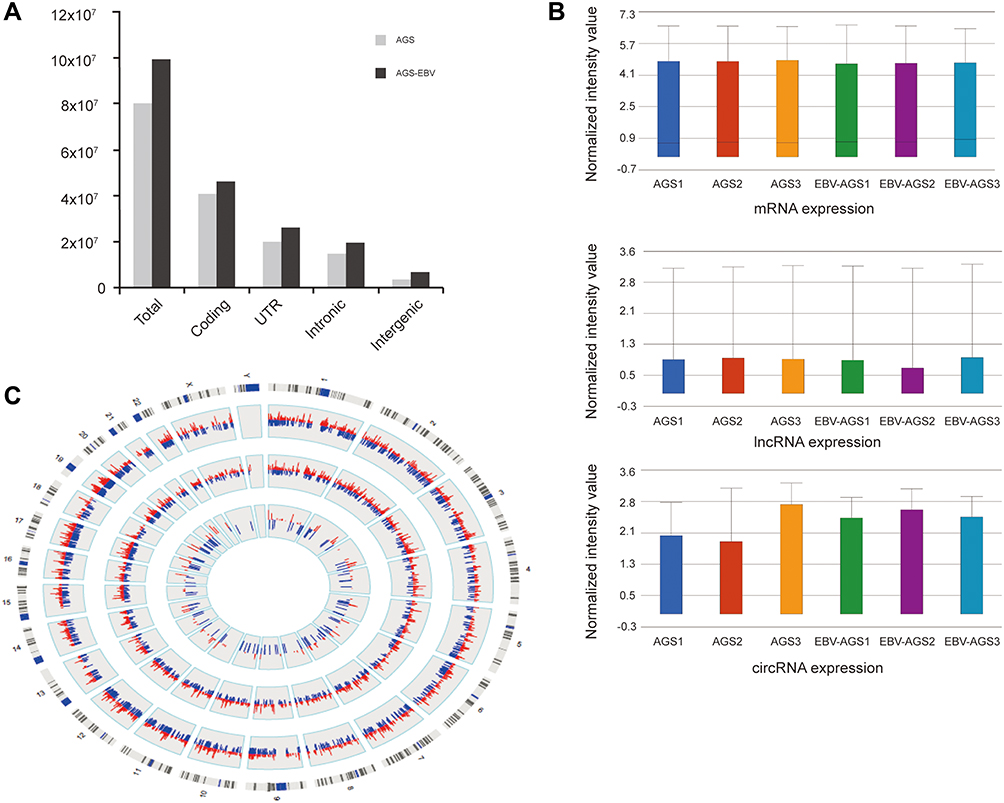 |
Figure 1 Overview of RNA-seq data. (A) The majority of reads were mapped to Coding, UTR, Intronic, and Intergenic region. (B) The box plot is a convenient way to compare the distributions of expression values for AGS-EBV and AGS after normalization. (C) Compared with AGS, all AGS-EBV transcripts are presented based on their expression value (FPKM) by mapping them to the chromosomal location. Red: up-regulation; blue: down-regulation; inner circle: circRNA; middle circle: lncRNA; outer circle: mRNA. |
Differential Expression of mRNA in Response to EBV Infection
The mRNA expression profile showed distinct differences between EBV-infected and uninfected cells in cluster analysis, and the volcano plot clearly displayed the variations (Figure 2A and B). A total of 4438 DE mRNAs were detected in AGS-EBV; 2389 mRNAs were up-regulated, 2049 were down-regulated, and the top 20 DE mRNAs are listed in detail (Supplementary Data).
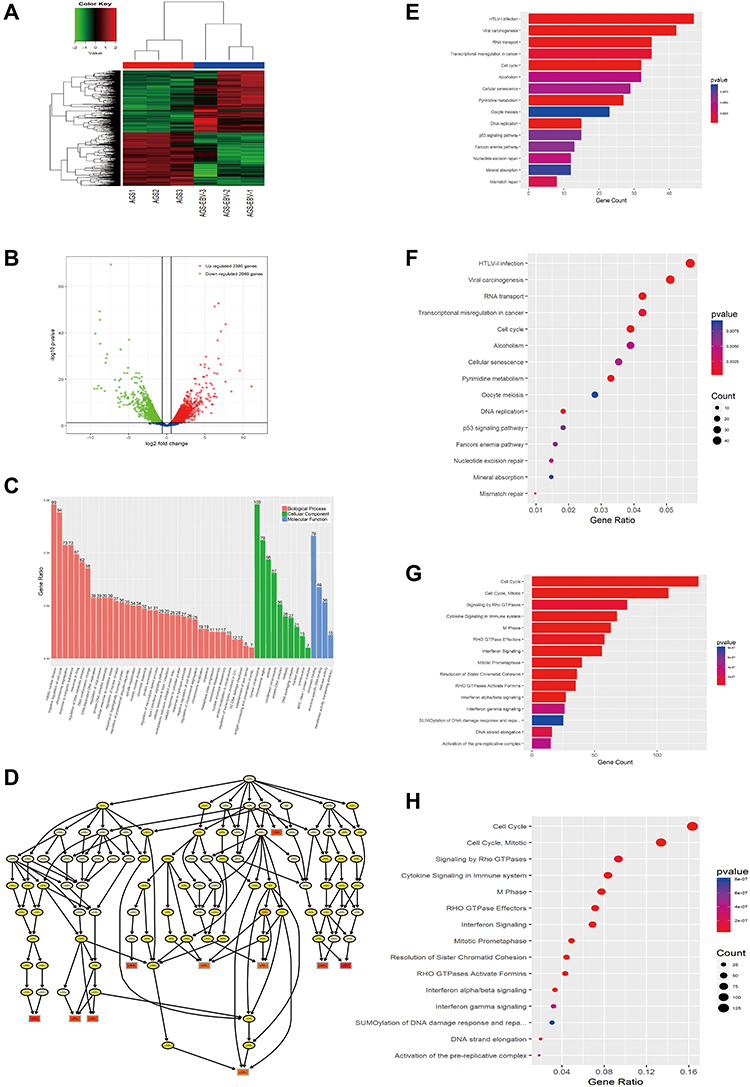 |
Figure 2 Differential expression of mRNA in response to EBV infection. (A) Hierarchical clustering analysis and the heat map demonstrates the different levels of mRNA expression between AGS-EBV and AGS. The colour scale of the strips runs from green (low relative expression) through black (medium relative expression) to red (high relative expression). (B) Volcano plot visualizing the differentially expressed mRNA. The vertical green lines refer to a 1.5-fold (log2 scaled) up-regulation and down-regulation, respectively. The horizontal green line corresponds to a P-value of 0.05 (−log10 scaled). The red points in the plot represent up-regulated mRNAs with statistical significance, while the down-regulated mRNAs are shown by green. (C) The top 50 enrichment scores in gene ontology (GO) enrichment analysis of dysregulated mRNA. Red bars represent cell biological process. Green bars represent cell component terms. Blue bars represent molecular function terms. (D) Go tree illustrating the top 10 Go term. (E–H) Top 15 classes of KEGG and Reactome pathway enrichment terms, respectively. The larger the rich factor the greater the enrichment. |
Bioinformatics analysis has been widely used in tumour research as a crucial tool for exploring gene function and characteristics. Thus, GO, KEGG, and Reactome pathway enrichment analyses were performed to explore the roles of DE mRNAs in AGS-EBV. The GO terms showed the most remarkable biological processes in DE mRNAs, including mitotic nuclear division, negative regulation of the cell cycle, and chromosome segregation. Similarly, 103 DE mRNAs with the highest number of cellular components were mainly found in the nuclear chromosome, and 79 with chromatin binding function were also enriched in the molecular functional annotation region (Figure 2C). Among them, H3 histone family 3A (H3F3A) is one of the 79 genes that we hypothesised to have chromatin binding function and has been confirmed to modify chromatin status and promote tumour cell migration through intronic regulation.12 Further investigations of cellular components showed that the nucleoplasm and nucleolus were the core processes of the GO tree (Figures 2D, s2A and B). KEGG and Reactome pathway analysis suggested that the HTLV-I infection pathway, viral carcinogenesis regions, transcriptional misregulation in cancer, cell cycle, cell cycle (mitotic), M phase, and cellular responses to stress were most enriched among the DE mRNAs (Figure 2E–H). Based on the above results, it is reasonable to speculate that after EBV infection with AGS, DE mRNA is mainly involved in nuclear and chromosome modification, and the integration of the host genome further interferes with the division of EBVaGC cells.
Putative Involvement of the Viral mRNA in Tumour Carcinogenesis
By focusing on the EBVaGC cell line, we not only detected the host cell’s mRNA but also successfully obtained 91 transcripts from the EBV genome, all of which were highly expressed, with the highest mRNA expression being BXLF2 (9128 reads per kilobase per million (RPKM)) (Figure s3). BXLF2 gene description is envelope glycoprotein H, which is a conserved herpesvirus gene product functionally implicated in the penetration of the virus into the host cell.13 Compared with those previously reported in an EBVaGC tissues study,14 there were 15 additional viral transcripts (RPMS1, LF1, LF2, LF3, oriP, oriLyt, LMP-2B, Wp, Cp, BWRF1, TR, EBNA-LP, Qp, EBER1, EBER2) detected in AGS–EBV cells, with a median expression level of 396.64 RPKM in all mRNAs. Four of the most expressed genes, RPMS1 (1952.3 RPKM), LF2 (1388.6 RPKM), LF1 (776.0 RPKM), and LF3 (670 RPKM), were more than twice as high as those of latent membrane protein 2A (LMP2A, 284.7 RPKM) and Epstein–Barr nuclear antigen −1 (EBNA-1, 270.0 RPKM).
Distinct Expression Profile of lncRNA in AGS-EBV
Over 70% of mammalian genomes are transcribed into non-coding RNAs (ncRNAs), while only 1–2% of mammalian genomes are transcribed into protein-encoded RNAs.15 According to the latest version of the GenCode database, the human genome contains 16,000 lncRNAs; combining data from other species, there are more than 40,000 known lncRNAs. In the present study, 15,590 lncRNAs were identified in AGS-EBV and 3650 DE lncRNAs were screened, of which 1954 were up-regulated and 1696 were down-regulated (Figure 3A and B, Supplementary Data). Since the length of lncRNAs is usually longer than 200nt, we compared the assembled transcriptome with the known human gene annotation and found that DE lncRNAs have multiple isoforms. Furthermore, when EBV entered AGS cells, more lncRNA isoforms were produced, with 2213 additional lncRNAs with an abundance of 449 and 9820 RPKM (Figure 3C).
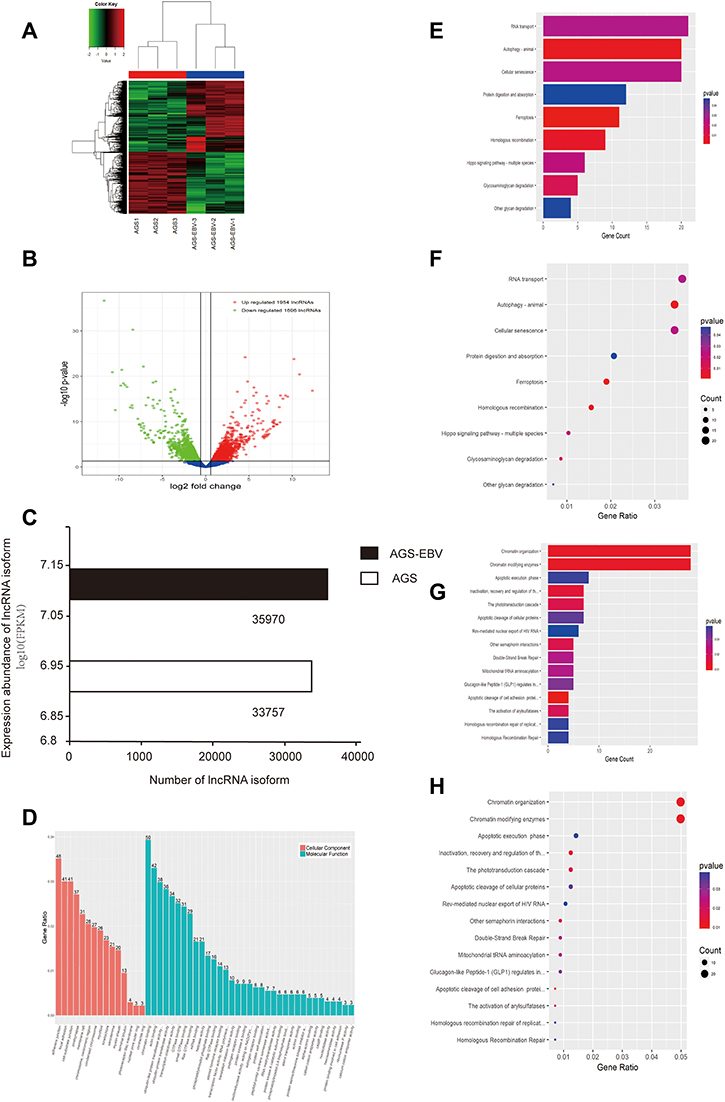 |
Figure 3 Distinct expression profile of lncRNA in AGS-EBV. (A) Hierarchical clustering analysis and the heat map demonstrate the different levels of lncRNA expression between AGS-EBV and AGS. The colour scale of the strips runs from green (low relative expression) through black (medium relative expression) to red (high relative expression). (B) Volcano plot displaying the differentially expressed lncRNA. The vertical green lines refer to a 1.5-fold (log2 scaled) up-regulation and down-regulation, respectively. The horizontal green line corresponds to a P-value of 0.05 (−log10 scaled). The red points in the plot represent up-regulated mRNAs with statistical significance, while the down-regulated lncRNAs are shown in green. (C) Expression profile of lncRNA isoform. (D) The top 50 enrichment scores in gene ontology (GO) enrichment analysis of dysregulated lncRNA. Red bars represent cell component terms. Green bars represent molecular function terms. (E–H) Top 15 classes of KEGG and Reactome pathway enrichment terms, respectively. The larger the rich factor the greater the enrichment. |
GO, KEGG, and Reactome analysis of lncRNA indicated the top 10 enriched terms that may be associated with the mechanism of AGS-EBV (Figure 3D–H). According to the results, the most enriched and meaningful GO terms found in KEGG and Reactome pathway analyses were related to cell-to-cell contact and cell mitosis such as “adherens junction”, “focal adhesion”, “cell-substrate junction”, “chromatin binding”, “RNA transport pathway”, “chromatin organization pathway”, and “chromatin modifying enzymes pathway”. By combining specific enrichment and fold change of differentially expressed genes, “cytosol”, “sarcolemma”, and “protein binding” were the core enriched components in the lncRNA GO tree (Figure s2C and D). Therefore, DE lncRNAs mainly play a role in viral contact with cells, intracellular membrane vesicle transport, and signal transmission, which is conducive to viral invasion by changing the cell structure.
Expression Profiles and Integrated Screening of circRNAs in EBV-Infected and Uninfected AGS
Unlike the well-known linear RNAs, circRNAs do not have a 5ʹ cap and 3ʹ polyadenylated tail and form covalently closed single-stranded RNAs. Since there are few studies on circRNA in EBVaGC, we conducted a more comprehensive analysis. A total of 8426 circRNAs were identified in AGS-EBV, with lengths ranging from 400nt to 500nt, and the longest being 4985nt (Figure 4A). Most circRNAs consisted of protein-coding exons, whereas smaller fractions aligned with intronic, intergenic, antisense, lincRNA, 5ʹUTR, and 3ʹUTR (Figure 4B). The abundance of circRNA was lower than that of mRNA and lncRNA; only a quarter of circRNA had more than two back-spliced reads, either AGS-EBV or AGS (Figure 4C and D). Analysis of the number of circRNAs from their host genes revealed that one gene could produce multiple circRNAs, which was consistent with a previous report (Figure 4E).16 A striking example is the oncogene baculoviral IAP repeat containing 6 (BIRC6), which may generate 24 distinct circRNAs (at least two unique back-spliced reads).
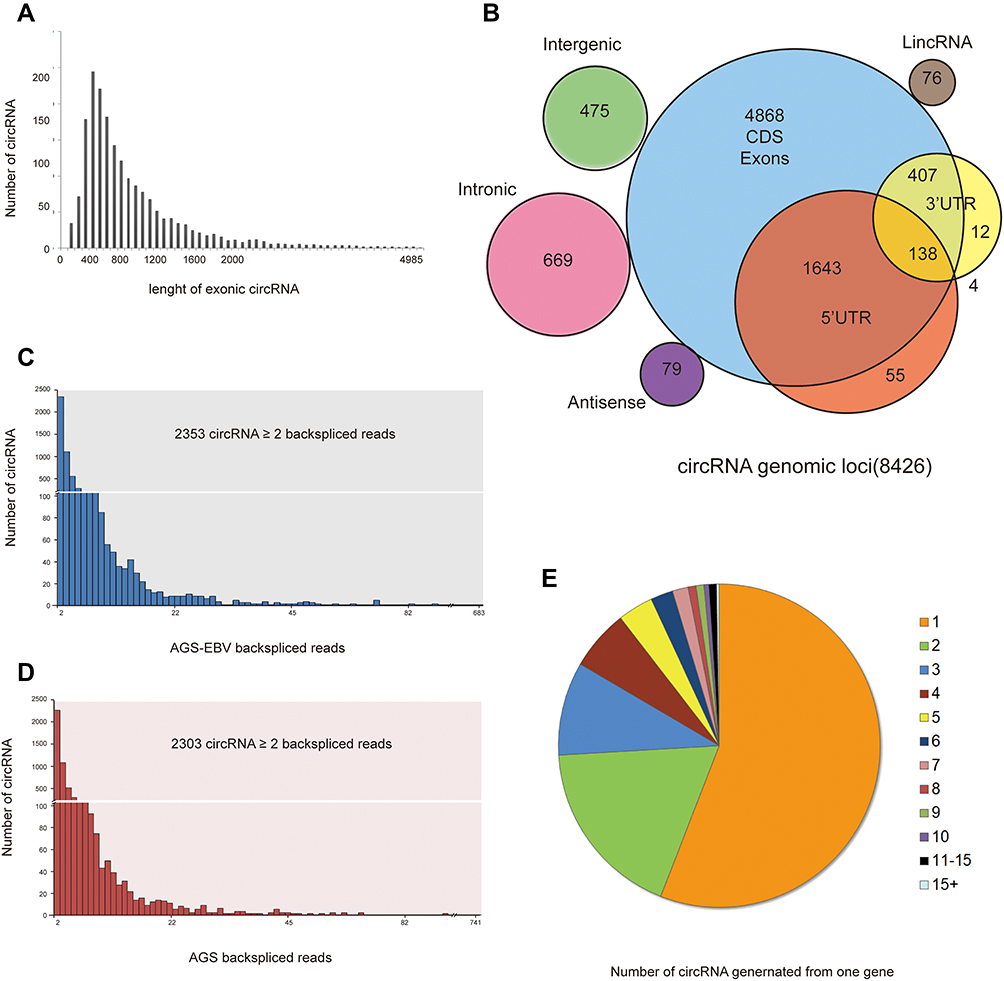 |
Figure 4 The characteristics of circRNA in AGS-EBV. (A) The length (nucleic acids) distribution of exonic circRNAs. (B) The number of circRNAs and back-spliced reads identified in two groups. (C and D) The categories of all circRNAs. (E) Number of circRNAs produced from one gene. |
A total of 248 DE circRNAs were detected in AGS after EBV infection, with 124 up-regulated and down-regulated circRNAs (Figure 5A and B, Supplementary Data). GO and Pathway analysis of circRNA showed the top 10 enriched terms that may be associated with the mechanism of AGS-EBV (Figure 5C–G). The most meaningful GO terms according to KEGG and Reactome pathway analyses were related to DNA repair and cell mitosis, such as “DNA repair”, “ligase activity”, “chromatin binding”, “nuclear envelope”, “nuclear body”, and “ubiquitin mediated proteolysis pathway”. In the circRNA GO tree, “protein modification by small protein conjugation or removal” and “protein modification by small protein conjugation” were shown to be the core molecular functions (Figure s2E–G). This indicates that post-transcriptional protein modification involved in multiple pathways is the main function of DE circRNAs after EBV infection.
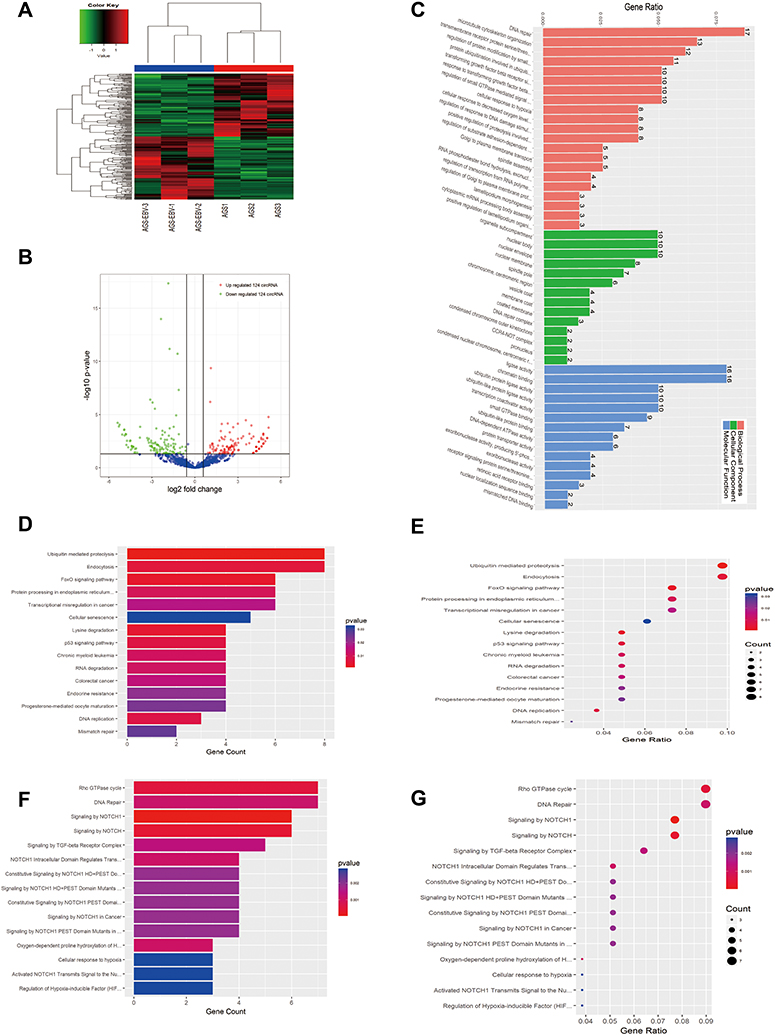 |
Figure 5 Expression profiles of circRNAs in EBV-infected and uninfected AGS. (A) Hierarchical clustering analysis and the heat map demonstrates the different levels of circRNA expression between AGS-EBV and AGS. The colour scale of the strips runs from green (low relative expression) through black (medium relative expression) to red (high relative expression). (B) Volcano plot visualizing the differentially expressed circRNA. The vertical green lines refer to a 1.5-fold (log2 scaled) up-regulation and down-regulation, respectively. The horizontal green line corresponds to a P-value of 0.05 (−log10 scaled). The red points in the plot represent up-regulated mRNAs with statistical significance, while the down-regulated circRNAs are shown by green. (C) The top 50 enrichment scores in gene ontology (GO) enrichment analysis of dysregulated circRNA. Red bars represent cell biological process. Green bars represent cell component terms. Blue bars represent molecular function terms. (D–G) Top 15 classes of KEGG and Reactome pathway enrichment terms, respectively. The larger the rich factor the greater the enrichment. |
EBV-Encoded circRNA: ebv_circ_RPMS1
To our knowledge, this is the first time that circRNA has been verified to be widespread in many species by next-generation sequencing, and we speculated whether EBV can encode circular RNA. After comparing EBV-AGS and AGS, we discovered a circRNA derived from the EBV viral gene RPMS1 by sequencing, which has been validated in EBV-associated cell lines and tissues.17 In addition, this circRNA not only exists in the cytoplasm but also in the nucleus, and overexpressed viral circRNA can promote the proliferation of AGS cells.
The DE Genes Were Verified by qPCR
The 12 selected DE genes that may regulate viral infection and cell growth were verified by qRT-PCR, and the verification results were compared with the transcriptome sequencing results (Figures 6 and s4). The linear correlation analysis further verified that the expression trend of the selected genes was consistent with transcriptome sequencing.
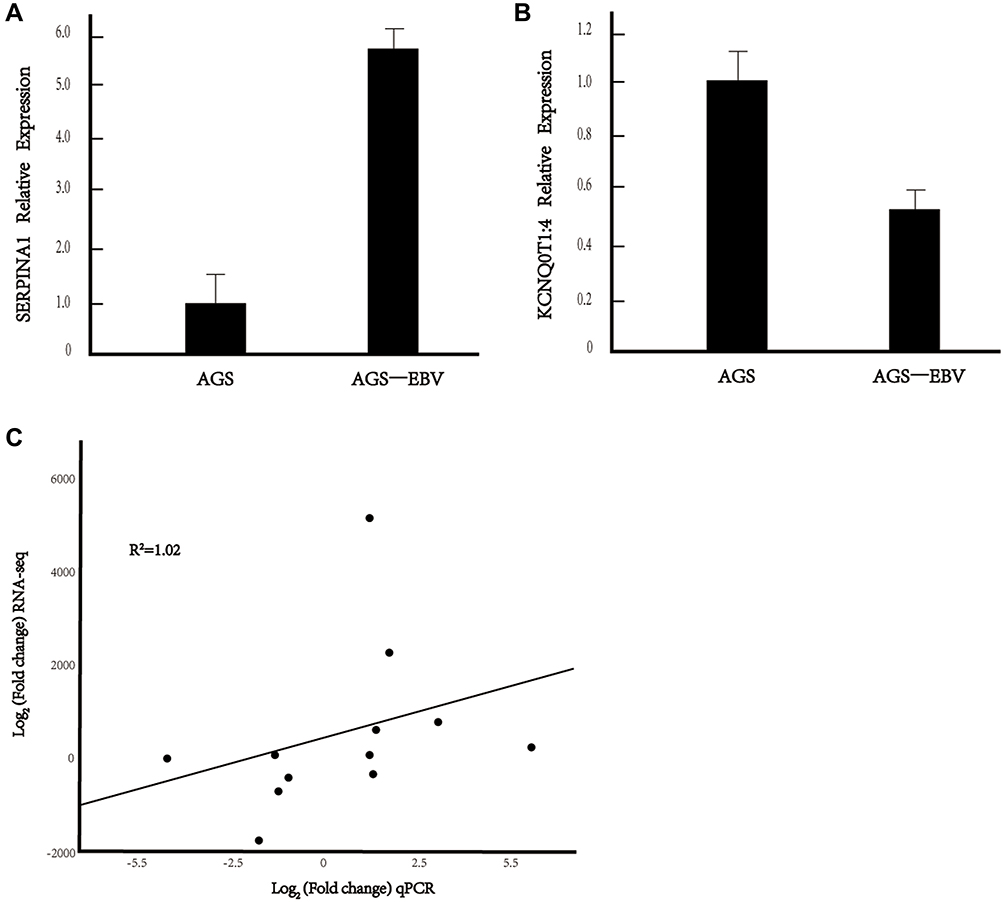 |
Figure 6 Verification of differentially expressed genes by qRT-PCR. (A and B) DE mRNA SERPINA1 and KCNQ0T1:4 relative expression in AGE-EBV. (C) The linear correlation analysis between qPCR and RNA-seq. *P value <0.05. |
Construction of the circRNA-miRNA-mRNA Network
Current studies on the function of circRNAs as miRNA sponges have elucidated the genetic and epigenetic regulatory mechanisms of various tumours; therefore, we used DE circRNAs to predict the miRNAs that could bind to them. The circRNA-miRNA-mRNA network was constructed based on the mRNA obtained through further analysis of its linear correlation with circRNA. Based on the prediction of miRNA pairing by the DE circRNA, 22,980 miRNAs were obtained (Figure 7A). The top 100 records were selected for subsequent analysis according to the total score, including 33 circRNAs and 81 miRNAs. The host genes of 33 circRNAs were crossed with the predicted target mRNAs of 81 miRNAs, and 21 overlapping mRNAs were obtained. A total of 91 key molecules involved in the EBVaGC cell line were explored, and the circRNA-miRNA-mRNA network is shown in Figure 7B. The establishment of a regulatory network may provide a new method for clarifying the progression of EBVaGC.
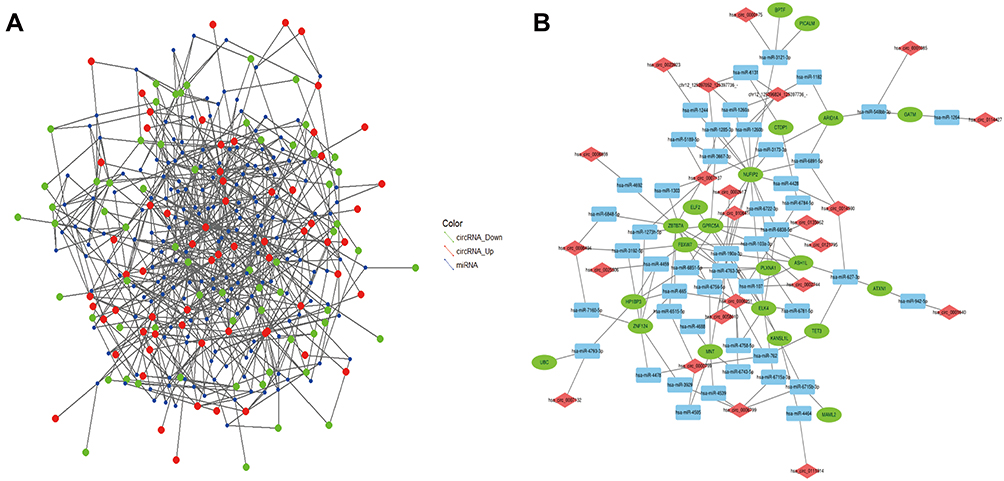 |
Figure 7 The R software was used to show the circRNA-miRNA-mRNA interactions. (A) miRNA match by the dysregulation circRNA. (B) Construction of the circRNA-miRNA-mRNA network. Total of the top 100 connection RNA-related. Diamond represents circRNA, square represents mRNA, and circle represents mRNA. The most connected molecule indicates the most important in the network of relationships. |
Discussion
Benefiting from the high expression of EBV in a single infected cell (10 million copies per cell) and its monoclonal proliferation characteristics, we successfully constructed a stable and virus-rich EBV-positive gastric cancer cell line by using cell-to-cell infection. Specific molecular expression profiles of host cells after virus infection can be effectively revealed by sequencing, such as changes in the expression levels of coding or non-coding RNA caused by cytomegalovirus, human immunodeficiency virus, and human papillomavirus infection. Then, function and pathway analyses were used to predict the potential mechanisms of disease progression.18
In our study, multiple DE mRNAs were changed by nearly 200-fold in AGS-EBV, many of which were oncogenes or tumour suppressor genes. Phospholipase A2 group IIA (PLA2G2A), UDP glucuronosyltransferase family 1 member A6 (UGT1A6), and meiotic recombination protein 8 (REC8) are three of the genes that are closely related to gastric cancer, consistent with our sequencing and verified in other studies. Overexpression of PLA2G2A in gastric cancer is associated with improved survival in patients and enhances AGS invasion through the beta-catenin-dependent Wnt pathway. The qPCR detection of gastric cancer tissue showed that the expression of the oncogene UGT1A6 was up-regulated and the tumour suppressor REC8 was down-regulated, which was more significant in EBVaGC. Bioinformatics analysis further suggests that the role of DE mRNA in EBVaGC may be to facilitate the completion of EBV-infected cells and modulate host cell mitosis. In a typical example, DE mRNA serpin family A member 1 (SERPINA1) was found to be up-regulated by 208-fold in AGS-EBV, and GO enrichment suggested that it was primarily involved in glycoprotein binding. Researchers have shown that glycoprotein is an important factor for EBV to enter B cells, and glycoprotein homeostasis is conducive to regulate host immune defence mechanisms, which affects the infection of host cells with EBV.19 Additionally, in vitro cell studies have also found that plasmids carrying both the SERPINA1 gene and EBV-encoding gene EBNA1 can significantly promote chromosome replication in mammalian cells.20 Moreover, the SERPINA1 gene was significantly overexpressed in the serum of gastric cancer patients compared with healthy individuals, which was correlated with clinical staging.21 This indicated that these DE mRNAs may play a special role in oncogene activation or tumour suppressor gene inactivation and may be potential biomarkers for EBVaGC.
Next, by comparing transcriptional sequencing with the latest complete expression profile of EBVaGC mRNA, we read more EBVaGC virus transcripts. As a further complement to the understanding of EBV encoding mRNA, transcriptome analysis revealed that AGS-EBV expressed 76 EBV genes previously detected in EBVaGC, as well as 15 unreported genes. In contrast to EBV-related diseases such as nasopharyngeal cancer and lymphoma, 4 of the 15 genes found in EBvaGC (RPMS1, LF1, LF2, and LF3) had higher expression levels than LMP2A and EBNA-1. LMP2A is usually one of the most highly expressed transcripts of EBV because most of the viruses in EBVaGC tissue are latent. The main reason for this result was that EBV was sequenced in a short period after AGS infection, with most of the virus still in the lytic state. Consistent with our hypothesis, BDLF3.5 is the lowest read viral gene, which is related to the formation of late viral gene regulatory complexes.22 The four undetected genes, BARF0, BdRF1, BLLF2, and BNLF2a, were also associated with the late viral gene.23 In other words, this study found that highly expressed viral genes may mainly be involved in the early entry of viruses into host cells and the oncogenesis of EBVaGC. During the EBV propagation process, herpesviruses exhibit a strictly regulated temporal cascade of gene expression that can be divided into three general stages: immediate-early, early, and late. This prompts us to refer to the specificity of EBVaGC progression, and the high expression mRNA of EBVaGC may serve as a new research target.
When studying lncRNAs for whole-transcript sequencing, we found a star lncRNA, Lnc-XIST: 7, which was up-regulated 5128 times in AGS-EBV and also showed the greatest fold change of all DE lncRNAs. Lnc-XIST: 7 has been shown to activate the Wnt/β-catenin signalling pathway in a variety of digestive system tumours and promote tumour cell proliferation, lymph node metastasis, and chemotherapy resistance.24 It may also be the next hot spot for the study of lncRNAs in EBVaGC. Bioinformatics analysis of the multiple functions and pathways enriched by DE lncRNAs in AGS-EBV suggests that the progression of EBVaGC is diverse. Among them, lncRNA binding to proteins may be the most important potential mechanism, which is consistent with the microarray data analysis results of 12 EBVaGC tissues in the GEO database.25 In recent years, several lncRNAs (lncClnc1, lncSTCAT3, and lncGMAN) have been confirmed to regulate the invasion and metastasis of GC by binding directly or indirectly to proteins.26 In addition, GO core enrichment suggested that DE lncRNAs may specifically bind to actin and participate in the adherens junction to promote contact between the virus and uninfected or infected cells. B cells and epithelial cells are the most frequently infected target host cells of EBV, but their entry mechanisms are different. Actin can effectively prevent EBV from entering B cells through its own remodelling, whereas actin in epithelial cells does not. In addition, EBV-encoded LMP1 protein can activate the phosphatidylinositol 3-kinase/Akt pathway, induce actin filament remodelling, and promote epithelial cell adhesion and migration by adherens junction or focal adhesion generation.27 Therefore, further studies are needed to confirm whether lncRNAs can play a role in EBVaGC by binding to actin.
Marquitz has shown that two types of long noncoding RNAs transcribed from the EBV BamHI A Rightward Transcript Region contribute to growth regulation, which explains how EBV can encode viral lncRNA called BART RNAs.28 Relevant lncRNAs were not read out in this sequencing study, and the reason may be that the abundance level of lncRNAs is usually 10 times lower than that of mRNA. In whole transcriptome sequencing, mRNA data volume is relatively large, and viral lncRNAs with fewer reads are easily covered.
EBV infection changes mRNA and lncRNA expression profiles of GC, as well as that of circRNA. To the best of our knowledge, this is the first study on the expression of host circRNAs in EBVaGC. We found that circRNA was widely expressed in EBVaGC, and the length was similar to that of most current circRNA (400–600nt), showing that the conserved characteristic of circRNA was also present in EBVaGC. EBVaGC’s DE circRNA is mainly associated with DNA repair during cell mitosis and protein modification, similar to the GO hypothesis, and the best studied function so far is the miRNA sponge function. The most up-regulated DE circRNA, circNRIP1, has been shown to promote gastric cancer progression by targeting mirRNA-149-5p by stimulating the AKT1/mTOR pathway.29 Another up-regulated DE circRNAs-circCDTP1 also played an oncogenic role in nasopharyngeal carcinoma via the mirRNA‑320b/HOXA10/TGFβ2 pathway. Knockdown of circCTDP1 resulted in the inhibition of proliferation, migration, and invasion, and promoted apoptosis of nasopharyngeal carcinoma cells.30
The ebv_circ_RPMS1 comes from the BART region, which is prone to selective splicing to produce a variety of transcripts and multiple non-coding RNAs. After optimising the sequencing process and inducing reactivation of EBV, Nathan and Ungerleider found that other viral genes EBNA, LMP2, BHLF1, and BHRF1 can also produce circRNA in lymphoma and EBVaGC.31,32 According to our previous studies, ebv_cicRNA might act as a sponge of miRNA and accelerate the proliferation of EBVaGC cell lines. In Liu et al study,33 knockdown of ebv_circ_RPMS1 inhibited EBV-positive NPC cell proliferation, induced apoptosis, and repressed cell invasion. Investigation of the mechanism also revealed that ebv_circ_RPMS1 mediated NPC oncogenesis by sponging multiple miRNAs and promoting epithelial-mesenchymal transition. The inhibitors of miR-203, miR-31, and miR-451 could reverse the effects of ebv_circ_RPMS1 knockdown on NPC cells. Additionally, our lab found that another circRNA encoded by the EBV named ebv_circ_ LMP2A was highly expressed in EBVaGC tissues and plays crucial roles in inducing and maintaining GC stemness phenotypes by targeting the miR-3908/TRIM59/p53 axis. Furthermore, high expression of ebv_circ_LMP2A is significantly associated with metastasis and poor prognosis in patients with EBVaGC.34
In the study of the EBVaGC progression mechanism, we speculated that there might be a regulatory mechanism of circRNAs, miRNAs, and mRNAs involved in the occurrence of EBVaGC. By constructing a circRNA-miRNA-mRNA network, we screened nuclear FMR1 interacting protein 2 (NUFIP2), and miR-190a-3p, circ_0006251 (circTET3), zinc finger, BTB domain containing 7A (ZBTB7A), and miR-103a-3p were the five most connected molecules located at the centres of the network. NUFIP2 emerges as a cofactor that contributes to mRNA target recognition by Roquin, which is essential for appropriate immune cell function.35 Similar to Hamzeiy et al, NUFIP2 serves as a target gene for multiple miRNAs associated with EBVaGC.36 Considerable evidence exists to suggest that miR-190a-3p and miR-103a-3p significantly enhanced the proliferation, migration, and invasion abilities of GC cell lines.37,38 High expression of ZBTB7A was significantly correlated with poorer prognosis in GC patients, and miR-100 has been shown to reduce GC aggressiveness by directly targeting ZBTB7A.39 In addition, circTET3 can mediate migration of rat vascular smooth muscle cells by targeting miR-351-5p.40 These lines of evidence indicated that the molecules in this network are highly correlated with GC, and both play a role by targeting miRNA. Intriguingly, most of them showed distinct differences in expression after EBV infection. The circRNA-miRNA-mRNA network is expected to shed light on the core elements of EBVaGC progression.
Conclusion
In general, this research integrated multilevel expression data and a bioinformatics approach to reveal key genes involved in the mechanism of EBVaGC cell lines and their network regulation. Our RNA-sequencing results will help expand our understanding of EBVaGC and provide an indispensable resource for related research on genomics, genetics, and molecular mechanisms in the future.
Acknowledgments
This work was supported by the National Natural Science Foundation of China (Nos. 81572309 and 81272553 to C.K.S., No.81301694 to J.N.C.), the Natural Science Foundation of Guangdong Province (Nos. 2017A030313502 and 2014A030313034 to C.K.S.), and the Guangzhou Science and Technology Project (No. 201707010119 to C.K.S.), Guangdong Province, China.
Disclosure
The authors report no conflicts of interest in this work.
References
1. Young LS, Yap LF, Murray PG. Epstein-Barr virus: more than 50 years old and still providing surprises. Nat Rev Cancer. 2016;16(12):789–802.
2. Fukayama M, Hayashi Y, Iwasaki Y, et al. Epstein-Barr virus-associated gastric carcinoma and Epstein-Barr virus infection of the stomach. Lab Invest. 1994;71(1):73–81.
3. Van Cutsem E, Sagaert X, Topal B, Haustermans K, Prenen H. Gastric cancer. Lancet. 2016;388(10060):2654–2664. doi:10.1016/S0140-6736(16)30354-3
4. Bass AJ, Thorsson V, Shmulevich I, et al.; Cancer Genome Atlas Research Network. Comprehensive molecular characterization of gastric adenocarcinoma. Nature. 2014;513(7517):202–209. doi:10.1038/nature13480
5. Palazzo AF, Lee ES. Non-coding RNA: what is functional and what is junk? Front Genet. 2015;6:2. doi:10.3389/fgene.2015.00002
6. Memczak S, Jens M, Elefsinioti A, et al. Circular RNAs are a large class of animal RNAs with regulatory potency. Nature. 2013;495(7441):333–338. doi:10.1038/nature11928
7. Dong M, Gong LP, Chen JN, et al. EBV-miR-BART10-3p and EBV-miR-BART22 promote metastasis of EBV-associated gastric carcinoma by activating the canonical Wnt signaling pathway. Cell Oncol. 2020;43(5):901–913. doi:10.1007/s13402-020-00538-0
8. Imai S, Nishikawa J, Takada K. Cell-to-cell contact as an efficient mode of Epstein-Barr virus infection of diverse human epithelial cells. J Virol. 1998;72(5):4371–4378. doi:10.1128/JVI.72.5.4371-4378.1998
9. Yu G, Wang LG, Han Y, He QY. clusterProfiler: an R package for comparing biological themes among gene clusters. OMICS. 2012;16(5):284–287. doi:10.1089/omi.2011.0118
10. Zhang B, Schmoyer D, Kirov S, Snoddy J. GOTree Machine (GOTM): a web-based platform for interpreting sets of interesting genes using Gene Ontology hierarchies. BMC Bioinform. 2004;5:16. doi:10.1186/1471-2105-5-16
11. Kim D, Pertea G, Trapnell C, Pimentel H, Kelley R, Salzberg SL. TopHat2: accurate alignment of transcriptomes in the presence of insertions, deletions and gene fusions. Genome Biol. 2013;14(4):R36. doi:10.1186/gb-2013-14-4-r36
12. Park SM, Choi EY, Bae M, et al. Histone variant H3F3A promotes lung cancer cell migration through intronic regulation. Nat Commun. 2016;7:12914. doi:10.1038/ncomms12914
13. Pulford DJ, Lowrey P, Morgan AJ. Co-expression of the Epstein-Barr virus BXLF2 and BKRF2 genes with a recombinant baculovirus produces gp85 on the cell surface with antigenic similarity to the native protein. J Gen Virol. 1995;76(Pt 12):3145–3152. doi:10.1099/0022-1317-76-12-3145
14. Liang Q, Yao X, Tang S, et al. Integrative identification of Epstein-Barr virus-associated mutations and epigenetic alterations in gastric cancer. Gastroenterology. 2014;147(6):1350–1362. doi:10.1053/j.gastro.2014.08.036
15. Djebali S, Davis CA, Merkel A, et al. Landscape of transcription in human cells. Nature. 2012;489(7414):101–108. doi:10.1038/nature11233
16. Zheng Q, Bao C, Guo W, et al. Circular RNA profiling reveals an abundant circHIPK3 that regulates cell growth by sponging multiple miRNAs. Nat Commun. 2016;7:11215. doi:10.1038/ncomms11215
17. Huang JT, Chen JN, Gong LP, et al. Identification of virus-encoded circular RNA. Virology. 2019;529:144–151. doi:10.1016/j.virol.2019.01.014
18. Yang L, Yi K, Wang H, Zhao Y, Xi M. Comprehensive analysis of lncRNAs microarray profile and mRNA-lncRNA co-expression in oncogenic HPV-positive cervical cancer cell lines. Oncotarget. 2016;7(31):49917–49929. doi:10.18632/oncotarget.10232
19. Zhang HJ, Tian J, Qi XK, et al. Epstein-Barr virus activates F-box protein FBXO2 to limit viral infectivity by targeting glycoprotein B for degradation. PLoS Pathog. 2018;14(7):e1007208. doi:10.1371/journal.ppat.1007208
20. Cirone M. EBV and KSHV infection dysregulates autophagy to optimize viral replication, prevent immune recognition and promote tumorigenesis. Viruses. 2018;10(11):599. doi:10.3390/v10110599
21. Yang J, Xiong X, Wang X, Guo B, He K, Huang C. Identification of peptide regions of SERPINA1 and ENOSF1 and their protein expression as potential serum biomarkers for gastric cancer. Tumour Biol. 2015;36(7):5109–5118. doi:10.1007/s13277-015-3163-2
22. Sato Y, Watanabe T, Suzuki C, et al. S-like-phase cyclin-dependent kinases stabilize the Epstein-Barr virus BDLF4 protein to temporally control late gene transcription. J Virol. 2019;93(8). doi:10.1128/JVI.01707-18
23. Ribeiro J, Oliveira C, Malta M, Sousa H. Epstein-Barr virus gene expression and latency pattern in gastric carcinomas: a systematic review. Future Oncol. 2017;13(6):567–579. doi:10.2217/fon-2016-0475
24. Chen DL, Chen LZ, Lu YX, et al. Long noncoding RNA XIST expedites metastasis and modulates epithelial-mesenchymal transition in colorectal cancer. Cell Death Dis. 2017;8(8):e3011. doi:10.1038/cddis.2017.421
25. Jing JJ, Wang ZY, Li H, Sun LP, Yuan Y. Key elements involved in Epstein-Barr virus-associated gastric cancer and their network regulation. Cancer Cell Int. 2018;18:146. doi:10.1186/s12935-018-0637-5
26. Zhuo W, Liu Y, Li S, et al. Long noncoding RNA GMAN, up-regulated in gastric cancer tissues, is associated with metastasis in patients and promotes translation of Ephrin A1 by competitively binding GMAN-AS. Gastroenterology. 2019;156(3):676–691. doi:10.1053/j.gastro.2018.10.054
27. Wasil LR, Shair KH. Epstein–Barr virus LMP1 induces focal adhesions and epithelial cell migration through effects on integrin-α5 and N-cadherin. Oncogenesis. 2015;4:e171. doi:10.1038/oncsis.2015.31
28. Marquitz AR, Mathur A, Edwards RH, Raab-Traub N. Host gene expression is regulated by two types of noncoding RNAs transcribed from the Epstein-Barr virus BamHI A rightward transcript region. J Virol. 2015;89(22):11256–11268. doi:10.1128/JVI.01492-15
29. Zhang X, Wang S, Wang H, et al. Circular RNA circNRIP1 acts as a microRNA-149-5p sponge to promote gastric cancer progression via the AKT1/mTOR pathway. Mol Cancer. 2019;18(1):20. doi:10.1186/s12943-018-0935-5
30. Li H, You J, Xue H, Tan X, Chao C. CircCTDP1 promotes nasopharyngeal carcinoma progression via a microRNA320b/HOXA10/TGFbeta2 pathway. Int J Mol Med. 2020;45(3):836–846.
31. Toptan T, Abere B, Nalesnik MA, et al. Circular DNA tumor viruses make circular RNAs. Proc Natl Acad Sci U S A. 2018;115(37):E8737–E8745. doi:10.1073/pnas.1811728115
32. Ungerleider N, Concha M, Lin Z, et al. The Epstein Barr virus circRNAome. PLoS Pathog. 2018;14(8):e1007206. doi:10.1371/journal.ppat.1007206
33. Liu Q, Shuai M, Xia Y. Knockdown of EBV-encoded circRNA circRPMS1 suppresses nasopharyngeal carcinoma cell proliferation and metastasis through sponging multiple miRNAs. Cancer Manag Res. 2019;11:8023–8031. doi:10.2147/CMAR.S218967
34. Gong LP, Chen JN, Dong M, et al. Epstein-Barr virus-derived circular RNA LMP2A induces stemness in EBV-associated gastric cancer. EMBO Rep. 2020;21(10):e49689. doi:10.15252/embr.201949689
35. Rehage N, Davydova E, Conrad C, et al. Binding of NUFIP2 to Roquin promotes recognition and regulation of ICOS mRNA. Nat Commun. 2018;9(1):299. doi:10.1038/s41467-017-02582-1
36. Hamzeiy H, Suluyayla R, Brinkrolf C, Janowski SJ, Hofestadt R, Allmer J. Visualization and analysis of miRNAs implicated in amyotrophic lateral sclerosis within gene regulatory pathways. Stud Health Technol Inform. 2018;253:183–187.
37. Hu X, Miao J, Zhang M, et al. miRNA-103a-3p promotes human gastric cancer cell proliferation by targeting and suppressing ATF7 in vitro. Mol Cells. 2018;41(5):390–400.
38. Jia WZ, Yu T, An Q, et al. MicroRNA-190 regulates FOXP2 genes in human gastric cancer. Onco Targets Ther. 2016;9:3643–3651.
39. Shi DB, Wang YW, Xing AY, et al. C/EBPα-induced miR-100 expression suppresses tumor metastasis and growth by targeting ZBTB7A in gastric cancer. Cancer Lett. 2015;369(2):376–385. doi:10.1016/j.canlet.2015.08.029
40. Yao QP, Liu Z, Yao AH, et al. Circular RNA circTET3 mediates migration of rat vascular smooth muscle cells by targeting miR-351-5p. J Cell Physiol. 2020;235(10):6831–6842. doi:10.1002/jcp.29577
 © 2021 The Author(s). This work is published and licensed by Dove Medical Press Limited. The
full terms of this license are available at https://www.dovepress.com/terms
and incorporate the Creative Commons Attribution
- Non Commercial (unported, 3.0) License.
By accessing the work you hereby accept the Terms. Non-commercial uses of the work are permitted
without any further permission from Dove Medical Press Limited, provided the work is properly
attributed. For permission for commercial use of this work, please see paragraphs 4.2 and 5 of our Terms.
© 2021 The Author(s). This work is published and licensed by Dove Medical Press Limited. The
full terms of this license are available at https://www.dovepress.com/terms
and incorporate the Creative Commons Attribution
- Non Commercial (unported, 3.0) License.
By accessing the work you hereby accept the Terms. Non-commercial uses of the work are permitted
without any further permission from Dove Medical Press Limited, provided the work is properly
attributed. For permission for commercial use of this work, please see paragraphs 4.2 and 5 of our Terms.