")
Back to Journals » International Journal of Chronic Obstructive Pulmonary Disease » Volume 15
Comparative Performance of Comorbidity Measures in Predicting Health Outcomes in Patients with Chronic Obstructive Pulmonary Disease
Authors Zhan ZW, Chen YA, Dong YH
Received 3 September 2019
Accepted for publication 16 January 2020
Published 12 February 2020 Volume 2020:15 Pages 335—344
DOI https://doi.org/10.2147/COPD.S229646
Checked for plagiarism Yes
Review by Single anonymous peer review
Peer reviewer comments 2
Editor who approved publication: Dr Chunxue Bai
Zhe-Wei Zhan,1 Yu-An Chen,1,2 Yaa-Hui Dong1,2
1Faculty of Pharmacy, School of Pharmaceutical Science, National Yang-Ming University, Taipei 112, Taiwan; 2Institute of Public Health, School of Medicine, National Yang-Ming University, Taipei 112, Taiwan
Correspondence: Yaa-Hui Dong
Faculty of Pharmacy, School of Pharmaceutical Science, National Yang-Ming University, 155, Sec.2, Linong Street, Taipei 112, Taiwan
Tel +886 2-28267986
Fax +886 2-28237829
Email [email protected]
Purpose: Multiple studies have suggested that comorbidities pose negative impacts on the survival of patients with chronic obstructive pulmonary disease (COPD); few have applied comorbidity measures driven from health insurance claims databases to predict various health outcomes. We aimed to examine the performance of commonly used comorbidity measures based on diagnosis and pharmacy dispensing claims information in predicting future death and hospitalization in COPD patients.
Methods: We identified COPD patients in a population-based Taiwanese database. We built logistic regression models with age, sex, and baseline comorbidities measured by either diagnosis or pharmacy claims information as predictors of subsequent-year death or hospitalization in a random 50% sample and validated the discrimination in the other 50%. The diagnosis-based comorbidity measures included the Charlson Index and the Elixhauser comorbidity measure; the pharmacy-based comorbidity measures included the updated Chronic Disease Score (CDS) and the Pharmacy-Based Comorbidity Index (PBDI).
Results: We identified 428,251 eligible patients. For overall death, the Elixhauser comorbidity measure showed the best predictive performance (c-statistic=0.832), followed by the PBDI (c-statistic=0.822), the Charlson Index (c-statistic=0.815), and the updated CDS (c-statistic=0.808). For overall hospitalization, the PBDI (c-statistics=0.730) and the Elixhauser comorbidity measure (c-statistics=0.724) outperformed the updated CDS (c-statistics=0.714) and the Charlson Index (c-statistics=0.710). For hospitalization due to cardiovascular, cerebrovascular, or respiratory diseases, the comorbidity models showed similar predictive ranks and demonstrated c-statistics higher than 0.75. However, none of the models could adequately predict hospitalization due to other reasons (c-statistics < 0.60).
Conclusion: Our study comprehensively compared the predictive performance of comorbidity measures. The Elixhauser comorbidity measure and the PBDI are useful tools for describing comorbid conditions and predicting health outcomes in COPD patients.
Keywords: chronic obstructive pulmonary disease, diagnosis-based comorbidity measures, pharmacy-based comorbidity measures, health outcomes, health insurance claims database
Introduction
Chronic obstructive pulmonary disease (COPD) has tremendous health impacts worldwide.1–3 It is symbolized by chronic respiratory symptoms and persistent airflow limitation.4 Because of the link between COPD and systemic inflammation, several comorbidities, such as cardiovascular and cerebrovascular diseases, usually coexist with COPD and are significantly associated with poor prognoses.4–8 Research has indicated that ischemic heart disease, heart failure, stroke, and the number of comorbidities are associated with a 1.2 to 3.4-fold increased risk of mortality.5–8 Therefore, if we could measure comorbidities using a tool with predefined disease categories and corresponding weights, it will be helpful to predict patients’ future health status, stratify patients’ risk in advance, and develop potential care management plans.
With the increasing use of health insurance claims databases in health service research, several comorbidity measures based on claims information have emerged in the past several decades. Most of these measures are based on diagnoses assigned to patients in real practice settings, including different versions of the Charlson Index9,10 and the Elixhauser comorbidity measure.11 Given the limited number of diagnosis codes allowed in each database, diverse diagnosis coding practices among healthcare professionals, and potential coding errors, researchers have attempted to develop pharmacy-based comorbidity measures that use drug dispensing information from health insurance claims databases to measure comorbidity status. The Chronic Disease Score (CDS) is the first reported pharmacy-based comorbidity measure in the U.S.12,13 The updated CDS was subsequently developed with expanded disease categories.14 Instead of using disease categories to classify comorbidities, Dong et al used drug categories to describe comorbidities, developed the Pharmacy-Based Disease Index (PBDI), and demonstrated its ability to predict future hospitalization in a Taiwanese adult population.15 Multiple studies have applied these measures in different populations and examined their performance in predicting mortality, morbidity, and a variety of health utilization.16–22
Although studies have demonstrated that comorbidities pose negative impacts on the survival of patients with COPD, few studies have applied comorbidity measures driven from health insurance claims database to predict subsequent health outcomes in this population.23,24 This study aimed to examine the performance of commonly used diagnosis-based and pharmacy-based comorbidity measures to predict future death and hospitalization in patients with COPD. Specifically, we also aimed to explore if the PBDI, which was developed in a Taiwanese adult population, could perform well in a specific disease subgroup.
Methods
Data Sources and Study Population
A single-payer National Health Insurance program was initiated in Taiwan in 1995 and reached an enrollment rate of 99% by 2014.25 The Taiwan National Health Insurance Database comprises comprehensive data of demographic and enrollment records, hospital admissions and outpatient visits, and pharmacy dispensing claims from hospitals, outpatient clinics, and community pharmacies for 99% of the total Taiwanese population (approximately 23 million), which could be linked to the National Death Registry to ascertain death information. All patient and healthcare provider identification codes are de-identified.26 The study protocol was approved by the National Yang-Ming University Research Ethics Committee.
We identified patients with COPD as our study population and defined these patients as those who had at least one inpatient or outpatient COPD diagnosis (International Classification of Diseases, 9th Revision, Clinical Modification [ICD-9-CM] codes 491, 492, or 496) during 2013. The algorithm has been found to have a sensitivity of 85.0% and a specificity of 78.4%.27 We excluded patients with an age less than 40 years or more than 100 years in 2013, patients with ambiguous sex information, and patients who died during years of 2013 or 2014.
Ascertainment of Comorbidity Measures
Among the diagnosis-based comorbidity measures, the Charlson Index includes 17 disease categories that characterize cardiovascular or cerebrovascular, endocrine, respiratory, gastric and hepatological, renal, neurological, oncological, rheumatologic, and miscellaneous comorbidities.9,10 The Elixhauser comorbidity measure includes 30 disease categories that cover more comprehensive comorbidities of the above systems.11 For example, cardiac arrhythmia and valvular disease are included in the Elixhauser comorbidity measure but not in the Charlson Index. Moreover, the Elixhauser comorbidity measure covers psychological comorbidities such as depression and psychoses. Among the pharmacy-based comorbidity measures, the updated CDS includes 29 disease categories,14 and the PBDI includes 37 drug categories.15 Specifically, the PBDI has a unique strength of including “drugs for chronic viral hepatitis”, which quantifies a substantial disease burden in Asia and in Taiwan. Tables S1-S4 show disease or drug categories, diagnosis or drug codes, and the corresponding weights for each comorbidity measure.
For each eligible patient, we used hospital and outpatient diagnoses during the baseline year (i.e., 2014) to construct disease categories and calculate the Deyo score according to the Deyo version of the Charlson Index.9,10 We also indicated if patients had any of the Elixhauser comorbidities in the same year.11 For the pharmacy-based comorbidity measures, we extracted pharmacy dispensing claims from hospitals, outpatient clinics, and community pharmacies during the same one-year period, constructed each patient’s medication profile, and calculated his or her updated CDS and PBDI based on disease or drug categories and the corresponding weights developed in the original study.14,15
Ascertainment of Outcomes of Interest
Our outcomes of interest were overall death and overall hospitalization in the subsequent year (i.e., 2015). We also examined if patients were hospitalized due to specific causes, including cardiovascular disease, cerebrovascular disease, or respiratory disease. Table S5 provides detailed information on causes of hospitalization and the corresponding hospitalization diagnosis codes. Patients were categorized as hospitalization due to other reasons if they did not have any of the hospitalization diagnosis codes defined in Table S5.
Statistical Analyses
To compare the predictive performance of each comorbidity measure for subsequent-year death or hospitalization, we randomly divided the eligible patients into a training dataset and a validation dataset of equal size. In the training dataset, we fit separate logistic regression models for each comorbidity and for each outcome of interest. Each comorbidity model included age, sex, plus either the Deyo score, the 30 indicators representing the presence or absence of the 30 Elixhauser comorbidities, the updated CDS, or the PBDI as independent variables and the outcome of interest as the dependent variable. A model with predictors of age and sex only served as the reference model. We calculated the predicted probabilities of outcomes according to the estimated regression coefficients in each model. Furthermore, each model created in the training dataset was applied to the validation dataset. Three analytic methods were used in the training and validation datasets to evaluate how well each comorbidity model could predict subsequent-year outcomes.
First, we computed the c-statistic to evaluate each model’s ability in discriminating patients who did and patients who did not experience death or hospitalization in the subsequent year.28 Second, we computed the net reclassification improvement (NRI) to evaluate if the individual comorbidity models could reclassify more patients experiencing outcomes into a higher risk stratum and more patients not experiencing outcomes into a lower risk stratum than the reference model. Specifically, we classified patients into different risk strata (i.e., very low, low, intermediate, and high) based on their predicted probabilities of experiencing outcomes derived by each model. Among patients with and without subsequent-year outcomes, we constructed reclassification tables by comparing the number of patients in each risk stratum of each comorbidity model with the reference model, respectively. Based on the reclassification tables, we estimated the NRI as [P(up|D=1)-P(down|D=1)] + [P(down|D=0)-P(up|D=0)], where D=1 if an individual experiences any outcome of interest in the subsequent year and D=0 otherwise; the upward movement (up) indicates an individual was reclassified into a higher risk stratum by the comorbidity model versus the reference model, and the downward movement (down) indicates reclassification in the opposite direction. Therefore, the NRI represented the proportion of individuals that were correctly reclassified, with a positive value suggesting that the comorbidity model can classify more individuals into the correct risk stratum than the reference model.29 Third, to evaluate the calibration of each model, we grouped patients into deciles according to the predicted probabilities of experiencing outcomes in each model. We compared the predicted probability and the observed incidence of subsequent-year outcomes within each decile.28
We conducted additional analyses to examine the robustness of model performance. First, we restricted the study population to those who had at least one inpatient or three outpatient COPD diagnoses during 2013 to minimize potential misclassification of the COPD population. In addition, we excluded those who died in 2015 in the model that predicted subsequent-year hospitalization to reduce the misclassification of patients who died as alive and without hospitalization.
All statistical analyses were performed using SAS version 9.4 (SAS Institute, Cary, NC).
Results
Eligible Patients
We identified a total of 428,251 eligible patients (Figure S1). The mean (standard deviation [SD]) age of the cohort was 67 (13) years, and 60% of the patients were male. The mean (SD) number of disease or drug categories ranged from 1.7 (1.4) to 5.9 (3.6) for different comorbidity measures (Table 1). The most commonly identified comorbidities included hypertension, anxiety and tension, gastric acid disorder, and pain and inflammation. The most commonly used non-respiratory medications included angiotensin converting enzyme inhibitors or angiotensin II receptor blockers, calcium channel blockers, glucocorticosteroids, anxiolytics, drugs for peptic ulcer or gastroesophageal reflux disease, and nonsteroidal anti-inflammatory drugs.
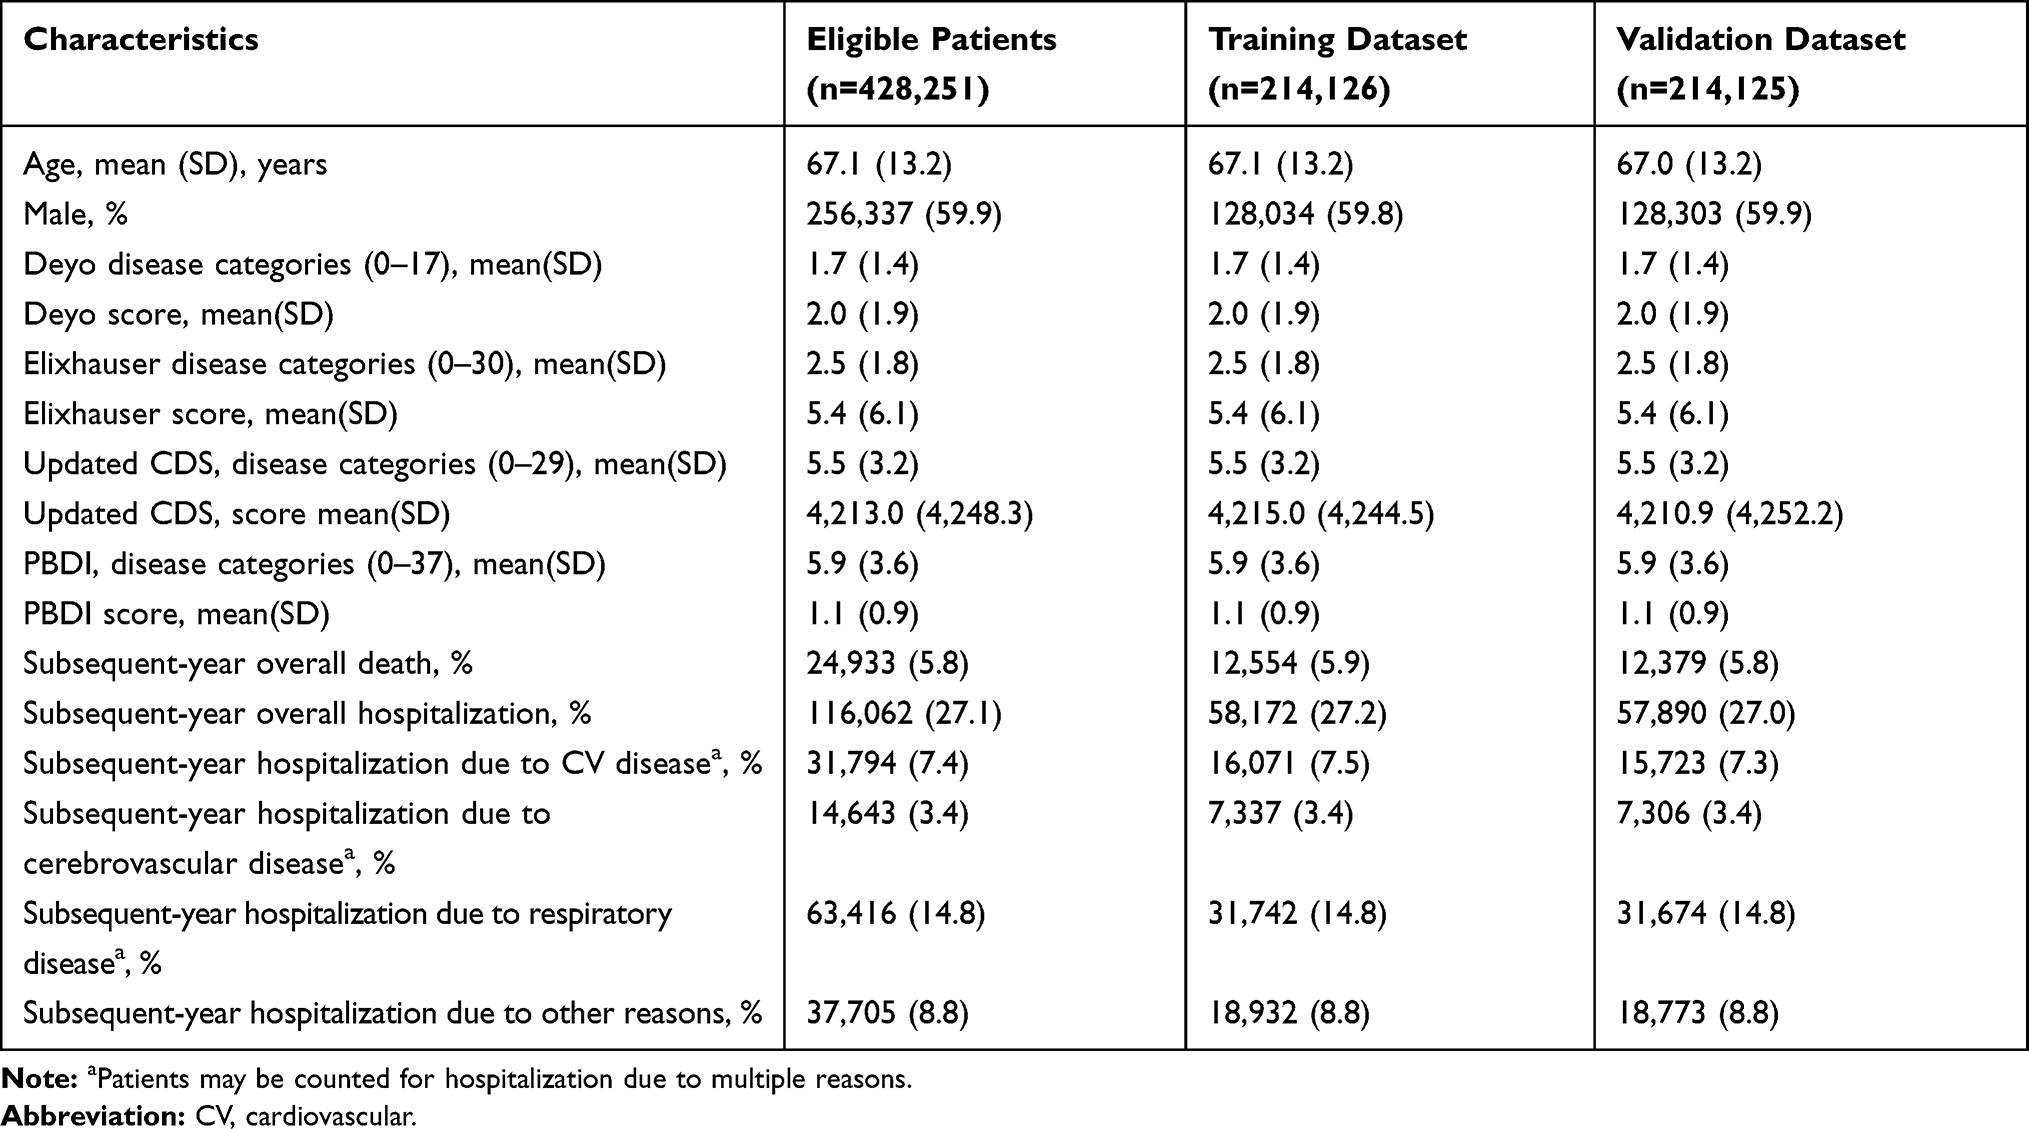 |
Table 1 Patient Characteristics of the Study Cohort |
During the subsequent year, approximately 6% and 27% of study patients died and were hospitalized, respectively. Most of the patients were hospitalized due to respiratory disease (15%), followed by cardiovascular disease (7%). Patients in the training dataset and patients in the validation dataset showed similar demographic characteristics, distribution of comorbidity measures, and probabilities of death or hospitalization during the subsequent year (Table 1).
Predictive Performance of Different Comorbidity Models
The c-statistics for subsequent-year health outcomes with different comorbidity models are listed in Table 2. For overall death in the validation dataset, the reference model with predictors of age and sex only yielded a c-statistic of 0.768; however, all the models additionally including different comorbidity measures reached c-statistics greater than 0.8. The Elixhauser comorbidity measure performed best (c-statistic=0.832), followed by the PBDI (c-statistic=0.822), the Deyo version of the Charlson Index (c-statistic=0.815), and the updated CDS (c-statistic=0.808). For overall hospitalization, the model discrimination tended to be lower but still showed c-statistics greater than 0.7. The PBDI and the Elixhauser comorbidity measure performed best (c-statistics of 0.730 and 0.724, respectively), followed by the updated CDS and the Deyo version of the Charlson Index (c-statistics of 0.714 and 0.710, respectively). In terms of cause-specific hospitalization, the Elixhauser comorbidity measure and the PBDI still had greater discrimination than the updated CDS and the Deyo version of the Charlson Index. Of interest, each comorbidity measure predicted hospitalization due to cardiovascular disease, respiratory disease, or cerebrovascular disease better than overall hospitalization. For example, for hospitalization due to cardiovascular disease and respiratory disease, the Elixhauser comorbidity measure had c-statistics of 0.792 and 0.787, and the PBDI had c-statistics of 0.776 and 0.769. However, none of the models optimally predicted hospitalization due to other reasons, with c-statistics lower than 0.6.
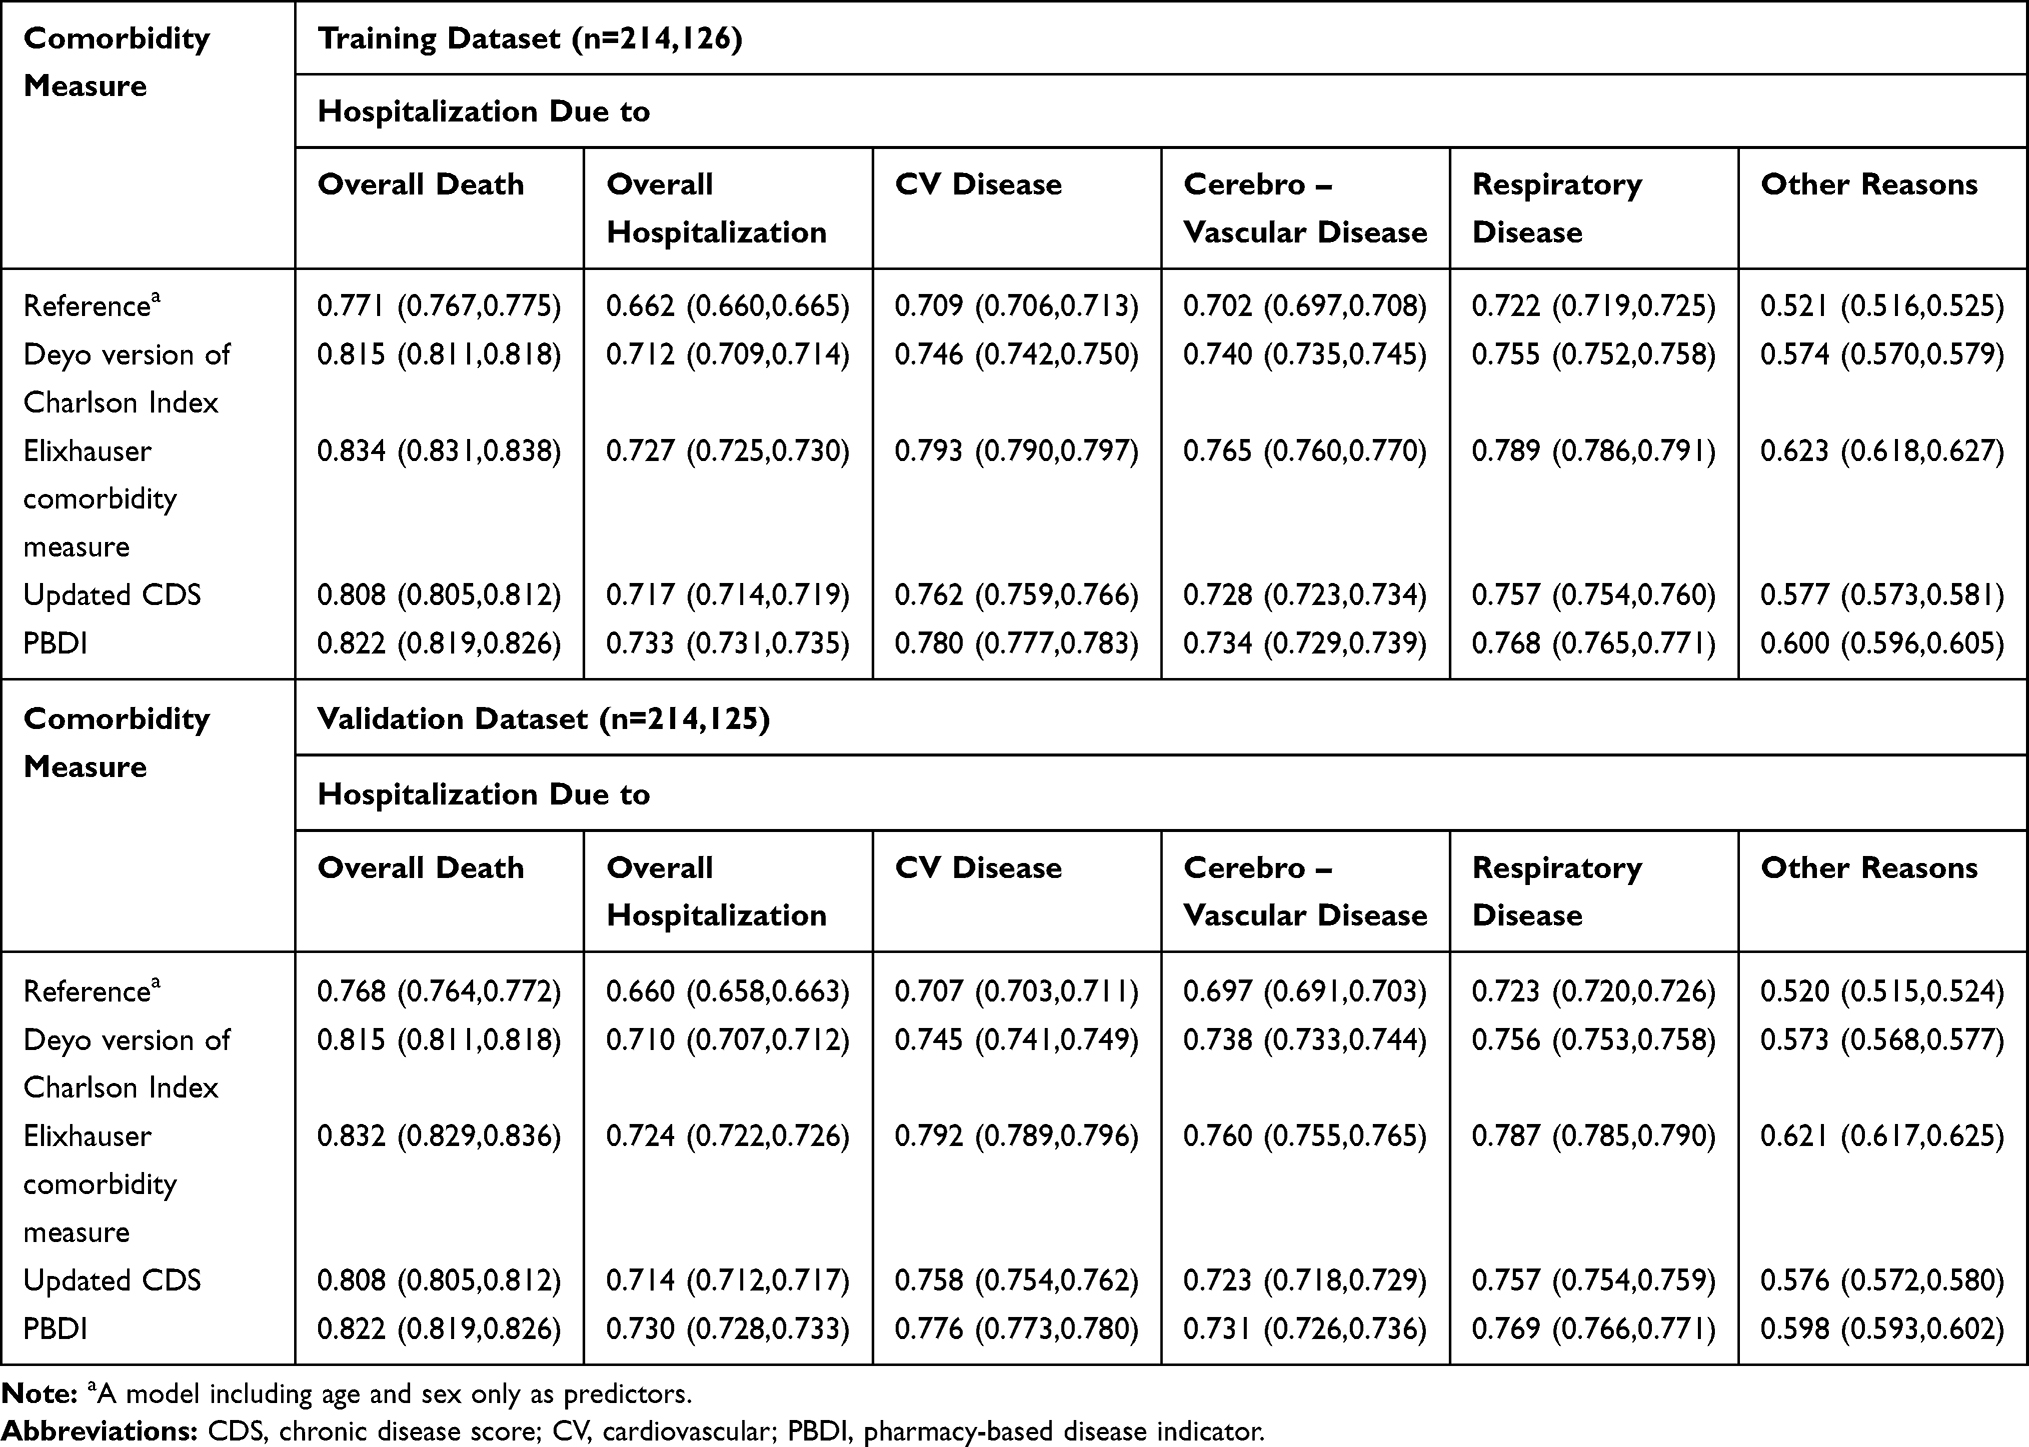 |
Table 2 C-Statistics of Different Comorbidity Measures in Relation to Subsequent-Year Health Outcomes |
All the NRI values in Table 3 are positive, which indicates the improved reclassification ability of each comorbidity model versus the reference model for the subsequent-year outcomes. In general, the reclassification abilities of the Elixhauser comorbidity measure and the PBDI remained better than the Deyo version of the Charlson Index and the updated CDS for different outcomes. For example, for overall death and in the validation dataset, approximately 26%, 24%, 21%, and 15% of individuals were correctly reclassified by the Elixhauser comorbidity measure, the PBDI, the Deyo version of the Charlson Index, and the updated CDS, respectively. The cut-off points of probabilities of each outcome for different risk strata are shown in Table S6.
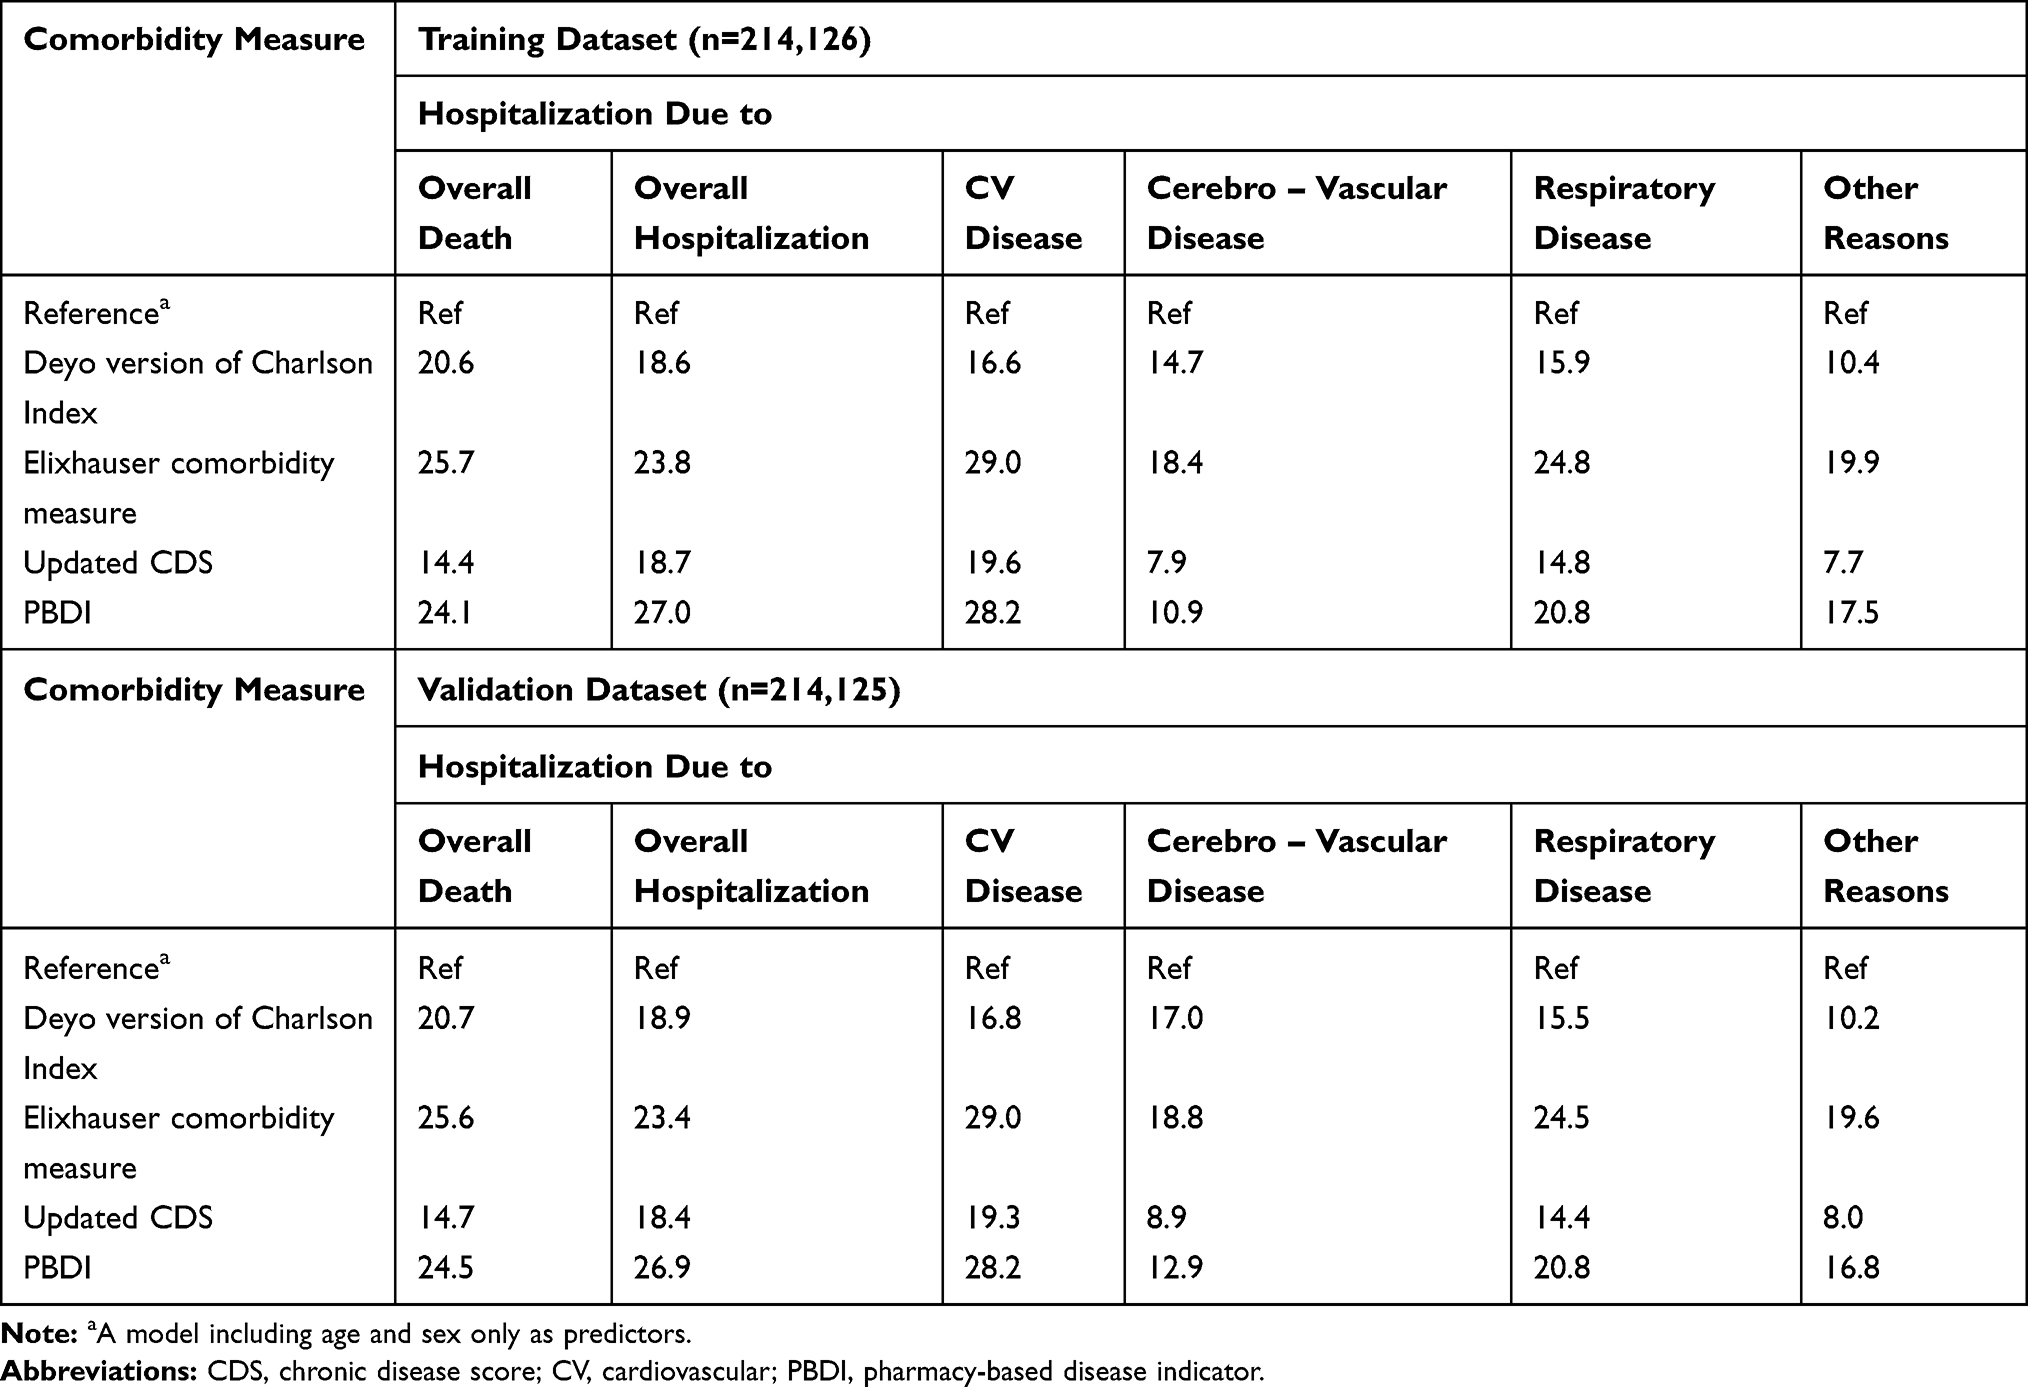 |
Table 3 Net Reclassification Improvement of Different Comorbidity Measures in Relation to Subsequent-Year Health Outcomes |
Figure 1 presents the observed and predicted probabilities of each outcome in each decile defined by the predicted probabilities of outcomes of interest derived by the PBDI. The observed probabilities of overall death, overall hospitalization, and cause-specific hospitalization increased from the lowest risk decile to the highest risk decile and closely matched the corresponding predicted probabilities. However, the observed and predicted probabilities of hospitalization due to other reasons did not greatly vary among risk deciles, which suggested poor calibration abilities. The findings derived by other comorbidity models show similar patterns (data not shown).
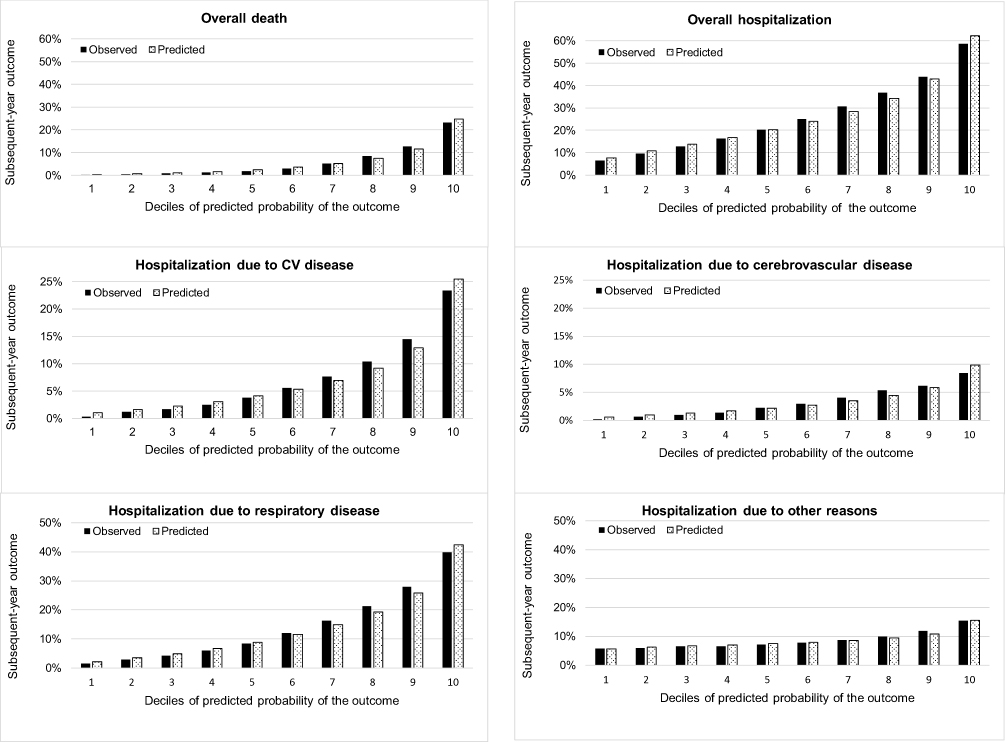 |
Figure 1 Observed and predicted probabilities of subsequent-year outcomes among individuals in deciles defined by the predicted probability of the outcome defined by the PBDI in the validation dataset (n=214,125). Abbreviations: CV, cardiovascular; PBDI, pharmacy-based disease indicator. |
Results of Additional Analyses
When we restricted the study population to those who had at least one inpatient or three outpatient COPD diagnoses during 2013 or those who did not die in 2015, the model discrimination of the Elixhauser comorbidity measure and the PBDI were better than that of the Deyo version of the Charlson Index and the updated CDS for different outcomes, although the c-statistics tended to be lower than that in the main analysis (Table S7 and Table S8).
Discussion
This population-based study examined the predictive performance of a variety of comorbidity measures derived from health insurance claims for health outcomes in patients with COPD. The Elixhauser comorbidity measure performed best, followed by the PBDI, and in general, the Deyo version of the Charlson Index and the updated CDS showed similar predictive abilities for health outcomes. In terms of individual outcomes, all comorbidity measures had excellent discrimination in predicting overall death (c-statistics > 0.8) and acceptable discrimination in predicting overall hospitalization (c-statistics > 0.7). Moreover, each comorbidity measure predicted hospitalization due to cardiovascular disease, respiratory disease, or cerebrovascular disease better than overall hospitalization but did not adequately predict hospitalization due to other reasons. The performance ranks did not greatly differ for different predictive statistics or definitions of COPD or when we restricted the study population to those who did not die in the subsequent year.
Comparison of Different Comorbidity Measures
As the use of health insurance claims databases in healthcare settings is increasing, our results provide important implications in terms of describing the health status of patients with COPD using health insurance claims information. Our study indicated that the Elixhauser comorbidity measure performed best in predicting any outcome of interest in the subsequent year. Chu et al found the Elixhauser comorbidity measure yielded a higher c-statistic (0.701) than that of the Charlson Index (0.681) in predicting subsequent-year death among patients with COPD,23 although the difference for measures was minimal in another study conducted by Austin et al (c-statistics: 0.822 for the Elixhauser comorbidity measure and 0.819 for the Charlson Index).24 Quail et al also found that the Elixhauser comorbidity measure had superior performance in predicting overall death and overall hospitalization in a general population, an elderly population, patients with diabetes, and patients with osteoporosis.18
Compared to other tested comorbidity measures, the Elixhauser comorbidity measure includes more comprehensive disease categories across organ systems of the human body. The weights were derived specifically for individual health outcomes in the current cohort. For example, for overall death and overall hospitalization, the categories of metastatic cancer and alcohol abuse had the highest weights. For cause-specific hospitalization, cardiovascular comorbidities (congestive heart failure and cardiac arrhythmias), cerebrovascular comorbidities (paralysis and other neurological disorders), and respiratory comorbidities (chronic pulmonary disease) played the most influential roles (Table S9). Therefore, it is not surprising that he Elixhauser comorbidity measure showed the best performance. However, it requires a sufficient sample size, and it may be tedious to re-derive weights for the 30 Elixhauser comorbidity categories for the outcome of interest and population each time it is used. Therefore, researchers need to consider the available sample size and to what extent they would like to achieve the predictive performance when selecting candidate comorbidity measures for their target population.
Our study showed the PBDI performed right next to the Elixhauser comorbidity measure but better than the Deyo version of the Charlson Index and the updated CDS. Several reasons may explain these findings. First, compared to the updated CDS, the PBDI includes more drug categories. In addition, the PBDI applies the weights derived from a general Taiwanese population. Third, unlike many health insurance claims databases which do not have information on drug use during hospitalization,30 data on inpatient drug use are available in Taiwan’s NHIRD.26 These factors all facilitate the PBDI to reveal more comprehensive comorbidities and to better predict health outcomes.
Dong et al indicated that the PBDI performs numerically better than the Deyo version of the Charlson Index in predicting the subsequent-year overall hospitalization in a general Taiwanese population (c-statistics of 0.715 and 0.691, respectively).15 The current study further demonstrated satisfactory performance of the PBDI in predicting various health outcomes in patients with COPD. If we treat 37 PBDI drug categories, rather than a single PBDI score, as independent variables and apply the weights derived for each drug category, the PBDI can perform even better than the Elixhauser comorbidity measure (Table S10). Compared to Chu and Austin’s studies, which only examined the predictive performance of diagnosis-based comorbidity measures in patients with COPD,23,24 our study provides a more complete comparison across diagnosis-based and pharmacy-based comorbidity measures. Our findings suggest that the PBDI, which is based on drug dispensing information, is useful to stratify patient risk and may facilitate the development of care management plans in real practice. Further research can be conducted to examine its predictive ability in other disease populations or in other countries.
Comparison of Different Health Outcomes
Our study showed each comorbidity model better predicted overall death than overall hospitalization, which is consistent with what has been observed in other studies.16–19,21 Compared to previous findings, our study further demonstrated that each comorbidity model can still achieve satisfactory discrimination when we focused on hospitalization due to cardiovascular disease, cerebrovascular disease, or respiratory disease, which are the leading causes of hospitalization in the COPD population.31–33 This observation may be because compared to overall death and the leading causes of hospitalization, patients hospitalized due to miscellaneous reasons are susceptible to non-disease factors that could not be captured by the comorbidity measures. These results also suggest that researchers target disease-specific outcomes when applying these comorbidity measures in COPD management.
Limitations
Our study has several limitations. First, we focused on comorbidity measures that use diagnosis and pharmacy dispensing claims data. Similar to most claims databases, the Taiwan health insurance claims database does not contain information on clinical parameters, such as the forced expiratory volume in one second. Therefore, we could not compare the predictive performance of the claims-based comorbidity measures with that of available multi-dimensional indexes (such as the BODE and CODEX indexes) that are highly associated with COPD prognosis and require information on many clinical parameters.34,35 In addition, we did not examine the predictive abilities of the well-known Johns Hopkins Adjusted Clinical Group System because it requires computation with complex and commercial algorithms.36
Conclusion
In conclusion, our study comprehensively compared the predictive performance of various comorbidity measures and various health outcomes in the setting of a population-based health insurance claims database. The Elixhauser comorbidity measure and the PBDI are useful tools for describing comorbid conditions and predicting health outcomes in patients with COPD.
Abbreviations
CDS, Chronic Disease Score; COPD, chronic obstructive pulmonary disease; CV, cardiovascular; ICD-9-CM, International Classification of Diseases, 9th Revision, Clinical Modification; NRI, net reclassification improvement; PBDI, Pharmacy-Based Disease Index.
Acknowledgments
This study was supported by the Ministry of Science and Technology, Taiwan grant MOST 106-2320-B-010-002. The funding source had no role in study design, collection, analysis and interpretation of data, writing of the report, or in the decision to submit the article for publication.
Author Contributions
Zhe-Wei Zhan, Yu-An Chen, and Yaa-Hui Dong designed the study. Yaa-Hui Dong acquired data. Zhe-Wei Zhan and Yu-An Chen analyzed data. Zhe-Wei Zhan, Yu-An Chen, and Yaa-Hui Dong interpreted data. Zhe-Wei Zhan and Yaa-Hui Dong drafted the manuscript. Yu-An Chen provided critical suggestion on the manuscript. Dr Dong is the grantor. All authors made substantial contributions to conception and design, acquisition of data or analysis and interpretation of data; took part in drafting the article or revising it critically for important intellectual content; gave final approval of the version to be published; and agree to be accountable for all aspects of the work.
Disclosure
The authors report no conflict of interest in this work.
References
1. GBD 2013 Mortality and Causes of Death Collaborators. Global, regional, and national age-sex specific all-cause and cause-specific mortality for 240 causes of death, 1990–2013: a systematic analysis for the global burden of disease study 2013. Lancet. 2015;385(9963):117–171. doi:10.1016/S0140-6736(14)61682-2
2. World Health Organization. Projections of mortality and cause of death, 2015 and 2030.Available from: https://www.who.int/healthinfo/global_burden_disease/projections/en/.
3. GBD 2013 DALYs and HALE Collaborators. Global, regional, and national disability-adjusted life years (DALYs) for 306 diseases and injuries and healthy life expectancy (HALE) for 188 countries, 1990–2013: quantifying the epidemiological transition. Lancet. 2015;386(10009):2145–2191. doi:10.1378/chest.128.4.2640
4. Global Initiative for Chronic Obstructive Lung Disease. Global strategy for the diagnosis, management and prevention of chronic obstructive pulmonary diseases. 2019 Report. Available from: https://goldcopd.org/wp-content/uploads/2018/11/GOLD-2019-v1.7-FINAL-14Nov2018-WMS.pdf.
5. Miller J, Edwards LD, Agustí A, et al. Evaluation of COPD Longitudinally to Identify Predictive Surrogate Endpoints (ECLIPSE) investigators. Comorbidity, systemic inflammation and outcomes in the ECLIPSE cohort. Respir Med. 2013;107(9):1376–1384. doi:10.1016/j.rmed.2013.05.001
6. Divo M, Cote C, de Torres JP, et al. BODE collaborative group. Comorbidities and risk of mortality in patients with chronic obstructive pulmonary disease. Am J Respir Crit Care Med. 2012;186(2):155–161. doi:10.1164/rccm.201201-0034OC
7. Slenter RH, Sprooten RT, Kotz D, Wesseling G, Wouters EF, Rohde GG. Predictors of 1-year mortality at hospital admission for acute exacerbations of chronic obstructive pulmonary disease. Respiration. 2013;85(1):15–26. doi:10.1159/000342036
8. Almagro P, Cabrera FJ, Diez J, et al. Working group on COPD Spanish society of internal medicine. Comorbidities and short-term prognosis in patients hospitalized for acute exacerbation of COPD: the EPOC en Servicios de medicina interna (ESMI) study. Chest. 2012;142(5):1126–1133. doi:10.1378/chest.11-2413
9. Charlson ME, Pompei P, Ales KL, MacKenzie CR. A new method of classifying prognostic comorbidity in longitudinal studies: development and validation. J Chron Dis. 1987;40(5):373–383. doi:10.1016/0021-9681(87)90171-8
10. Deyo RA, Cherkin DC, Ciol MA. Adapting a clinical comorbidity index for use with ICD-9CM administrative databases. J Clin Epidemiol. 1992;45(6):613–619. doi:10.1016/0895-4356(92)90133-8
11. Elixhauser A, Steiner C, Harris DR, Coffey RM. Comorbidity measures for use with administrative data. Med Care. 1998;36(1):8–27. doi:10.1097/00005650-199801000-00004
12. von Korff M, Wagner EH, Saunders K. A chronic disease score from automated pharmacy data. J Clin Epidemiol. 1992;45(2):197–203. doi:10.1016/0895-4356(92)90016-G
13. Johnson RE, Hornbrook MC, Nichols GA. Replicating the chronic disease score (CDS) from automated pharmacy data. J Clin Epidemiol. 1994;47(10):1191–1199. doi:10.1016/0895-4356(94)90106-6
14. Clark DO, Von Korff M, Saunders K, Baluch WM, Simon GE. A chronic disease score with empirically derived weights. Med Care. 1995;33(8):783–795. doi:10.1097/00005650-199508000-00004
15. Dong YH, Chang CH, Shau WY, Kuo RN, Lai MS, Chan KA. Development and validation of a pharmacy-based comorbidity measure in a population-based automated health care database. Pharmacotherapy. 2013;33(2):126–136. doi:10.1002/phar.1176
16. Schneeweiss S, Seeger JD, Maclure M, Wang PS, Avorn J, Glynn RJ. Performance of comorbidity scores to control for confounding in epidemiologic studies using claims data. Am J Epidemiol. 2001;154(9):854–864. doi:10.1093/aje/154.9.854
17. Schneeweiss S, Wang PS, Avorn J, Maclure M, Levin R, Glynn RJ. Consistency of performance ranking of comorbidity adjustment scores in Canadian and U.S. utilization data. J Gen Intern Med. 2004;19(5 Pt 1):444–450. doi:10.1111/j.1525-1497.2004.30109.x
18. Quail JM, Lix LM, Osman BA, Teare GF. Comparing comorbidity measures for predicting mortality and hospitalization in three population-based cohorts. BMC Health Serv Res. 2011;11:146. doi:10.1186/1472-6963-11-146
19. Lix LM, Quail J, Fadahunsi O, Teare GF. Predictive performance of comorbidity measures in administrative databases for diabetes cohorts. BMC Health Serv Res. 2013;13:340. doi:10.1186/1472-6963-13-340
20. Lix LM, Quail J, Teare G, Acan B. Performance of comorbidity measures for predicting outcomes in population-based osteoporosis cohorts. Osteoporos Int. 2011;22(10):2633–2643. doi:10.1007/s00198-010-1516-7
21. Antoniou T, Ng R, Glazier RH, Kopp A, Austin PC. Comparison of comorbidity classification methods for predicting outcomes in a population-based cohort of adults with human immunodeficiency virus infection. Ann Epidemiol. 2014;24(7):532–537. doi:10.1016/j.annepidem.2014.04.002
22. McArthur E, Bota SE, Sood MM, et al. Comparing five comorbidity indices to predict mortality in chronic kidney disease: a retrospective cohort study. Can J Kidney Health Dis. 2018;5:1–10. doi:10.1177/2054358118805418
23. Chu YT, Ng YY, Wu SC. Comparison of different comorbidity measures for use with administrative data in predicting short- and long-term mortality. BMC Health Serv Res. 2010;10:140. doi:10.1186/1472-6963-10-140
24. Austin PC, Stanbrook MB, Anderson GM, Newman A, Gershon AS. Comparative ability of comorbidity classification methods for administrative data to predict outcomes in patients with chronic obstructive pulmonary disease. Ann Epidemiol. 2012;22(12):881–887. doi:10.1016/j.annepidem.2012.09.011
25. National Health Insurance Administration, Ministry of Health and Welfare, Taiwan. National Health Insurance Annual Report. Available from: https://www.nhi.gov.tw/Content_List.aspx?n=9223A12B5B31CB37&topn=FB01D469347C76A7.
26. Lin LY, Warren-Gash C, Smeeth L, Chen PC. Data resource profile: the National Health Insurance Research Database (NHIRD). Epidemiol Health. 2018;40:e2018062. doi:10.4178/epih.e2018062
27. Gershon AS, Wang C, Guan J, Vasilevska-Ristovska J, Cicutto L, To T. Identifying individuals with physician diagnosed COPD in health administrative databases. COPD. 2009;6(5):388–394. doi:10.1080/15412550903140865
28. Steyerberg EW. Clinical Prediction Models: A Practical Approach to Development, Validation, and Updating. New York: Spring Science+Business Media, LLC; 2009.
29. Pencina MJ, D’Agostino RB
30. Sattler EL, Lee JS, Perri M
31. Terzano C, Conti V, Di Stefano F, et al. Comorbidity, hospitalization, and mortality in COPD: results from a longitudinal study. Lung. 2010;188(4):321–329. doi:10.1007/s00408-009-9222-y
32. Curkendall SM, DeLuise C, Jones JK, et al. Cardiovascular disease in patients with chronic obstructive pulmonary disease, Saskatchewan Canada cardiovascular disease in COPD patients. Ann Epidemiol. 2006;16(1):63–70. doi:10.1016/j.annepidem.2005.04.008
33. Huiart L, Ernst P, Suissa S. Cardiovascular morbidity and mortality in COPD. Chest. 2005;128(4):2640–2646. doi:10.1378/chest.128.4.2640
34. Celli BR, Cote CG, Marin JM, et al. The body-mass index, airflow obstruction, dyspnea, and exercise capacity index in chronic obstructive pulmonary disease. N Engl J Med. 2004;350(10):1005–1012. doi:10.1056/NEJMoa021322
35. Almagro P, Soriano JB, Cabrera FJ, et al. Short- and medium-term prognosis in patients hospitalized for COPD exacerbation: the CODEX index. Chest. 2014;145(5):972–980. doi:10.1378/chest.13-1328
36. Starfield B, Weiner J, Mumford L, Steinwachs D. Ambulatory care groups: a categorization of diagnoses for research and management. Health Serv Res. 1991;26(1):53–74.
 © 2020 The Author(s). This work is published and licensed by Dove Medical Press Limited. The full terms of this license are available at https://www.dovepress.com/terms.php and incorporate the Creative Commons Attribution - Non Commercial (unported, v3.0) License.
By accessing the work you hereby accept the Terms. Non-commercial uses of the work are permitted without any further permission from Dove Medical Press Limited, provided the work is properly attributed. For permission for commercial use of this work, please see paragraphs 4.2 and 5 of our Terms.
© 2020 The Author(s). This work is published and licensed by Dove Medical Press Limited. The full terms of this license are available at https://www.dovepress.com/terms.php and incorporate the Creative Commons Attribution - Non Commercial (unported, v3.0) License.
By accessing the work you hereby accept the Terms. Non-commercial uses of the work are permitted without any further permission from Dove Medical Press Limited, provided the work is properly attributed. For permission for commercial use of this work, please see paragraphs 4.2 and 5 of our Terms.