Back to Journals » International Journal of Nanomedicine » Volume 18
Combined SERS Microfluidic Chip with Gold Nanocone Array for Effective Early Lung Cancer Prognosis in Mice Model
Authors Qian Y , Gu Y, Deng J, Cai Z, Wang Y, Zhou R , Zhu D, Lu H, Wang Z
Received 6 March 2023
Accepted for publication 19 June 2023
Published 23 June 2023 Volume 2023:18 Pages 3429—3442
DOI https://doi.org/10.2147/IJN.S411395
Checked for plagiarism Yes
Review by Single anonymous peer review
Peer reviewer comments 2
Editor who approved publication: Dr Farooq A. Shiekh
Yayun Qian,1 Yuexing Gu,2 Jialin Deng,3 Zhaoying Cai,3 Yang Wang,3 Ruoyu Zhou,3 Dongxu Zhu,3 Hongmei Lu,4 Zheng Wang1
1Department of Pathology, The Affiliated Hospital of Yangzhou University, Yangzhou University, Yangzhou, People’s Republic of China; 2Institute of Translational Medicine, Medical College, Yangzhou University, Yangzhou, People’s Republic of China; 3Jiangsu Key Laboratory of Integrated Traditional Chinese and Western Medicine for Prevention and Treatment of Senile Diseases, Yangzhou University, Yangzhou, People’s Republic of China; 4Department of Pathology, Yangzhou Maternal and Child Health Hospital, Yangzhou, People’s Republic of China
Correspondence: Zheng Wang; Yayun Qian, Email [email protected]; [email protected]
Introduction: As the most common malignant tumor in the world, the prognosis of patients with advanced lung cancer remains poor even after treatment. There are many prognostic marker assays available, but there is still more room for the development of high-throughput and sensitive detection of circulating tumor DNA (ctDNA). Surface-enhanced Raman spectroscopy (SERS), a spectroscopic detection method that has received wide attention in recent years, can achieve exponential amplification of Raman signals by using different metallic nanomaterials. Integrating SERS with signal amplification strategy into the microfluidic chip and applying it to ctDNA detection is expected to be an effective tool for the prognosis of lung cancer treatment effect in the future.
Methods: To construct a high-throughput SERS microfluidic chip integrated with enzyme-assisted signal amplification (EASA) and catalytic hairpin self-assembly (CHA) signal amplification strategies, using hpDNA-functionalized Au nanocone arrays (AuNCAs) as capture substrates and cisplatin-treated lung cancer mice to simulate the detection environment for sensitive detection of ctDNA in serum of lung cancer patients after treatment.
Results: The SERS microfluidic chip constructed by this scheme, with two reaction zones, can simultaneously and sensitively detect the concentrations of four prognostic ctDNAs in the serum of three lung cancer patients with a limit of detection (LOD) as low as the aM level. The results of the ELISA assay are consistent with this scheme, and its accuracy is guaranteed.
Conclusion: This high-throughput SERS microfluidic chip has high sensitivity and specificity in the detection of ctDNA. This could be a potential tool for prognostic assessment of lung cancer treatment efficacy in future clinical applications.
Keywords: circulating tumor DNA, surface-enhanced Raman scattering, lung cancer, AuNCAs, prognostic assessment
Introduction
Lung cancer is the most common malignancy in the world and the leading cause of tumor mortality, so identifying relevant tumor biomarkers is crucial for the diagnosis and prognosis of lung cancer.1,2 Circulating tumor DNA (ctDNA) in peripheral blood is one of the important bioinformatic molecules, and there is growing evidence that ctDNA provides rich tumor information as a prognostic biomarker.3–5 Aberrant activation of BRAF in the MAPK pathway leads to excessive cell proliferation and division, and most patients with malignancies are usually accompanied by BRAF V600E mutations.6,7 In addition, researchers have found that mutations in genes such as PIK3CA Q546K, TP53, and KRAS G12V are frequently seen in lung cancer patients.8–11 Cisplatin is one of the most commonly used chemotherapeutic drugs in clinical practice and is now widely used to treat malignant tumors such as lung cancer.12 It disrupts the DNA replication and transcription process of cancer cells mainly by binding to double-stranded DNA in the nucleus, thereby slowing or inhibiting tumor growth.13–15 However, even after treatment, the survival prognosis of patients with advanced lung cancer remains poor.
Currently, techniques such as polymerase-chain reaction (PCR) and second-generation sequencing (NGS) are mainly used to detect ctDNA. These techniques differ in sensitivity, accuracy, specificity, and coverage of ctDNA detection.16 Therefore, many new ctDNA detection methods have been reported. Surface-enhanced Raman spectroscopy (SERS) is expected to be a powerful method for detecting biomarkers due to its signal stability, high sensitivity, and high interference resistance.17,18 Surface plasmon resonance (LSPR) is the leading cause of SERS signal enhancement. This effect is mainly due to the interaction of incident light with nanometallic structures, which enhances the local electromagnetic field at the surface, resulting in many “hot spots”.19,20 The advantages of SERS have led to many studies to develop new Raman probes and SERS substrates to improve signal enhancement and selectivity. Au nanocone arrays (AuNCAs) are a new type of Au nanomaterials with a periodic conical structure, and their photothermal effects are particularly prominent and have attracted increasing attention in recent years. In addition, the “hot spots” at the tips or coupling regions of AuNCAs can effectively enhance the intensity of the surrounding electromagnetic field, thus exhibiting excellent SERS enhancement effects.21–23 Au-Ag nanoboxes (Au-AgNBs) are a kind of porous structure with a hollow structure on the surface of Au-Ag alloy. Due to its unique surface plasmon resonance properties, it can be used as an excellent medical diagnostic nanomaterial with promising applications in biomedical research.24
To overcome the limitations of traditional ctDNA detection methods, a range of nucleic acid signal amplification strategies have been used to improve the sensitivity of low-level ctDNA analysis, including polymerase-chain reaction (PCR), loop-mediated isothermal amplification (LAMP), and rolling loop amplification (RCA).25–27 In particular, catalytic hairpin self-assembly (CHA) is favored for its excellent specificity and sensitivity as a method to extend and amplify nucleotide sequences at room temperature.28,29 In addition, enzyme-assisted signal amplification (EASA) uses polymerase and endonuclease as raw materials to exponentially amplify detected objects by the principle of semi-conserved replication of DNA, resulting in signal amplification.30,31 Although these methods can achieve signal amplification independently, the single-signal amplification strategy has a weak signal and low sensitivity in detecting some low-abundance substances. Therefore, combining single signal amplification methods to achieve multiple signal amplification is expected to be a way to improve the performance of ctDNA analysis.
A microfluidic chip is a minor or tens of microns order of magnitude microchannel chip that integrates sample collection, mixing, reaction, separation, and detection operation units, which has become the central implementation platform for immediate detection (POCT).32,33 As a portable instant detection method, the microfluidic chip detection method has the advantages of no pollution, less sample required, and simple operation. It is widely used in disease screening, prevention, postoperative treatment, and other fields. Based on this, the combination of the AuNCAs with excellent SERS enhancement performance and dual signal amplification strategy to construct microfluidic chips for BRAF V600E, PIK3CA Q546K, TP53, and KRAS G12V detection and analysis is significant for survival prognosis and efficacy assessment of lung cancer treatment.
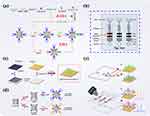
Herein, we report a dual-signal amplification method based on the CHA response after EASA and construct a novel high-throughput SERS microfluidic chip for ultrasensitive detection of trace changes of relevant ctDNA in serum after lung cancer treatment (Scheme 1). The microfluidic chip is designed with two parallel reaction zones and embedded with different hpDNA-functionalized AuNCAs as capture substrates to enable sensitive, specific detection of multiple ctDNAs. Taking BRAF V600E assay analysis as an example, through the EASA strategy, BRAF V600E can hybridize with designed single-stranded DNA (S1) to form an incomplete duplex and then generate a large amount of trigger DNA (tDNA1) through polymerase and nucleic acid endonuclease cycles to achieve the first signal amplification. Driven by capillary force, tDNA1 and SERS probe solution (Au-AgNBs@TPP@HP1-1) flow in the microchannel, and the two solutions mix and react to generate an unstable intermediate (Au-AgNBs@TPP@HP1-1-tDNA1), which finally flows into the reaction zone I for the CHA reaction (HP2-1 replaces tDNA1), generating a large number of HP1-1-HP2-1 complexes and achieving the second signal amplification. Based on this principle, a clear SERS enhancement signal can be detected in reaction zone I (BRAF V600E and PIK3CA Q546K) and reaction zone II (KRAS G12V and TP53). The linear relationship between the intensity of the characteristic peaks of the corresponding SERS spectra and the target concentration in the two reaction regions allows the quantitative detection of ctDNA. Finally, a lung cancer mouse model was created to assess the feasibility of this SERS microfluidic chip in lung cancer treatment survival prognosis. Notably, this is the first time that functionalized AuNCAs and dual-signal amplification strategies have been integrated into a SERS microfluidic chip for the sensitive detection of four ctDNAs simultaneously.
Materials and Methods
Polystyrene sphere (PS, diameter 250 nm) suspension (5 wt%), hexamethylenetetramine (HMT), chloroauric acid tetrahydrate (HAuCl4), polyvinyl pyrrolidone (PVP), AgNO3, ascorbic acid (AA), ethanol absolute (98%), polyethylene glycol (PEG), polystyrene sphere (PS), sulfuric acid (H2SO4), hydrogen peroxide (H2O2), n-hexane, tris(2-carboxyethyl) phosphine (TCEP), phosphate-buffered saline (PBS), bovine albumin (BSA), 4-Mercaptobenzoic acid (4-MBA), 5,5’-Dithiobis-(2-nitrobenzoic acid) (DTNB), triphenylphosphine (TPP) all purchased from Sinopharm Chemical Reagent Suzhou Co. Sulfur hexafluoride (SF6) etching gas was purchased from Wuhan Narender Specialty Gases Co. The DNA polymerase and endonuclease used in the experiments were purchased from (Kramer) Shanghai Spectrum Biotechnology Co. The oligonucleotides used in the experiments are shown in Table S1. The quantitative real-time polynucleotide chain reaction (qRT-PCR) kits were purchased from GeteinBiotech (China). All solutions used in the experiments were ultrapure water (18.2 Ω). The glass apparatus was soaked in aqua regia and cleaned with deionized water.
The Pathological Studies, Using Nude Mice Model
Fourteen male BALB/c nude mice were purchased from the Animal Medicine Comparative Center of Yangzhou University, of which seven served as the control group and seven as the treatment group. All animal experiments were reviewed and approved by the Animal Care Committee of Yangzhou University and conducted in accordance with the Ethical Principles of Laboratory Animal Welfare (Approval ID: SYXK [Su] 2022-0044). Human lung cancer A549 cells with a red fluorescent protein tag were obtained from the Shanghai Cell Bank, Chinese Academy of Sciences. The A549 cells were cultured in Ham’s F-12K medium containing 10% FBS in an incubator containing 5% CO2 at 37 °C. 1×10⁷/mL of A549 cells were injected subcutaneously into the right axilla of nude mice. From day 8, mice in the treated group were intraperitoneally injected with 1 mg/kg of cisplatin once every two days. Weight changes in the mice were recorded throughout the experiment. A vernier caliper measured the length and width of the transplanted tumor, and the tumor volumes were calculated according to the following formula: V (mm3) = (length × width2)/2. Tumor growth was recorded with the live animal imaging system, and the peripheral blood was taken through the tail vein. On day 28, the mice were sacrificed. The transplanted tumors were harvested and made into paraffin sections, and the tumor cells were visualized under a microscope.
Synthesis of Au-Ag Nanoboxes
The Au-Ag nanoboxes (Au-AgNBs) were prepared by a one-step synthesis method. First, 15 mL of HAuCl4 solution (0.75 mM) was added to 15 mL of HMT solution (0.03 M) with constant stirring, then 15 mL of PVP solution (0.3 M), 500 µL of AgNO3 solution (0.01 M) and 250 µL of AA solution (0.08 M). Stirring was continued until the solution turned dark purple (15 min) and then left overnight, and the Au-AgNBs solution was obtained after centrifugation (4000 rpm/min, 10 min).
Preparation of Surface-Enhanced Raman Spectroscopy Probes
Briefly, 200 µL of TPP (2 mM) and DTNB (2 mM) were added to 5 mL of Au-AgNBs solution, respectively, and stirred at room temperature for 1 h (750 r/min) to obtain Au-AgNBs@TPP and Au-AgNBs@DTNB. Subsequently, 150 µL of ready-to-use TECP buffer (1 mM) was used to activate hairpin DNA (hpDNA). The activated hpDNA (HP1-1, HP1-2, HP1-3, and HP1-4) solutions were added to Au-AgNBs@TPP and Au-AgNBs@DTNB solutions, respectively, and mixed for 12 h. Finally, the above solutions were dispersed into 100 µL of BSA solution (1 wt%) and incubated for 1 h. After purification treatment (8000 r/min, 10 min), the SERS probes (Au-AgNBs@TPP@HP1-1, Au-AgNBs@DTNB@HP1-2, Au-AgNBs@TPP@HP1-3, and Au-AgNBs@DTNB@HP1-4) were dispersed into PBS solution.
Preparation of the hpDNA Functionalized Au Nanocone Arrays
The PS sphere monolayer templates were prepared by the liquid–liquid interface self-assembly method by sequentially adding 6 mL of PS sphere mixture, 2 mL of n-hexane, and 2 mL of anhydrous ethanol to form dense monolayer films due to the surface energy. Subsequently, the monolayer film was fished up using the hydrophilic treated silicon wafer to obtain the monolayer-ordered PS ball template. After heating the above templates in an oven at 72 °C for 15 min, the templates were etched for 5 min using a reactive ion etching (RIE) machine with a power of 200 W and a gas flow rate of 60 sccm. Then, the etched samples were rinsed with ethanol and annealed (600 °C, 2 h) for removing the remaining PS spheres. Finally, an Au film was coated on the sample at a deposition rate of 0.5 nm/s to prepare the Au nanocone arrays (AuNCAs). The hpDNA functionalized AuNCAs were obtained by modifying hpDNA on the surface of the AuNCAs. First, hpDNA (HP2-1, HP2-2, HP2-3, and HP2-4) was separate activated using 100 µL of ready-to-use TECP buffer (1 mM). The activated hpDNA was added dropwise to the AuNCAs and incubated in a constant temperature incubator at 25 °C for 12 h to obtain the hpDNA functionalized AuNCAs (AuNCAs@HP2-1@HP2-2, AuNCAs@HP2-3@HP2-4).
Construction of the Microfluidic Chip
The designed microfluidic chip molds were obtained by etching using a photolithography machine. PDMS and curing agent were mixed in a mass ratio of 10:1 and poured into the mold, which was placed on a heating plate for curing (80 °C, 2 h). Then, the cured PDMS chip was punched and cleaned by ultrasonic cleaner for 10 min. After drying, the channel surface of the PDMS chip was placed in PEG solution and heated for 30 min (160 °C), then cleaned again with isopropyl alcohol and left for 1 h at low temperature. Finally, hpDNA-functionalized AuNCAs were embedded in the hydrophilic PDMS chip (AuNCAs@HP2-1@HP2-2 embedded in reaction zone I, AuNCAs@HP2-3@HP2-4 embedded in reaction zone II) and the PDMS chip was integrated with glass substrate (2 mm thickness) using oxygen iso-ion bonding to obtain SERS microfluidic chip.
Amplification of ctDNA Signal Response
First, mix 10 µL, 10 pM of ctDNA (BRAF V600E, PIK3CA Q546K, KRAS G12V, and TP53) with 50 µL, 10 nM of single-stranded DNA (S1, S2, S3, and S4), and place the mixed solution on incubating at 37 °C for 2 h to form complementary double strands. Next, the solution containing complementary double strands was mixed with 0.20 U·µL−1 of Klenow polymerase, 0.30 U·µL−1 of Nb. BbvCI endonuclease, 5 µL of 10× CutSmart buffer, 2 µL of dNTP, and continued incubation for 120 min. Finally, the polymerization shear reaction was terminated by heating the mixed solution at 80 °C for 10 min to inactivate the enzyme, resulting in trigger DNA (tDNA1, tDNA2, tDNA3, and tDNA4).
Measurement
During the assay, the SERS probes (Au-AgNBs@TPP@HP1-1, Au-AgNBs@DTNB@HP1-2, Au-AgNBs@TPP@HP1-3, and Au-AgNBs@DTNB@HP1-4) and the tDNA solution (tDNA1, tDNA2, tDNA3, and tDNA4) were added to the spiking zone of the microfluidic chip. Driven by capillary forces, the mixed solutions can flow in the microchannel and react in the reaction zone. The Raman spectra of the reaction zone were obtained using a laser confocal Raman spectrometer with a laser intensity of 5 mW, an excitation wavelength of 785 nm, 50× objective lens, and an exposure of 10s. The spectra were acquired in the range of 600–1800 cm−1. The average spectra were obtained by collecting SERS spectra at 10 different points in the reaction zone, and the data were subjected to noise reduction, baseline calibration, and smoothing.
Instruments
Scanning Electron Microscope (SEM) images and transmission electron microscope (TEM) images were obtained by S-4800 II field emission scanning electron microscope (Japan) and TECNAI 12 transmission electron microscope (Netherlands), respectively. High-resolution transmission electron microscopy (HRTEM) images and selected area electron diffraction (SAED) images were obtained by a Tecnai G2F30 S-TWIN field emission transmission electron microscope (USA). Ultraviolet-visible-near infrared (UV-Vis-NIR) absorption spectra were obtained by a UV absorption spectrometer (USA). A live animal imaging system (PerkinElmer, USA) was used to record the tumor growth process. SERS measurements were obtained using a Renishaw inVia Qontor laser micro confocal Raman spectrometer (UK).
Result and Discussion
Characterization of Au-Ag Nanoboxes
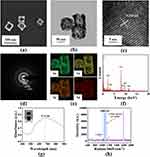
The morphology of Au-AgNBs was characterized using SEM and TEM images. As shown in Figure 1a, the Au-AgNBs prepared using the one-step synthesis method exhibit a homogeneous hollow cubic structure. As seen in Figure 1b, the average edge length of Au-AgNBs was 70 nm. In addition, we further investigated the structure of Au-AgNBs using HRTEM and SAED images. The lattice spacing corresponding to the (111) plane in the HRTEM image was 0.238 nm (Figure 1c). Individual Au-AgNBs are shown in the SAED image (Figure 1d), and their diffraction rings can be assigned to the (111), (200), (220), and (311) planes of Au-AgNBs, respectively. The elemental distribution of Au-AgNBs was useful for further understanding of their properties, and it was known from Figure 1e and f that Au-AgNBs were mainly composed of Au and Ag elements (Cu elements were from the copper mesh used for the assay). Figure 1g showed the UV-Vis-NIR absorption spectra of Au-AgNBs, with a strong UV absorption peak at 673 nm. To understand the SERS enhancement ability of Au-AgNBs, 4-MBA-modified Au-AgNBs were used, and the enhancement factor (EF) was calculated. From Figure 1h, it can be seen that the signal intensity of 4-MBA-modified Au-AgNBs was much higher than that of pure 4-MBA. By the equation EF= (IS/CS)/(IR/CR), EF can be calculated as 2.6×10⁵.
Characterization of Compactly Arranged of AuNCAs
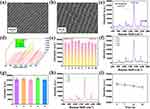
AuNCAs were obtained by PS ball template etching method, and the corresponding SEM images are shown in Figure 2a and b. It can be seen that AuNCAs were arrays closely arranged with many Au cone structures. The SERS enhancement capability of the AuNCAs was detected using a DTNB-modified AuNCAs. The EF could be calculated as 3.17×10⁸ (Figure 2c). DTNB (10−8 M) labeling of the AuNCAs was used to assess their uniformity, with the signal intensities classified from strong to weak as red, yellow, green, and blue, with an overall uniform green color in Figure 2d, except for a minimal amount of yellow and blue. Eight points were randomly selected, and SERS spectra were obtained, corresponding to the SERS signal intensity at 1330 cm−1 as shown in Figure 2e. The spectra showed no difference in the overall waveform, except for the change in intensity level, indicating the excellent homogeneity of the AuNCAs. In addition, the reproducibility and stability of the substrates affect the subsequent detection process. AuNCAs prepared in 5 different batches were modified with DTNB (10−8 M), and the obtained spectra showed a consistent waveform as a whole (Figure 2f), and the signal intensity at 1330 cm−1 occasionally changed (Figure 2g). The DTNB (10−8 M)-modified AuNCAs were stored at room temperature for different days (1d, 7d, 14d, and 21d), and the signal intensity after 21d was still 89.1% of that after 1d (Figure 2h and i). Therefore, AuNCAs had good reproducibility and stability and can be applied to SERS bioassays.
Characterization of Dual Signal Amplification Strategy
Agarose gel electrophoresis was used to study the triggering of the CHA reaction by tDNA generated by BRAF V600E performing the EASA reaction, and the results were confirmed. In the absence of enzyme (lane 3), polymerase (lane 4) and nucleic acid endonuclease (lane 5), there was little significant change in the corresponding bands (Figure 3a). When both polymerase and nucleic acid endonuclease are present, lane 6 shows a high molecular weight band (fully complementary), as well as a separate band (tDNA1). In the subsequent CHA reaction (Figure 3b), tDNA1 was incubated with HP1-1, and the molecular weight of the bands corresponding to lane 4 increased due to the hybridization reaction between the two. In lane 5, when tDNA1, HP1-1, and HP2-1 were incubated, HP2-1 could replace tDNA1 from the HP1-1-tDNA1 complex and be released, demonstrating the occurrence of the CHA reaction. In addition, HP1-1 and HP2-1 could not form the HP1-1-HP2-1 complex in the absence of tDNA1 presence. The experimental results demonstrate the feasibility of the CHA reaction after the EASA reaction.
Experimental Parameters Optimization
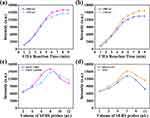
Since the EASA reaction was the initiator of the subsequent reaction, it was crucial to optimize its conditions (Supporting Information, Figure S1). Thus, the polymerase concentration was set to 0.20 U·µL−1, the endonuclease concentration to 0.30 U·µL−1, the reaction temperature to 38°C, and the reaction time to 120 min in the later experiments. To obtain the best experimental results, we investigated the effect of different CHA reaction times and SERS probe volumes on the results. It can be seen from Figure 4a and b that the SERS signal intensity gradually increased with the CHA reaction time and stabilized at 8 min, so we controlled the CHA reaction time to 8 min. In addition, we investigated the SERS probe volume of BRAF V600E, PIK3CA Q546K, KRAS G12V, and TP53. As shown in Figure 4c, the increase in the volume of the SERS probes of BRAF V600E and PIK3CA Q546K was accompanied by an increase in the intensity of the SERS signal first and then a decrease. The same was true for the effect of the SERS probe volume of KRAS G12V and TP53 on the SERS signal (Figure 4d). Therefore, according to the results, the SERS probe volume of BRAF V600E and PIK3CA Q546K was set to 8 µL, and the SERS probe volume of KRAS G12V and TP53 was set to 7 µL.
Preparation of the SERS Microfluidic Chip
The microfluidic chip’s flowability and gas tightness must be evaluated to ensure a stable assay process. Instead of tDNA solution and SERS probes, blue and red inks were used. Driven by capillary force, the blue and red inks flow slowly and mix in the microchannel, and a single channel can be filled in 32s without leakage (Figure 5a). Thus, the microfluidic chip has excellent flowability and gas tightness. In addition, since PDMS has its own SERS signal, it was necessary to verify whether PDMS would affect the experimental results (Figure 5b). The three regions of the microfluidic chip were examined separately, and the corresponding SERS spectra are shown in Figure 5c, from which it can be seen that the SERS signal generated in the region I (PDMS) was minimal and had essentially no effect on the SERS signal in regions II and III (CHA reaction).
 |
Figure 5 (a) Physical image of ink flowing in a microfluidic chip over time. (b) Top view of the microfluidic chip and (c) the SERS spectra corresponding to the 3 regions. |
Evaluation of Specificity and Sensitivity of the SERS Microfluidic Chip
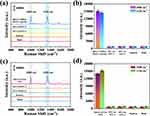
Since some nucleic acids may react incorrectly with the SERS probes, it was necessary to analyze the specificity of the microfluidic chip to avoid this situation. Under the optimized experimental conditions described above, random sequences, single base mismatch sequences (MT1-1, MT1-2, MT1-3, and MT1-4), and three base mismatch sequences (MT3-1, MT3-2, MT3-3, and MT3-4) were used to assess their specificity for tDNA. As shown in Figure 6a, when tDNA1 and tDNA2 solutions flowed into reaction zone I for the CHA reaction, the products (Au-AgNBs@TPP@HP1-1-HP2-1 and Au-AgNBs@DTNB@HP1-2-HP2-2) produced significantly higher SERS spectral signal intensities compared to the addition of interfering sequences. The signal intensities corresponding to 1000 cm−1 and 1330 cm−1 (Figure 6b) where the difference between tDNA and interfering sequences is noticeable. Similarly, the SERS spectra of the products (Au-AgNBs@TPP@HP1-3-HP2-3 and Au-AgNBs@DTNB@HP1-4-HP2-4) after the influx of tDNA3 and tDNA4 into reaction zone II can be easily distinguished from the interfering sequences (Figure 6c and d).
Eight batches of SERS microfluidic chips prepared at different times under the same assay conditions showed good reproducibility (Figure S2). In addition, after analyzing the reproducibility of the microfluidic chip, its sensitivity was evaluated and compared. Detection by adding ctDNA (BRAF V600E, PIK3CA Q546K, KRAS G12V, and TP53) at different concentrations (10−17 M-10−11 M) to the serum, after 3 parallel experiments to obtain the average spectrum, and the intensity of the characteristic peaks corresponding to 1000 cm−1 and 1330 cm−1 diminished with decreasing concentrations of BRAF V600E and PIK3CA Q546K, as in Figure 7a. Meanwhile, the logarithm of BRAF V600E and PIK3CA Q546K concentrations showed a linear relationship with the SERS signal intensity, with standard curves of y = 2305.43x-1088.44, R2 = 0.994 and y = 2041.25x-982.25, R2=0.982 (Figure 7b and c). Similarly, the standard curves for KRAS G12V and TP53 were y = 2152.59x-1893.79, R2=0.984 and y = 2398.23x-1925.72, R2 = 0.986, respectively (Figure 7d–f). The above standard curve was used for subsequent quantitative determination of ctDNA in serum based on SERS spectroscopy. The limits of detection (LOD) were calculated as 2.16 aM, 2.33 aM, 2.47 aM, and 3.15 aM, respectively, which was lower than the recent detection method (Table 1). Therefore, the SERS microfluidic chip developed this time can effectively screen and quantify target ctDNA and has a good application prospect in the monitoring of survival and prognosis of clinical lung cancer treatment.
 |
Table 1 Comparison of the Proposed Strategy with Other Reported Methods |
Characterization of the Nude Mice Model of Lung Cancer
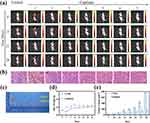
A transplanted tumor model for lung cancer was established by subcutaneous injection of human lung cancer A549 cells into nude mice. Approximately six days after the injection, the subcutaneous tumors were accessible. The growth of mice and xenograft tumors was recorded weekly with a live animal imaging system (Figure 8a), and the most significant one control mouse was selected for comparison with the tumor photographs of the seven treated mice. Changes in mouse body weight (Figure 8d) and xenograft tumor volume growth (Figure 8e) were monitored every four and three days, respectively. The whole transplant tumor experiment lasted for 28 days. On day 28, the lung cancer xenograft tumors were collected (Figure 8c) and embedded in paraffin. After hematoxylin and eosin (H&E) staining, the tumor cell morphology was visualized under a microscope (Figure 8b). It can be seen that the cells are disordered, large, and dark stained, all showing the characteristics of the tumor cells. These results confirm that a nude mouse lung cancer model has been successfully established.
Application of Clinical Samples
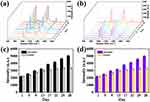
After establishing a nude mouse lung cancer model, SERS spectra were obtained using the proposed SERS microfluidic chip to detect serum at different times to evaluate the clinical application potential of the chip and the prognostic survival efficacy of lung cancer treatment. We applied the chip to obtain the average SERS spectra of BRAF V600E and PIK3CA Q546K in untreated and cisplatin-treated (7 mice) serum at different times (Figure 9a and b). Compared with the untreated mice, the increasing rate of BRAF V600E and PIK3CA Q546K in serum of cisplatin-treated mice gradually slowed, and the characteristic peak intensity histograms corresponding to 1000 cm−1 and 1330 cm−1 (Figure 9c and d) showed the difference before and after cisplatin treatment more clearly. Similarly, the same changes occurred in serum concentrations of KRAS G12V and TP53 (Figure S3), which allowed the analysis of the survival prognosis of lung cancer treatment. In addition, we applied qRT-PCR to detect ctDNA expression levels in the serum of cisplatin-treated mice, which was used to validate the accuracy of the method (Tables S2 and S3). The consistent results of both methods demonstrated that this SERS microfluidic chip could be used for sensitive detection of ctDNA in serum.
Conclusion
In this work, we developed a high-throughput SERS microfluidic chip that uses hpDNA-functionalized AuNCAs as a capture substrate and integrates EASA and CHA signal amplification strategies to detect ctDNA associated with survival prognosis of lung cancer treatment. The SERS microfluidic chip was evaluated to exhibit good homogeneity, stability and specificity. The accuracy of the method was validated with a more comprehensive range of detection compared to qRT-PCR. In addition, a lung cancer nude mice model was established for studying the changes of ctDNA expression levels before and after treatment. Therefore, this method can achieve real-time efficacy assessment during lung cancer treatment. In summary, this SERS microfluidic chip is expected to be an ideal platform for future survival prognosis and drug efficacy assessment in lung cancer treatment.
Acknowledgments
This work was supported by the Major Programs of Natural Science Foundation of Higher Education in Jiangsu Province (19KJA480003), the Administration of Traditional Chinese Medicine Project of Jiangsu Province (MS2021081), the Maternal and Child Health Research Project of Jiangsu Province (F202124), the Natural Science Foundation of Yangzhou (YZ2021087), and the Science and Technology Innovation Projects of Taizhou (TS202225).
Disclosure
The authors report no conflicts of interest in this work.
References
1. Long J-T, Cheang T-Y, Zhuo S-Y, et al. Anticancer drug-loaded multifunctional nanoparticles to enhance the chemotherapeutic efficacy in lung cancer metastasis. J Nanobiotechnol. 2014;12(1):37. doi:10.1186/s12951-014-0037-5
2. Bade BC, Dela Cruz CS. Lung cancer 2020 epidemiology, etiology, and prevention. Clin Chest Med. 2020;41(1):1.
3. Zhang W, Xia W, Lv Z, Xin Y, Ni C, Yang L. Liquid biopsy for cancer: circulating tumor cells, circulating free DNA or exosomes? Cell Physiol Biochem. 2017;41(2):755–768.
4. Lai J, Du B, Wang Y, Wu R, Yu Z. Next-generation sequencing of circulating tumor DNA for detection of gene mutations in lung cancer: implications for precision treatment. OncoTargets Ther. 2018;11:9111–9116.
5. Zhao H, Chen K-Z, Hui B-G, Zhang K, Yang F, Wang J. Role of circulating tumor DNA in the management of early-stage lung cancer. Thorac Cancer. 2018;9(5):509–515.
6. Caparica R, de Castro G, Gil-Bazo I, et al. BRAF mutations in non-small cell lung cancer: has finally Janus opened the door? Crit Rev Oncol Hemat. 2016;101:32–39.
7. Pendharkar D, Ausekar BV, Gupta S. Molecular biology of lung cancer-a review. Indian J Surg Oncol. 2013;4(2):120–124.
8. Wang L, Hu H, Pan Y, et al. PIK3CA mutations frequently coexist with EGFR/KRAS mutations in non-small cell lung cancer and suggest poor prognosis in EGFR/KRAS wildtype subgroup. PLoS One. 2014;9(2):2.
9. Biton J, Mansuet-Lupo A, Pecuchet N, et al. TP53, STK11, and EGFR mutations predict tumor immune profile and the response to anti-PD-1 in lung adenocarcinoma. Clin Cancer Res. 2018;24(22):5710–5723.
10. Fan Z, Zhang Q, Feng L, et al. Genomic landscape and prognosis of patients with TP53-mutated non-small cell lung cancer. Ann Transl Med. 2022;10(4):4. doi:10.21037/atm-22-412
11. Gao W, Jin J, Yin J, et al. KRAS and TP53 mutations in bronchoscopy samples from former lung cancer patients. Mol Carcinog. 2017;56(2):381–388.
12. Kosmidis C, Sapalidis K, Zarogoulidis P, et al. Inhaled cisplatin for NSCLC: facts and results. Int J Mol Sci. 2019;20:8.
13. Kryczka J, Kryczka J, Czarnecka-Chrebelska KH, Brzezianska-Lasota E. Molecular mechanisms of chemoresistance induced by cisplatin in NSCLC cancer therapy. Int J Mol Sci. 2021;22:16.
14. Qiu W-L, Hsu W-H, Tsao S-M, et al. WSG, a glucose-rich polysaccharide from ganoderma lucidum, combined with cisplatin potentiates inhibition of lung cancer in vitro and in vivo. Polymers. 2021;13(24):4353.
15. Wang G, Bhoopalan V, Wang D, Wang L, Xu X. The effect of caffeine on cisplatin-induced apoptosis of lung cancer cells. Exp Hematol Oncol. 2015;4:5.
16. Chen X, Yang L, Liang S, et al. Entropy-driven strand displacement reaction for ultrasensitive detection of circulating tumor DNA based on upconversion and Fe3O4 nanocrystals. Sci China Mater. 2021;64(10):2593–2600.
17. Hu J, Zhang C. Surface-enhanced raman scattering technology and its application to gene analysis. Prog Chem. 2010;22(8):1641–1647.
18. Kim J, Sim K, Cha S, Oh J-W, Nam J-M. Single-particle analysis on plasmonic nanogap systems for quantitative SERS. J Raman Spectrosc. 2021;52(2):375–385.
19. Sharma B, Frontiera RR, Henry A-I, Ringe E, Van Duyne RP. SERS: materials, applications, and the future. Mater Today. 2012;15(1–2):16–25.
20. Zong C, Xu M, L-J X, et al. Surface-enhanced raman spectroscopy for bioanalysis: reliability and challenges. Chem Rev. 2018;118(10):4946–4980.
21. Zhu Q, Zhao X, Zhang X, et al. Au nanocone array with 3D hotspots for biomarker chips. Crystengcomm. 2020;22(31):5191–5199.
22. Zhang PP, Gao J, Sun XH. An ultrasensitive, uniform and large-area surface-enhanced Raman scattering substrate based on Ag or Ag/Au nanoparticles decorated Si nanocone arrays. Appl Phys Lett. 2015;106(4):43103.
23. Shimizu T, Tanaka N, Tada Y, et al. Fabrication of nanocone arrays by two step metal assisted chemical etching method. Microelectron Eng. 2016;153:55–59.
24. Wang P, Lux L, Jin M, et al. Au/Ag nanobox-based near-infrared surface-enhanced raman scattering for hydrogen sulfide sensing. ACS Appl Bio Mater. 2019;2(1):417–423.
25. Guk K, Hwang SG, Lim J, et al. Fluorescence amplified sensing platforms enabling miRNA detection by self-circulation of a molecular beacon circuit. Chem Commun. 2019;55(24):3457–3460.
26. Koo KM, Trau M. Direct enhanced detection of multiple circulating tumor DNA variants in unprocessed plasma by magnetic-assisted bioelectrocatalytic cycling. ACS Sens. 2020;5(10):3217–3225.
27. Wang K, Peng Z, Lin X, Nian W, Zheng X, Wu J. Electrochemical biosensors for circulating tumor DNA detection. Biosensors-Basel. 2022;12(8):649.
28. Si Y, Xu L, Deng T, Zheng J, Li J. Catalytic hairpin self-assembly-based SERS sensor array for the simultaneous measurement of multiple cancer-associated miRNAs. ACS Sens. 2020;5(12):4009–4016.
29. Wang Y, Abd El-Aty AM, Chen G, et al. A competitive immunoassay for detecting triazophos based on fluorescent catalytic hairpin self-assembly. Microchim Acta. 2022;189(3):114.
30. Li Y, Fang Q, Miao X, et al. Aptamer conformation-cooperated enzyme-assisted surface-enhanced raman scattering enabling ultrasensitive detection of cell surface protein biomarkers in blood samples. ACS Sens. 2019;4(10):2605–2614.
31. Tan Y, Guo Q, Zhao X, et al. Proximity-dependent protein detection based on enzyme-assisted fluorescence signal amplification. Biosens Bioelectron. 2014;51:255–260.
32. Wang S, Hong S, Cai S, et al. Negative depletion mediated brightfield circulating tumour cell identification strategy on microparticle-based microfluidic chip. J Nanobiotechnol. 2020;18(1):70.
33. Wang Z-L, Wang Z-Y, Zong S-F, Cui Y-P. Microfluidic SERS chip and its biosensing applications. Chinese Opt. 2018;11(3):513–530.
34. Liu LQ, Yin F, Lu Y, et al. A light-up “G-quadruplex nanostring” for label-free and selective detection of miRNA via duplex-specific nuclease mediated tandem rolling circle amplification. Nanomed Nanotechnol Biol Med. 2021;32:102339.
35. Zhu D, Liu W, Zhao D, et al. Label-free electrochemical sensing platform for microRNA-21 detection using thionine and gold nanoparticles co-functionalized MoS2 nanosheet. ACS Appl Mater Inter. 2017;9(41):35597–35603.
36. Wang D, O’Rourke D, Sanchez-Garcia JF, Cai T, Scheuenpflug J, Feng Z. Development of a liquid biopsy based purely quantitative digital droplet PCR assay for detection of MLH1 promoter methylation in colorectal cancer patients. BMC Cancer. 2021;21(1):797.
37. Peng L, Zhou J, Liang Z, et al. SERS-based sandwich bioassay protocol of miRNA-21 using Au@Ag core-shell nanoparticles and a Ag/TiO2 nanowires substrate. Anal Methods. 2019;11(23):2960–2968.
 © 2023 The Author(s). This work is published and licensed by Dove Medical Press Limited. The full terms of this license are available at https://www.dovepress.com/terms.php and incorporate the Creative Commons Attribution - Non Commercial (unported, v3.0) License.
By accessing the work you hereby accept the Terms. Non-commercial uses of the work are permitted without any further permission from Dove Medical Press Limited, provided the work is properly attributed. For permission for commercial use of this work, please see paragraphs 4.2 and 5 of our Terms.

