Back to Journals » International Journal of Nanomedicine » Volume 19
Combined Photosensitive Gene Therapy Effective Against Triple-Negative Breast Cancer in Mice Model
Authors Hu Y, Wang D, Zhang T, Lei M, Luo Y, Chen Z, Li Y, Duan D, Zhang L ![]() , Zhu Y
, Zhu Y
Received 9 November 2023
Accepted for publication 20 February 2024
Published 23 February 2024 Volume 2024:19 Pages 1809—1825
DOI https://doi.org/10.2147/IJN.S449042
Checked for plagiarism Yes
Review by Single anonymous peer review
Peer reviewer comments 2
Editor who approved publication: Professor Farooq A. Shiekh
Yixue Hu,1 Dongna Wang,2 Tianyu Zhang,2 Meng Lei,3 Yingnan Luo,2 Zhimeng Chen,3 Yuting Li,2 Dandan Duan,2 Liefeng Zhang,1 Yongqiang Zhu1,2
1College of Life Science, Nanjing Normal University, Nanjing, People’s Republic of China; 2School of Food and Pharmaceutical Engineering, Nanjing Normal University, Nanjing, People’s Republic of China; 3College of Science, Nanjing Forestry University, Nanjing, People’s Republic of China
Correspondence: Liefeng Zhang; Yongqiang Zhu, College of Life Science, Nanjing Normal University, No. 1 Wenyuan Road, Qixia District, Nanjing, 210023, People’s Republic of China, Tel/Fax +86-25-85898184; +86-25-85891591, Email [email protected]; [email protected]
Introduction: Tumor hypoxia and invasion present significant challenges for the efficacy of photodynamic therapy (PDT) in triple-negative breast cancer (TNBC). This study developed a mitochondrial targeting strategy that combined PDT and gene therapy to promote each other and address the challenges.
Methods: The positively charged amphiphilic material triphenylphosphine-tocopherol polyethylene glycol succinate (TPP-TPGS, TPS) and the photosensitizer chloride e6 (Ce6) formed TPS@Ce6 nanoparticles (NPs) by hydrophobic interaction. They electrostatically condensed microRNA-34a (miR-34a) to form stable TPS@Ce6/miRNA NPs.
Results: Firstly, Ce6 disrupted the lysosomal membrane, followed by successful delivery of miR-34a by TPS@Ce6/miRNA NPs. Meanwhile, miR-34a reduced ROS depletion and further enhanced the effectiveness of PDT. Consequently, the mutual promotion between PDT and gene therapy led to enhanced anti-tumor effects. Furthermore, the TPS@Ce6/miRNA NPs promoted apoptosis by down-regulating Caspase-3 and inhibited tumor cell migration and invasion by down-regulating N-Cadherin. In addition, in vitro and in vivo experiments demonstrated that the TPS@Ce6/miRNA NPs achieved excellent anti-tumor effects. These findings highlighted the enhanced anticancer effects and reduced migration of tumor cells through the synergistic effects of PDT and gene therapy.
Conclusion: Taken together, the targeted co-delivery of Ce6 and miR-34a will facilitate the application of photodynamic and genic nanomedicine in the treatment of aggressive tumors, particularly TNBC.
Keywords: photodynamic therapy, gene therapy, hypoxia, invasion, mitochondrial target, triple-negative breast cancer
Graphical Abstract:

Introduction
Breast cancer remains the most prevalent solid tumor among women and ranks as the second leading cause of cancer-related death in women.1 Triple-negative breast cancer (TNBC) is particularly heterogeneous, accounting for about 10%-15% of diagnosed breast cancer cases, and is associated with a poor prognosis and aggressive behavior.2 Notably, some studies have indicated that breast cancer-related deaths often result from the metastasis of cancer cells to vital organs, with TNBC showing a higher propensity for brain and lung metastases.3–5 Given the aggressive nature and high incidence of TNBC, there arises an urgent need to develop novel therapeutic strategies specific to this subtype.6 Hence, the development of novel therapies for TNBC is of utmost importance.
Photodynamic therapy (PDT) is a promising treatment that utilizes non-toxic photosensitizers to transfer light energy to oxygen, resulting in the generation of reactive oxygen species (ROS) that can interact with biomolecules and induce cancer cell death.7 PDT offers advantages such as minimal invasiveness, and broad applicability.8,9 Furthermore, it has been suggested that PDT may inhibit the metastatic potential of cancer cells.10 Therefore, PDT holds the potential as a conservative treatment of early or refractory breast cancer.11 However, the presence of hypoxia in the tumor microenvironment can diminish the effectiveness of photodynamic therapy.12 Cancer cells surviving PDT under hypoxic conditions may exhibit increased malignancy and a higher likelihood of local recurrence, metastasis, and regeneration of solid tumors.12,13 Additionally, PDT is not suitable for patients with disseminated cancer, as current technology does not allow for proper whole-body irradiation.14 Given the limitations of conventional PDT modalities, ongoing efforts are focused on improving photodynamic therapy. Initial strategies involved the use of hyperbaric oxygen therapy.15 However, side effects such as hyperoxic epilepsy and barotrauma have hindered its clinical application.16 Subsequently, researchers explored the use of nanoplatforms to supply oxygen directly.17 Nevertheless, the high interstitial pressure within deep tumor tissues may impede the diffusion of nanomaterials or oxygen molecules, limiting the effectiveness of this approach.18 Other strategies aim to generate oxygen in situ.19–21 However, the above methods are highly dependent on the availability of H2O2 within the tumor, and the relatively low H2O2 concentration (50 mM) within the cell limits their ability to alleviate hypoxia in PDT.21,22 Therefore, inhibiting cellular respiration to conserve oxygen may be a more effective approach for enhancing PDT against hypoxic tumors compared to solely increasing oxygen supply.23
Recent research has highlighted that mitochondrial targeting is an effective strategy for alleviating hypoxia in PDT.24 Studies have shown that mitochondria-targeted photosensitizers exhibit improved photodynamic therapy effects under hypoxic conditions.25 Triphenylphosphine (TPP) has emerged as a common and extensively studied mitochondrial targeting group.26,27 While single mitochondrial-targeted photodynamic therapy is insufficient to completely eradicate or prevent the formation and recurrence of metastatic tumors.28 The concept of multifunctional nanomedicine has emerged as a way to integrate various treatment approaches and develop PDT-based combination therapies to address the limitations of PDT monotherapy.29 MicroRNA-34a(miR-34a), as a p53-induced tumor suppressor, plays a crucial role in the treatment of malignant tumors.30 Studies have demonstrated that miR-34a can inhibit the proliferation, invasion, and migration of tumor cells, increase apoptosis rates, and arrest cell cycle progression at the G0/G1 phase.31,32 Consequently, miR-34a has become a commonly used and effective method to inhibit tumor migration.33 For example, Xiongwei Deng utilized hyaluronic acid-chitosan nanoparticles to co-deliver miR-34a and doxorubicin for the treatment of TNBC.34 In addition to inhibiting tumor migration, microRNA-34a is also a potent glutathione scavenger. The 1O2 produced by photosensitizers may be consumed by the high concentration of GSH in cancer cells, which greatly reduces the effect of PDT and limits its clinical application. MicroRNA-34a can translocate to mitochondria, mediate the downstream apoptotic effect of tumor suppressor P53, and inhibit the antioxidant response element Nrf-2, leading to the consumption of glutathione level.35 However, the delivery of small nucleotides to tumor tissues remains an important challenge in RNA interference (RNAi).36 Prolonging their circulation time in the bloodstream to enhance tumor accumulation while protecting them from nuclease degradation is crucial for successful delivery.37 Additionally, addressing the issue of low cellular uptake efficiency due to the negative charge of these nucleotides is necessary.38
Herein, a multifunctional nano-drug delivery system was developed to target mitochondria and co-deliver the photosensitizer Ce6 and miR-34a for combating tumor hypoxia and migration. The delivery system utilized an amphiphilic mitochondrial targeting material called triphenylphosphine-tocopherol polyethylene glycol succinate (TPP-TPGS, TPS). Through hydrophobic interactions, the photosensitizer chloride e6 (Ce6) formed a complex with TPS, resulting in the formation of TPS@Ce6 nanoparticles (NPs). Furthermore, TPP-TPGS, being biocompatible and positively charged, electrostatically aggregated the negatively charged miR-34a to form TPS@Ce6/miRNA NPs. Subsequently, upon irradiation, ROS generated by PDT rapidly disrupted the lysosomal membrane through the photochemical internalization (PCI) effect.39,40 This process led to the escape of TPS@Ce6/miRNA NPs from the lysosome and their localization within the mitochondria. It can effectively inhibit mitochondrial respiration, improve tumor hypoxia, and enhance the efficacy of PDT. MicroRNA-34a, as a glutathione scavenger, reduced ROS depletion and further enhanced the effect of PDT, while helping to immobilize the tumor at the primary site, enabling favorable therapeutic effects of local phototherapy. As a result, the synergistic anti-tumor effects of miRNA treatment and PDT were achieved. This targeted approach, with its inhibitory effect on tumor migration, has the potential to advance the development and clinical application of photodynamic therapy cooperated with gene therapy for the treatment of hypoxic and migratory cancers.
Materials and Methods
5-carboxymethyl triphenylphosphine (TPP-COOH) and Tocopheryl polyethylene glycol succinate (TPGS) were purchased from Enocai Technology Co., Ltd (Beijing, China). Fetal bovine serum (FBS), Trypsin and Roswell Park Memorial Institute (RPMI)-1640 medium were obtained from SenBeiJia Biological Technology Co., Ltd (Nanjing, China). CCK-8 kit, antibodies, Reactive Oxygen Species Assay Kit, DAPI, DCFH-DA, Mito-Tracker Green and Lysosome-Tracker Green were purchased from Beyotime Biotechnology Co. Ltd (Shanghai, China). MiR-34a (sense strand:5’-UGG CAG UGU CUU AGC UGG UUG U- 3’) and other oligonucleotides were obtained from Shanghai GenePharma Co., Ltd (Shanghai, China). All chemicals and reagents were of analytical purity grade.
The Synthesis of Nanoparticles Using TPP-TPGS
The synthetic route of Triphenylphosphonium-tocopherol polyethylene glycol succinate (TPP-TPGS, TPS) was depicted in Figure S1. TPP-COOH was dissolved in sulfone chloride and refluxed at 80 °C for 3 h. The solvent was removed by using dichloromethane (DCM) rotary distillation and oil pump. The resulting product was dissolved in DCM, and the TPGS mixture was dropwise to it slowly. After the reaction was stirred at room temperature for 5 h, the DCM was removed by rotary evaporation to obtain the product. TPGS dissolved in DCM was added to the TPGS solution (TPP: TPGS =1:1), and a suitable amount of triethylamine (TEA) was injected. The final product was dissolved in distilled water and dialyzed (MWCO:1000 Da) for 3 days to remove the uncoupled reactants. Finally, the product was freeze-dried.
TPS@Ce6 NPs were prepared by oil-in-water (O/W) emulsified solvent evaporation method. Equal volumes of TPP-TPGS (6.4 mg/mL) aqueous solution and TPGS (2 mg/mL) aqueous solution were mixed to form the water phase (W). The oil phase (O) was Ce6 acetone solution (8 mg/mL). Subsequently, the oil phase was added dropwise to the aqueous phase according to different water-oil volume ratios and stirred for 2 h at room temperature. Finally, the acetone was removed by rotary evaporation, and the mixture was centrifuged at low temperature. The liquid supernatant was then lyophilized to obtain TPS@Ce6 NPs.
The miRNA solution (0.264 mg/mL) was prepared by dissolving miRNA in RNase-free water. The miRNA and TPS@Ce6 NPs solutions were preheated to 50 °C and mixed at different N/P ratios. The mixture was vortexed for 30s to obtain TPS@Ce6/miRNA NPs.
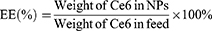
Characterization of Polymers and Nanoparticles
The 1H-NMR spectra of the polymer were obtained at room temperature using an NMR spectrometer (AVANCE 400, Germany) with DMSO as solvent. The concentration of Ce6 in TPS@Ce6 NPs was determined by visible ultraviolet spectrophotometer (UV-2450, Shimadzu Co., Japan), and the encapsulation efficiency (EE) and drug loading (DL) were calculated according to Eq. 1 and Eq. 2. To investigate the interaction forces acting on TPS@Ce6 NPs, UV-vis spectra were recorded with a UV-vis spectrophotometer. The morphology of TPS@Ce6 NPs and TPS@Ce6/miRNA NPs was observed by transmission electron microscopy (H7650, Hitachi, Japan). The particle size distribution and Zeta potential of TPS@Ce6 NPs and TPS@Ce6/miRNA NPs were determined by Zeta PALS high-resolution potential and particle size analyzer (Brookhaven, USA). To assess the miRNA condensation ability of TPS@Ce6 NPs and determine the optimal N:P, electrophoresis of TPS@Ce6/miRNA NPs on a 15% agarose gel was performed.
The Stability Analysis of TPS@Ce6/miRNA Nanoparticles
Naked miRNA and TPS@Ce6/ miRNA NPs incubated with no RNase were used as controls. Naked miRNA or TPS@Ce6/miRNA NPs were incubated with RNase (50 U/mL) at 37 °C for different times (0, 0.5, and 1 h). After the specified incubation time, 2% sodium dodecyl sulfate (SDS) was added to the samples. SDS was used to dissociate the nanoparticles and release the miRNA. The stability of TPS@Ce6/miRNA NPs was evaluated by performing agarose gel electrophoresis.
pH Sensitivity and pH-Triggered Drug Release in vitro
To check whether pH change affects the morphology of TPS@Ce6/miRNA NPs, changes in particle size at different pH values (5.5, 7.4, and 8.0) were measured. The effect of different pH values on Ce6 release from TPS@Ce6/miRNA NPs was investigated by in vitro drug release test. Phosphate buffers with pH values of 5.5, 7.4, and 8.0 were prepared, and then 0.1% (w/v) of Tween 80 was added. 30 mL of buffer solution was taken from each and placed in a 50 mL centrifuge tube. The above centrifuge tubes were placed in a constant temperature oscillating incubator at 37 °C and 100rpm. After stabilizing the buffer temperature, the dialysis tube (MWCO = 2000Da) containing 5.0 mL TPS@Ce6/miRNA NPs was placed into a 50 mL centrifuge tube. At the set time point, the release medium in the 1.0 mL centrifuge tube was respectively taken, while the buffer of the same volume, temperature, and pH was added. Repeat three times for each sample. After sampling, the concentration was determined using an ultraviolet spectrophotometer. Then, the release degree of each time point was calculated according to the release degree formula. Finally, the cumulative release curve was plotted by drawing software.
Cell Culture and Animals
Human breast cancer cell line MDA-MB-231 and human normal breast cell line MCF-10A were obtained from the National Centre for Cell Science. MDA-MB-231 cells were cultured in RPMI-1640 medium 10% fetal bovine serum (FBS) and maintained in a 5% CO2 humidified incubator at 37 °C. MCF-10A cells were cultured in GibcoDulbecco’s Modified Eagle Medium: F-12 (DMEM/F-12) 10% fetal bovine serum (FBS) and maintained in a 5% CO2 humidified incubator at 37 °C.
Female nude mice (Balb/c) were purchased from Shanghai Sipu-BiKAI Laboratory Animal Co., Ltd (Shanghai, China). The mice were housed in a controlled environment with a constant temperature of 26–28 °C and humidity ranging from 40% −60%. Sterile double distilled water and sterile chow were provided as food and water sources for the mice. The experiments were carried out in strict accordance with the regulations for the Management of experimental animals of Nanjing Normal University and with the Guide for the Care and Use of Laboratory Animals.
Cellular Uptake
Approximately 1×10⁵ MDA-MB-231 cells were seeded in each confocal dish (NEST Biotechnology Co., China). After 24 h of culture, cells were treated with Ce6, miRNA, or TPS@Ce6/miRNA NPs. The miRNA was labeled with a green fluorescent probe, enabling its visualization. The treatment duration was set at 2, 4, 6, and 12 h. After the specified treatment period, the cells were washed three times with phosphate-buffered saline (PBS). This step helps to remove any unbound or extracellularly located probes or NPs. Next, paraformaldehyde was added and fixed for 30 min, followed by washing three times with PBS. Finally, DAPI was added to the stain for 30 min and then washed thrice with PBS. To visualize and analyze the cellular uptake, intracellular fluorescence was detected using a laser confocal microscope (CLSM, Nikon, Japan). Fluorescence intensity was quantified using ImageJ software for Ce6 and TPS@Ce6/miRNA uptake fluorograms taken at different times in MDA-MB-231 cells.
Cytotoxicity in vitro
MDA-MB-231 cells were seeded in 96-well plates (NEST Biotechnology Co., China) at a volume of 100 μL containing 5×10³ cells per well. The cells were then cultured for 24 h. To assess the safety of TPS, different concentration gradients of TPS solutions were prepared. To evaluate the lethality of miR-34a on MDA-MB-231 cells, different concentrations of miR-34a solutions were prepared. To assess the cytotoxic effects of Ce6, TPS@Ce6 NPs, and TPS@Ce6/miRNA NPs on MDA-MB-231 cells, different concentration gradients of Ce6, TPS@Ce6 NPs, and TPS@Ce6/miRNA NPs solutions were prepared. Different nanoparticles were dissolved in DMSO, and Ce6 was fully released after the 10-minute ultrasound. The concentration of Ce6 in various dosage forms of nanoparticles was then detected by ultraviolet spectrophotometry. The wells of the 96-well plates were divided into two conditions: light and no light. Multiple Wells of each concentration were added to 96-well plates and incubated at 37 °C for 24 h. After the incubation period, CCK-8 (10 μL) solution was added to each well and incubated for 1 h. The absorbance of the wells was measured at 450 nm using a microplate reader (Bio-Rad model 680, Eppendorf Inc). The results obtained from the absorbance measurements were analyzed using GraphPad Prism software, for data processing, statistical analysis, and visualization. In addition, the cytotoxicity of free Ce6 and TPS@Ce6/miRNA nanoparticles on human breast epithelial cells (MCF-10A) was investigated by the same method.
Lysosomal Escape
Cells were cultured in confocal laser plates using the same procedure as described in the cell uptake experiments. In one group, MDA-MB-231 cells were cultured with Ce6, TPS@Ce6 NPs, and TPS@Ce6/miRNA NPs for 6 h and then exposed to infrared light for 10 min. While in the other group, cells were cultured with Ce6, TPS@Ce6 NPs, and TPS@Ce6/miRNA NPs for 6 h and then not exposed to light. This group serves as a control to compare the effect of light exposure on lysosomal escape. The cells were stained with Lyso-Tracker@Green for 30 min and washed again with PBS. After fixation with paraformaldehyde and DAPI staining, the fluorescence of MDA-MB-231 cells was observed by CLSM.
Mitochondria Target
MDA-MB-231 cells were cultured in laser confocal dishes. To assess mitochondrial targeting, MDA-MB-231 cells were incubated with Ce6, TPS@Ce6 NPs, and TPS@Ce6/miRNA NPs at 37 °C for 6 h. After the incubation period, the cells were irradiated with infrared light for 10 min. This light exposure may trigger the release or activation of the targeting moiety for mitochondria. The cells were washed with PBS to remove any unbound or extracellularly located probes or nanoparticles. Then the cells were stained with Mito-Tracker Green for 30 min and washed again with PBS. The subsequent steps, such as fixation with paraformaldehyde and DAPI staining, were performed as described in the lysosomal escape assay. The fluorescence of the cells, including the Mito-Tracker Green staining, was observed using a CLSM.
ROS Detection
MDA-MB-231 cells were incubated with Ce6 or TPS@Ce6/miRNA NPs at 37 °C. After 6 h, the cells were washed with PBS and then incubated with medium containing DCFH-DA for 1 h. DCFH-DA itself has no fluorescence, can freely cross the cell membrane, and after entering the cell, it can be hydrolyzed by intracellular esterase to produce 2’,7’-dichlorodihydrofluorescein (DCFH). Intracellular reactive oxygen species can oxidize non-fluorescent DCFH to produce fluorescent 2’,7’-dichlorofluorescein (DCF). Detection of DCF fluorescence can be used to know the level of ROS. After the incubation with DCFH-DA, the cells were irradiated with near-infrared (NIR) light for 10 min. After washing with PBS, ROS production was observed by CLSM.
Suppression of Invasion and Migration in vitro
For invasion assay, the mixture of Matrigel gel diluted in serum-free RPMI-1640 medium (serum-free medium: Matrigel=10:1, 100 μL) was prepared. The Matrigel mixture was added to the upper surface of the filter membrane of the upper chamber. Ensured that the entire surface was coated evenly. Incubated the chamber in a 37 °C incubator for 1 h and allowed the gel to solidify. Any uncoagulated liquid was carefully aspirated from the upper chamber using a pipetting gun. MDA-MB-231 cells were collected and counted from different groups: control group, miRNA group, Ce6 group, TPS@Ce6 NPs group, and TPS@Ce6/miRNA NPs group. Cell counting could be performed using trypan blue staining. MDA-MB-231 cells (2×10⁵/well) were seeded in the upper chamber. Medium containing 20% serum (500 μL) was added to the lower chamber. Gently placed the upper chamber into the lower chamber, ensuring that the cells in the upper chamber were not in direct contact with the medium in the lower chamber. After 48 h, carefully removed the upper chamber from the lower chamber. Gently wiped off the cells on the upper surface of the filter membrane that did not pass through the Matrigel layer using a cotton swab. The cells that have invaded through the Matrigel layer were fixed with paraformaldehyde for 20 min, washed once with PBS, stained with 0.1% crystal violet for 30 min, and washed three times with PBS. After air drying, 6–8 randomly selected fields were photographed under a fluorescence microscope. The number of cells was counted and averaged in the fields of view. This result provided an estimate of the invasion ability of the cells. The procedures for the migration assay were the same as those for the invasion assay, except that Matrigel was not added to the upper chamber. This experiment allowed for the assessment of cell migration without the barrier of the gel.
Analysis of Protein Level by Western Blotting
Radio Immunoprecipitation Assay (RIPA) lysis buffer was used to extract the total proteins of control group, miRNA group, Ce6 group, TPS@Ce6 NPs group, and TPS@Ce6/miRNA NPs group, respectively. The concentration of the extracted proteins was determined using the bicinchoninic acid (BCA) assay. Total proteins were then separated by sodium dodecyl sulfate-polyacrylamide gel electrophoresis (SDS-PAGE). Protein bands from SDS-PAGE gel were transferred to a polyvinylidene difluoride membrane (PVDFM). The resulting PVDFM was incubated with 10% nonfat milk at room temperature for 2 h. After blocking, the PVDFM was washed with Tris-buffered saline Tween 20 (TBST) solution to remove excess blocking solution and any unbound proteins. The PVDFM was then incubated with primary antibodies overnight at 4°C. After that, the PVDFM was washed with TBST solution to remove unbound antibodies. The PVDFM was then incubated with secondary antibodies conjugated with an enzyme, such as horseradish peroxidase (HRP), for an additional hour. The last step was that protein bands were visualized using chemiluminescence imaging instruments (Tanon-4600SF). The gray value of the protein bands in the images was analyzed using Excel and Graphpad Prism.
Analysis of MiR-34a Level by RT-qPCR
Total RNA was extracted from the cells of control group, miRNA group, Ce6 group, TPS@Ce6 NPs group, and TPS@Ce6/miRNA NPs group by TRIzolTM reagent. The concentration of the extracted RNA was detected by micro nucleic acid analyzer. The extracted RNA was then reverse transcribed into complementary DNA (cDNA) using the PrimeScriptTM RT reagent Kit. Amplification of the cDNA was carried out using RT-qPCR (reverse transcription qPCR) with specific primers for miR-34a and the reference gene β-actin. The primers for RT-qPCR analysis were as follows: miR-34a gene forward primer 5’-GGTGTGGGCTGGCAGTGTCTT −3’, miR-34a gene reverse primer 5’-CCAGTGCAGGGTCCGAGGTAT-3’, The β-actin gene forward primer was 5’-TGCGTGACATCAAAGAGAAG-3’, and the β-actin gene reverse primer was 5’- TCCATACCCAAGAAGGAAGG-3’. The amplification was monitored in real-time using a fluorescent dye, which emits a signal in proportion to the amount of amplified DNA. The relative quantitative values of miR-34a are calculated using the comparative ΔΔCt method.
Antitumor Study in vivo
To establish the TNBC solid tumor model, Balb/c mice (female, 5 weeks old) were injected with 1×10⁶ MDA-MB-231 cells subcutaneously into the axilla. Once the tumor volume reached about 100 mm3, the mice were randomly divided into 5 groups (n = 5): control group, miRNA group, Ce6 group, TPS@Ce6 NPs group, and TPS@Ce6/miRNA NPs group. Different samples were injected intravenously into the mice on days 1, 3, 5, 7, 9, 10, 11, 13, 17 and 19. The equivalent RNA dose administered was 1.65 mg/kg, and the equivalent Ce6 dose was 2.5 mg/kg. The day after the injections (on days 2, 4, 6, 8, 10, 12, 14, 16, and 18), the tumor sites were subjected to laser irradiation at a wavelength of 660 nm for a duration of 10 min. Tumor volume was measured every other day. On day 21, the mice were dissected, and various tissues including the heart, liver, spleen, lung, kidney, and tumor tissues were collected. The collected tissues were weighed and photographed for further analysis. The tumor tissues were subjected to hematoxylin and eosin (H&E) staining, which provides information about the tissue morphology and composition. Additionally, the tumor tissues were stained using the TUNEL assay (Terminal deoxynucleotidyl transferase dUTP Nick-End Labeling) to detect apoptotic cells. Protein expression of apoptosis and migration-related proteins in the tumor tissues was analyzed using Western blotting.
Fluorescence Imaging ex vivo
In vivo, MDA-MB-231 tumor models were constructed as described above. Tumor-bearing mice were injected intravenously with Ce6 or TPS@Ce6/miRNA NPs. The mice were sacrificed after 6 h, and the tumors and major organs (such as the heart, liver, spleen, lung, and kidney) were harvested for ex vivo imaging.
Biosafety Evaluation
On day 21 of the experiment, prior to dissection, blood samples were collected from the eyeballs of three mice. The collected blood samples were subjected to routine blood and blood biochemical analysis. Major organs (heart, liver, spleen, lung, and kidney) were collected for H&E staining analysis.
Statistical Analysis
All acquired data were shown as mean ± SD (standard deviation). The statistical significance was analyzed using one-way analysis of variance (ANOVA); *P < 0.05, **P < 0.01, ***P < 0.001, and ****P < 0.0001 were deemed statistically significant in all analyses. GraphPad Software 8.lnk was used for data analysis and graph plotting.
Results and Discussion
A nanocarrier, TPP-TPGS (TPS), was synthesized. Figure S1 illustrated the primary components and preparation process. The structure of TPP-TPGS was verified using 1H NMR spectroscopy. As depicted in Figure S2, the primary peak observed at 0.83 ppm represents the characteristic peak of the TPGS, signifying the methyl chain structure that we label as A. On the other hand, the primary peak observed at 7.74 ppm corresponds to the characteristic peak of the TPP-COOH, denoting the benzene ring structure that we label as B. From the figure, it is evident that the product of synthesis also exhibits primary peaks at 0.83 ppm and 7.74 ppm, representing characteristic peaks A and B. The 1H NMR results of the TPP-TPGS revealed the characteristic chemical shifts of the two raw compounds, confirming the successful synthesis of the TPS functional material. In addition, we quantified the integral areas of peaks A and B of the TPP-TPGS, revealing a grafting rate of about 26.7% for TPP in the TPP-TPGS. TPS@Ce6 NPs were prepared using the oil-in-water (O/W) emulsified solvent evaporation method. The particle sizes and zeta potentials of TPS@Ce6 NPs were measured by dynamic light scattering at different water-oil ratios. Ce6 could be loaded into TPS micelles at a carrier/drug water-oil ratio as low as 10/1, and when the ratio reached approximately 20/1, the cationic TPS@Ce6 NPs exhibited suitable size and uniformity (Table S1). To investigate the molecular interactions, UV-visible spectroscopy was performed on Ce6 and TPS@Ce6 NPs under various conditions. As displayed in Figure 1a, the characteristic peaks of TPS@Ce6 NPs in water exhibited significant shifts compared to dispersed Ce6. However, the peak of positions of TPS@Ce6 NPs could be restored upon dissolution in dimethyl sulfoxide, suggesting the disassembly of the nano-drug was due to the disruption of intermolecular interactions. Furthermore, this peak of TPS@Ce6 NPs varied with the addition of hydrophobic sodium dodecyl sulfate, indicating the involvement of hydrophobic interactions in the self-assembly process (Figure 1c). Additionally, the absorption slightly decreased with the increase of NaCl addition (Figure 1b). It showed that electrostatic interactions and hydrogen bonding interaction were not the main forces for the assembly of TPS@Ce6 NPs. To summarize, the self-assembly driving force of TPS@Ce6 NPs might be ascribed to the hydrophobic interactions.
 |
Figure 1 Preparation and characterization of the nanoparticles for co-delivery of miR-34a and Ce6. UV−vis absorbance spectrum of TPS@Ce6 NPs or Ce6 in the presence or absence of (a) DMSO, (b) NaCl, and (c) SDS (0.2%, w/v). (d) Protection of miRNA in TPS@Ce6/miRNA NPs against the digestion by RNase. (e) TEM images of TPS@Ce6 NPs with and without co-loaded miRNA. Scale bar, 500 nm. |
The TPS@Ce6/miRNA NPs were prepared at different nitrogen/phosphate (N/P) ratios. Then the particle size and zeta potential were measured (Figure S3). As the N/P ratio increased, the diameter of the nanoparticles showed a decreasing trend, and the zeta potential changed from negative to positive, gradually increasing. These results indicated that TPS@Ce6 NPs and miR-34a could electrostatically interact to form compact nanoparticles. The TPS@Ce6/miRNA NPs obtained at an N/P ratio of 5/1 had a diameter of 168 nm, which was smaller than the micelles at other N/P ratios, suggesting that N/P of 5/1 was close to the optimal condition, where miRNA wrapped around and stabilized the micelles. Gel retardation assay (Figure S4) showed that the bright band of miRNA gradually weakened with the increase of N/P, and the migration of miRNA in agarose gel was completely inhibited at N/P ratios of 5 or higher. Gel retardation assay provided evidence that miRNA was effectively incorporated into micelles at N/P ratios of 5 or higher, thus forming compact TPS@Ce6/miRNA NPs. Additionally, the stability of TPS@Ce6/miRNA NPs in the aqueous phase was assessed, and no significant changes in mean size and polydispersity index (PDI) were observed over a period of one week (Figure S5a). This result indicated that the TPS@Ce6/miRNA NPs exhibited considerable stability in the aqueous phase, which was important for their biomedical applications. Meanwhile, miRNA loaded into TPS@Ce6 NPs was protected from degradation by ribonuclease (RNase) (Figure 1d), which suggested miRNA was effectively protected and had the potential to be used for injection therapy. The morphology of TPS@Ce6 NPs, with or without loaded miRNA at an N/P ratio of 5/1, was examined by transmission electronic microscopy (TEM). The TEM images revealed that the nanoparticles had a spherical shape and exhibited relatively uniform diameters in both cases (Figure 1e). It demonstrated the successful formation of spherical nanoparticles with consistent morphology, which was important for their stability and function in biomedical applications.
To investigate whether the morphology of TPS@Ce6/miRNA NPs was affected by PH, we measured the changes in particle size of TPS@Ce6/miRNA NPs by varying the pH value. The size of TPS@Ce6/miRNA NPs was 160nm at pH 7.4. When the pH value was adjusted from 7.4 to 5.0, the particle size decreased to 125nm, while when the pH value was adjusted from 7.4 to 8, the particle size decreased by 70nm (Figure S5b). This is because RNA is more stable in acidic environments, while it is easily degraded in alkaline environments. When pH changed to 8, the adsorbed miRNA in the outer layer of TPS@Ce6/miRNA NPs was degraded, and the particle size of the nanoparticles was about 70nm, which was exactly the same as that of TPS@Ce6, as shown in Table S1.
Next, we measured the Ce6 release rate of TPS@Ce6/miRNA NPs at a range of pH values in vitro. As shown in Figure S5c, the TPS@Ce6/miRNA NPs exhibited rapid release behavior in buffer media that mimicked mitochondrial pH of approximately 8.0, with 80% of Ce6 released within 24 hours. However, TPS@Ce6/miRNA NPs showed slow sustained release at pH 5.0 and 7.4, with only 17% and 24% drug release rates at 24 hours, respectively. These results suggest that TPS@Ce6/miRNA NPs can respond appropriately to the weakly alkaline environment of tumor cell mitochondria, minimizing premature drug leakage into the cytoplasm and lysosomes, and promoting rapid drug release into cellular mitochondria.
Cell viability of MDA-MB-231 cells was shown after incubation with different concentrations of TPS in Figure 2a. It was observed that TPS had no significant cytotoxic effect on the cells at concentrations up to 100 µg/mL, indicating that TPS was relatively safe as a nanomaterial. Figure 2b illustrated the effect of different concentrations of miR-34a on cell viability. It was found that the cell survival rate gradually decreased with increasing miR-34a concentration, indicating that miR-34a had a certain killing effect on MDA-MB-231 cells. These findings were consistent with well-designed cohort studies that identified miR-34a as a promising non-invasive biomarker for the diagnosis of breast cancer, highlighting its valuable diagnostic value in clinical practice.41 To assess the cytotoxicity of TPS@Ce6/miRNA NPs in combination with near-infrared (NIR) irradiation, MDA-MB-231 cells were treated with drugs containing different Ce6 content with or without NIR irradiation (Figure 2c). Under NIR irradiation, the viabilities of cells in Ce6, TPS@Ce6 NPs, and TPS@Ce6/miRNA NPs groups decreased with the increase of Ce6 concentration. It was worth noting that when Ce6 concentration is 5 µg/mL, cells treated with TPS@Ce6/miRNA NPs in the absence of NIR irradiation still exhibited lower cytotoxicity, whereas the cell viability of cells treated with TPS@Ce6/miRNA NPs in the presence of NIR irradiation was already below 50%. This result indicated that the antitumor activity of TPS@Ce6/miRNA NPs alone was limited. Besides, the cell survival rate of TPS@Ce6/miRNA NPs + L (with NIR irradiation) treatment group was lower than that of TPS@Ce6 NPs + L treatment group at 5 µg/mL Ce6. This observation suggested that the combination of miR-34a and Ce6 synergistically enhanced the antitumor effect. Then, we chose human normal breast cell line MCF-10A to check TPS@Ce6/miRNA NPs health risk (Figure S6). As shown in the figure, MDA-MB-231 cells were more sensitive to the photosensitizer Ce6 than MCF-10A cells under light conditions. When the concentration of Ce6 was greater than or equal to 5 µg/mL, TPS@Ce6/miRNA NPs had a significantly higher killing effect on MDA-MB-231 cells than MCF-10A cells, indicating that TPS@Ce6/miRNAs had a strong killing effect on breast cancer cells, and had less toxic and side effects on normal cells. Overall, these in vitro cytotoxicity results demonstrated the safety of TPS, the cytotoxic effect of miR-34a, and the enhanced antitumor activity of TPS@Ce6/miRNA NPs in combination with NIR irradiation.
 |
Figure 2 Cytotoxicity, cellular uptake, and targeted drug delivery in vitro. Cell viability of MDA-MB-231 cells incubated with gradient concentrations of (a) TPS, (b) miRNA, (c) Ce6, TPS@Ce6 NPs, and TPS@Ce6/miRNA NPs with or without NIR irradiation. (mean ± SD, n = 3). The red dashed lines represent a survival rate of MDA-MB-231 cells of 100%, below which the growth of MDA-MB-231 cells is inhibited, and above which the growth of MDA-MB-231 cells is promoted. (d) Confocal laser scanning microscopy (CLSM) images analysis of MDA-MB-231 cellular uptake behaviors after incubation with Ce6, miRNA, and TPS@Ce6/miRNA for 2, 4, 6, or 12 h. Nuclei were stained with DAPI, and miRNA was labeled with a green fluorescent probe. Scale bar: 10 µm. (e) CLSM analyses of MDA-MB-231 lysosomal escape behaviors after incubation with Ce6, TPS@Ce6 NPs, and TPS@Ce6/miRNA with/without NIR irradiation. Lysosomes and nuclei were stained with Lyso-Tracker@ Green and DAPI, respectively. Scale bar, 10 µm. (f) CLSM analyses of MDA-MB-231 mitochondrial targeted behaviors after incubation with Ce6, TPS@Ce6 NPs, and TPS@Ce6/miRNA with NIR irradiation. Mitochondria and nuclei were stained with Mito-Tracker@ Green and DAPI, respectively. Scale bar, 10 µm. |
The uptake behavior of Ce6, miRNA, and TPS@Ce6/miRNA NPs was assessed using confocal laser scanning microscopy (CLSM) based on the fluorescence intensity of Ce6 and miRNA. As shown in Figure 2d, the fluorescence of the free Ce6 group and miRNA group disappeared at 12 h, while TPS@Ce6/miRNA NPs still showed fluorescence, indicating that the nanoparticles protected miRNA and Ce6 during delivery and prolonged the time of drug metabolism in cells and cellular internalization was improved after self-assembly of Ce6 and miRNA into TPS@Ce6/miRNA NPs. More importantly, at 6 h, TPS@Ce6/miRNA clearly began to be taken up by cells, and TPS@Ce6/miRNA took up the most and was higher than free drugs. This was consistent with the fluorescence intensity quantification of the Ce6 group and TPS@Ce6/miRNA group at different times using ImageJ software (Figure S7). These results indicate that TPS@Ce6/miRNA can be efficiently uptaken by cells.
The lysosomal escape of TPS@Ce6/miRNA NPs after cellular uptake was investigated. As displayed in Figure 2e, the internalized Ce6, TPS@Ce6 NPs, TPS@Ce6/miRNA NPs without NIR illumination could well overlap with Lyso-Tracker@Green after 6 h, indicating their presence in lysosomes. However, Ce6, TPS@Ce6 NPs, and TPS@Ce6/miRNA NPs with NIR irradiation obviously weakened the green fluorescence of lysosomes after 6 h. These results indicated that NIR light irradiation played a key role in the efficient escape of Ce6, TPS@Ce6 NPs, and TPS@Ce6/miRNA NPs from lysosomes. The escape of NPs from lysosomes may be because ROS produced by Ce6 after NIR irradiation rapidly broke through the lysosomal membrane through the photochemical internalization (PCI) effect. Kessel found the targeting of lysosomes with PDT may result in punching holes in the lysosomal membrane and eliminating the potentially protective cellular pathway,42 which was consistent with our results.
To investigate whether the nanoparticles could precisely target the oxygen-rich mitochondrial regions, CLSM analyses were performed on MDA-MB-231 cells incubated with Ce6, TPS@Ce6 NPs, and TPS@Ce6/miRNA NPs under NIR illumination and labeled with Mito-Tracker Green. Figure 2f showed that the red fluorescence of Ce6 in TPS@Ce6 NPs, and TPS@Ce6/miRNA NPs highly overlaps with the green fluorescence of mitochondria, and the fluorescence was strong, while the overlapping fluorescence intensity of Ce6 alone was weak, suggesting that TPS facilitates the delivery of the drug to mitochondria.
In summary, the TPS@Ce6/miRNA NPs promoted cellular uptake, successfully escaped lysosomes and targeted mitochondria, highlighting their potential for effective drug delivery and targeted therapy.
The apoptosis of MDA-MB-231 cells treated with different drugs was evaluated at the protein level. As shown in Figure 3a, the expression of the anti-apoptotic protein Bcl-XL significantly reduced in MDA-MB-231 cells treated with TPS@Ce6/miRNA NPs, while the expression of both the pro-apoptotic proteins P53 and Caspase-3CL significantly increased. These results indicated that TPS@Ce6/miRNA NPs promoted the apoptosis of MDA-MB-231 cells by down-regulating Bcl-XL and up-regulating P53 and Caspase-3XL.
 |
Figure 3 Apoptosis, ROS production, and migration in vitro. (a) Western blotting analysis of Caspase-3CL, P53, and Bcl-XL exposure in MDA-MB-231 cells after various treatments and relative levels of proteins evaluated by integrated optical density (IOD) from Western blotting. (means ± SD, n = 3). *p < 0.05 and **p < 0.01. (b) Intracellular ROS measurement of MDA-MB-231 cells by CLSM after treatment with different drugs in the light, and quantitative mean fluorescence intensity (MFI) analyses. Scale bar: 10 µm. (mean ± SD, n = 3). *p < 0.05, **p < 0.01. (c) RT-qPCR analysis of miR-34a expression in MDA-MB-231 cells following various treatments. (means ± SD, n = 3), ****p < 0.0001. (d) Transwell migration and invasion assay cell images, (e) corresponding average cell number for MDA-MB-231 cells. Scale bar, 100 µm. The average cell number was counted in 3 randomly selected different fields, (means ± SD, n = 3). **p < 0.01. (f) Western blotting analyses of N-Cadherin protein in the MDA-MB-231 cells receiving different treatments, corresponding average relative levels of proteins evaluated by IOD. (mean ± SD, n = 3). ****p < 0.0001. |
Next, the generation of reactive oxygen species (ROS) was investigated by CLSM with 2′, 7′-dichlorofluorescein diacetate (DCFH-DA) as the probe (Figure 3b). In the presence of NIR irradiation, the TPS@Ce6/miRNA NPs group showed a larger and stronger green fluorescence region than the free Ce6 group. This result indicated that the targeted delivery of TPS@Ce6/miRNA NPs to the mitochondria enhanced ROS accumulation. This might be because, on the one hand, Ce6 destroyed mitochondria and reduced oxygen consumption. On the other hand, microRNA-34a scavenged glutathione to reduce ROS depletion. It showed the advantages of the synergistic effect of photodynamic therapy and gene therapy.
Among all the groups, TPS@Ce6/miRNA NPs demonstrated the strongest ability to induce apoptotic protein expression and had the highest ROS content. Both apoptotic protein expression and ROS accumulation could induce apoptosis, highlighting the potent apoptotic effect of TPS@Ce6/miRNA NPs. These findings were consistent with the results of the cell survival assay, indicating that TPS@Ce6/miRNA NPs, in combination with miR-34a and PDT, synergistically promoted tumor cell apoptosis.
MiR-34a can inhibit the proliferation, invasion, and migration of tumor cells. The actual expression of miR-34a in cells was detected. As shown in Figure 3c, the TPS@Ce6 group showed higher miR-34a expression than both Ce6 alone and miR-34a alone. This result might be due to the destruction of the oxygen-consuming organelle mitochondria by TPS@Ce6, which alleviated hypoxia and then upregulated miR-34a. It has been reported that miR-34a promotes mitochondrial dysfunction to induce apoptosis by targeting Notch2.43,44 However, the upregulation of miRNA expression by disrupting mitochondria has not yet been seen, and it is worth further research. Notably, the TPS@Ce6/miRNA NPs group showed the highest expression of miR-34a among all groups and was much higher than that of free Ce6 and free miR-34a alone superimposed. This result indicated that TPS@Ce6/miRNA NPs had a protective effect on miRNA, and TPS@Ce6 has a synergistic effect with miRNA to further increase the actual expression of miR-34a in cells.
To explore whether miR-34a carried by TPS@Ce6/miRNA NPs could affect the migration and invasion of MDA-MB-231 cells. Transwell assay was further performed. Figure 3d showed that the number of cells stained with crystal violet in the visual field of TPS@Ce6/miRNA NPs group was less than that of other groups, which was consistent with the counting results (Figure 3e). These results suggested that TPS@Ce6/miRNA NPs had a strong ability to inhibit the migration and invasion of MDA-MB-231 cells. To further understand the potential mechanism of TPS@Ce6/miRNA nanoparticles in inhibiting the migration and invasion ability of MDA-MB-231 cells, the migration and invasion related protein was detected by Western blotting. As shown in Figure 3f, the expression of N-Cadherin protein in MDA-MB-231 cells incubated with TPS@Ce6/miRNA NPs was significantly reduced, indicating that TPS@Ce6/miRNA NPs may inhibit MDA-MB-231 cell migration and invasion by down-regulating N-Cadherin expression. Notably, the expression levels of N-Cadherin in the TPS@Ce6 NPs and miRNA groups were similar and both were higher than that in the TPS@Ce6/miRNA NPs group, indicating that Ce6 and miRNA of TPS@Ce6/miRNA NPs may play a synergistic role in inhibiting migration and invasion. Taken together, these findings indicated that miR-34a carried by TPS@Ce6/miRNA NPs suppressed the aggressiveness and migration of MDA-MB-231 cells through the down-regulation of N-Cadherin expression.
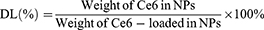
To evaluate the in vivo anticancer activity of TPS@Ce6/miRNA NPs, MDA-MB-231 tumor-bearing nude mice were intravenously injected with free miR-34a, Ce6, TPS@Ce6 NPs or TPS@Ce6/miRNA NPs at equivalent RNA and Ce6 doses. The tumor site was then treated under 660 nm laser irradiation at the day after the injection (Figure 4a), and the mice untreated with the injection were used as control. The tumor volume and body weight of mice were measured at every injection to monitor the treatment response.
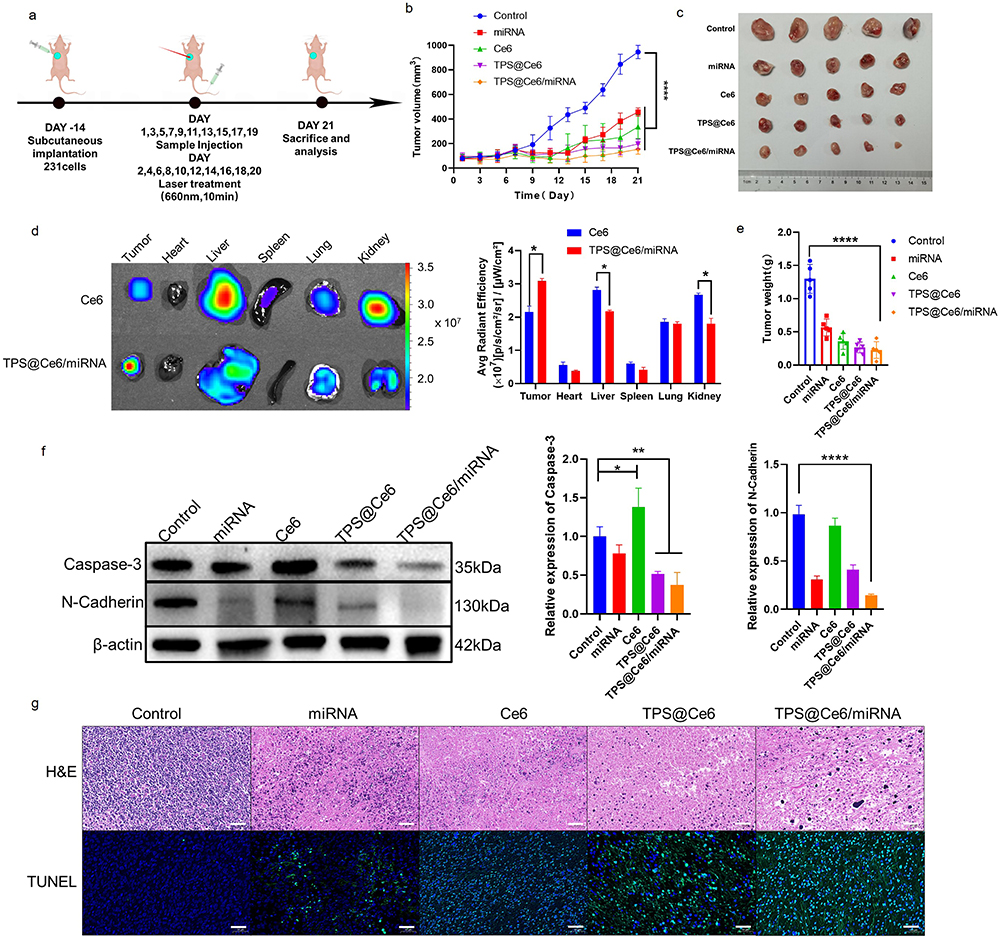 |
Figure 4 In vivo anticancer activity. (a) Establishment of the MDA-MB-231 orthotopic tumor model and treatment strategy. (b) Tumor growth curves of different groups (means ± SD, n = 5), ****p < 0.0001. (c) Sacrificed MDA-MB-231 tumor tissues. (n = 5) (d) Ex vivo fluorescence imaging and fluorescence intensity analyses of major organs and tumors excised after injection of Ce6 and TPS@Ce6/miRNA NPs. (means ± SD, n = 3), *p < 0.05. (e) Tumor weight on day 21 (means ± SD, n = 5), ****p < 0.0001. (f) Western blotting analysis of Caspase-3 and N-Cadherin protein expression in tumor tissues and relative levels of corresponding proteins evaluated by IOD. (mean ± SD, n = 3), *p < 0.05, **p < 0.01, ****p < 0.0001. (g) Representative images of H&E staining and TUNEL staining of collected tumors. Scale bar, 50 µm. |
To compare the distribution of Ce6 and TPS@Ce6/miRNA NPs in vivo, near-infrared fluorescence (NIRF) imaging technology was used. Ex vivo NIRF imaging of organs and tumors (Figure 4d) showed that fluorescence at tumor sites caused by the injection of TPS@Ce6/miRNA NPs was significantly higher than that caused by the injection of Ce6, whereas fluorescence at liver and kidney sites caused by the injection of TPS@Ce6/miRNA NPs was significantly lower than that at liver and kidney sites caused by the injection of Ce6. These findings implied that TPS@Ce6/miRNA NPs accumulated more efficiently in tumors.
As shown in Figure 4b and c, the tumor volume of mice treated with different drugs was smaller than that of the control group. The tumor growth of the TPS@Ce6/miRNA group was significantly inhibited, and the average tumor volume was only 154 mm3 on day 21, which increased by 1.95 times. In the control group, the tumor grew faster, and the tumor volume reached 945 mm3 (an increase of 11.98 times). In addition, the miRNA group showed a weaker anti-tumor effect, with a 5.79-fold increase in tumor volume, probably due to the easy degradation of free miRNA by enzymes. The free Ce6 and TPS@Ce6 groups increased 4.27-fold and 2.50-fold, respectively. The ability of mild tumor inhibition was demonstrated. At the end of the experiment, the anatomical tumors were weighted, showing a similar trend with the results of tumor volume (Figure 4e). Mice injected with TPS@Ce6/miRNA NPs had the smallest tumor volume and the lightest average tumor weight. These results indicated TPS@Ce6/miRNA NPs had the best anti-tumor effect. The reason may be that TPS targets Ce6 to mitochondria, which can effectively inhibit respiration and enhance the efficacy of PDT. At the same time, the successful delivery of miR-34a, and the upregulation of miR-34a help to immobilize the tumor in the primary site, resulting in a good therapeutic effect of local phototherapy. Therefore, miRNA therapy and PDT have synergistic anti-tumor effects.
As presented in Figure 4g, the tumor tissues were stained for histological examination. Hematoxylin-eosin (H&E) staining showed that the cell density of tumor tissues in the TPS@Ce6/miRNA NPs group was the lowest, with a large number of cells with loose cytoplasm and incomplete nuclei, indicating significant damage to the tumor tissue. Furthermore, TUNEL staining showed that the TPS@Ce6/miRNA NPs group had the highest number of cells labeled with a green fluorescent probe, indicating increased apoptosis in tumor cells.
At the protein level, the expression of apoptosis-related protein Caspase-3 and migration-related protein N-Cadherin was significantly decreased in tumor tissues injected with TPS@Ce6/miRNA NPs (Figure 4f). These findings confirmed that TPS@Ce6/miRNA NPs promoted apoptosis by down-regulating Caspase-3 and inhibited tumor cell migration and invasion by down-regulating N-Cadherin, consistent with the in vitro results. In conclusion, the combination of photodynamic therapy and gene therapy using TPS@Ce6/miRNA NPs exerted a maximum antitumor effect in the experimental model.
The biosafety of TPS@Ce6/miRNA NPs was evaluated in vivo. Mice were weighed after each drug injection, and their body weights remained stable throughout the treatment period (Figure 5a). This result indicated that the side effects of the drug were relatively small and did not significantly affect the overall health of the mice. In addition, blood biochemical analysis of blood samples was performed at the end of treatment. Mice injected with TPS@Ce6/miRNA NPs showed no significant abnormalities in biochemical indicators: aspartate aminotransferase (AST), blood urea nitrogen (BUN), alanine aminotransferase (ALT) and uric acid (UA) (Figure 5b). These results indicated that TPS@Ce6/miRNA NPs did not cause liver and kidney dysfunction in mice. In contrast, the blood biochemical results of the mice injected with Ce6 were higher levels of these biochemical indicators, indicating that the liver and kidney functions of the mice were impaired by free Ce6. This observation was consistent with the results of ex vivo fluorescence imaging (Figure 4d). In addition, the blood routine analysis in Figure S8 showed that the main hematological parameters of the mice treated with TPS@Ce6/miRNA NPs were not significantly different from those of the control group, which verified good blood compatibility. In addition, H&E staining of major organs was performed (Figure 5c), and no abnormal histology was observed in the heart, liver, spleen, lung, and kidney of mice in the TPS@Ce6/miRNA NPs group, confirming minimal systemic toxicity of the therapeutic agent to normal tissues. Overall, TPS@Ce6/miRNA NPs effectively inhibited tumor growth with fewer side effects. These findings suggested that TPS@Ce6/miRNA NPs had favorable biosafety profiles, making them a promising candidate for further development as a therapeutic agent.
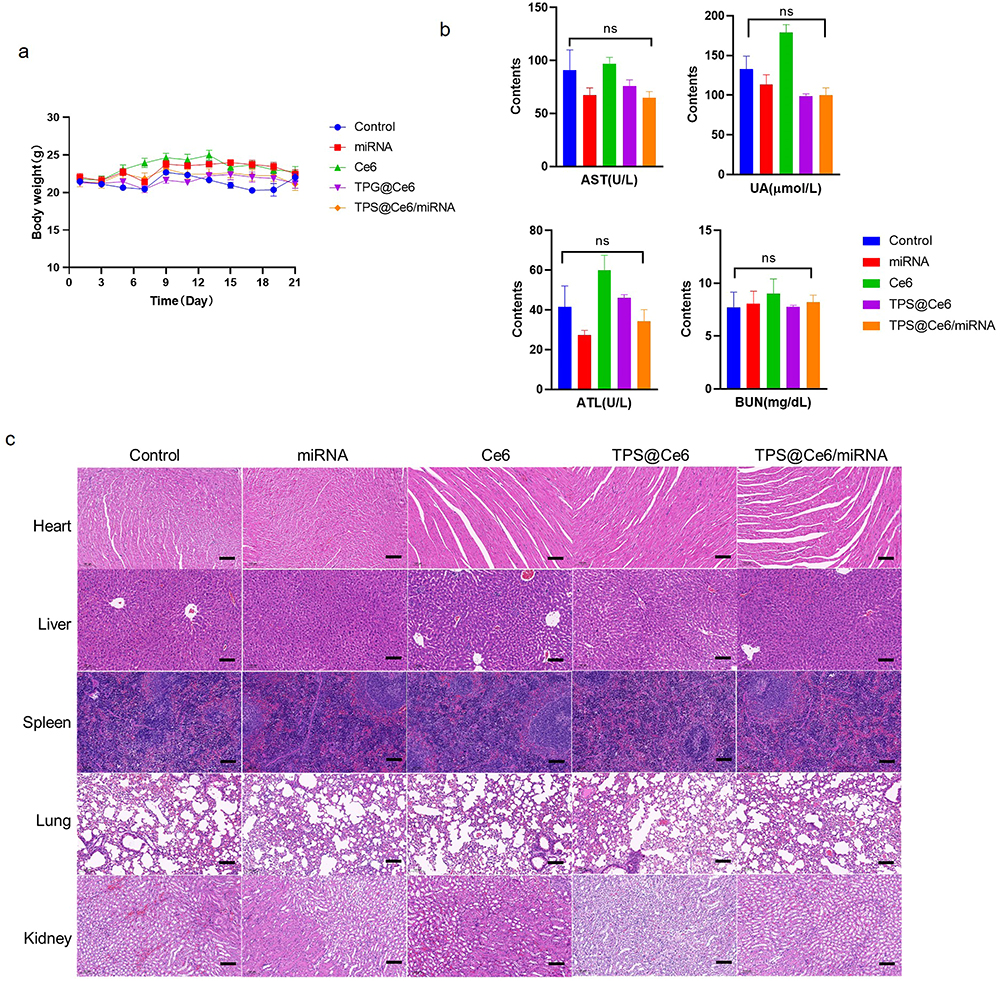 |
Figure 5 Biosafety analysis of TPS@Ce6/miRNA in vivo. (a) Body weight fluctuations of the mice after treatment with injection of different drugs in the presence of light in 21 days (means ± SD, n = 5). (b) Blood biochemical analysis of AST, BUN, ALT, and UA after treatment with injection of different drugs in the presence of light on the 21st day (means ± SD, n = 3), ns indicates no significant difference. (c) H&E staining analysis of heart, liver, spleen, lung, and kidney tissues. Scale bar: 100 µm. |
Conclusion
In conclusion, our study successfully developed TPS@Ce6/miRNA NPs, a multifunctional nanoparticle system capable of delivering both Ce6 photosensitizer and miR-34a tumor-inhibiting gene. These nanoparticles exhibited excellent stability and dispersibility through hydrophobic and electrostatic interactions. Furthermore, characterization revealed that TPS@Ce6/miRNA NPs had globular particles with smooth surfaces.
TPS@Ce6/miRNA NPs were found to promote cellular uptake, successfully escape lysosomes, and target mitochondria, demonstrating their potential as an efficient drug delivery system. Moreover, these nanoparticles facilitated the delivery of miR-34a, enhancing the effect of photodynamic therapy and successfully inhibiting tumor metastasis. The combination of PDT and miR-34a delivery resulted in significant inhibition of tumor growth while minimizing side effects on normal tissues.
Our findings highlight the mutual promotion effect between PDT and gene therapy, which greatly enhances the ability to address hypoxia and migration in TNBC. This study contributes to the synergistic effects of photodynamic and gene therapy in the treatment of aggressive tumors. In addition, it provides a promising approach to the treatment of TNBC.
Moving forward, future research should focus on optimizing nanoparticle design and exploring the potential of incorporating other therapeutic agents to further enhance therapeutic efficacy. In addition, preclinical and clinical studies are warranted to evaluate the translational potential of this nanoparticle system for TNBC treatment.
Abbreviations
AST, aspartate aminotransferase; BUN, blood urea nitrogen; ALT, alanine aminotransferase; UA, uric acid; H&E, Hematoxylin-eosin; NIRF, near-infrared fluorescence; ROS, reactive oxygen species; DCFH-DA, 2’,7’-dichlorofluorescin diacetate; PCI, photochemical internalization effect; CLSM, confocal laser scanning microscopy; + L, with NIR irradiation; NIR, near-infrared irradiation; TEM, transmission electronic microscopy; RNase, ribonuclease; PDI, polydispersity index; N/P, nitrogen/phosphate ratios; O/W, oil-in-water; TPGS, tocopheryl polyethylene glycol succinate; TPP, triphenylphosphine; SD, standard deviation; RT-qPCR, reverse transcription qPCR; HRP, horseradish peroxidase; TBST, Tris-buffered saline Tween 20; BCA, bicinchoninic acid; SDS-PAGE, sodium dodecyl sulfate-polyacrylamide gel electrophoresis; PVDFM, polyvinylidene difluoride membrane; DCFH, 2’,7’-dichlorodihydrofluorescein; DCF, 2’,7’-dichlorofluorescein; PBS, phosphate-buffered saline. FBS, fetal bovine serum; SDS,2% sodium dodecyl sulfate; EE, encapsulation efficiency; DL, drug loading; miR-34a, MicroRNA-34a; RNAi, RNA interference; Ce6, chloride e6; NPs, nanoparticles; TPP-COOH, 5-carboxymethyl triphenylphosphine; TPGS, Tocopheryl polyethylene glycol succinate; MCF-10A, Michigan Cancer Foundation-10A.
Acknowledgments
This research did not receive any specific grant from funding agencies in the public, commercial, or not-for-profit sectors.
Disclosure
The authors report no conflicts of interest in this work.
References
1. Singh H. Role of molecular targeted therapeutic drugs in treatment of breast cancer: a review article. Glob Med Genet. 2023;10(02):79–86. doi:10.1055/s-0043-57247
2. Dawson SJ, Provenzano E, Caldas C. Triple negative breast cancers: clinical and prognostic implications. Eur J Cancer. 2009;45(1):27–40. doi:10.1016/s0959-8049(09)70013-9
3. Lebert JM, Lester R, Powell E, Seal M, McCarthy J. Advances in the systemic treatment of triple-negative breast cancer. Curr Oncol. 2018;25(11):142–150. doi:10.3747/co.25.3954
4. Witzel I, Oliveira-Ferrer L, Pantel K, Müller V, Wikman H. Breast cancer brain metastases: biology and new clinical perspectives. Breast Cancer Res. 2016;18(1):8. doi:10.1186/s13058-015-0665-1
5. Gobbini E, Ezzalfani M, Dieras V, et al. Time trends of overall survival among metastatic breast cancer patients in the real-life ESME cohort. Eur J Cancer. 2018;96:17–24. doi:10.1016/j.ejca.2018.03.015
6. Abramson VG, Lehmann BD, Ballinger TJ, Pietenpol JA. Subtyping of triple-negative breast cancer: implications for therapy. Cancer. 2015;121(1):8–16. doi:10.1002/cncr.28914
7. Dougherty TJ, Gomer CJ, Henderson BW, et al. Photodynamic therapy. J National Cancer Inst. 1998;90(12):889–905. doi:10.1093/jnci/90.12.889
8. Yu Y, Wang N, Wang YY, et al. Photodynamic therapy combined with systemic chemotherapy for unresectable extrahepatic cholangiocarcinoma: a systematic review and meta-analysis. Photodiagnosis Photodyn Ther. 2023:41. doi:10.1016/j.pdpdt.2023.103318.
9. Overchuk M, Weersink RA, Wilson BC, Zheng G. Photodynamic and photothermal therapies: synergy opportunities for nanomedicine. ACS Nano. 2023;17(9):7979–8003. doi:10.1021/acsnano.3c00891
10. Wufuer R, Ma HX, Luo MY, Xu KY, Kang L. Downregulation of Rac1/PAK1/LIMK1/cofilin signaling pathway in colon cancer SW620 cells treated with Chlorin e6 photodynamic therapy. Photodiagnosis Photodyn Ther. 2021;33. doi:10.1016/j.pdpdt.2020.102143
11. Lee J, Park HY, Kim WW, et al. Combination treatment with photodynamic therapy and laser ablation in breast cancer: an animal model study. Photomed Laser Surg. 2017;35(9):505–512. doi:10.1089/pho.2017.4291
12. Koukourakis MI, Giatromanolaki A, Skarlatos J, et al. Hypoxia inducible factor (HIF-1a and HIF-2a) expression in early esophageal cancer and response to photodynamic therapy and radiotherapy. Cancer Res. 2001;61(5):1830–1832.
13. Liu Y, Liu Y, Bu W, et al. Radiation-/hypoxia-induced solid tumor metastasis and regrowth inhibited by hypoxia-specific upconversion nanoradiosensitizer. Biomaterials. 2015;49:1–8. doi:10.1016/j.biomaterials.2015.01.028
14. Brown SB, Brown EA, Walker I. The present and future role of photodynamic therapy in cancer treatment. Lancet Oncol. 2004;5(8):497–508. doi:10.1016/s1470-2045(04)01529-3
15. Petre PM, Baciewicz FA, Tigan S, Spears JR. Hyperbaric oxygen as a chemotherapy adjuvant in the treatment of metastatic lung tumors in a rat model. J Thorac Cardiovasc Surg. 2003;125(1):85–95. doi:10.1067/mtc.2003.90
16. Weaver LK, Hopkins RO, Chan KJ, et al. Hyperbaric oxygen for acute carbon monoxide poisoning. New Engl J Med. 2002;347(14):1057–1067. doi:10.1056/NEJMoa013121
17. Cheng Y, Cheng H, Jiang C, et al. Perfluorocarbon nanoparticles enhance reactive oxygen levels and tumour growth inhibition in photodynamic therapy. Nat Commun. 2015;6:8785. doi:10.1038/ncomms9785
18. Song G, Liang C, Yi X, et al. Perfluorocarbon-loaded Hollow Bi2Se3 nanoparticles for timely supply of oxygen under near-Infrared light to enhance the radiotherapy of cancer. Adv Mater. 2016;28(14):2716–2723. doi:10.1002/adma.201504617
19. Yin Z, Chen D, Zou J, et al. Tumor microenvironment responsive Oxygen-self-generating nanoplatform for dual-Imaging guided photodynamic and photothermal therapy. Chemistry Select. 2018;3(16):4366–4373. doi:10.1002/slct.201800498
20. Yang X, Yang Y, Gao F, Wei JJ, Qian CG, Sun MJ. Biomimetic hybrid nanozymes with self-supplied H(+) and accelerated O(2) generation for enhanced starvation and photodynamic therapy against hypoxic tumors. Nano Lett. 2019;19(7):4334–4342. doi:10.1021/acs.nanolett.9b00934
21. Yu ZZ, Zhou P, Pan W, Li N, Tang B. A biomimetic nanoreactor for synergistic chemiexcited photodynamic therapy and starvation therapy against tumor metastasis. Nat Commun. 2018;9. doi:10.1038/s41467-018-07197-8
22. Zheng DW, Li B, Li CX, et al. Carbon-dot-decorated carbon nitride nanoparticles for enhanced photodynamic therapy against hypoxic tumor via water splitting. ACS Nano. 2016;10(9):8715–8722. doi:10.1021/acsnano.6b04156
23. Huang JQ, Zhao LP, Zhou X, et al. Carrier free O-2-economizer for photodynamic therapy against hypoxic tumor by inhibiting cell respiration. Small. 2022;18(15). doi:10.1002/smll.202107467
24. Chen HC, He CK, Chen TY, Xue XL. New strategy for precise cancer therapy: tumor-specific delivery of mitochondria-targeting photodynamic therapy agents and in situO(2)-generation in hypoxic tumors. Biomater Sci. 2020;8(14):3994–4002. doi:10.1039/d0bm00500b
25. Lv W, Zhang Z, Zhang KY, et al. A mitochondria-targeted photosensitizer showing improved photodynamic therapy effects under hypoxia. Angew Chem Int Edit. 2016;55(34):9947–9951. doi:10.1002/anie.201604130
26. Wang MM, Yang ZY, Song Y, et al. length Proteasomal and autophagy-mediated degradation of mutp53 proteins through mitochondria-targeting aggregation-induced-emission materials. Acta Biomater. 2022;150:402–412. doi:10.1016/j.actbio.2022.07.057
27. Wang YJ, Zheng JS, Lin J, Ye K, Wei P. Mitochondria-targeting and ROS-responsive nanocarriers via amphiphilic TPP-PEG-TK-Ce6 for nanoenabled photodynamic therapy. Adv Polym Technol. 2022. doi:10.1155/2022/1178039
28. Valastyan S, Weinberg RA. Tumor metastasis: molecular insights and evolving paradigms. Cell. 2011;147(2):275–292. doi:10.1016/j.cell.2011.09.024
29. Li XP, Zhao Y, Zhang T, Xing D. Mitochondria-specific agents for photodynamic cancer therapy: a key determinant to boost the efficacy. Adv Healthc Mater. 2021;10(3). doi:10.1002/adhm.202001240
30. Hammond SM. RNAi, microRNAs, and human disease. Cancer Chemother Pharmacol. 2006;58(1):s63–68. doi:10.1007/s00280-006-0318-2
31. Gong Y, Liu W, Zhang N, He Y, Hong M, Dong J. Analysis of miR-34a expression and function in breast cancer tissues and cells. Cancer Res Prev Treatt. 2013;40(10):943–948. doi:10.3971/j.issn.1000-8578.2013.10.007
32. Di Paolo D, Pastorino F, Brignole C, et al. Combined replenishment of miR-34a and let-7b by targeted nanoparticles inhibits tumor growth in neuroblastoma preclinical models. Small. 2020;16(20). doi:10.1002/smll.201906426
33. Ambros PF, Ambros IM, Brodeur GM, et al. International consensus for neuroblastoma molecular diagnostics: report from the International Neuroblastoma Risk Group (INRG) Biology Committee. Br J Cancer. 2009;100(9):1471–1482. doi:10.1038/sj.bjc.6605014
34. Deng X, Cao M, Zhang J, et al. Hyaluronic acid-chitosan nanoparticles for co-delivery of MiR-34a and doxorubicin in therapy against triple negative breast cancer. Biomaterials. 2014;35(14):4333–4344. doi:10.1016/j.biomaterials.2014.02.006
35. Trivedi M, Singh A, Talekar M, Pawar G, Shah P, Amiji M. MicroRNA-34a encapsulated in hyaluronic acid nanoparticles induces epigenetic changes with altered mitochondrial bioenergetics and apoptosis in non-small-cell lung cancer cells. Sci Rep. 2017;7. doi:10.1038/s41598-017-02816-8.
36. Shimanovich U, Volkov V, Eliaz D, Aizer A, Michaeli S, Gedanken A. Stabilizing RNA by the sonochemical formation of RNA nanospheres. Small. 2011;7(8):1068–1074. doi:10.1002/smll.201002238
37. Gandhi NS, Tekade RK, Chougule MB. Nanocarrier mediated delivery of siRNA/miRNA in combination with chemotherapeutic agents for cancer therapy: current progress and advances. J Control Release. 2014;194:238–256. doi:10.1016/j.jconrel.2014.09.001
38. Navarro G, Pan J, Torchilin VP. Micelle-like nanoparticles as carriers for DNA and siRNA. Mol Pharmaceut. 2015;12(2):301–313. doi:10.1021/mp5007213
39. Shi L, Wu W, Duan Y, et al. Light-induced self-escape of spherical nucleic acid from endo/lysosome for efficient non-cationic gene delivery. Angew Chem Int Ed Engl. 2020;59(43):19168–19174. doi:10.1002/anie.202006890
40. Yang YX, Ning HJ, Xia TP, et al. Electrostatic attractive self-delivery of siRNA and light-induced self-escape for synergistic gene therapy. Adv Mater. 2023;35(30). doi:10.1002/adma.202301409
41. Imani S, Zhang XQ, Hosseinifard H, Fu SY, Fu JJ. The diagnostic role of microRNA-34a in breast cancer: a systematic review and meta-analysis. Oncotarget. 2017;8(14):23177–23187. doi:10.18632/oncotarget.15520
42. Kessel D. Subcellular targets for photodynamic therapy: implications for initiation of apoptosis and autophagy. J Natl Compr Cancer Netw. 2012;10:S56–S59. doi:10.6004/jnccn.2012.0177
43. Zhong XM, Li P, Li J, He RL, Cheng GC, Li YM. Downregulation of microRNA-34a inhibits oxidized low-density lipoprotein-induced apoptosis and oxidative stress in human umbilical vein endothelial cells. Int J Mol Med. 2018;42(2):1134–1144. doi:10.3892/ijmm.2018.3663
44. Maeda H, Yao HW, Rizal S, Teape D, Dennery P. Hyperoxic exposure increases microRNA-34a, leading to senescence in lung epithelial cells. Free Radic Biol Med. 2022;180:49–50. doi:10.1016/j.freeradbiomed.2021.12.108
 © 2024 The Author(s). This work is published and licensed by Dove Medical Press Limited. The
full terms of this license are available at https://www.dovepress.com/terms
and incorporate the Creative Commons Attribution
- Non Commercial (unported, 3.0) License.
By accessing the work you hereby accept the Terms. Non-commercial uses of the work are permitted
without any further permission from Dove Medical Press Limited, provided the work is properly
attributed. For permission for commercial use of this work, please see paragraphs 4.2 and 5 of our Terms.
© 2024 The Author(s). This work is published and licensed by Dove Medical Press Limited. The
full terms of this license are available at https://www.dovepress.com/terms
and incorporate the Creative Commons Attribution
- Non Commercial (unported, 3.0) License.
By accessing the work you hereby accept the Terms. Non-commercial uses of the work are permitted
without any further permission from Dove Medical Press Limited, provided the work is properly
attributed. For permission for commercial use of this work, please see paragraphs 4.2 and 5 of our Terms.