")
Back to Journals » Cancer Management and Research » Volume 13
Clinical Significance of miR-183-3p and miR-182-5p in NSCLC and Their Correlation
Authors Zhang T, Li W , Gu M, Wang Z, Zhou S, Hao X, Li W , Xu S
Received 9 February 2021
Accepted for publication 6 April 2021
Published 28 April 2021 Volume 2021:13 Pages 3539—3550
DOI https://doi.org/10.2147/CMAR.S305179
Checked for plagiarism Yes
Review by Single anonymous peer review
Peer reviewer comments 2
Editor who approved publication: Dr Sanjeev K. Srivastava
Tianxiang Zhang,1 Wei Li,2 Meng Gu,1 Ziyu Wang,1 Shijie Zhou,2 Xuefeng Hao,1 Weiying Li,1 Shaofa Xu1
1Department of Cellular and Molecular Biology, Beijing Chest Hospital, Capital Medical University/Beijing Tuberculosis and Thoracic Tumor Research Institute, Beijing, People’s Republic of China; 2Department of Thoracic Surgery, Beijing Chest Hospital, Capital Medical University/Beijing Tuberculosis and Thoracic Tumor Research Institute, Beijing, People’s Republic of China
Correspondence: Weiying Li; Shaofa Xu
Department of Cellular and Molecular Biology, Beijing Chest Hospital, Capital Medical University/Beijing Tuberculosis and Thoracic Tumor Research Institute, No. 9, Beiguan Street, Tongzhou District, Beijing, 101149, People’s Republic of China
Tel +86-10-89509372
Fax +86-10-89509222
Email [email protected]; [email protected]
Purpose: Accumulating evidence has indicated that dysregulated microRNAs (miRNAs) are involved in cancer progression. In this study, we evaluated the clinicopathologic significance of miR-183-3p and miR-182-5p, and the role of miR-183-3p in non-small-cell lung cancer (NSCLC) progression.
Patients and Methods: Seventy-six NSCLC patients from Beijing Chest Hospital were included. The expression of miR-183-3p and miR-182-5p was evaluated by real-time quantitative polymerase chain reaction (RT-qPCR). Then, cell growth curve assays and colony formation assays were performed. Bioinformatics analysis of TCGA database was performed to explore the clinicopathological significance and prognostic value.
Results: miR-183-3p and miR-182-5p were significantly increased in NSCLC tumor tissues (both P < 0.0001) and were positively correlated (r = 0.8519, P < 0.0001). miR-183-3p (P = 0.0444) and miR-182-5p (P = 0.0132) were correlated with tumor size. In addition, miR-183-3p (P = 0.0135) and miR-182-5p (P = 0.0009) were upregulated in normal lung tissues from smokers. In vitro, miR-183-3p was correlated with cell proliferation. In addition, bioinformatics analysis indicated that miR-183-3p was correlated with poor prognosis (P = 0.0466) and tumor size (P = 0.0017). In addition, miR-183-3p was higher in lung squamous carcinoma (LUSC) tissue (P < 0.0001) than in lung adenocarcinoma (LUAD) tissue, and miR-183-3p was higher in the tumor tissue of smokers (P = 0.0053) than in that of nonsmokers.
Conclusion: Upregulation of miR-183-3p and miR-182-5p may play an oncogenic role in NSCLC. miR-183-3p could be used as a potential prognostic biomarker and therapeutic target to manage lung cancer.
Keywords: miR-183-3p, miR-182-5p, non-small-cell lung cancer, NSCLC, proliferation, prognosis
Introduction
Lung cancer is one of the most common malignancies, and it is also a leading cause of cancer related death worldwide, causing a large number of deaths every year.1 Clinically, NSCLC accounts for more than 70% of lung cancers, including adenocarcinomas, squamous-cell carcinomas and large-cell carcinomas.2 Despite improvements in diagnosis and treatment, the 5-year overall survival of NSCLC patients is still low, with a high recurrence rate, even in the early-stages.3 The undesirable prognosis of NSCLC may be due to a late diagnosis, insufficient evidence for therapy selection, and our limited understanding of the NSCLC physiological mechanism at the genetic level. There also remains a pressing need to explore the potential role of specific gene targets in oncogenesis and the genetic features of NSCLC.4
miRNAs are ubiquitous small noncoding RNAs of 19–24 nucleotides in length. Abnormal expression of miRNAs has been reported to be associate with numerous diseases, especially cancer, and several studies have reported the diagnostic or prognostic significance of miRNA expression in cancer.5 The miR-183 family is a conserved polycistronic miRNA cluster including miR-183-5p, miR-96-5p and miR-182-5p located at chromosomal position 7q32.2, which is often overexpressed in tumors.6 However, the research progress of individual components of this cluster in NSCLC is different. As a member of miR-183 cluster, the effect of miR-182-5p on lung cancer cell lines has been explored by many previous studies, and the majority of studies have shown that miR-182-5p targets tumor suppressor genes and promotes cell proliferation, colony formation, migration and invasion.7–11 In addition, miR-182-5p was found to have significant diagnostic value in lung cancer.12,13 This miRNA was also correlated with poor prognosis in lung cancer patients.12,14,15
However, few studies have focused on miR-183-3p in NSCLC, which is produced from the same precursor microRNA (pre-miRNA) as miR-183-5p. miR-183-3p was found to be upregulated in lung cancer tissues and might be involved in lung cancer pathogenesis and progression,16 but the cohort of this study was limited to adenocarcinoma of female nonsmokers and lacked in vitro experiments to support this conclusion. In addition, the relationship between miR-183-3p and the members of miR-183 cluster has not been previously reported.
In this study, we focused on the clinicopathological significance of miR-183-3p and miR-182-5p in NSCLC. In addition, the relationship between miR-183-3p and miR-182-5p was also evaluated by various means. The proliferation-promoting effect of miR-183-3p was further verified by cell phenotypic experiments, and the prognostic value of these two miRNAs was explored by bioinformatics analysis. As the effect of miR-182-5p on NSCLC cell lines was widely studied by previous in vitro experiments, cell phenotype experiments of miR-182-5p were not included in this study.
Patients and Methods
Patients
In total, 76 NSCLC patients receiving surgical treatment at Beijing Chest Hospital were enrolled between 2018–10-24 and 2020-1-20, and the cohort was composed of males and females ranging from 26 to 79 years old (mean = 61.67 years old). Seventy-six pairs of fresh NSCLC tumor tissues and adjacent noncancerous lung tissues were obtained after pathological diagnosis. None of the patients underwent any chemotherapy or radiation therapy prior to the operation or had any other accompanying malignancy. After resection, tissue samples were flash frozen in liquid nitrogen for 30 minutes within 2 hours and then frozen at −80°C for long-stem storage. The correlation between the expression of miR-183-3p or miR-182-5p and clinicopathological factors (age, sex, histological type, smoking, tumor size, lymphatic metastasis, distant metastasis, pleura invasion, vessel carcinoma embolus) was evaluated. This study was approved by the Ethics Committee of Beijing Chest Hospital. The clinical information of these patients and the correlation analysis results are described in Tables 1 and 2.
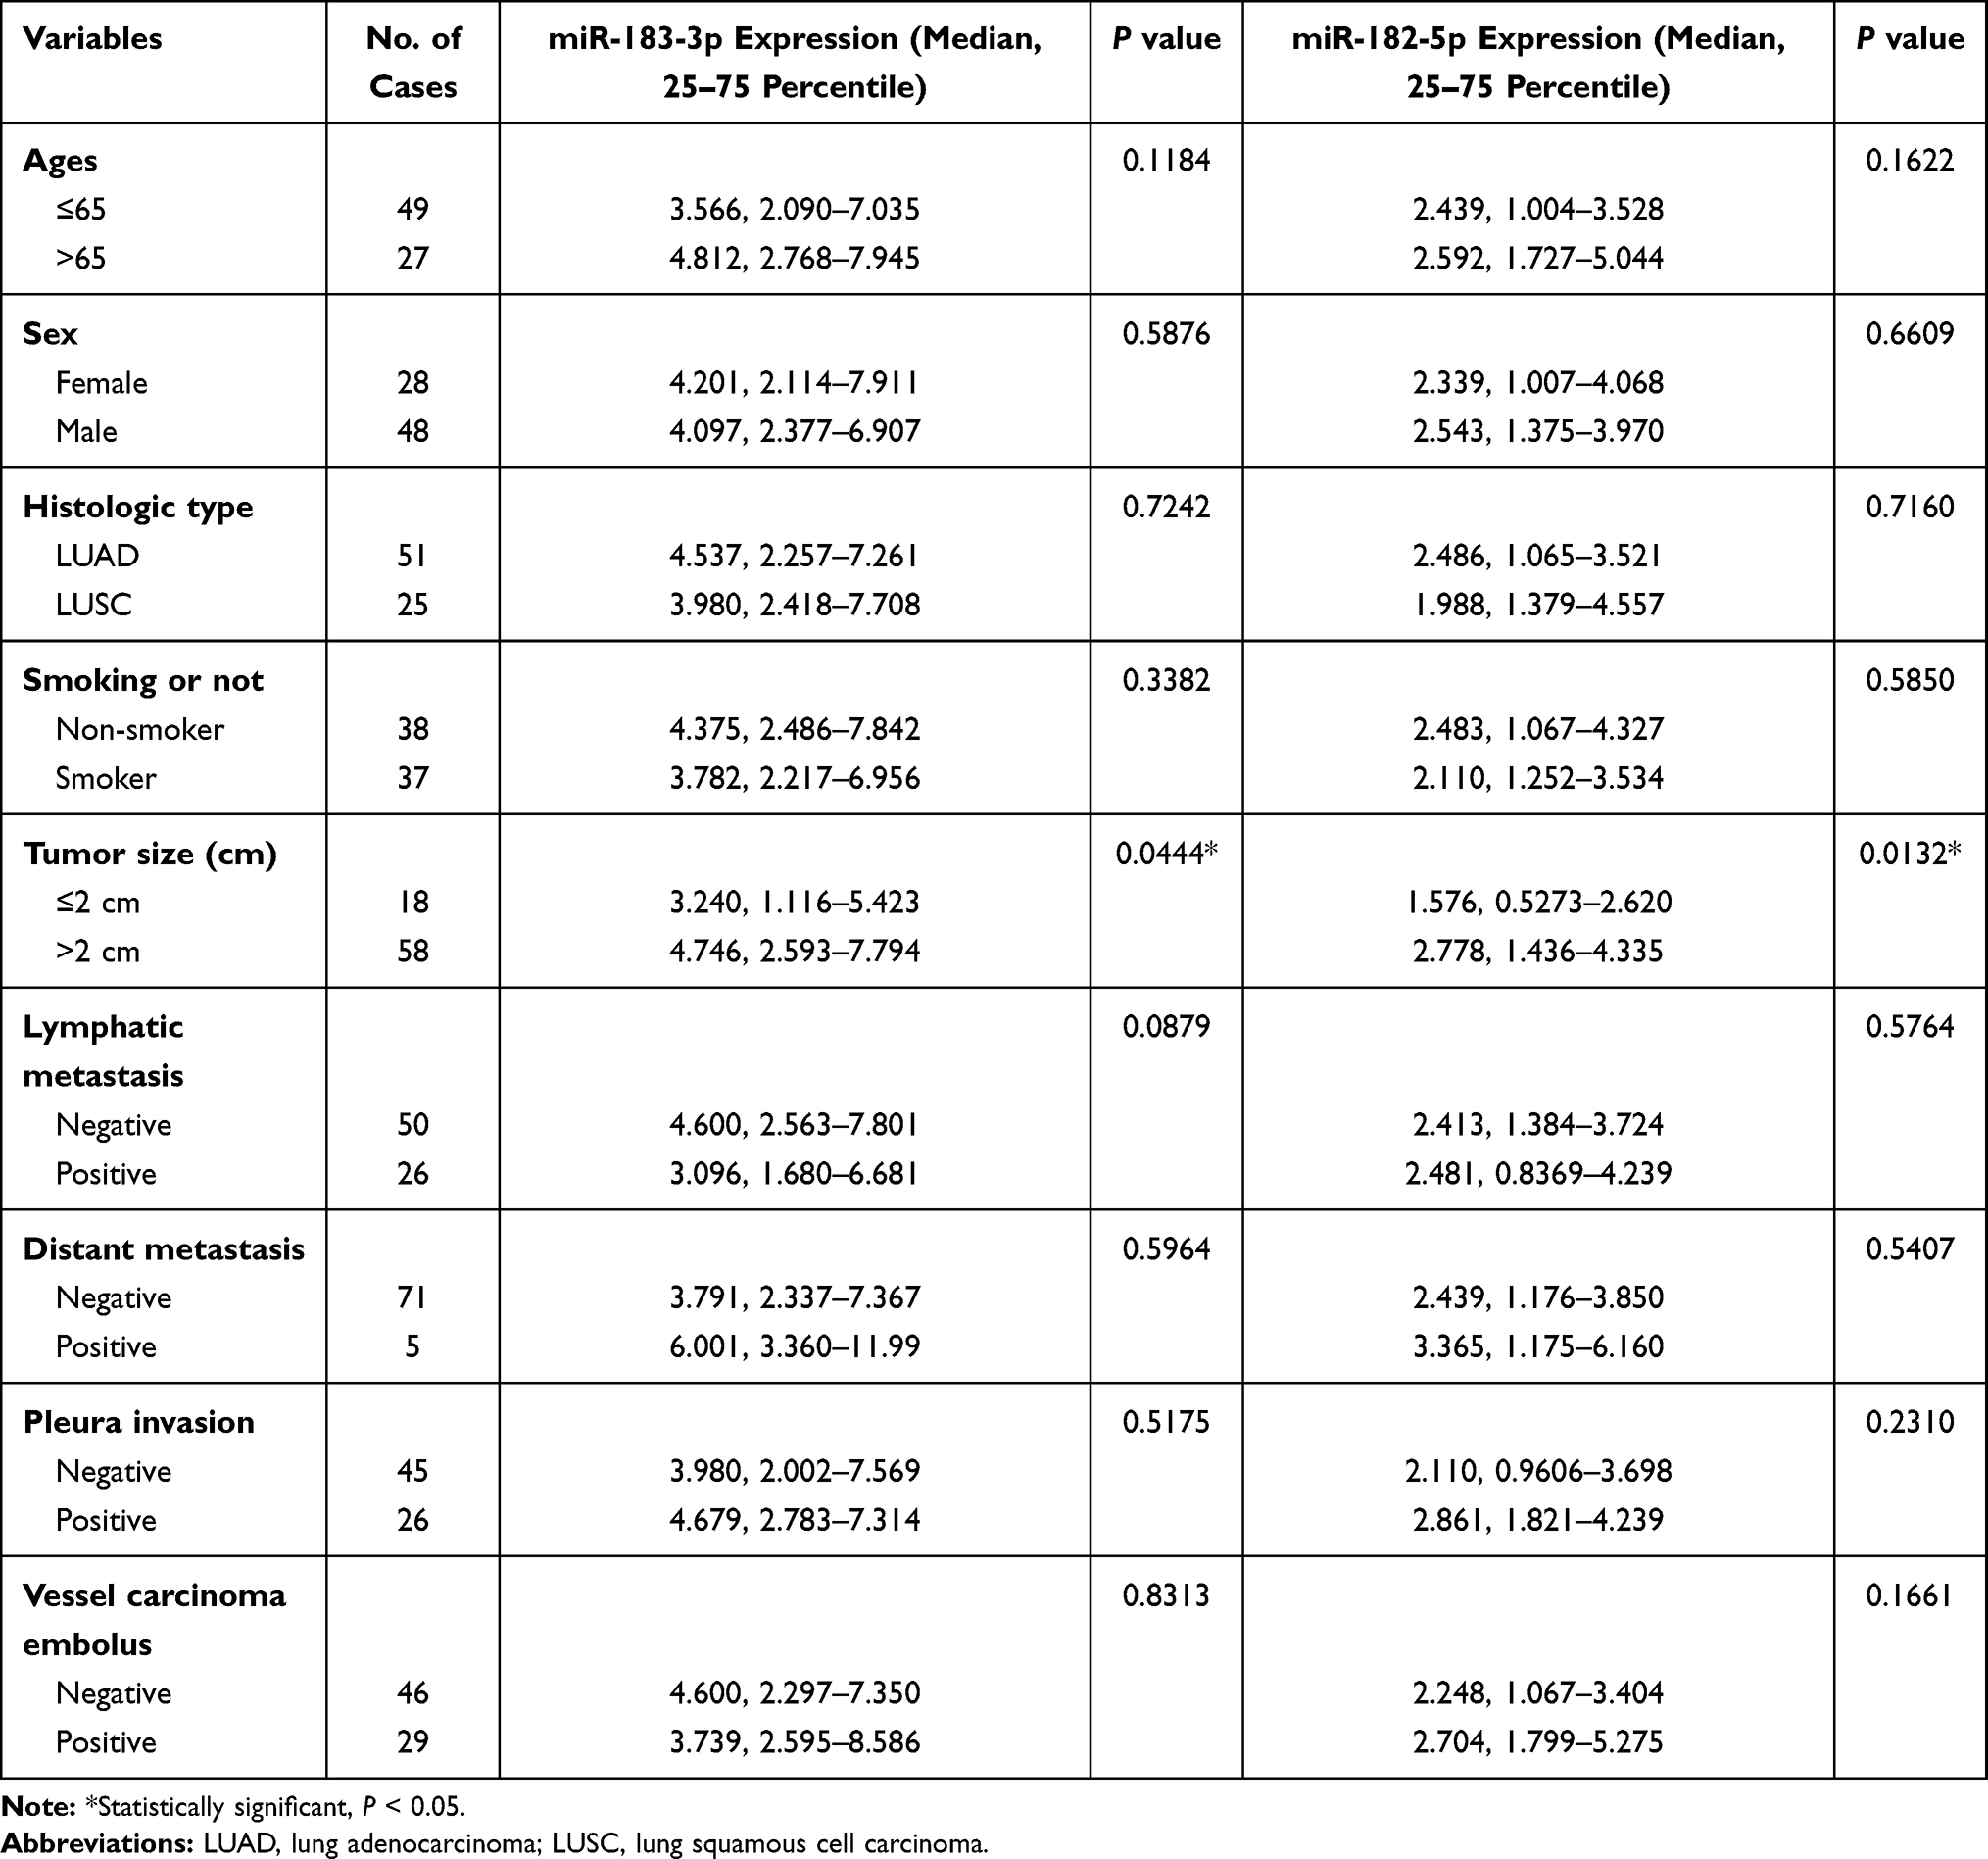 |
Table 1 Clinicopathological Characteristics of NSCLC Patients and Expression of miR-183-3p and miR-182-5p in Tumor Tissues |
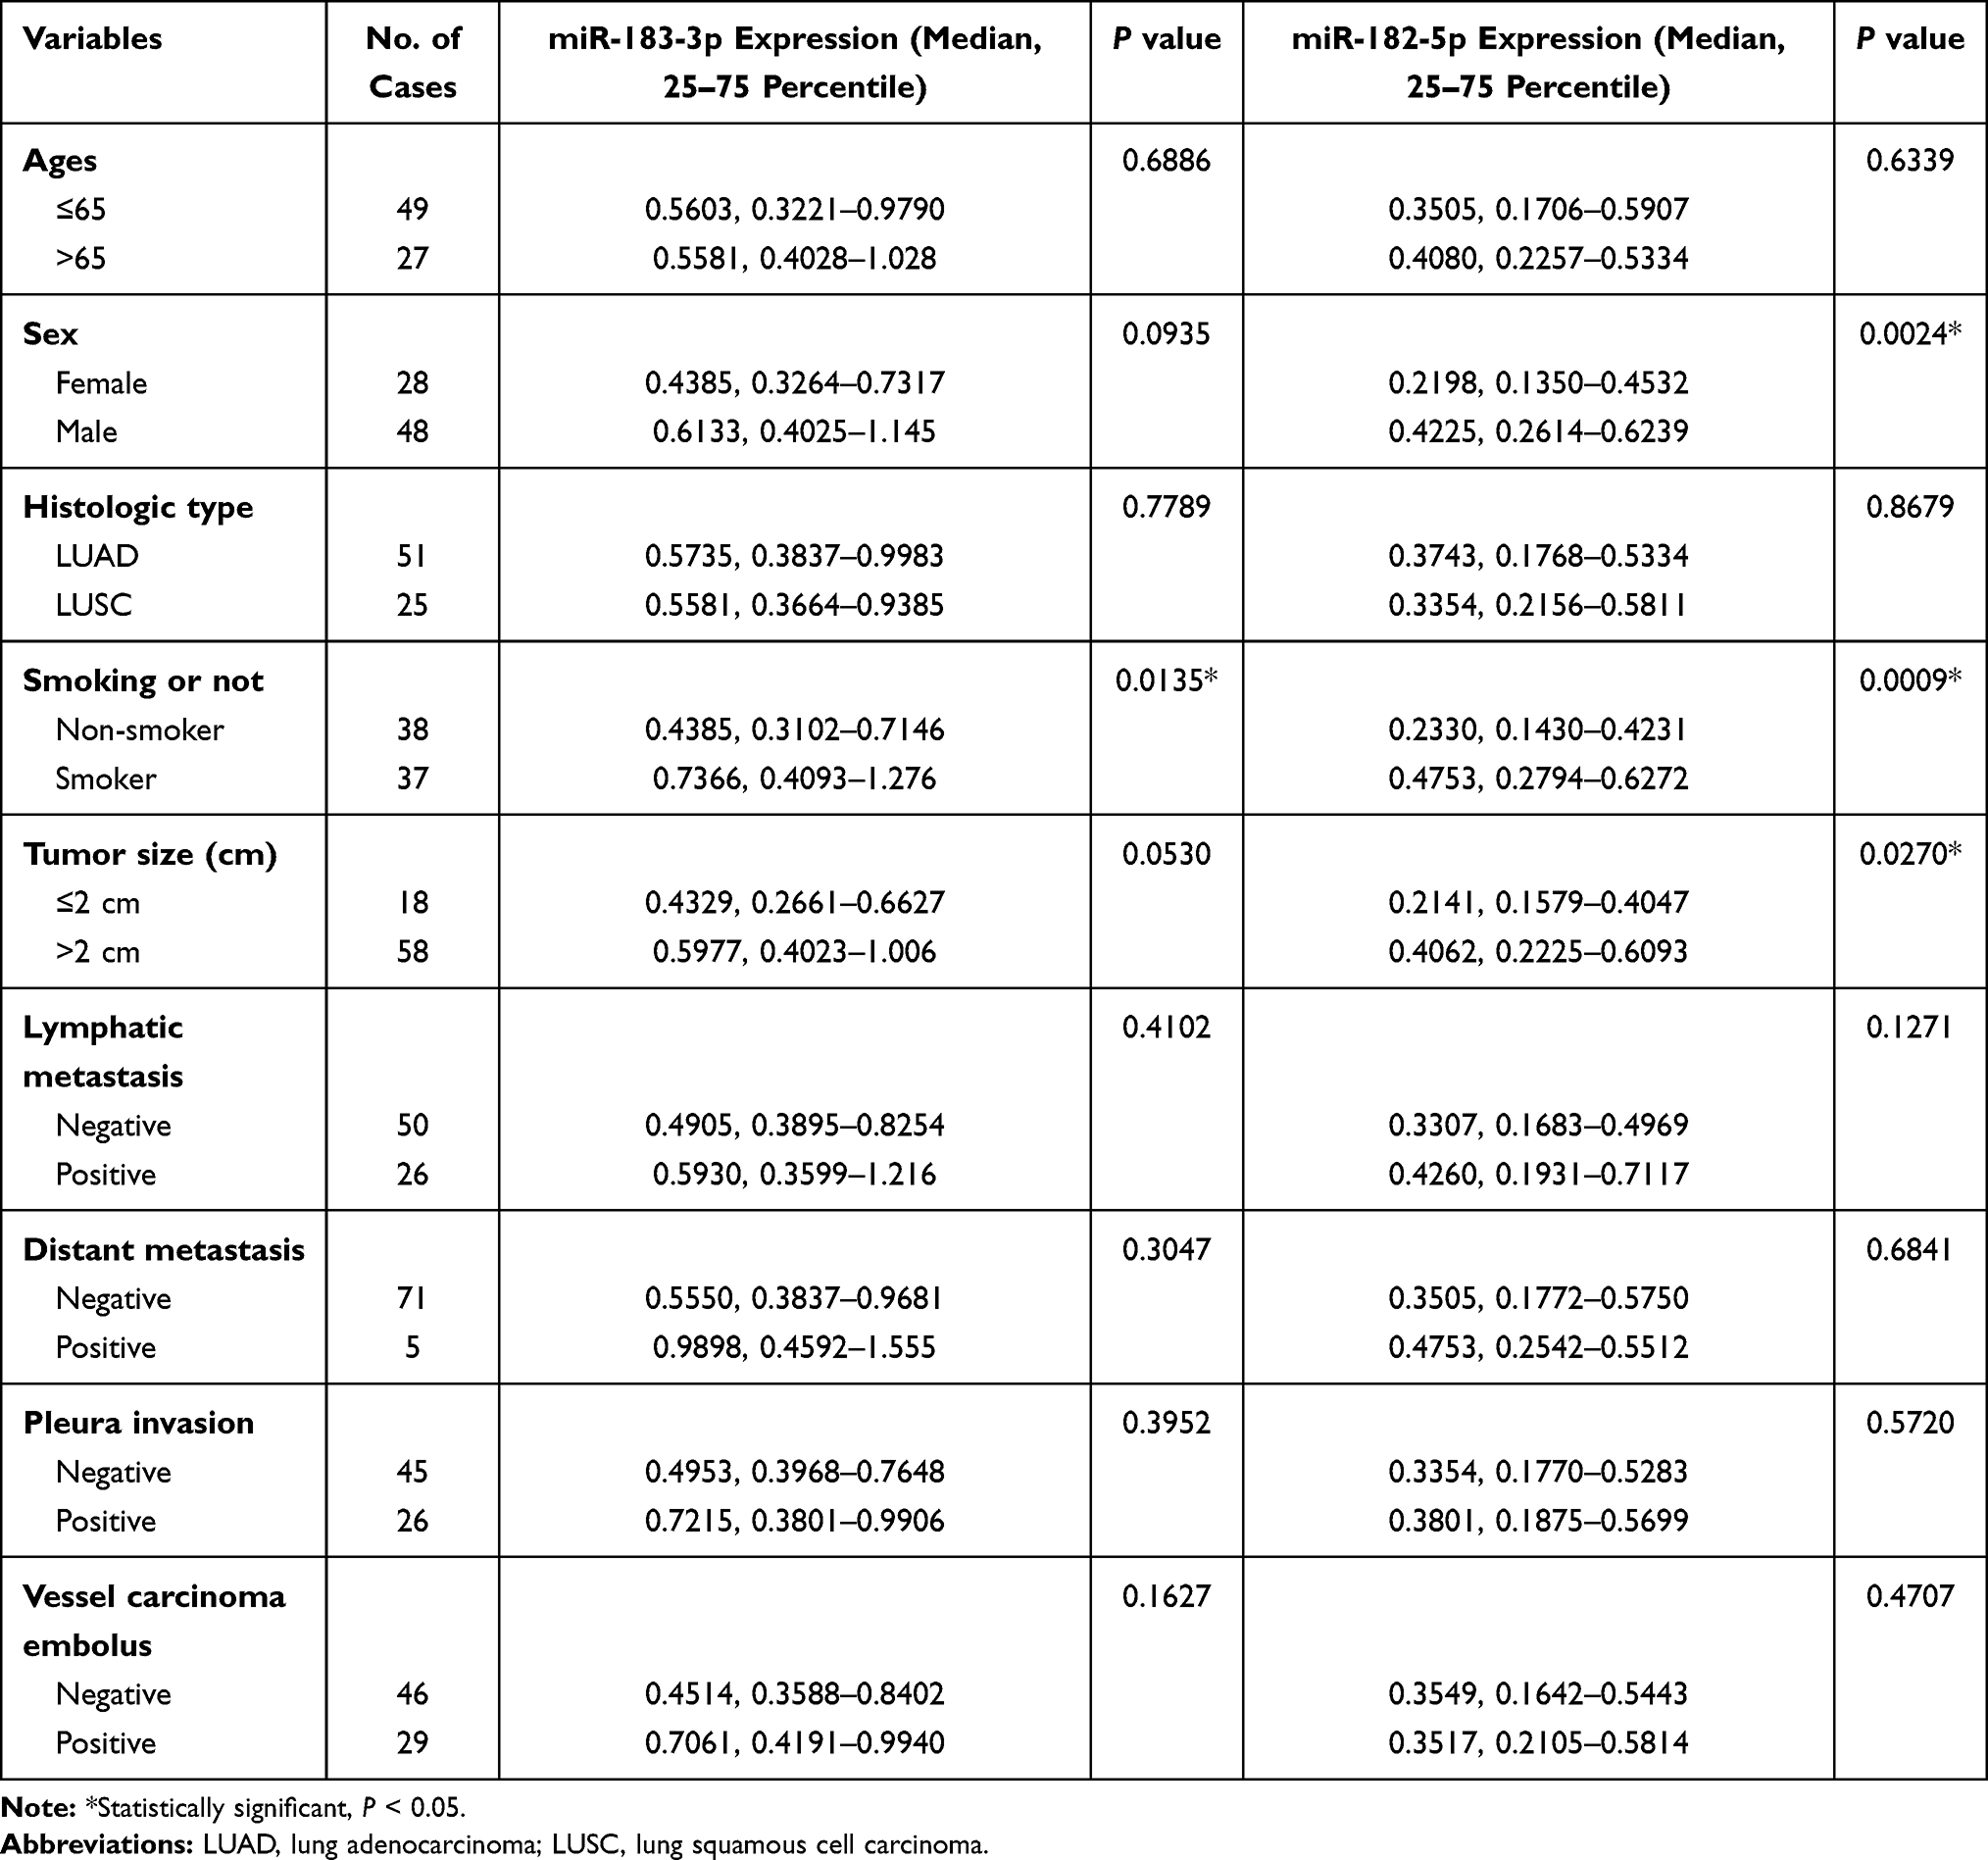 |
Table 2 Clinicopathological Characteristics of NSCLC Patients and miRNA Expression in Non-Malignant Tissues |
Cell Lines and Culture Conditions
Human NSCLC cell lines H226, H23, H522 and EKVX were obtained from the National Institutes of Health (NIH). The human NSCLC cell lines A549, H1395, H1299, and H1703 and the pulmonary epithelial cell line BEAS-2B were obtained from the National Infrastructure of Cell Line Resource (NICR). All cell lines were cultured in RPMI-1640 medium (Invitrogen, Carlsbad, CA, USA) supplemented with 10% fetal bovine serum (FBS; Gibco, Los Angeles, CA, USA). The cells were maintained at 37°C in a humidified chamber containing 5% CO2 and 95% air.
Quantitative Real-Time PCR (RT-qPCR) of miR-183-3p and miR-182-5p
The miRNA names were standardized according to miRBase version 21.17 The nomenclature of miR/miR* was replaced with −5p/-3p. Total RNA was extracted from tumorous and nonmalignant tissues, eight NSCLC cell lines (A549, H226, H1395, H23, H522, H1703, H1299, and EKVX) and one immortalized pulmonary epithelial cell line (BEAS-2B) using the mirVana™ miRNA Isolation Kit (Thermo Fisher Scientific, Vilnius, LTU) following the manufacturer’s instructions.
Subsequently, cDNA was synthesized from total RNA using a TaqManTM MicroRNA Reverse Transcription Kit (Thermo Fisher Scientific, Vilnius, LTU). Then, RT-qPCR was performed by TaqMan® MicroRNA Assays (Thermo Fisher Scientific, Pleasanton, CA, USA) at Applied Biosystems 7500 (Thermo Fisher Scientific, Waltham, MA, USA) according to the following protocol: 50°C for 2 min, followed by 95°C for 10 min, followed by 40 cycles of 95°C for 15 sec, and 60°C for 60 sec.
We evaluated all RT-qPCR data by normalizing gene expression to U6 small nuclear RNA (U6) expression as an endogenous control and using the 2−ΔΔCt method. More specifically, the A549 cell line was selected as a reference sample during the RT-qPCR of tumorous and nonmalignant tissue samples. The BEAS-2B cell line was selected as a reference sample during RT-qPCR of NSCLC cell lines, including A549. The reference sample was evaluated in each run and each measurement was performed in triplicate.
The assay IDs of microRNA-specific stem-loop RT primers (Thermo Fisher Scientific, Pleasanton, CA, USA) were as follows: hsa-miR-183-3p 002270, hsa-miR-182-5p 002334, and U6 snRNA 001973.
The assay IDs of microRNA-specific TaqMan™ MGB probes (Thermo Fisher Scientific, Pleasanton, CA, USA) were as follows: hsa-miR-183-3p 002270, hsa-miR-182-5p 002334, and U6 snRNA 001973.
Cell Transient Transfection
The reagents miR-183-3p mimic, miR-183-3p inhibitor and corresponding NC were obtained from Sangong Biotech (Shanghai, China), and the sequences are as follows: hsa-miR-183-3p mimic (GUGAAUUACCGAAGGGCCAUAA), hsa-miR-183-3p inhibitor (UUAUGGCCCUUCGGUAAUUCAC), mimic NC (UUGUACUACACAAAAGUACUG), and inhibitor NC (CAGUACUUUGUGUAGUACAA). The mimic NC and inhibitor NC used in this study were meaningless RNA sequences from the Caenorhabditis elegans genome that do not exist in humans.
For transient transfection, cells in logarithmic phase were seeded in 24-well plates at 1×10⁵ to 1.2×10⁵ cells per well. After 24 hours, the cells reached 70–80% confluence and were transfected with the miR-183-3p mimic, miR-183-3p inhibitor, or corresponding negative control (NC) using RNA-TransMate (Ref. E607402-0500, Sangong Biotech, Shanghai, China) according to the instructions provided. RNA-TransMate was added to all blank control groups at equal proportion as the other groups.
Cell Growth Curve Assay
A Cell Counting Kit-8 (CCK-8; Dojindo Molecular Technologies, Kumamoto, Japan) assay was performed according to the manufacturer’s instructions to examine the proliferation ability of NSCLC cells. A549, H226, BEAS-2B and H1395 cell lines were seeded in flat-bottom 96-well plates. A549 and H226 cells were seeded at 4000 cells per well, while BEAS-2B and H1395 cells were seeded at 5000 cells per well. All seeded plates were incubated for 24, 48, 72, and 96 hours after transfection. Then, 10 μL of CCK-8 reagent was added to each well of 96-well plates. The plates were incubated for 2 hours at 37°C in a humid atmosphere containing 5% CO2. The absorbance values at 450 nm of each well were measured with an EL-800 Universal Microplate Reader (BioTek Instruments, Inc., Winooski, VT, USA).
Colony Formation Assay
Transfected cells were suspended in 2 mL of culture medium and seeded in six-well plates. A total of 200 A549 or H226 cells per well and 300 BEAS-2B or H1395 cells per well were used. The cells were maintained at 37°C for 7 to 14 days, which varied among different cell types. Then, colony formation was halted, and the cells were washed twice with PBS, fixed and stained with 2% crystal violet. Colonies with more than 50 cells in each well were counted under an optical microscope.
Clinicopathological and Prognostic Analyses in TCGA
To validate the clinicopathological and prognostic value of miR-183-3p, expression information and corresponding clinical data were downloaded from TCGA using OncoLnc18 (http://www.oncolnc.org/) and Assistant for Clinical Bioinformatics (https://www.aclbi.com/). The included studies met the publication guidelines provided by TCGA.
The top 10% and the bottom 10% miR-183-3p or miR-182-5p expression was defined as the cutoff value between the high and low expression groups.
Statistical Analysis
All statistical analyses were conducted using SPSS version 22.0 (Chicago, IL, USA) and graphed using GraphPad Prism version 5.0 (La Jolla, CA, USA). A P value less than 0.05 was considered statistically significant.
For analysis of the RT-qPCR data and clinical information of 76 included patients in Beijing Chest Hospital, Student’s t-test was used when the dataset fit a normal distribution, and a nonparametric test was used when the dataset did not fit a normal distribution. The relationship between miR-183-3p and miR-182-5p was analyzed using linear correlation analysis.
For bioinformatics analysis in TCGA, the correlation between miR-183-3p expression and clinicopathological factors (tumor size, histology, smoking) was evaluated using the rank sum test. The Kaplan-Meier method was used to estimate the prognostic significance for overall survival (OS), and survival curves were compared through the Log rank test.
Results
Relative miR-183-3p and miR-182-5p Expression Evaluated by RT-qPCR
The expression levels of miR-183-3p and miR-182-5p in 76 paired NSCLC tissues and adjacent noncancerous tissues were quantified by RT-qPCR. The results show that these two genes were significantly increased in tumor tissues. The median miR-183-3p expression was 4.097 (25–75 percentile, 2.365–7.361) in lung cancer tissues and 0.5592 (25–75 percentile, 0.3859–0.9922) in adjacent noncancerous tissues. The median miR-182-5p was 2.460 (25–75 percentile, 1.191–3.970) in lung cancer tissues and 0.3630 (25–75 percentile, 0.1795–0.5708) in adjacent noncancerous tissues. Remarkably, miR-183-3p and miR-182-5p were higher in lung cancer tissues than in adjacent noncancerous tissues (both P < 0.0001) (Figure 1A and B). Further subgroup analysis among various TNM stages, different histological types and smoking status showed that these two genes were significantly higher in tumor tissues than in normal lung tissues (Figure 1C–H).
 |
Figure 1 Relative miR-183-3p or miR-182-5p expression in cancer and normal tissues detected by RT-qPCR. (A and B) Relative miR-183-3p and miR-182-5p expression in cancer and normal tissues of the included patients. **Statistical significance P < 0.01. (C and D) Relative miR-183-3p and miR-182-5p expression in the NSCLC TNM stage I, stage II and stage III+IV groups. (E and F) Relative miR-183-3p and miR-182-5p expression in cancer and normal tissues of different histologic types. (G and H) Figure 1G. Relative miR-183-3p and miR-182-5p expression in cancer and normal tissues of nonsmokers and smokers. *Statistical significance P < 0.05. **Statistical significance P < 0.01. Abbreviations: LUAD, lung adenocarcinoma; LUSC, lung squamous cell carcinoma; ns, no statistical significance. |
In addition, the RT-qPCR results of cell lines also showed that the relative expression of miR-183-3p and miR-182-5p was significantly increased in all NSCLC cell lines except A549 (Figure 2A and B). According to the RT-qPCR results, A549, H226 and BEAS-2B cells were selected for miR-183-3p overexpression. H1395 cells were selected for miR-183-3p knockdown.
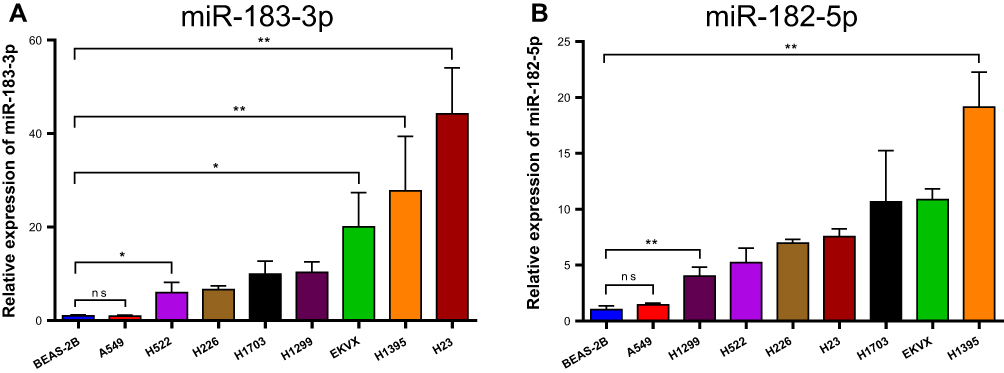 |
Figure 2 Relative miR-183-3p or miR-182-5p expression in NSCLC cell lines and BEAS-2B cells detected by RT-qPCR. (A) Relative miR-183-3p expression in various NSCLC cell lines and BEAS-2B cell lines. *Statistical significance P < 0.05. **Statistical significance P < 0.01. (B) Relative miR-182-5p expression in various NSCLC cell lines and BEAS-2B cell lines. **Statistical significance P < 0.01. Abbreviation: ns, no statistical significance. |
Clinicopathological Analysis of miR-183-3p or miR-182-5p Expression
We further evaluated the correlation between miR-183-3p or miR-182-5p expression and the clinicopathological characteristics of 76 included patients. In tumor tissues, the results showed that miR-183-3p (P = 0.0444) and miR-182-5p (P = 0.0132) were correlated with tumor size (maximum diameter > 2 cm). In contrast, no correlation was detected with age, sex or other clinicopathological parameters (Table 1). In adjacent nonmalignant tissues, the results showed that miR-182-5p was correlated with tumor size (P = 0.0270) and was higher in males than females (P = 0.0024). Interestingly, we also found that miR-183-3p and miR-182-5p were upregulation in nonmalignant tissues of smokers (Figure 1G and H). Moreover, no correlation was detected with age, histological type or other clinicopathological parameters (Table 2).
In addition, as most of the included patients were in TNM stage I (42 of 76, 55.3%), we further analyzed the correlation between the expression of these two genes and the clinical information of stage I patients. Then we found that the upregulation of miR-182-5p in tumor tissues was significantly correlated with vascular tumor thrombus (P = 0.0418).
Relationship Between miR-183-3p and miR-182-5p
We further explored the relationship between the expression of miR-183-3p and miR-182-5p. The linear correlation analysis of miR-183-3p and miR-182-5p expression in tumor tissues showed a strong positive correlation with each other (r = 0.8519, P < 0.001) (Figure 3A). Furthermore, we also found that the expression level of miR-182-5p presented a coincident change in miR-183-3p artificially up- or down-regulated cell models (Figure 3B). Expression level of miR-182-5p increased in H226 cell line when transfected with miR-183-3p mimic after 24 hours. Similarly, expression level of miR-182-5p decreased in H23 cell line when transfected with miR-183-3p inhibitor after 24 hours. This phenomenon may support the positive correlation between these two genes.
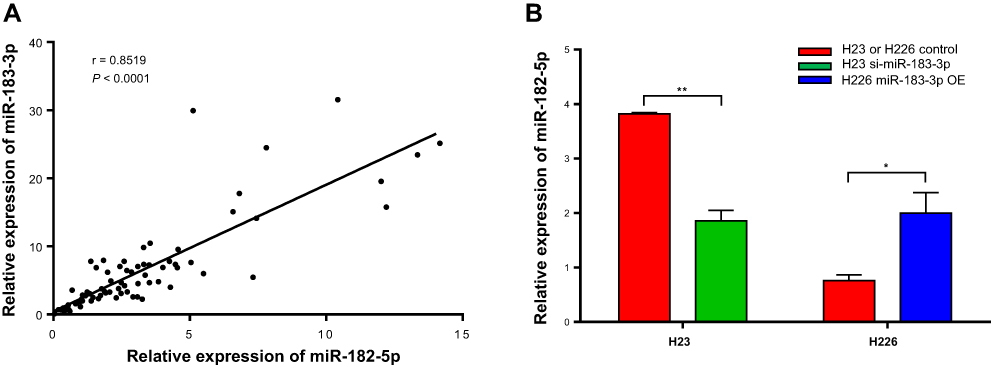 |
Figure 3 Correlation between the relative expression of miR-183-3p and miR-182-5p detected by RT-qPCR. (A) Correlation between relative miR-183-3p expression and relative miR-182-5p expression. (B) Relative miR-182-5p expression in a miR-183-3p overexpression or suppression cell model. H23 or H226 control, H23 or H226 cell lines transfected with RNA-TransMate only. H23 si-miR-183-3p, H23 cell line transfected with the miR-183-3p inhibitor. H226 miR-183-3p OE, H226 cell line transfected with the miR-183-3p mimic. *Statistical significance P < 0.05. **Statistical significance P < 0.01. |
Relationship Between miR-183-3p and the Proliferation Ability of Cell Lines
The CCK-8 assay results showed that the proliferation of the A549, H226 and BEAS-2B cell lines transfected with the miR-183-3p mimics was significantly promoted compared with that of the cells transfected with the negative control (Figure 4A–C). Moreover, the proliferation ability of the H1395 cell line transfected with miR-183-3p inhibitors was significantly reduced (Figure 4D).
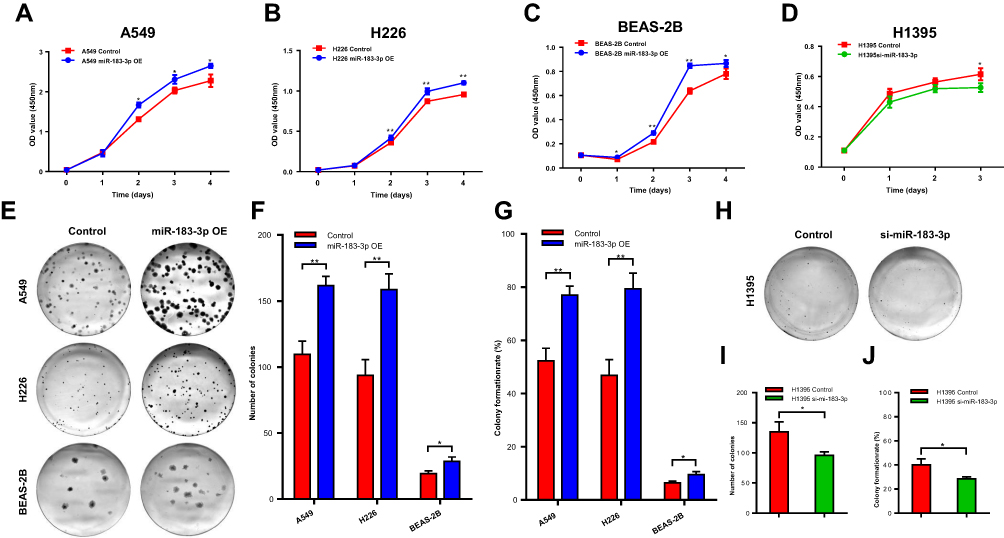 |
Figure 4 Proliferation ability changes in the miR-183-3p overexpression or suppression cell models. (A–C) CCK-8 assays were performed to measure the proliferation abilities of A549, H226 and BEAS-2B cells transfected with the miR-183-3p mimic. miR-183-3p OE, cells transfected with the miR-183-3p mimic. (D) CCK-8 assays were performed to measure the proliferation ability of H1395 cells transfected with the miR-183-3p inhibitor. si-miR-183-3p, cells transfected with the miR-183-3p inhibitor. (E–G) Colony formation assays were conducted to measure the proliferation abilities of A549, H226 and BEAS-2B cells transfected with the miR-183-3p mimic. Significant differences could be observed from representative pictures of culture plates (E), number of colonies (F) and colony formation rate (G). miR-183-3p OE, cells transfected with the miR-183-3p mimic. *Statistical significance P < 0.05. **Statistical significance P < 0.01. (H–J) Colony formation assays were conducted to measure the proliferation ability of H1395 cells transfected with the miR-183-3p mimic. Significant differences could be observed from representative pictures of culture plates (H), number of colonies (I) and colony formation rate (J). si-miR-183-3p, cells transfected with the miR-183-3p inhibitor. *Statistical significance P < 0.05. Abbreviation: Control, corresponding negative control. |
Consistent with this outcome, the colony formation assay revealed that the colony numbers, colony formation rates and colony sizes of A549, H226 and BEAS-2B cell lines transfected with miR-183-3p mimics were significantly increased (Figure 4E–G). In addition, those of the H1395 cell line transfected with miR-183-3p inhibitors were significantly reduced (Figure 4H–J).
Clinicopathological and Prognostic Analysis in TCGA
The analysis of clinicopathological parameters and miR-183-3p expression in TCGA database was carried out in Assistant for Clinical Bioinformatics (https://www.aclbi.com/), and the results indicate that the upregulation of miR-183-3p expression was significantly correlated with tumor size (2 cm as the cutoff value) (P = 0.0017) (Figure 5A), which was consistent with the previous result of our study. In addition, miR-183-3p was found to be relatively higher in LUSC tumor tissue than in LUAD tumor tissue (P < 0.0001) (Figure 5B). In addition, miR-183-3p was also higher in the tumor tissues of smokers than in that of nonsmokers (P = 0.0057) (Figure 5C).
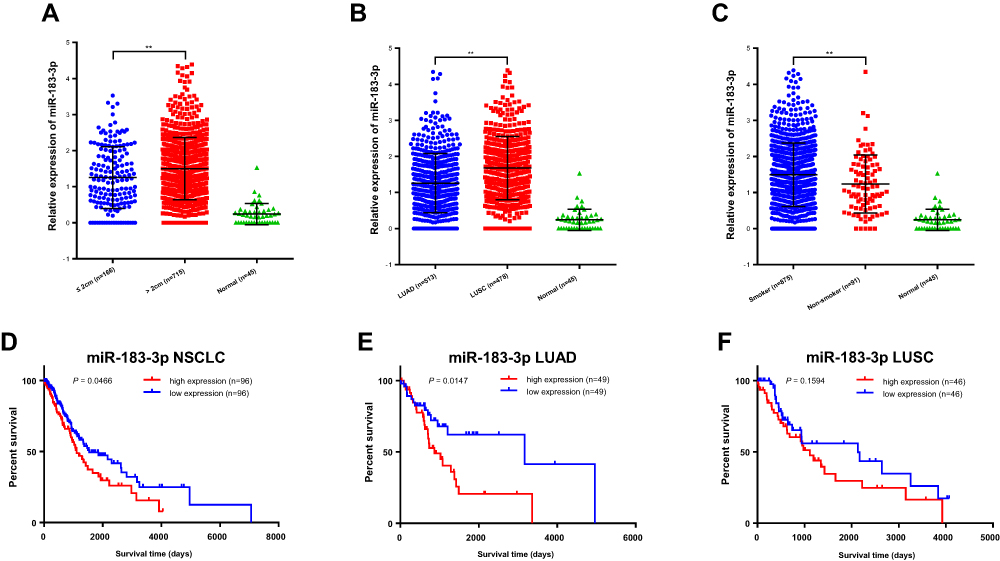 |
Figure 5 Bioinformatics analysis of the clinicopathological significance and prognostic value of miR-183-3p in TCGA database. (A–C) Relative miR-183-3p expression among different tumor sizes (A), histological types (B) and smoking histories (C). **Statistical significance P < 0.01. (D–F) Kaplan-Meier curves of NSCLC cases in TCGA database stratified by miR-183-3p expression (bottom 10% [n = 96] versus top 10% [n = 96]) (D). Further respective analysis in LUAD cases (E) and LUSC cases (F) showed different prognostic value. Abbreviations: LUAD, lung adenocarcinoma; LUSC, lung squamous cell carcinoma. |
We further carried out a prognostic analysis of miR-183-3p and miR-182-5p using cases in TCGA database. For miR-183-3p, 192 NSCLC cases were included for OS analysis. Patients were categorized into a high miR-183-3p expression group (the highest 10%, n = 96) and a low miR-183-3p expression group (the lowest 10%, n = 96) based on the expression level of miR-183-3p. Kaplan–Meier survival analysis revealed a significant correlation between overall survival and miR-183-3p expression (P = 0.0466) (Figure 5D). Further subgroup analysis indicated that miR-183-3p expression was closely related to poor prognosis in LUAD (P = 0.0147) (Figure 5E). This trend was also observed in LUSC cases, even if there was no statistical significance (P = 0.1594) (Figure 5F). However, for miR-182-5p, Kaplan–Meier survival analysis indicated that there was no difference between the high miR-182-5p expression and low miR-182-5p expression groups (for NSCLC, P = 0.0629; for LUAD, P = 0.5560; for LUSC, P = 0.0552) (Supplemental Figure 1).
Discussion
miRNAs are increasingly found to have a potentially important effects on the regulation of malignant progression, and their expression signatures correlate well with specific clinical cancer characteristics.19,20 The miR-183 family, also known as the miR-183 cluster, is a conserved polycistronic miRNA cluster including miR-182-5p, miR-183-5p and miR-96-5p. Some members of this family are always upregulated in various kinds of tumors.21–23 For lung cancer, Zhu et al reported that members of the miR-183 family were highly expressed in lung cancer tissue.14 As a member of the miR-183 family, miR-182-5p has been studied extensively in lung cancer, and the majority of studies referring to lung cancer show that miR-182-5p is significantly increased in tumor tissues and has a cancer-promoting effect.7,8,11,24 miR-182-5p in lung cancer patient serum has also been reported to be a potential diagnostic marker.14
miR-183-3p and miR-183-5p are antisense sequences and are produced from the same precursor miRNA (pre-miRNA). The miR-183-5p expression characteristics in various cancers are inconsistent. For example, miR-183-5p expression is upregulated in several cancer types,25–33 but it decreases in osteosarcoma.34 For lung cancer, studies involving miR-183-5p are limited, and the conclusions are incompatible. Zhang and colleagues35 reported that miR-183-5p was upregulated in tumors and promoted the growth of NSCLC cells through FoxO1 inhibition. However, Meng36 reported in their recent study that miR-183-5p was downregulated in lung cancer and may function as a tumor suppressor. As the reverse complement of miR-183-5p, miR-183-3p has only been reported by a few studies on cancer.37,38 For lung cancer, only F. Xu focused on miR-183-3p expression, but the types of cases included in their study were limited.16
In this study, we included different kinds of histological types of NSCLC patients and paid attention to the clinicopathological significance of miR-183-3p and miR-182-5p in NSCLC.
In tumor tissues, we found that miR-183-3p and miR-182-5p expression was significantly increased compared with that in corresponding nonmalignant tissues (Figure 1A and B) and correlated with tumor size (Table 1). Thus, we speculate that miR-183-3p and miR-182-5p may correlate with tumor growth. In addition, among stage I patients, we found that miR-182-5p in tumor tissues was significantly increased in patients with vascular tumor thrombus. Previous studies reported that vascular tumor thrombus was a poor prognostic indicator for patients with lung cancer,39 esophageal squamous cell carcinoma40 and bladder cancer.41 The correlation between miR-182-5p and vascular tumor thrombus found in this study and the poor prognostic value of vascular tumor thrombus found by previous studies may indicate the potential cancer-promoting effect of miR-182-5p to some extent.
In nonmalignant tissues, we found that these two miRNAs were significantly increased in smokers (Table 2). To data, few studied have reported the effects of smoking on the expression of the miR-183 family or miR-183-3p. Only one study reported that the upregulation of miR-183-5p was observed in the infected abdominal aortic aneurysm tumor tissues of smokers.42 We further explored the relationship between miR-183-3p or miR-182-5p expression in tumor tissues and smoking history in TCGA database, and the results showed that miR-183-3p was also relatively higher in NSCLC cancer tissue of smokers than that of nonsmokers. We speculate that the upregulation of miR-183-3p may be caused by smoking, and the increase in miR-183-3p may further promote the proliferation of lung cancer cells. In addition, miR-182-5p expression in nonmalignant tissues was also higher in patients with larger tumor sizes and in male patients (Table 2). However, we further found that there were more smokers among patients with larger tumor sizes (32/58) than among patients with smaller tumor sizes (5/18). Similarly, there were also more smokers among males (37/47) than females (0/28). Therefore, we speculated that the higher expression of miR-182-5p in nonmalignant tissues in these two groups (patients with larger tumor size and male patients) may be primarily caused by smoking.
As the proliferation-promoting effect of miR-182-5p on lung cancer cell lines has been widely demonstrated by in vitro experiments,9–11 relevant cell phenotype experiments were not included in this study. For miR-183-3p, we performed growth curve assays and colony formation assays in several NSCLC cell lines, and the results indicated that miR-183-3p was positively correlated with cell proliferation (Figure 4A–J). The in vitro experimental results in our study and in previous studies may support the hypothesis that miR-183-3p and miR-182-5p are correlated with tumor growth to some extent.
In addition to the above findings, we also noticed that the expression of miR-183-3p and miR-182-5p in tumor tissues was closely positively correlated (Figure 3A). This positive correlation was also verified in vitro experiments (Figure 3B). At present, the relationship between miR-183-3p and miR-182-5p has not been reported before. The confirmed oncogenic role of miR-182-5p and its close positive correlation with miR-183-3p found by our study may further indicate the oncogenic effect of miR-183-3p. Furthermore, in consideration of the same location of miR-183-3p and miR-182-5p on chromosomes, and their similar expression characteristics, we suspect that miR-183-3p may also be a member of the miR-183 cluster, and may act on the same downstream targets as miR-182-5p. Our further studies will further explore this assumption.
To further explore the clinical value of miR-183-3p and the prognostic value of these two miRNAs in NSCLC, we performed clinicopathological analysis and a survival study in TCGA database. The clinicopathological analysis results indicated that miR-183-3p was highly expressed in tumor tissues (Figure 5A–5C). In addition, miR-183-3p in LUSC tumors was relatively higher than that in LUAD tumors (Figure 5B), which indicates its potential value for distinguishing LUSC from LUAD and thus may influence treatment options. Furthermore, the correlation between miR-183-3p expression and tumor size could also be verified in TCGA database (Figure 5A). The survival analysis results indicate that patients with high expression of miR-183-3p have a relatively shorter overall survival time, which means that this gene is a meaningful indicator of poor prognosis in NSCLC patients (Figure 5D–5F). The prognostic value of miR-182-5p in lung cancer has been widely explored previously, and several studies report that miR-182-5p expression is correlated with shorter survival time in lung cancer patients.12,14,15 However, the survival analysis of miR-182-5p in our study did not find any correlation between miR-182-5p expression and OS. We speculate that the difference in prognosis prediction of these two miRNAs may be due to the different populations included in the survival analysis of these two miRNAs.
In summary, we evaluated the clinical and prognostic values of miR-183-3p and miR-182-5p and further explored the effect of miR-183-3p on NSCLC progression and its relationship with miR-182-5p from different aspects. However, there are still some limitations to this study. First, as miR-183-3p is correlated with malignant biological properties, this gene may also have meaningful diagnostic value, and subsequent studies will explore this further. Second, the patients were included in our study from 2018–10-24 to 2020-1-20. To data, the follow-up data of these patients may not be suitable for prognostic studies. Long-term follow-up of these patients is still in progress, and prognostic research will be present in our later studies.
Conclusion
This study confirmed that miR-183-3p and miR-182-5p are highly expressed in NSCLC tumor tissues and correlated with tumor size. In addition, the expression levels of miR-183-3p and miR-182-5p were closely positively correlated with each other. An increase in miR-183-3p may play an oncogenic role by promoting proliferation and have meaningful prognostic value in NSCLC. Our work might offer some support for the discovery of new prognostic and therapeutic targets in NSCLC.
Data Sharing Statement
The datasets used during the current study are available from the corresponding authors on reasonable request.
Ethical Approval and Exemption of Informed Consent
All specimens in this study were collected from the Clinical Resources Bio-Bank of Beijing Chest Hospital, which was approved by the Ethics Committee of the Beijing Chest Hospital, Capital Medical University. The resource collection and utilization plan of the Bio-Bank was approved by the Ethics Committee of Beijing Chest Hospital, Capital Medical University. The samples were obtained from the surgical resection tissue after pathological examination in Beijing Chest Hospital, Capital Medical University. This study started after patients were discharged from the hospital, and it was impossible to obtain informed consent. Hence, the Ethics Committee approved exemption of informed consent. This study was strictly in accordance with the ethical standards of the Ethics Committee of Beijing Chest Hospital, Capital Medical University and with the Helsinki Declaration and its later amendments. This study strictly protects patients’ privacy and personal information confidentiality. Ethical Approval Number: 2019-71.
Consent for Publication
The information disclosed in this study does not involve identifiable information for included individuals.
Funding
This study was funded by Beijing Municipal Natural Science Foundation (No. 4192062), Beijing Municipal Science and Technology Committee (No. Z151100002115049) and National Natural Science Foundation of China (No. 61801477).
Disclosure
The authors have no conflicts of interest to declare that are relevant to the content of this article.
References
1. Siegel RL, Miller KD, Jemal A. Cancer statistics, 2019. CA Cancer J Clin. 2019;69(1):7–34. doi:10.3322/caac.21551
2. Howlader N, Forjaz G, Mooradian MJ, et al. The effect of advances in lung-cancer treatment on population mortality. N Engl J Med. 2020;383(7):640–649. doi:10.1056/NEJMoa1916623
3. Ward EM, Sherman RL, Henley SJ, et al. Annual report to the nation on the status of cancer, featuring cancer in men and women age 20–49 Years. J Natl Cancer Inst. 2019;111(12):1279–1297. doi:10.1093/jnci/djz106
4. Liang G, Meng W, Huang X, et al. miR-196b-5p-mediated downregulation of TSPAN12 and GATA6 promotes tumor progression in non-small cell lung cancer. Proc Natl Acad Sci U S A. 2020;117(8):4347–4357. doi:10.1073/pnas.1917531117
5. Lin S, Gregory RI. MicroRNA biogenesis pathways in cancer. Nat Rev Cancer. 2015;15(6):321–333. doi:10.1038/nrc3932
6. Dambal S, Shah M, Mihelich B, Nonn L. The microRNA-183 cluster: the family that plays together stays together. Nucleic Acids Res. 2015;43(15):7173–7188. doi:10.1093/nar/gkv703
7. Ning FL, Wang F, Li ML, Yu ZS, Hao YZ, Chen SS. MicroRNA-182 modulates chemosensitivity of human non-small cell lung cancer to cisplatin by targeting PDCD4. Diagn Pathol. 2014;9(1):143. doi:10.1186/1746-1596-9-143
8. Wang M, Wang Y, Zang W, et al. Downregulation of microRNA-182 inhibits cell growth and invasion by targeting programmed cell death 4 in human lung adenocarcinoma cells. Tumour Biol. 2014;35(1):39–46. doi:10.1007/s13277-013-1004-8
9. Chang H, Liu YH, Wang LL, et al. MiR-182 promotes cell proliferation by suppressing FBXW7 and FBXW11 in non-small cell lung cancer. Am J Transl Res. 2018;10(4):1131–1142.
10. Wang M, Wang W, Wang J, Zhang J. MiR-182 promotes glucose metabolism by upregulating hypoxia-inducible factor 1alpha in NSCLC cells. Biochem Biophys Res Commun. 2018;504(2):400–405. doi:10.1016/j.bbrc.2018.06.035
11. Yang WB, Chen PH, Hsu T, et al. Sp1-mediated microRNA-182 expression regulates lung cancer progression. Oncotarget. 2014;5(3):740–753. doi:10.18632/oncotarget.1608
12. Zou JG, Ma LF, Li X, et al. Circulating microRNA array (miR-182, 200b and 205) for the early diagnosis and poor prognosis predictor of non-small cell lung cancer. Eur Rev Med Pharmacol Sci. 2019;23(3):1108–1115. doi:10.26355/eurrev_201902_17001
13. Zhu W, Zhou K, Zha Y, et al. Diagnostic value of serum miR-182, miR-183, miR-210, and miR-126 levels in patients with early-stage non-small Cell lung cancer. PLoS One. 2016;11(4):e0153046. doi:10.1371/journal.pone.0153046
14. Zhu W, Liu X, He J, Chen D, Hunag Y, Zhang YK. Overexpression of members of the microRNA-183 family is a risk factor for lung cancer: a case control study. BMC Cancer. 2011;11(1):393. doi:10.1186/1471-2407-11-393
15. Peng Z, Pan L, Niu Z, et al. Identification of microRNAs as potential biomarkers for lung adenocarcinoma using integrating genomics analysis. Oncotarget. 2017;8(38):64143–64156. doi:10.18632/oncotarget.19358
16. Xu F, Zhang H, Su Y, Kong J, Yu H, Qian B. Up-regulation of microRNA-183-3p is a potent prognostic marker for lung adenocarcinoma of female non-smokers. Clin Trans Oncol. 2014;16(11):980–985. doi:10.1007/s12094-014-1183-9
17. Kozomara A, Griffiths-Jones S. miRBase: annotating high confidence microRNAs using deep sequencing data. Nucleic Acids Res. 2014;42(D1):D68–73. doi:10.1093/nar/gkt1181
18. Anaya J. OncoLnc: linking TCGA survival data to mRNAs, miRNAs, and lncRNAs. PeerJ Comput Sci. 2016;2(2):e67. doi:10.7717/peerj-cs.67
19. Wang S, Zhao X, Wang J, et al. Upregulation of microRNA-203 is associated with advanced tumor progression and poor prognosis in epithelial ovarian cancer. Medical Oncol. 2013;30(3):681. doi:10.1007/s12032-013-0681-x
20. Vosa U, Vooder T, Kolde R, et al. Identification of miR-374a as a prognostic marker for survival in patients with early-stage nonsmall cell lung cancer. Genes Chromosomes Cancer. 2011;50(10):812–822. doi:10.1002/gcc.20902
21. Yuan D, Li K, Zhu K, Yan R, Dang C. Plasma miR-183 predicts recurrence and prognosis in patients with colorectal cancer. Cancer Biol Ther. 2015;16(2):268–275. doi:10.1080/15384047.2014.1002327
22. Huangfu L, Liang H, Wang G, et al. miR-183 regulates autophagy and apoptosis in colorectal cancer through targeting of UVRAG. Oncotarget. 2016;7(4):4735–4745. doi:10.18632/oncotarget.6732
23. Lowery AJ, Miller N, Dwyer RM, Kerin MJ. Dysregulated miR-183 inhibits migration in breast cancer cells. BMC Cancer. 2010;10(1):502. doi:10.1186/1471-2407-10-502
24. Vosa U, Vooder T, Kolde R, Vilo J, Metspalu A, Annilo T. Meta-analysis of microRNA expression in lung cancer. Int J Cancer. 2013;132(12):2884–2893. doi:10.1002/ijc.27981
25. Myatt SS, Wang J, Monteiro LJ, et al. Definition of microRNAs that repress expression of the tumor suppressor gene FOXO1 in endometrial cancer. Cancer Res. 2010;70(1):367–377. doi:10.1158/0008-5472.CAN-09-1891
26. Chen L, Li Y, Fu Y, et al. Role of deregulated microRNAs in breast cancer progression using FFPE tissue. PLoS One. 2013;8(1):e54213. doi:10.1371/journal.pone.0054213
27. Han Y, Chen J, Zhao X, et al. MicroRNA expression signatures of bladder cancer revealed by deep sequencing. PLoS One. 2011;6(3):e18286. doi:10.1371/journal.pone.0018286
28. Bandres E, Cubedo E, Agirre X, et al. Identification by Real-time PCR of 13 mature microRNAs differentially expressed in colorectal cancer and non-tumoral tissues. Mol Cancer. 2006;5(1):29. doi:10.1186/1476-4598-5-29
29. Schaefer A, Jung M, Mollenkopf HJ, et al. Diagnostic and prognostic implications of microRNA profiling in prostate carcinoma. Int J Cancer. 2010;126(5):1166–1176. doi:10.1002/ijc.24827
30. Zheng WW, Huang CM, Xie JW, et al. [Expression of microRNA-183 in stage II (gastric cancer and its association with Ezrin protein]. Zhonghua Wei Chang Wai Ke Za Zhi. 2012;15(7):723–726. Chinese.
31. Li J, Liang S, Jin H, Xu C, Ma D, Lu X. Tiam1, negatively regulated by miR-22, miR-183 and miR-31, is involved in migration, invasion and viability of ovarian cancer cells. Oncol Rep. 2012;27(6):1835–1842. doi:10.3892/or.2012.1744
32. Mian C, Pennelli G, Fassan M, et al. MicroRNA profiles in familial and sporadic medullary thyroid carcinoma: preliminary relationships with RET status and outcome. Thyroid. 2012;22(9):890–896. doi:10.1089/thy.2012.0045
33. Yamada Y, Enokida H, Kojima S, et al. MiR-96 and miR-183 detection in urine serve as potential tumor markers of urothelial carcinoma: correlation with stage and grade, and comparison with urinary cytology. Cancer Sci. 2011;102(3):522–529. doi:10.1111/j.1349-7006.2010.01816.x
34. Zhu J, Feng Y, Ke Z, et al. Down-regulation of miR-183 promotes migration and invasion of osteosarcoma by targeting Ezrin. Am J Pathol. 2012;180(6):2440–2451. doi:10.1016/j.ajpath.2012.02.023
35. Zhang L, Quan H, Wang S, Li X, Che X. MiR-183 promotes growth of non-small cell lung cancer cells through FoxO1 inhibition. Tumour Biol. 2015;36(10):8121–8126. doi:10.1007/s13277-015-3550-8
36. Meng F, Zhang L. miR-183-5p functions as a tumor suppressor in lung cancer through PIK3CA inhibition. Exp Cell Res. 2019;374(2):315–322. doi:10.1016/j.yexcr.2018.12.003
37. Li Y, He S, Zhan Y, et al. microRNA-183-3p inhibits progression of human prostate cancer by downregulating high-mobility group nucleosome binding domain 5. DNA Cell Biol. 2019;38(8):840–848. doi:10.1089/dna.2019.4642
38. Zhang C, Lian H, Xie L, Yin N, Cui Y. LncRNA ELFN1-AS1 promotes esophageal cancer progression by up-regulating GFPT1 via sponging miR-183-3p. Biol Chem. 2020;401(9):1053–1061. doi:10.1515/hsz-2019-0430
39. Li Z, Yu Y, Lu J, et al. Analysis of the T descriptors and other prognosis factors in pathologic stage I non-small cell lung cancer in China. J Thorac Oncol. 2009;4(6):702–709. doi:10.1097/JTO.0b013e3181a5269d
40. Zhao H, Chen W, Wu J, Wang L, Mao W. Clinical significance of preoperative serum tumor markers in esophageal squamous cell carcinoma. J Cancer Res Ther. 2014;10 Suppl:C179–185. doi:10.4103/0973-1482.145863
41. Wu J, Xu H, Ji H, et al. Low expression of keratin17 is related to poor prognosis in bladder cancer. Onco Targets Ther. 2021;14:577–587. doi:10.2147/OTT.S287891
42. Meng C, Guo Z, Li D, et al. miR-183 and miR-141 in lesion tissues are potential risk factors for poor prognosis in patients with infected abdominal aortic aneurysm. Exp Ther Med. 2018;16(6):4695–4699. doi:10.3892/etm.2018.6733
 © 2021 The Author(s). This work is published and licensed by Dove Medical Press Limited. The full terms of this license are available at https://www.dovepress.com/terms.php and incorporate the Creative Commons Attribution - Non Commercial (unported, v3.0) License.
By accessing the work you hereby accept the Terms. Non-commercial uses of the work are permitted without any further permission from Dove Medical Press Limited, provided the work is properly attributed. For permission for commercial use of this work, please see paragraphs 4.2 and 5 of our Terms.
© 2021 The Author(s). This work is published and licensed by Dove Medical Press Limited. The full terms of this license are available at https://www.dovepress.com/terms.php and incorporate the Creative Commons Attribution - Non Commercial (unported, v3.0) License.
By accessing the work you hereby accept the Terms. Non-commercial uses of the work are permitted without any further permission from Dove Medical Press Limited, provided the work is properly attributed. For permission for commercial use of this work, please see paragraphs 4.2 and 5 of our Terms.