")
Back to Journals » OncoTargets and Therapy » Volume 14
Clinical Significance of ADAMTS19, BMP7, SIM1, and SFRP1 Promoter Methylation in Renal Clear Cell Carcinoma
Authors Kubiliute R, Zalimas A, Bakavicius A, Ulys A, Jankevicius F, Jarmalaite S
Received 23 July 2021
Accepted for publication 23 August 2021
Published 5 October 2021 Volume 2021:14 Pages 4979—4990
DOI https://doi.org/10.2147/OTT.S330341
Checked for plagiarism Yes
Review by Single anonymous peer review
Peer reviewer comments 2
Editor who approved publication: Dr William C. Cho
Raimonda Kubiliute,1,2 Algirdas Zalimas,1,2 Arnas Bakavicius,2– 4 Albertas Ulys,2 Feliksas Jankevicius,3,4 Sonata Jarmalaite1,2
1Institute of Biosciences, Life Sciences Center, Vilnius University, Vilnius, Lithuania; 2National Cancer Institute, Vilnius, Lithuania; 3Vilnius University Hospital Santaros Klinikos, Vilnius, Lithuania; 4Institute of Clinical Medicine, Faculty of Medicine, Vilnius University, Vilnius, Lithuania
Correspondence: Sonata Jarmalaite
National Cancer Institute, Santariskiu 1, Vilnius, LT‑08406, Lithuania
Email [email protected]
Background: Clear cell renal cell carcinoma (ccRCC) is the most common subtype of kidney tumors, accounting for the majority of deaths from genitourinary cancers. The currently used nomograms for predicting patient outcomes are based on clinical-pathological characteristics only; however, a significant number of ccRCC survivors with similar radiological and histological features still demonstrate a different clinical course of the disease. This study aimed at the identification of novel DNA methylation biomarkers for the monitoring of patients with ccRCC.
Methods: Gene expression profiling by SurePrint G3 Human GE 8× 60K Microarrays was performed in 4 ccRCC tissues and adjacent non-cancerous renal tissue (NRT) samples. Four down-regulated genes were selected for further DNA methylation status analysis in 123 ccRCC and 45 NRT samples using methylation-specific PCR (MSP).
Results: DNA methylation changes of ADAMTS19, BMP7, SIM1, and SFRP1 were cancer-specific with significantly (P< 0.050) higher methylation frequency (37%, 20%, 18%, and 42%, respectively) in tumor tissues. The methylated status of at least one gene was significantly related to various clinical-pathological parameters, including tumor size, Fuhrman and WHO/ISUP grades, intravascular invasion, and necrosis. Moreover, the methylated status of multimarker panel ADAMTS19, BMP7 & SFRP1 was predictive for poorer overall survival (HR, 4.11; 95% CI, 1.22– 13.86).
Conclusion: In conclusion, DNA methylation of the three-gene panel consisting of ADAMTS19, BMP7 & SFRP1 supposedly predicts the outcome of patients diagnosed with ccRCC and possibly might be used to enrich the current prognostic tools.
Keywords: clear cell renal cell carcinoma, DNA methylation, prognostic biomarkers
Introduction
Renal cell carcinoma (RCC) ranks among the top 10 cancers in the world for both sexes and is the 6th most frequently diagnosed cancer in men and the 10th in women.1 Clear cell RCC (ccRCC) is the most common subtype (70–80%) which arises from the proximal convoluted tubule and is characterized by inferior metastatic-free survival and cancer-specific survival rates, as well as accounting for the majority of deaths from kidney cancer.2
The incidence of RCC in the modern era of medicine is increasing, mainly due to the extensive use of non-invasive imaging techniques for various non-specific symptoms or other abdominal diseases.3 While the vast majority of RCC cases are localized diseases, 25–40% of patients treated with curative intent will develop progressive disease, and even 20–30% of patients are present with metastasis at diagnosis.3,4 Among patients with local disease, the 5-years survival rate reaches 93%, but once metastases are present the prognoses are much worse and the probability of a 5-year survival may be as low as 12%.5 The currently used nomograms for predicting patient outcome and treatment decision making, such as the University of California Los Angeles Integrated Staging System (UISS) and the Stage Size Grade Necrosis (SSIGN), are based on clinicopathological characteristics only.6–8 However, a significant number of RCC survivors with similar radiological and histological features demonstrate a different clinical course of the disease.9 Thus, novel molecular markers and genomic classifiers, containing molecular information from the RCC genome, are urgently needed, which would provide valuable information about disease aggressiveness and prognosis, as well as assist in treatment decision making.
Epigenetic modifications, including DNA methylation, are responsible for tissue-specific gene expression during normal growth and development.10 However, aberrant DNA methylation also plays an important role in carcinogenesis mainly through DNA hypermethylation-caused silencing of tumor suppressor genes.11 DNA methylation affects several signaling pathways, important for both, normal renal tissue development and carcinogenesis, including angiogenesis, cell adhesion, epithelial–mesenchymal transition (EMT), as well as WNT/β-catenin signaling pathway.12 Besides, alterations in DNA methylation occur early during ccRCC development and are observable even in the precancerous stages.13,14 In addition, increased gene promoter hypermethylation frequencies in higher stage and grade renal tumors are also observed, and even can be associated with survival outcomes.15,16 Based on this, DNA methylation in specific genes can serve for early RCC detection and prognosis prediction; however, no such RCC-specific biomarker has reached the clinic yet, and further studies in this field are needed.
In the present study, global gene expression profiling in tissues of ccRCC and paired non-cancerous renal tissues utilizing microarray technology were performed. Comparison of gene down-regulation with the previously reported DNA hypermethylation profile of the same ccRCC biosamples allowed for the selection of four genes for further DNA methylation analysis and validation utilizing methylation-specific PCR. In this study, the prognostic potential of the multimarker panel consisting of ADAMTS19, BMP7 & SFRP1 outperformed the prognostic value of clinical variables, such as tumor stage or tumor necrosis.
Materials and Methods
Patients and Samples
For the study, fresh-frozen cancerous tissue samples were collected retrospectively from 123 treatment-naïve ccRCC patients, who underwent partial or radical nephrectomy at Vilnius University Hospital Santaros Klinikos (Lithuania) between 2013 and 2016. Forty-five adjacent non-cancerous renal tissue (NRT) samples were available from the same cohort of patients as a control group and were collected as previously described.17 A small amount of samples were immediately put into liquid nitrogen and stored at –80 °C. All tissue specimens were evaluated by an expert pathologist. Tumors were evaluated and categorized according to the pathological stage and histological subtype, as described previously,18,19 while nuclear differentiation was graded according to the Fuhrman20 and World Health Organization/International Society of Urological Pathology21 grading systems. The clinical patient characteristics are summarized in Supplementary Table S1. The inclusion and exclusion criteria encompass the following: 1) patients of >18 years old; 2) approved pT1-pT4 stage treatment-naïve tumor and 3) pure ccRCC histology without sarcomatoid differentiation. The median follow-up time (available for 107 patients) was 59 months (range, 1–79 months), including 21 death cases. The study was conducted following the Declaration of Helsinki and approved by the Regional Bioethics Committee (No.: 158200˗18/12˗1077˗585). Written informed consent was obtained from all participants.
RNA Purification
Renal tissue samples were put in liquid nitrogen and homogenized by cryoPREP™ CP02 Impactor using tissue TUBE TT1 (Covaris, Woburn, MA, USA) tubes. Total RNA from homogenized tissue powder was extracted using mirVana Kit (Ambion, Thermo Fisher Scientific, Foster City, CA, USA) according to the protocol provided by the manufacturer. The quantity of the RNA samples was checked spectrophotometrically by the NanoDrop 2000 (Thermo Fisher Scientific, Wilmington, NC, USA). The integrity of the RNA samples was evaluated electrophoretically on the 1% agarose gel using 2 × RNA Loading Dye (Thermo Fisher Scientific) according to the manufacturer’s recommendations. Only samples with high integrity were used for global gene expression profiling.
Global Gene Expression Profiling and Gene Selection
Global gene expression profiling (GEO accession identifier GSE168845) of 8 renal tissues samples from 4 ccRCC cases and paired NRT samples was performed using SurePrint G3 Human Gene Expression (v2) 8×60 K microarrays (design ID 072363; Agilent Technologies). Microarray hybridization was performed according to the manufacturer’s protocol for One-Color Microarray-Based Gene Expression Analysis version 6.9.1 (Agilent Technologies). Briefly, 100 ng of purified total RNA was labeled and amplified using Low Input Quick Amp Labeling Kit, and RNA Spike-In Kit (both from Agilent Technologies) reagents. After amplification, RNA was purified with RNeasy Mini Kit (Qiagen, Valencia, CA, USA) and hybridized onto microarray for 17 h at 65 °C in a rotating hybridization oven (Agilent Technologies). After hybridization, microarrays were washed in the buffer system using the Gene Expression Wash Buffer Kit and immediately scanned with the SureScan microarray scanner (Agilent Technologies). The quantitative values from the obtained images were retrieved using Feature Extraction software v10.7.3. GeneSpring GX v12.6.0 (Agilent Technologies) software was used for data preprocessing and analysis.
Probes with saturated, non-uniform, and outlier signal values were filtered out before the further normalization. Each sample dataset was log2-transformed and 75-percentile normalized without baseline transformation. Annotations of each probe were uploaded from the eArray platform according to the microarray design. Fold change (FC) values were estimated, and a paired t-test was used for comparing the two groups. Differences in gene expression levels were evaluated as significant when FC was ≥2.0 and P < 0.050.
Further, mRNA expression profile was compared with DNA methylation data of the same samples, previously conducted by our group (NCBI; accession number GSE166734), and 54 genes simultaneously downregulated and hypermethylated were identified. The gene set enrichment analysis (GSEA) for these genes was conducted with the publicly available online GSEA tool and the Molecular Signatures Database (MSigDB, v5.2; http://software.broadinstitute.org/gsea), both supported by Broad Institute (Cambridge, MA, USA). The collection of Gene Ontology: “biological processes” were selected for the enrichment analysis. Based on this analysis and available literature data on the putative contribution of the particular genes to the cancer development and/or progression, four genes, ADAMTS19, BMP7, SIM1, and SFRP1, were selected for further DNA methylation analysis.
DNA Purification and Bisulfite Conversion
Snap-frozen sections of renal tissue samples, ground to powder using liquid nitrogen, or leukocytes of healthy individuals were treated with 20–25 μL of proteinase K (Thermo Scientific™, Thermo Fisher Scientific, Wilmington, DE, USA) and 500 μL of lysis buffer, consisting of 1 mM EDTA, 50 mM Tris-HCl pH 8.5, and 0.5% Tween-20 (all from Carl Roth, Karlsruhe, Germany) overnight (up to 18 h) at 55 °C. Afterwards, DNA was isolated and purified using the standard phenol-chloroform protocol and precipitated with ethanol. The quantity and purity of the extracted DNA were measured with NanoDrop™ 2000 spectrophotometer (Thermo Scientific™).
For DNA methylation analysis using qualitative methylation-specific PCR (MSP), 400 ng of purified DNA were converted with bisulfite, using the EZ DNA Methylation™ Kit (Zymo Research, Irvine, CA, USA) according to the manufacturer’s protocol. However, different from the protocol, the initial step was performed for 15 min at 42 °C. For the elution, 40 μL of elution buffer was used. Prepared DNA samples were analyzed immediately or stored at −20 °C.
Qualitative Methylation-Specific PCR
The bisulfite-converted DNA was used as the template for MSP. The MSP primers for unmethylated and methylated DNA for genes ADAMTS19, BMP7, SIM1, and SFRP1 were designed using Methyl Primer Express® Software v1.0 (Applied Biosystems™, Thermo Fisher Scientific, Carlsbad, CA, USA), and retrieved from Metabion (Martinsried, Germany) (Supplementary Table S2). The reaction mix of MSP (25 μL in total) consisted of 1× PCR Gold Buffer, 2.5 mM MgCl2, 0.4 mM of each dNTP, 1.25 U AmpliTaq Gold® 360 DNA Polymerase (Applied Biosystems™, Thermo Scientific™), 1 μL of 360 GC Enhancer, 1 μM of each primer, and ~10 ng of the bisulfite-treated DNA. Before the analysis, the reaction conditions were optimized and consisted of 10 min at 95 °C, 34–36 cycles of 45 s at 95 °C, primer annealing for 45 s at 58–62°C (Supplementary Table S2), and elongation for 45 s at 72 °C, followed by 5–10 min at 72 °C of final extension.
Bisulfite-modified human leukocyte DNA was used as unmethylated control (UC). For methylated control (MC), human leukocyte DNA was treated by CpG Methyltransferase M.SssI (Thermo Scientific™) according to the manufacturer’s protocol followed by the bisulfite conversion. For each primer pair, UC, MC, and non-template control (NTC) were included in all MSP assays. Amplification products were analyzed on 3% agarose gel with 1X TAE buffer and ethidium bromide (Carl Roth GmbH, Co., KG) visualizing under UV light. Representative gel electrophoresis images of PCR are provided in Supplementary Figure S1. The individual biomarker was considered as methylated if the amplification product in the sample with primers, specific to methylated DNA, was detected. A biomarker was considered unmethylated if the amplification product in the sample with primers, specific only for unmethylated DNA, was detected and there was no amplification product with the primers specific for the methylated DNA.
Statistical Analysis
Statistical analyses were performed by MedCalc® v14.0 software (MedCalc Software, Ostend, Belgium), and STATISTICA™ v8.0 (StatSoft, Tulsa, OK, USA). The Wilcoxon–Mann–Whitney test was applied to compare non-parametric variables between the two groups. Meanwhile, for comparison of categorical variables, the 2-sided Fisher’s exact test was used. The diagnostic performance of biomarkers was evaluated by calculating diagnostic test selectivity parameters, including sensitivity, specificity, positive predictive value (PPV), and negative predictive value (NPV). For multimarker panel analysis, the particular panel of genes was considered methylated if at least one gene was methylated, and the panel was considered unmethylated if all genes in that panel were unmethylated. For time-event analysis, Kaplan–Meier curves were used to calculate survival estimates. The Cox proportional hazards modeling was performed to estimate the hazard ratio (HR) of death with 95% confidence intervals (CI). After univariate analysis, Cox proportional hazards regression models were used to select variables with P values lower than 0.050 for the multivariate analysis.
Results
Global Gene Expression Analysis and Biomarkers Selection
Microarray-based transcriptome analysis identified 3942 genes that were significantly deregulated (P < 0.050) with fold change (FC) value of ≥2 in 4 ccRCC samples, while compared to NRT, and half of these genes (N = 1957) were down-regulated (Figure 1A). Compared with our previously published DNA methylation data of the same samples (GSE166734), significantly deregulated (P < 0.050) methylation was observed in 1775 probes (F ≥ 1.5) (Figure 1B) corresponding to 450 genes of which 425 were hypermethylated in ccRCC tissues. Fifty-four genes in total were simultaneously downregulated and hypermethylated in the ccRCC tissues (Figure 1C and Supplementary Table S3). According to the Gene Ontology biological process enrichment analysis, the overlapped genes are involved in various processes related to kidney development (Supplementary Table S4). According to this analysis and the available literature on gene contribution to the cancer hallmarks as well as the technical feasibility of targeted methylation-specific PCR analysis, four genes, ADAMTS19, BMP7, SIM1, and SFRP1, were selected for further investigations (Table 1).
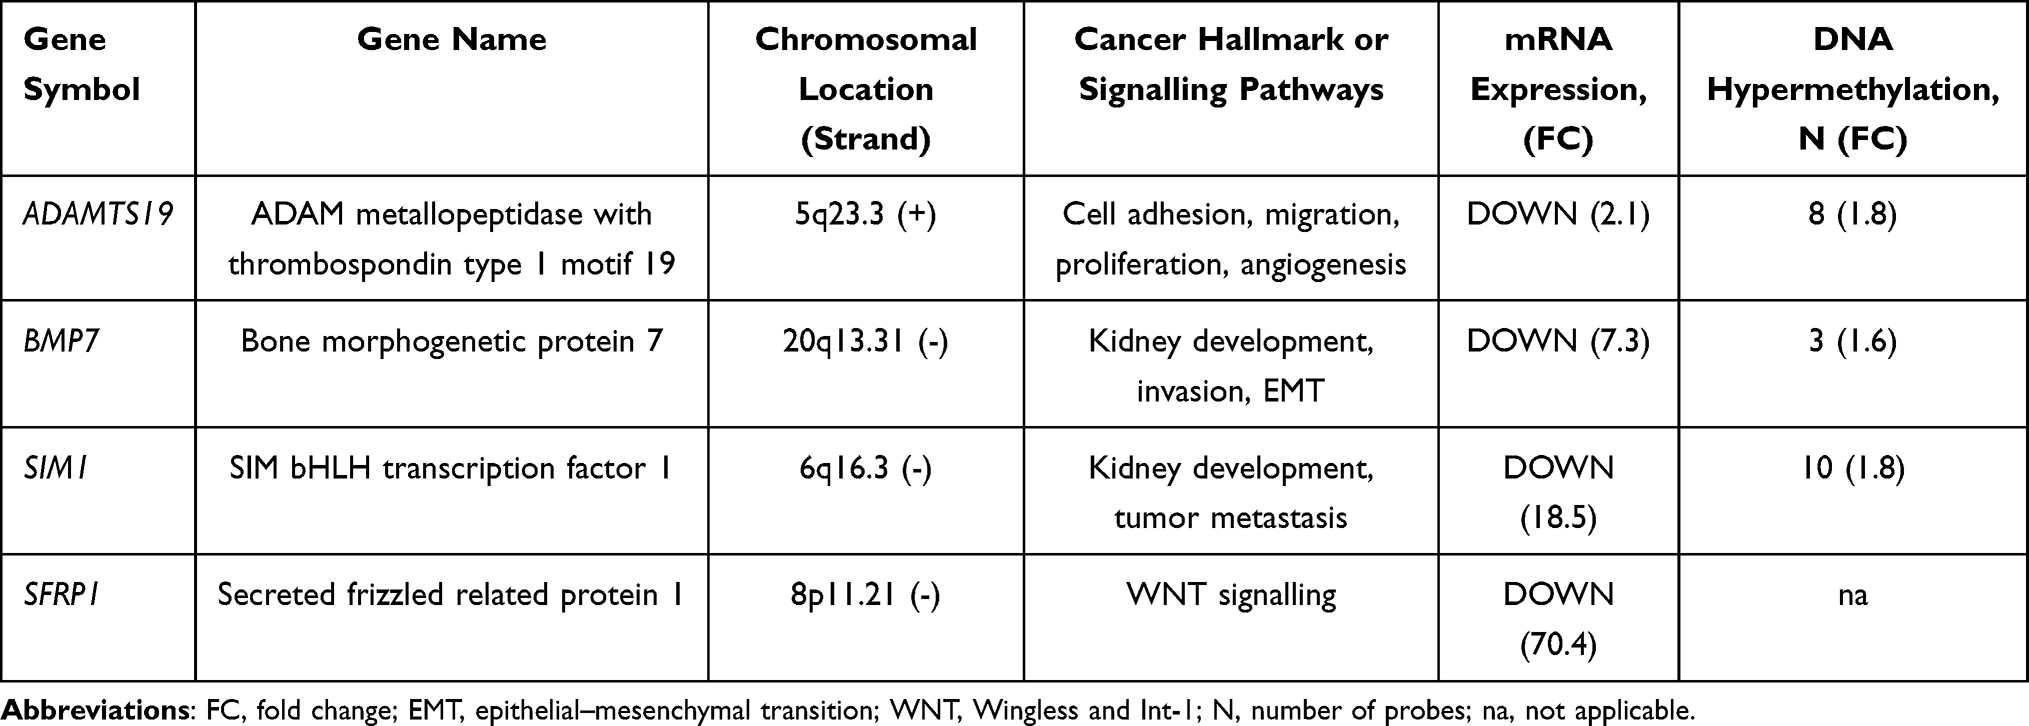 |
Table 1 Genes Selected for Targeted DNA Methylation Analysis |
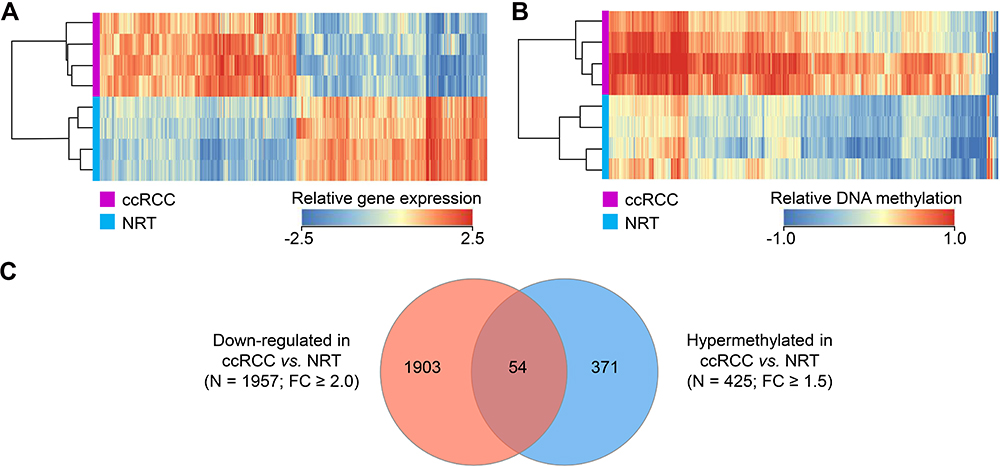 |
Figure 1 Global gene expression in renal tissues and comparison with DNA methylation status. (A) Gene expression profile of the genes that were differentially expressed (N = 3942, FC ≥ 2, P < 0.050) in the cancerous renal tissues (ccRCC) and non-cancerous (NRT) samples; (B) DNA methylation profile of the genes that were differentially methylated (N = 461, FC ≥ 1.5, P < 0.050) in ccRCC and NRT samples; (C) Venn diagram of the down-regulated and hypermethylated genes. Abbreviation: FC, fold change. |
DNA Methylation Analysis and Diagnostic Value of the Selected Genes
Compared to the NRT, significantly higher methylation frequencies of ADAMTS19, BMP7, SIM1, and SFRP1 were detected in ccRCC samples, which reached 37.4%, 20.3%, 17.9%, and 42.3%, respectively, while no methylation was identified in NRT (Figure 2A). Significantly higher methylation frequencies of ADAMTS19 and BMP7 were observed in male ccRCC tissue samples, while compared to females (P = 0.003 and P = 0.007, respectively; Figure 2B).
 |
Figure 2 DNA methylation frequencies of ADAMTS19, BMP7, SIM1, and SFRP1 in renal tissues. (A) Methylation frequencies in ccRCC and NRT samples; (B) methylation frequencies in ccRCC tissues according to patients’ gender. Significant P-values are in bold. Abbreviations: ccRCC, clear cell renal cell carcinoma; NRT, noncancerous renal tissues. |
Diagnostic parameters, including sensitivity, specificity, PPV, and NPV were calculated for single biomarkers, as well as for various multi-gene panels to evaluate the ability of hypermethylated genes to distinguish ccRCC from NRT (Table 2). Individual biomarkers have demonstrated specificity and PPV of 100% in diagnosing ccRCC in both genders, while the highest sensitivity and NPV (61.8% and 52.9%, respectively) were reached by the four-gene panel.
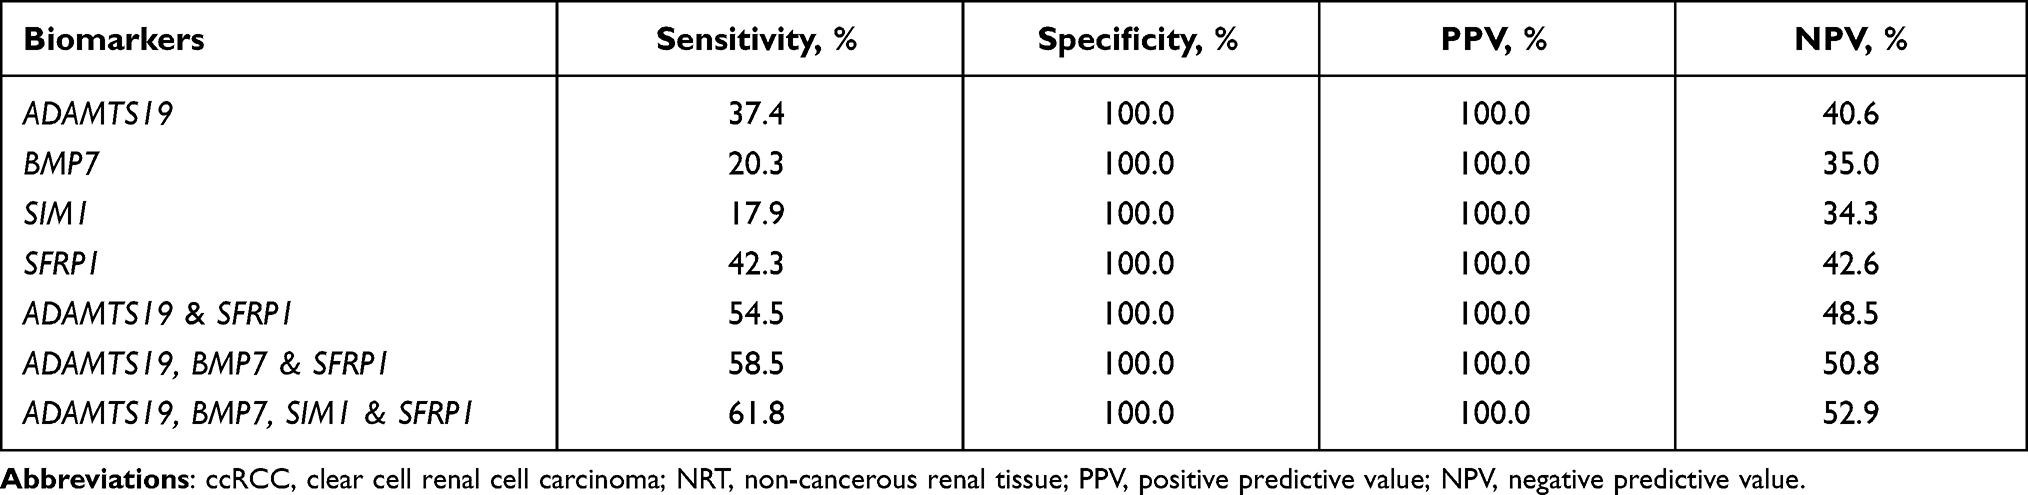 |
Table 2 The Diagnostic Test Performance Characteristics of the Analyzed Methylation Biomarkers in Renal Tissues (123 ccRCC and 45 NRT Samples) |
Prognostic Value of the Investigated Biomarkers
Aberrant methylation of these genes was further analyzed according to the clinical-pathological characteristics of the disease. Methylation frequencies of ADAMTS19, BMP7, and SIM1 significantly increased as tumor size increased (all P < 0.050; Figure 3A), and the same tendency was observed for pT staging (P > 0.050; Figure 3B). Moreover, more frequent ADAMTS19 methylation was detected in tumors harboring higher Fuhrman and WHO/ISUP grades, as well as with vascular invasion (all P < 0.050; Figure 3C–E), while increased methylation frequency of BMP7 was associated with higher WHO/ISUP grade and presence of tumor necrosis (P = 0.011 and P = 0.038, respectively; Figure 3D and F).
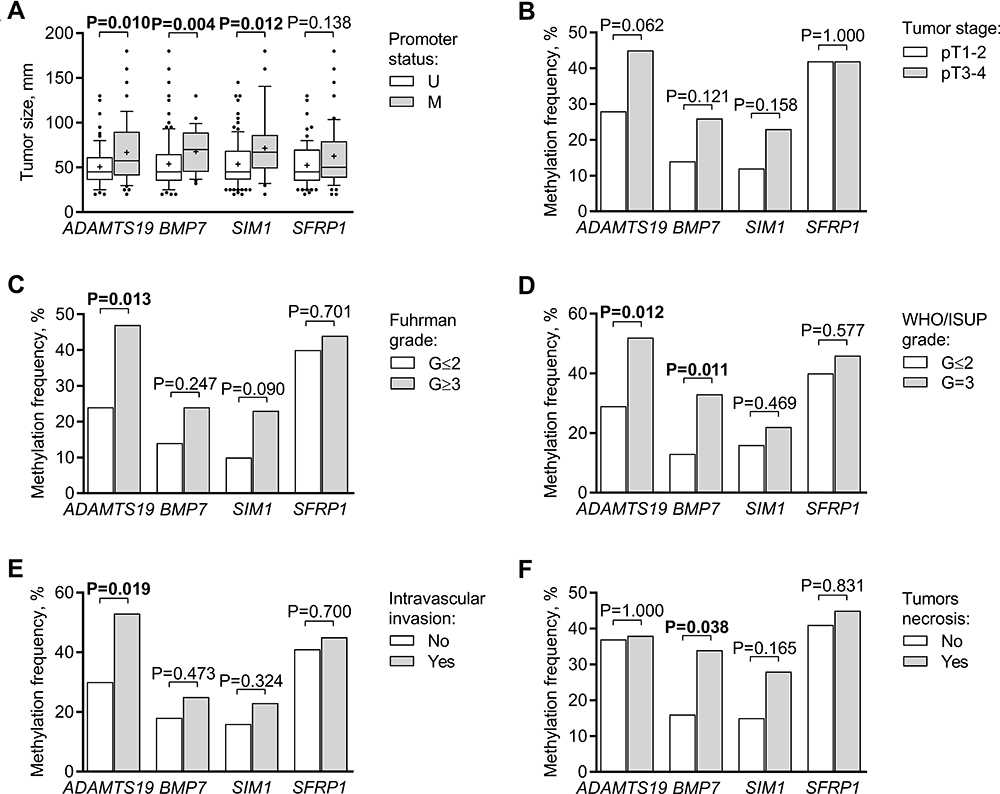 |
Figure 3 DNA methylation frequencies of ADAMTS19, BMP7, SIM1, and SFRP1 in ccRCC according to clinicopathological characteristics of the disease. Methylation frequencies according to (A) tumor size, (B) tumor stage, (C) Fuhrman grade, (D) WHO/ISUP grade, (E) tumor intravascular invasion, (F) tumor necrosis. The box depicts the 25th and 75th percentiles; the line inside the box reflects the median; the plus sign depicts the mean; the whiskers marked the 10–90% range, and data values out of that range are shown as dots. Significant P-values are in bold. Abbreviations: pT, pathological stage; WHO/ISUP, World Health Organization/International Society of Urological Pathology; G, grade; M, methylated; U, unmethylated. |
To investigate the ability of the analyzed biomarkers to predict overall survival (OS) after radical therapy, Kaplan-Meier curves were depicted. Although no association between methylation status of any single biomarker and OS was observed (P > 0.050; Figure 4A–D), the combinations of ADAMTS19, BMP7 & SFRP1, as well as ADAMTS19, BMP7, SFRP1 & SIM1, when at least one gene was methylated, were significant predictors for shorter OS (P = 0.020 and P = 0.042, respectively; Figure 4E and F, Supplementary Table S5).
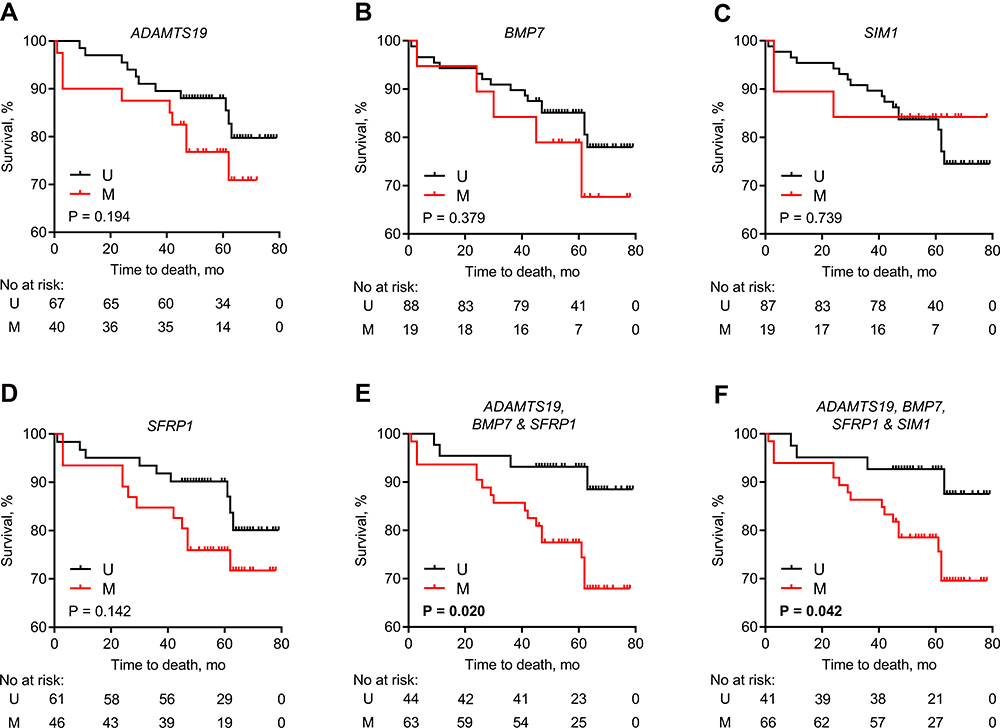 |
Figure 4 The association between methylation status of analyzed genes and overall survival. Kaplan–Meier curve analysis of (A) ADAMTS19, (B) BMP7, (C) SIM1, (D) SFRP1, (E) a combination of ADAMTS19, BMP7 & SFRP1, and (F) combination of ADAMTS19, BMP7, SFRP1 & SIM1 genes promoter methylation status. For the gene combinations, only panels showing the significant association with patients’ overall survival are depicted. The numbers of patients at risk are provided below each graph. Significant P-values are in bold. Abbreviations: M, methylated; U, unmethylated. |
Univariate Cox proportional hazard regression analysis confirmed the association of methylated status of ADAMTS19, BMP7 & SFRP1 with OS (P = 0.029; Table 3). Moreover, in the multivariate analysis, only patients’ age, tumor necrosis, and methylation status of the ADAMTS19, BMP7 & SFRP1 panel retained independent prognostic value for OS (Table 3).
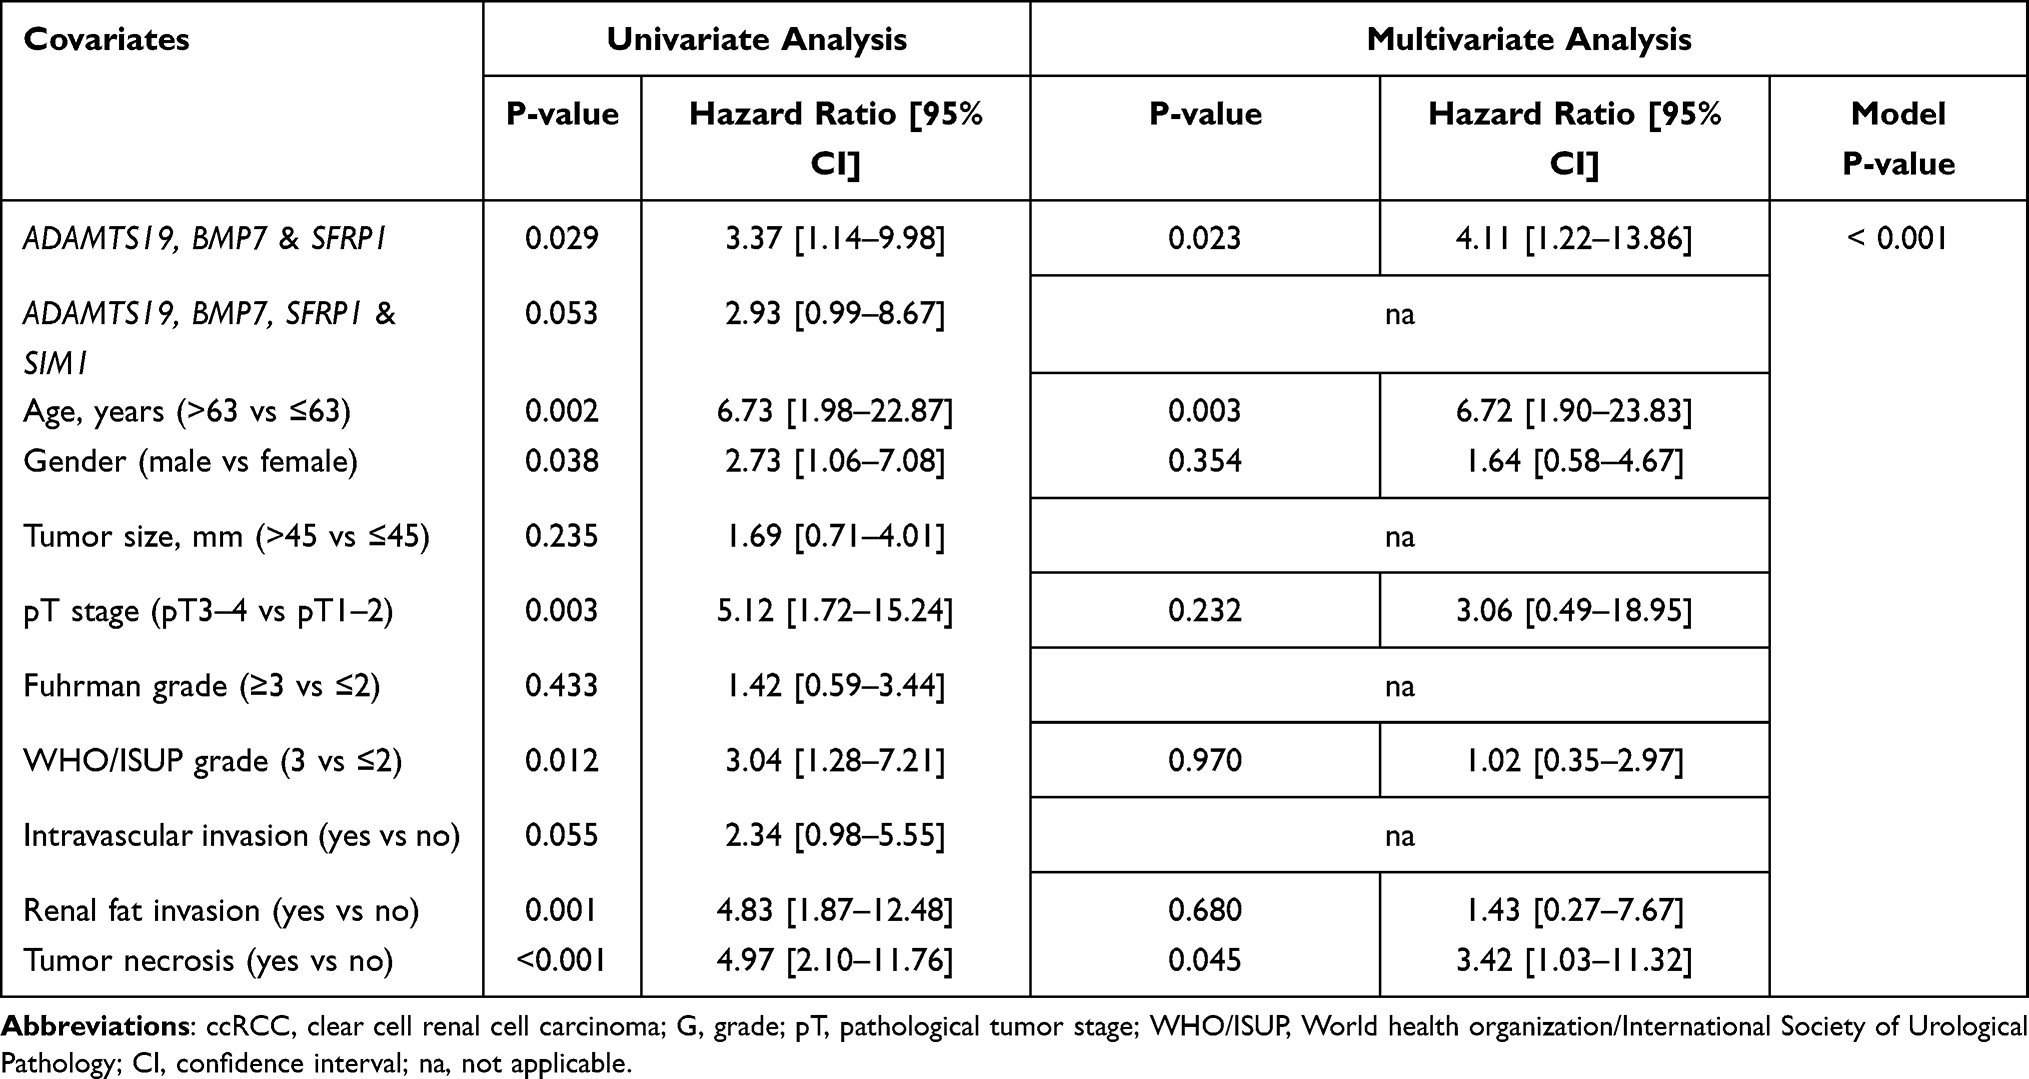 |
Table 3 Cox Regression Analysis for Investigated Biomarkers and Clinical-Pathological Characteristics of ccRCC (N=107) |
Discussion
Renal cell carcinoma (RCC) is the seventh most common cancer in developed countries, accounting for roughly 2% of global cancer diagnoses and deaths worldwide.5,22 Clear cell RCC (ccRCC) is the most common subtype characterized by the most aggressive course of the disease among RCC, and accounts for the majority of deaths from kidney cancer.2 The currently used tools for predicting patient outcome and treatment decision making are based on clinicopathological features; however, despite the high predictive capacity,23,24 among patients with similar clinical-pathological parameters, there can still be very different outcomes.9 Thus, there is a vital need for new molecular biomarkers that would provide valuable information about disease aggressiveness and prognosis, as well as assist in treatment decision making. Since changes in the DNA methylation are often related to clinical-pathological parameters,15 they might be useful to detect kidney cancer patients with more aggressive tumors and possibly poorer outcomes. Despite considerable efforts to identify novel DNA methylation biomarkers for the diagnosis and/or prognosis of renal cancer,25–29 no marker has yet reached the clinic; therefore, further investigations are needed.
The present study allowed us to identify frequent DNA methylation of ADAMTS19, BMP7, SIM1, and SFRP1 in ccRCCs, with 100% of specificity for the tumors. Survival analysis showed that the methylated status of the multimarker panel, consisting of three (ADAMTS19, BMP7 & SFRP1) or four (ADAMTS19, BMP7, SFRP1 & SIM1) genes is associated with poorer OS. Moreover, the multivariate analysis revealed the methylation status of the three-gene panel ADAMTS19, BMP7 & SFRP1 as an independent prognostic factor for OS. Though a similar prognostic value of the three-four gene panel was found previously,30 tumor necrosis, an important component of the SSIGN score prognostic model,7,31 was not considered in this study.
The previous studies related the methylated status of SFRP1 to a shorter ccRCC patient overall survival,32,33 while, in the current study, the gene was informative only in combination with other biomarkers. Such inconsistency possibly comes from different gene locations investigated, as observed previously,34 and shows the necessity of data validation in various independent cohorts. On the other hand, in the light of the high heterogeneity of renal tumors,35 the multimarker panels should be more informative and reliable than a single biomarker. Although several reports have investigated genomic profiles in ccRCC and indicated their promising clinical importance,36,37 large gene panels are of limited clinical use due to the high cost and the complicated interpretation of the results. On the contrary, the three-gene panel used in this study was highly specific to ccRCC and had a prognostic potential for the identification of aggressive cases. The small amount of markers makes such a panel more convenient to use in a clinical context.
Our study assisted in the identification of new genes and pathways that are possibly involved in renal carcinogenesis. One of the most promising genes, ADAMTS19, encodes a member of the ADAMTS secreted metalloproteinases family, which can cleave or interact with a wide range of extracellular matrix (ECM) components or regulatory factors, affecting cell adhesion, migration, proliferation, and angiogenesis.38 Although the exact biological function of ADAMTS19 remains uncharacterized, due to its close relation to ADAMTS17, it is speculated that ADAMTS19 may participate in the biogenesis of ECM fibrillin microfibrils.39 Thus, downregulation of ADAMTS19 may be associated with the loss of tissue integrity, and thus allow tumor progression. This is the first study reporting ADAMTS19 promoter methylation in ccRCC that linked it with various adverse clinical-pathological parameters, including larger tumor size, intravascular invasion, and a higher tumor grade, confirming its relation with tumor development and progression.
BMP7 is a member of the TGF superfamily growth and differentiation factor possibly stored bound to fibrillin in ECM.40,41 Kidney tissues are the major sources for BMP7 in adults and may contribute to the maintenance of structure and function of renal tissues and have an anti-inflammatory effect; meanwhile, their loss leads to the development of kidney injuries and neoplasia.42,43 It is observed that BMP7 inhibits differentiation and epithelial-to-mesenchymal transition (EMT) of the kidney proximal tubular epithelial cells, by reducing the production of EMT inductor TGF-β1.40,42,44 Thus, downregulation of this gene may stimulate cancer development and progression by promoting EMT, which in turn contributes to RCC development.45 Indeed, the decreased expression of BMP7 was found in RCC;44,46 however, the promoter methylation has not been investigated so far. The present study related the methylated status of BMP7 with larger tumors, higher WHO/ISUP grade, and tumor necrosis, supplementing its relation to the tumor progression.
SFRP1 (secreted frizzled-related protein 1) is a frizzled protein family member acting as an inhibitor of the WNT signaling pathway.47 It is well known that the active WNT pathway promotes cell proliferation, survival, and invasion thereby contributing to RCC pathogenesis.47,48 Thereby SFRP1 serves as a tumor suppressor gene, which down-regulation increases the growth of RCC cells, through releasing WNT signaling.32,47 The loss of SFRP1 due to DNA hypermethylation is observed in many tumors and is widely studied in renal cancer.47 The methylation frequency of SFRP1 varies among the ccRCC studies32,33,49 and was higher in our study; and, although lacking associations with clinical-pathological characteristics, the biomarker was able to augment the prognostic value of the biomarker panel in combination with ADAMTS19 and BMP7.
Finally, the SIM1 encoding transcription factor is involved in the developmental processes,50 but its role in carcinogenesis remains unclear. There is a link between SIM1 and human obesity,51 and the methylation of obesity-related genes was previously linked to poorer RCC prognosis.52 To date, the DNA methylation of SIM1 has been described in several cancers, including breast,53 lung,54 and cervical,55 and was related to tumor metastasis; however, no data exist on RCC. In the present study, SIM1 was rarely methylated in ccRCC tissues, and was associated with larger tumors; however, the methylated status of SIM1 had no added value to ccRCC prognosis; thus, further studies are needed to prove its clinical significance.
Despite novel data provided on the role of DNA methylation in renal cell carcinoma, this study has some important shortcomings as well. The most important downside is the lack of data validation – thus considering the relatively short follow-up and the low number of deaths in the study cohort, the results of the multivariate analysis should be viewed with some reservation. In addition, only patient’s death as an endpoint was used for the survival analysis that has a lower power as compared to disease-free survival.56 Finally, as liquid biopsy is emerging as a revolutionary tool for non-invasive or minimally invasive cancer diagnosis and/or prognosis, further studies of the particular biomarkers in the blood or urine samples would be extremely useful. Thus, external validation of selected genes methylation in both tissue and biofluid samples is mandatory in order to prove the independent prognostic value of novel ccRCC biomarkers and their applicability in the clinical settings.
Conclusions
In conclusion, our study demonstrated the ccRCC-specific methylation of ADAMTS19, BMP7, SIM1, and SFRP1 and the clinical significance of the three-biomarker panel, particularly ADAMTS19, BMP7 & SFRP1, in predicting overall survival. Before clinical application of this biomarker panel, a comprehensive verification of a large number of clinical samples is mandatory.
Abbreviations
ccRCC, clear cell renal cell carcinoma; CI, confidence interval; MC, methylated control; MSP, methylation-specific polymerase-chain reaction; NRT, noncancerous renal tissue; HR, hazard ratio; PPV, positive predictive value; NPV, negative predictive value; UC, unmethylated control; WHO/ISUP, World Health Organization/International Society of Urological Pathology; ECM, extracellular matrix.
Data Sharing Statement
The datasets analyzed during the current study are available in the Gene Expression Omnibus database, GSE168845 (https://www.ncbi.nlm.nih.gov/geo/query/acc.cgi?acc=GSE168845) and GSE166734 (https://www.ncbi.nlm.nih.gov/geo/query/acc.cgi?acc=GSE166734). All analyzed data are included in this published article and its supplementary information file. The original data are available upon reasonable request to the corresponding author.
Ethics Approval and Consent to Participate
The present study was conducted according to the guidelines of the Declaration of Helsinki. The study was approved by the Lithuanian Bioethics Committee (No.: 158200˗18/12˗1077˗585) and written informed consent was obtained from all patients.
Acknowledgments
The authors would like to thank Aušra Šumskaitė for her assistance in DNA samples preparation and MSP analysis.
Author Contributions
All authors made substantial contributions to conception and design, acquisition of data, or analysis and interpretation of data; took part in drafting the article or revising it critically for important intellectual content; agreed to submit to the current journal; gave final approval for the version to be published; and agreed to be accountable for all aspects of the work.
Funding
This work was funded by the 2014–2020 European Union Structural Funds according to the activity “Intelligence. Joint science-business projects” grant No. J05-LVPA-K-04-0029. The study was also partially supported by the Research Council of Lithuania (RCL) grant No. S-MIP-17/54.
Disclosure
Drs Raimonda Kubiliute reports a patent PCT/IB2021/052532 pending. Professor Sonata Jarmalaite reports a patent PCT/IB2021/052532 pending. The authors declare that they have no other competing interests.
References
1. Siegel RL, Miller KD, Jemal A. Cancer statistics, 2018. CA Cancer J Clin. 2018;68(1):7–30. doi:10.3322/caac.21442
2. Chow WH, Dong LM, Devesa SS. Epidemiology and risk factors for kidney cancer. Nat Rev Urol. 2010;7(5):245–257. doi:10.1038/nrurol.2010.46
3. Capitanio U, Bensalah K, Bex A, et al. Epidemiology of renal cell carcinoma. Eur Urol. 2019;75(1):74–84. doi:10.1016/j.eururo.2018.08.036
4. Dabestani S, Thorstenson A, Lindblad P, Harmenberg U, Ljungberg B, Lundstam S. Renal cell carcinoma recurrences and metastases in primary non-metastatic patients: a Population-Based Study. World J Urol. 2016;34(8):1081–1086. doi:10.1007/s00345-016-1773-y
5. Padala SA, Barsouk A, Thandra KC, et al. Epidemiology of renal cell carcinoma. World J Oncol. 2020;11(3):79–87. doi:10.14740/wjon1279
6. Kattan MW, Reuter V, Motzer RJ, Katz J, Russo P. A postoperative prognostic nomogram for renal cell carcinoma. J Urol. 2001;166(1):63–67. doi:10.1016/S0022-5347(05)66077-6
7. Frank I, Blute ML, Cheville JC, Lohse CM, Weaver AL, Zincke H. An outcome prediction model for patients with clear cell renal cell carcinoma treated with radical nephrectomy based on tumor stage, size, grade and necrosis: the SSIGN score. J Urol. 2002;168(6):2395–2400. doi:10.1016/S0022-5347(05)64153-5
8. Zisman A, Pantuck AJ, Dorey F, et al. Improved prognostication of renal cell carcinoma using an integrated staging system. J Clin Oncol. 2001;19(6):1649–1657. doi:10.1200/JCO.2001.19.6.1649
9. Wei JH, Haddad A, Wu KJ, et al. A CpG-methylation-based assay to predict survival in clear cell renal cell carcinoma. Identification of a five-CpG-based classifier that has added prognostic value to the currently used staging system and risk scores, and could thus be of high clinical value. Nat Commun. 2015;6:8699.
10. Hurtado Del Pozo C, Garreta E, Izpisúa Belmonte JC, Montserrat N. Modeling epigenetic modifications in renal development and disease with organoids and genome editing. Dis Model Mech. 2018;11(11):dmm035048. doi:10.1242/dmm.035048
11. Wu P, Cao Z, Wu S. New progress of epigenetic biomarkers in urological cancer. Dis Markers. 2016;2016:9864047. doi:10.1155/2016/9864047
12. Shenoy N, Vallumsetla N, Zou Y, et al. Role of DNA methylation in renal cell carcinoma. J Hematol Oncol. 2015;8(1):88. doi:10.1186/s13045-015-0180-y
13. Arai E, Kanai Y. Genetic and epigenetic alterations during renal carcinogenesis. Int J Clin Exp Pathol. 2010;4(1):58–73.
14. Minardi D, Lucarini G, Filosa A, et al. Prognostic role of global DNA-methylation and histone acetylation in pT1a clear cell renal carcinoma in partial nephrectomy specimens. J Cell Mol Med. 2009;13(8B):2115–2121. doi:10.1111/j.1582-4934.2008.00482.x
15. Morris MR, Latif F. The epigenetic landscape of renal cancer. Nat Rev Nephrol. 2017;13(1):47–60.
16. Cancer Genome Atlas Research Network. Comprehensive molecular characterization of clear cell renal cell carcinoma. Nature. 2013;499(7456):43–49. doi:10.1038/nature12222
17. Maleckaite R, Zalimas A, Bakavicius A, Jankevicius F, Jarmalaite S, Daniunaite K. DNA methylation of metallothionein genes is associated with the clinical features of renal cell carcinoma. Oncol Rep. 2019;41(6):3535–3544.
18. Sobin LH, Gospodarowicz MK, Wittekind C. TNM classification of malignant tumours, 7th edition. Cancer. 2009;7:310.
19. Lopez-Beltran A, Scarpelli M, Montironi R, Kirkali Z. 2004 WHO classification of the renal tumors of the adults. Eur Urol. 2006;49(5):798–805. doi:10.1016/j.eururo.2005.11.035
20. Fuhrman SA, Lasky LC, Limas C. Prognostic significance of morphologic parameters in renal cell carcinoma. Am J Surg Pathol. 1982;6(7):655–663. doi:10.1097/00000478-198210000-00007
21. Delahunt B, Cheville JC, Martignoni G, et al. The International Society of Urological Pathology (ISUP) grading system for renal cell carcinoma and other prognostic parameters. Am J Surg Pathol. 2013;37(10):1490. doi:10.1097/PAS.0b013e318299f0fb
22. Bray F, Ferlay J, Soerjomataram I, Siegel RL, Torre LA, Jemal A. Global cancer statistics 2018: GLOBOCAN estimates of incidence and mortality worldwide for 36 cancers in 185 countries. CA Cancer J Clin. 2018;68(6):394–424. doi:10.3322/caac.21492
23. Patard JJ, Kim HL, Lam JS, et al. Use of the University of California Los Angeles integrated staging system to predict survival in renal cell carcinoma: an International Multicenter Study. J Clin Oncol. 2004;22(16):3316–3322. doi:10.1200/JCO.2004.09.104
24. Zigeuner R, Hutterer G, Chromecki T, et al. External validation of the Mayo Clinic stage, size, grade, and necrosis (SSIGN) score for clear-cell renal cell carcinoma in a single European centre applying routine pathology. Eur Urol. 2010;57(1):102–109. doi:10.1016/j.eururo.2008.11.033
25. Ibragimova I, Slifker MJ, Maradeo ME, et al. Genome-wide promoter methylome of small renal masses. PLoS One. 2013;8(10):e77309. doi:10.1371/journal.pone.0077309
26. Kang HW, Park H, Seo SP, et al. Methylation signature for prediction of progression free survival in surgically treated clear cell renal cell carcinoma. J Korean Med Sci. 2019;34(19):e144. doi:10.3346/jkms.2019.34.e144
27. Kim YJ, Jang W, Piao XM, et al. ZNF492 and GPR149 methylation patterns as prognostic markers for clear cell renal cell carcinoma: array-based DNA methylation profiling. Oncol Rep. 2019;42(1):453–460.
28. Yoo KH, Park YK, Kim HS, Jung WW, Chang SG. Epigenetic inactivation of HOXA5 and MSH2 gene in clear cell renal cell carcinoma. Pathol Int. 2010;60(10):661–666. doi:10.1111/j.1440-1827.2010.02578.x
29. Ricketts CJ, Morris MR, Gentle D, et al. Genome-wide CpG island methylation analysis implicates novel genes in the pathogenesis of renal cell carcinoma. Epigenetics. 2012;7(3):278–290. doi:10.4161/epi.7.3.19103
30. van Vlodrop IJH, Joosten SC, De Meyer T, et al. Four-gene promoter methylation marker panel consisting of GREM1, NEURL, LAD1, and NEFH predicts survival of clear cell renal cell cancer patients. Clin Cancer Res. 2017;23(8):2006–2018. doi:10.1158/1078-0432.CCR-16-1236
31. Dagher J, Delahunt B, Rioux-Leclercq N, et al. Assessment of tumour-associated necrosis provides prognostic information additional to World Health Organization/International Society of Urological Pathology grading for clear cell renal cell carcinoma. Histopathology. 2019;74(2):284–290. doi:10.1111/his.13737
32. Morris MR, Ricketts C, Gentle D, et al. Identification of candidate tumour suppressor genes frequently methylated in renal cell carcinoma. Oncogene. 2010;29(14):2104–2117. doi:10.1038/onc.2009.493
33. Ricketts CJ, Hill VK, Linehan WM. Tumor-specific hypermethylation of epigenetic biomarkers, including SFRP1, predicts for poorer survival in patients from the TCGA kidney renal clear cell carcinoma (KIRC) project. PLoS One. 2014;9(1):e85621. doi:10.1371/journal.pone.0085621
34. van Vlodrop IJ, Niessen HE, Derks S, et al. Analysis of promoter CpG island hypermethylation in cancer: location, location, location! Clin Cancer Res. 2011;17(13):4225–4231. doi:10.1158/1078-0432.CCR-10-3394
35. Turajlic S, Xu H, Litchfield K, et al. Deterministic evolutionary trajectories influence primary tumor growth: tRACERx renal. Cell. 2018;173(3):595–610. doi:10.1016/j.cell.2018.03.043
36. Brooks SA, Brannon AR, Parker JS, et al. ClearCode34: a prognostic risk predictor for localized clear cell renal cell carcinoma. Eur Urol. 2014;66(1):77–84. doi:10.1016/j.eururo.2014.02.035
37. Rini B, Goddard A, Knezevic D, et al. A 16-gene assay to predict recurrence after surgery in localised renal cell carcinoma: development and validation studies. Lancet Oncol. 2015;16(6):676–685. doi:10.1016/S1470-2045(15)70167-1
38. Cal S, López-Otín C. ADAMTS proteases and cancer. Matrix Biol. 2015;44–46:77–85. doi:10.1016/j.matbio.2015.01.013
39. Hubmacher D, Apte SS. Genetic and functional linkage between ADAMTS superfamily proteins and fibrillin-1: a novel mechanism influencing microfibril assembly and function. Cell Mol Life Sci. 2011;68(19):3137–3148. doi:10.1007/s00018-011-0780-9
40. Zeisberg M. Bone morphogenic protein-7 and the kidney: current concepts and open questions. Nephrol Dial Transplant. 2006;21(3):568–573. doi:10.1093/ndt/gfk010
41. Gregory KE, Ono RN, Charbonneau NL, et al. The prodomain of BMP-7 targets the BMP-7 complex to the extracellular matrix. J Biol Chem. 2005;280(30):27970–27980. doi:10.1074/jbc.M504270200
42. Wang Z, Zhao J, Zhang J, Wei J, Huang Y, Huang Y. Protective effect of BMP-7 against aristolochic acid-induced renal tubular epithelial cell injury. Toxicol. Lett. 2010;198(3):348–357. doi:10.1016/j.toxlet.2010.07.018
43. Gould SE, Day M, Jones SS, Dorai H. BMP-7 regulates chemokine, cytokine, and hemodynamic gene expression in proximal tubule cells. Kidney Int. 2002;61(1):51–60. doi:10.1046/j.1523-1755.2002.00103.x
44. Basic-Jukic N, Hudolin T, Radic-Antolic M, et al. Bone morphogenetic protein-7 expression is down-regulated in human clear cell renal carcinoma. J Nephrol. 2011;24(1):91–97. doi:10.5301/JN.2010.2020
45. Pantuck AJ, An J, Liu H, Rettig MB. NF-κB–dependent plasticity of the epithelial to mesenchymal transition induced by Von Hippel-Lindau inactivation in renal cell carcinomas. Cancer Res. 2010;70(2):752–761. doi:10.1158/0008-5472.CAN-09-2211
46. Markić D, Celić T, Spanjol J, Grsković A, Bobinac D, Fuckar Z. Expression of bone morphogenetic protein-7, its receptors and Smad1/5/8 in normal human kidney and renal cell cancer. Coll Antropol. 2010;34(Suppl 2):149–153.
47. Mo S, Su Z, Heng B, et al. SFRP1 promoter methylation and renal carcinoma risk: a systematic review and meta-analysis. J Nippon Med Sch. 2018;85(2):78–86. doi:10.1272/jnms.2018_85-13
48. Valenta T, Hausmann G, Basler K. The many faces and functions of β-catenin. EMBO J. 2012;31(12):2714–2736. doi:10.1038/emboj.2012.150
49. Atschekzei F, Hennenlotter J, Janisch S, et al. SFRP1 CpG island methylation locus is associated with renal cell cancer susceptibility and disease recurrence. Epigenetics. 2012;7(5):447–457. doi:10.4161/epi.19614
50. Michaud JL, Rosenquist T, May NR, Fan CM. Development of neuroendocrine lineages requires the bHLH-PAS transcription factor SIM1. Genes Dev. 1998;12:3264–3275. doi:10.1101/gad.12.20.3264
51. Kim MJ, Oksenberg N, Hoffmann TJ, Vaisse C, Ahituv N. Functional characterization of SIM1-associated enhancers. Hum Mol Genet. 2014;23(7):1700–1708. doi:10.1093/hmg/ddt559
52. Sidaway P. Kidney cancer: methylation of obesity-related genes is associated with prognosis. Nat Rev Urol. 2017;14(8):452. doi:10.1038/nrurol.2017.94
53. Faryna M, Konermann C, Aulmann S, et al. Genome-wide methylation screen in low-grade breast cancer identifies novel epigenetically altered genes as potential biomarkers for tumor diagnosis. FASEB J. 2012;26(12):4937–4950. doi:10.1096/fj.12-209502
54. Daugaard I, Dominguez D, Kjeldsen TE, et al. Identification and validation of candidate epigenetic biomarkers in lung adenocarcinoma. Sci Rep. 2016;6(1):35807. doi:10.1038/srep35807
55. Kim HJ, Kim CY, Jin J, et al. Aberrant single-minded homolog 1 methylation as a potential biomarker for cervical cancer. Diagn Cytopathol. 2018;46(1):15–21. doi:10.1002/dc.23838
56. Sauerbrei W, Taube SE, McShane LM, Cavenagh MM, Altman DG. Reporting recommendations for tumor marker prognostic studies (REMARK): an abridged explanation and elaboration. J Natl Cancer Inst. 2018;110(8):803–811. doi:10.1093/jnci/djy088
 © 2021 The Author(s). This work is published and licensed by Dove Medical Press Limited. The full terms of this license are available at https://www.dovepress.com/terms.php and incorporate the Creative Commons Attribution - Non Commercial (unported, v3.0) License.
By accessing the work you hereby accept the Terms. Non-commercial uses of the work are permitted without any further permission from Dove Medical Press Limited, provided the work is properly attributed. For permission for commercial use of this work, please see paragraphs 4.2 and 5 of our Terms.
© 2021 The Author(s). This work is published and licensed by Dove Medical Press Limited. The full terms of this license are available at https://www.dovepress.com/terms.php and incorporate the Creative Commons Attribution - Non Commercial (unported, v3.0) License.
By accessing the work you hereby accept the Terms. Non-commercial uses of the work are permitted without any further permission from Dove Medical Press Limited, provided the work is properly attributed. For permission for commercial use of this work, please see paragraphs 4.2 and 5 of our Terms.