Back to Journals » Diabetes, Metabolic Syndrome and Obesity » Volume 17
Clinical Evidence of the Relationship Between Alanine Aminotransferase and Diabetic Kidney Disease
Authors Bi Y, Yang Y, Yuan X, Wang J, Liu Z, Tian S ![]() , Sun C
, Sun C
Received 26 September 2023
Accepted for publication 11 January 2024
Published 20 January 2024 Volume 2024:17 Pages 261—269
DOI https://doi.org/10.2147/DMSO.S442165
Checked for plagiarism Yes
Review by Single anonymous peer review
Peer reviewer comments 2
Editor who approved publication: Dr Konstantinos Tziomalos
Yaru Bi,1,* Yang Yang,2,* Xiaojie Yuan,3 Jiping Wang,3 Zhiyuan Liu,4 Suyan Tian,5 Chenglin Sun1,3
1Department of Endocrinology and Metabolism, First Hospital of Jilin University, Changchun, 130000, People’s Republic of China; 2Department of Health Examination Center, First Hospital of Jilin University, Changchun, 130000, People’s Republic of China; 3Department of Clinical Nutrition, First Hospital of Jilin University, Changchun, 130000, People’s Republic of China; 4Department of Clinical Medicine, Yanbian University, Yanji, 136200, People’s Republic of China; 5Division of Clinical Research, First Hospital of Jilin University, Changchun, 130000, People’s Republic of China
*These authors contributed equally to this work
Correspondence: Suyan Tian; Chenglin Sun, Email [email protected]; [email protected]
Aim: Multiple studies have investigated the association between alanine aminotransferase (ALT) and diabetes mellitus (DM); however, only a few studies have specifically examined the relationship between ALT and diabetic kidney disease (DKD). This study aimed to investigate the relationship between ALT and DKD using clinical data.
Methods: A cross-sectional study was conducted on 668 individuals that included non-DM (N=281), DM without DKD (N=160), and DKD (N=227) patients. A generalized additive model (GAM) was used to examine the dose–response relationship between ALT and DKD risk. We also analyzed the data from the US National Health and Nutrition Examination Survey (NHANES) 2015– 2018 using the same statistical methods; 4481, 1110, and 671 individuals were included in the non-DM, DM without DKD, and DKD groups, respectively.
Results: The changes in ALT activity among the non-DM, DM without DKD, and DKD groups showed a similar pattern in both our clinical data and the NHANES dataset. ALT activity increases with the onset of DM, whereas ALT activity decreases when DM progresses to DKD. The GAM revealed a nonlinear U-shaped relationship between ALT and DKD risk in the two datasets, and the lowest range of ALT was 40– 50 IU/L. Both lower (< 40 IU/L) and higher (> 50 IU/L) ALT activity were found to be positively associated with DKD risk.
Conclusion: A U-shaped nonlinear association between ALT and DKD was found in our clinical data and NHANES data. DKD risk was increased by both lower or higher ALT activity. To confirm the causality of nonlinear relationship, larger prospective studies or Mendelian randomization analysis are required.
Keywords: alanine aminotransferase, diabetic kidney disease, dose–response relationship, NHANES
Introduction
Diabetic kidney disease (DKD) is a chronic kidney disease (CKD) associated with diabetes mellitus (DM). Clinically, it is defined as increased albuminuria and/or reduced estimated glomerular filtration rate (eGFR) or both. DKD develops in approximately 40% of patients with DM,1 making it one of the most frequent complications of DM. It is estimated that the all-cause mortality risk in patients with DKD is approximately 30 times greater than that in diabetic patients without DKD,2 which poses a great threat to human health. Therefore, it is important to identify the risk factors of DKD for its early prevention and intervention.
Alanine aminotransferase (Enzymes Commission number: 2.6.1.2; ALT) is an enzyme that catalyzes the transfer of an amino group from alanine to α-ketoglutarate.3 It is mainly concentrated in the cytosol of hepatocytes and is also located in other tissues, such as skeletal muscle and myocardial tissue.3 Several pathological conditions related to the above tissues damage, such as viral hepatitis, alcoholic/nonalcoholic fatty liver disease, and skeletal muscle disease, could lead to elevated serum ALT activity. In addition, recent epidemiological studies have shown that elevated ALT activity is also associated with an increased risk of diabetes.4–8 For example, one prospective study including 9337 non-diabetes individuals with a medium of 12-year follow-up showed that patients with ALT activity in the highest quartile had a 1.68-fold greater risk of developing DM than did those in the lowest quartile [hazard ratio=1.68, 95% confidence interval (CI)=1.49–1.89] after adjusting for potential confounding factors.9 A meta-analysis including 17 prospective studies also revealed that ALT (per 1-standard deviation change in log ALT) increased the risk of diabetes (relative risk=1.26, 95% CI=1.14–1.41).10
Conversely, when diabetes progresses to the DKD stage, its relationship with ALT has been less investigated, and the limited findings are controversial.11–13 For example, one recent prospective study including 3123 diabetic patients with a median 5-year follow-up showed that ALT activity was not associated with DKD risk [odds ratio (OR)=1.001, 95% CI=0.994–1.009, P=0.769] after adjusting for potential confounders.11 In contrast, another retrospective study including 690 diabetic patients with a mean follow-up of 6.2±4.4 years indicated that elevated ALT activity was associated with the remission of DKD (OR=1.01, 95% CI=1.002–1.018, P < 0.05).12 In addition, none of the above studies focused on the dose–response relationship between ALT and DKD.
In this study, we used clinical data to investigate the association between ALT and DKD and assessed their potential dose–response relationship. Moreover, we also analyzed the data from the US National Health and Nutrition Examination Survey (NHANES) using the same statistical method to enhance the credibility of the results. Such analyses might help in better understanding the roles of ALT in the development of DKD and thus facilitating early prevention of DKD.
Materials and Methods
Study Participants
We recruited non-DM participants who received annual physical examination and DM participants (with or without DKD) who received inpatient care at the First Hospital of Jilin University from January 2015 to December 2018; they were categorized into the non-DM, DM without DKD, and DKD groups. Individuals in the non-DM group were excluded if they met any of the following criteria were met: aged less than 18 years; had a medical history of DM, hepatitis B/C (HBV/HCV) or kidney disease; had excessive alcohol consumption (>30 g/d for males or >20 g/d for females); or had diabetes or a disorder of the kidney (eGFR < 90 mL/min/1.73m2) suggested by biochemical indicators. All these requirements guaranteed that the participants in the non-DM group were relatively healthy. Individuals with DM who met the following conditions were excluded: were aged less than 18 years, underwent dialytic treatment, had albuminuria caused by other diseases (eg, primary renal disorder) rather than DM, had elevated liver enzymes caused by medications such as statins, had accompanying HBV/HCV, or had excessive alcohol consumption. Individuals with missing data were also excluded. This study was approved by the Ethics Committee of the First Hospital of Jilin University. The patients’ personal data were confidential, and the informed consent was therefore waived by the Ethics Committee. This study complied with the Declaration of Helsinki.
Data Collection and Measurement
Demographic data, examination measurements, and questionnaire data including age, sex, height, weight, blood pressure, smoking status, drinking status, and medical history, were collected. Furthermore, after overnight fasting for 8–10 h, biochemical indicators including fasting plasma glucose (FPG), glycosylated hemoglobin (HbA1c), ALT, aspartate aminotransferase (AST), gamma-glutamyl transferase (GGT), creatinine (Cr), and blood lipid [total cholesterol (TC), triglyceride (TG), high-density lipoprotein cholesterol (HDL-C), and low-density lipoprotein cholesterol (LDL-C)], and the albuminuria excretion rate (AER), were collected. ALT activity (reference range: 7–40 IU/L for females and 9–50 for males) was measured using the kinetic rate method with a fully automatic biochemistry analyzer (AU5800, Beckman Coulter Ltd, USA). All these biochemical indicators were assayed at the Department of Laboratory Medicine of the First Hospital of Jilin University.
Hypertension was defined as self-reported hypertension or a high biological measurement value (the average systolic blood pressure ≥140 mmHg and/or diastolic blood pressure ≥90 mmHg of three measurements). Body mass index (BMI) was calculated as weight in kilogram divided by height in meters squared.
Analysis of NHANES
Publicly available data from the NHANES 2015–2018 was also analyzed. NHANES is a nationally representative survey of the US population, gathering data from interviews, physical examinations, and laboratory measurements. The participants were also categorized into three groups, namely, the non-DM group, DM without DKD, and DKD groups. The exclusion criteria were as follows: 1) age <18 years; 2) variables including BMI, ALT, AST, GGT, Cr, albumin-to-creatinine (ACR), TC, TG, and HbA1c had missing values; 3) positive HBV/HCV status; 4) excessive alcohol intake (>30 g/d for males and >20 g/d for females); 5) receiving dialytic treatment in the past 12 months; and 6) having kidney disorders (eGFR≥90 and ACR<30mg/g) for non-DM individuals.
In addition to the identical biochemical indicators as the Chinese dataset, we also extracted HBV surface antigen, HCV RNA, and dialytic treatment status from the NHANES dataset. It was noted that ACR was obtained from NHANES to quantify proteinuria. Ethics approval was obtained from the National Center for Health Statistics Ethics Review Board, and written informed consent was obtained from the participant.
Ascertainment of DM and DKD
In the two datasets, DM was defined as a physician-diagnosed medical history of DM, FPG ≥ 7.0mml/L or HbA1c ≥ 6.5%, or both. DKD was defined as DM with the presence of albuminuria (AER ≥ 30mg/24h for the Chinese dataset; ACR ≥ 30 mg/g for the NHANES dataset), impaired eGFR (<60mL/min.1.73m2), or both. eGFR was calculated using the Chronic Kidney Disease Epidemiology Collaboration (CKD-EPI) equation (mL/min/1.73m2).
Statistical Analysis
For continuous variables, data were expressed as mean ± standard deviation (SD) or median (25th, 75th percentile). The characteristics of the non-DM group, DM without DKD, and DKD group were compared using analysis of variance (for normally distributed) or the Kruskal–Wallis test (for variables with a skewed distribution). For categorical variables, data were expressed as number (percentage), and the differences between the three groups were compared by a chi-square test. Generalized additive models (GAM), adjusted for sex, age, BMI, smoking, alcoholic drinking, hypertension, GGT, and TG, were fit to illustrate the dose–response relationship between ALT and DKD risk. Statistical analyses were performed using SPSS (version 22.0; IBM Corporation, Armonk, NY, USA). GAM were carried out in R software 4.1.0 (http://www.r-project.org/) by using the R mgcv package. P < 0.05 was considered statistically significant.
Results
Characteristics of the Participants in the Chinese Dataset
In this cross-sectional study of the Chinese dataset, 730 participants were recruited; however, 62 individuals were excluded due to data missing. Finally, 668 individuals with a mean age of 51.0 ±11.3 years were enrolled for analyses: including 281, 160, and 227 individuals for the non-DM group, DM without DKD, and DKD group, respectively. The proportion of males was 52.5% (351/668), and DKD was 34.0% (227/668). The characteristics of the study population are listed in Table 1. The average age, BMI, ALT, GGT, Cr, TG, and LDL-C were significantly higher in DM without the DKD group as compared to the non-DM group. Participants with DKD were older and were more likely to suffer from hypertension. They also had higher levels of Cr, TG, TC, and lower eGFR than those in the non-DM and DM without the DKD group.
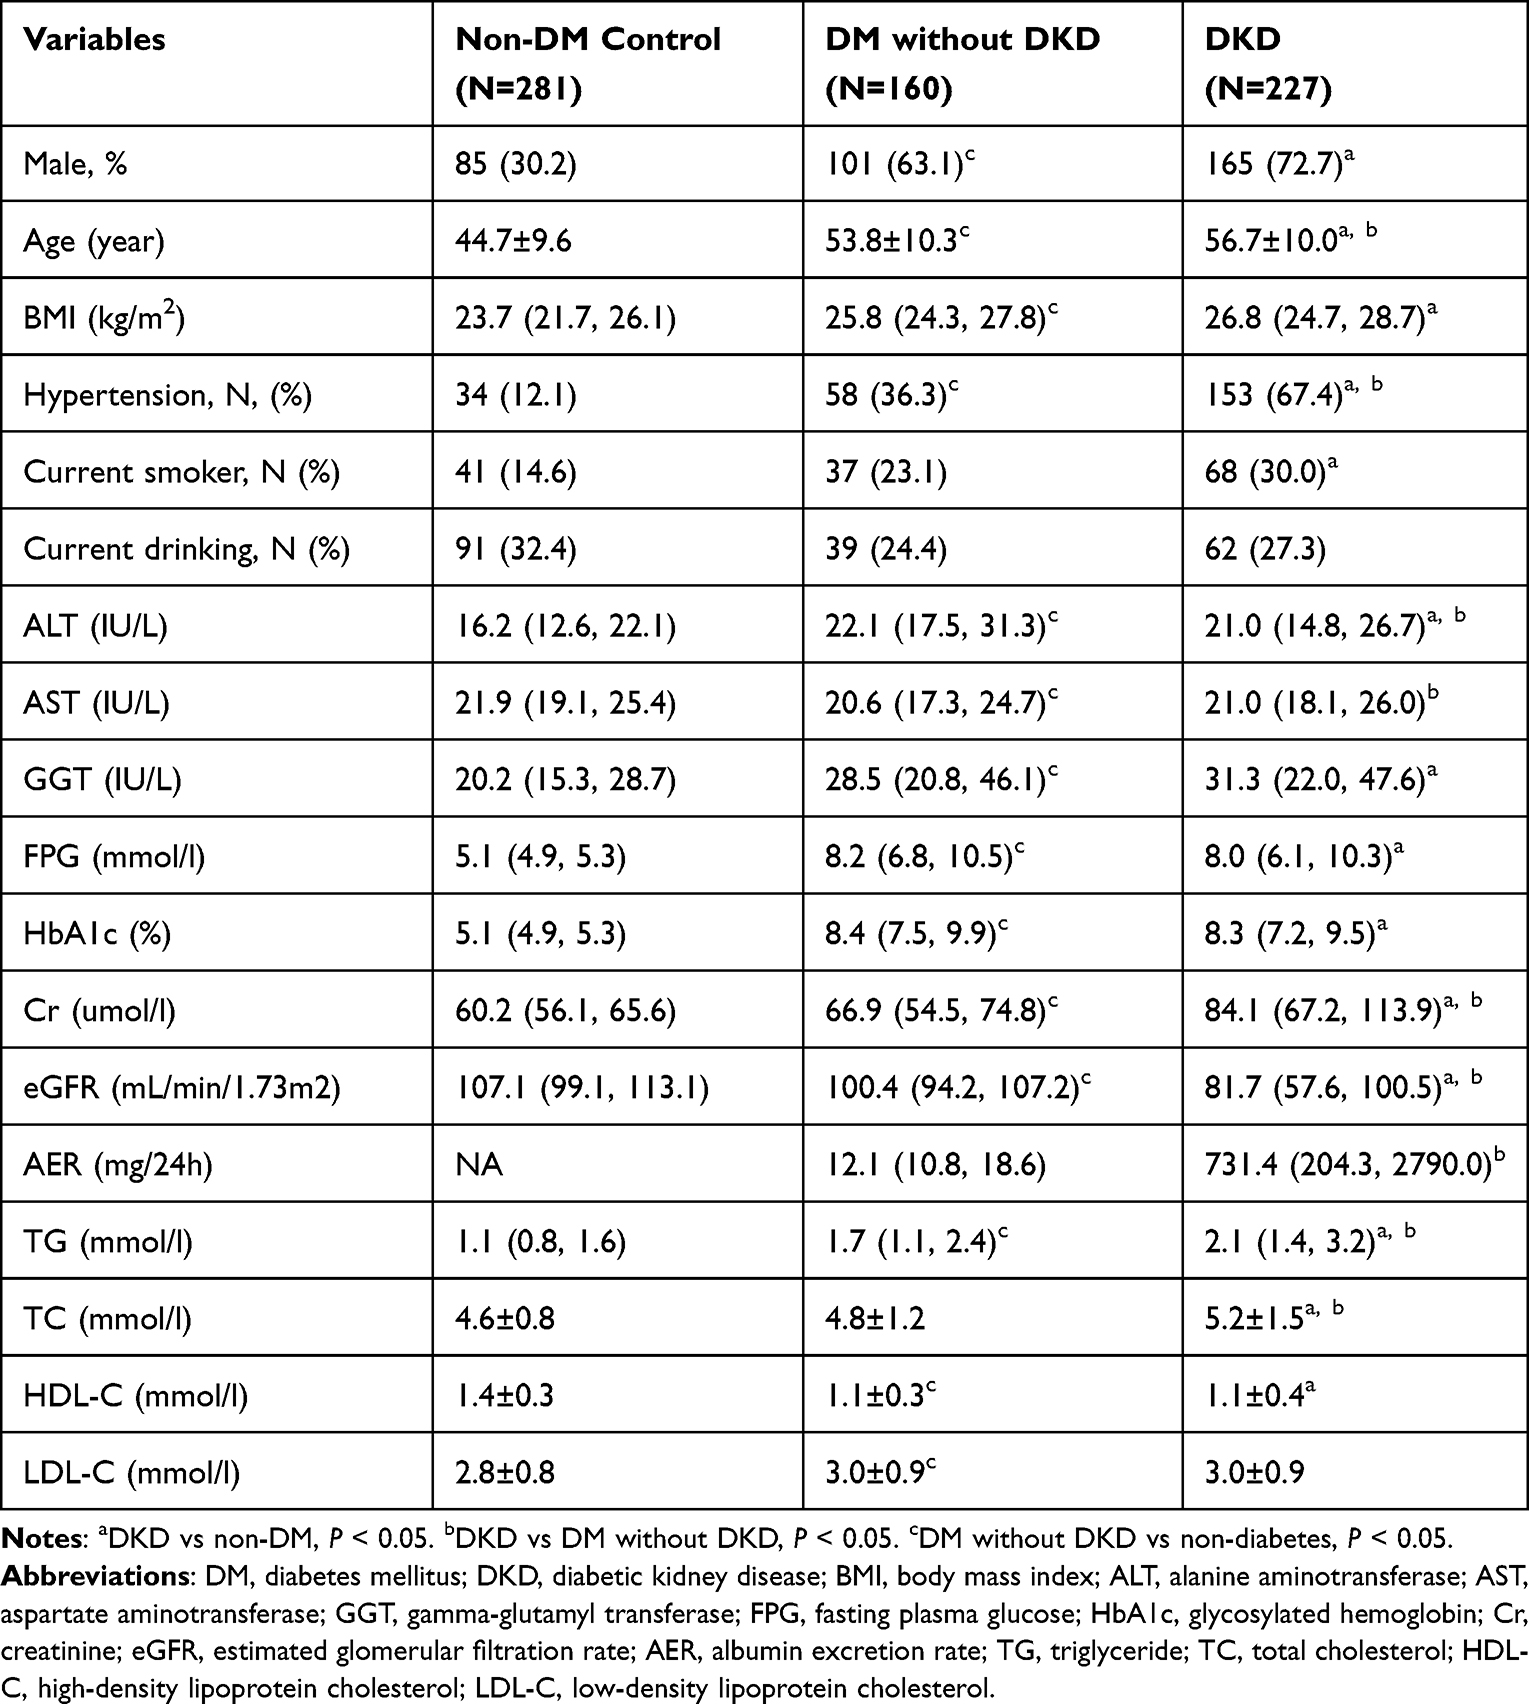 |
Table 1 Characteristics of the Participants in the Chinese Dataset |
We focused specifically on the changing trend of ALT in the three groups (Figure 1A). The median ALT activity in the non-DM group was 16.2 IU/L and then increased to 22.1 IU/L in the DM without the DKD group (P < 0.001). Surprisingly, the median ALT activity decreased to 21.0 IU/L when DM developed to the DKD stage (P = 0.03).
 |
Figure 1 Boxplots to show the differences of alanine aminotransferase (ALT) activity in three groups in the Chinese dataset (A) and the National Health and Nutrition Examination Survey dataset (B). The lowest and highest lines refer to 10% and 90% percentile of ALT activity. P1 represented the comparison between non-diabetes mellitus (non-DM) and DM without diabetic kidney disease (DKD) group. P2 represented the comparison between DM without DKD and DKD group, and P3 represented the comparison between non-DM group and DKD group. |
Characteristics of the Participants in the NHANES Dataset
Out of 19,225 NHANES participants, 6262 individuals with a median age of 43 (29, 59) years were included in our final analyses, and DKD accounted for 10.7% (671/6262). The characteristics of the participants are listed in Table 2. The DKD group consisted of significantly older participants with higher HbA1c, Cr, ACR, TG, and lower eGFR, TC, and HDL-C as compared to the non-DM group and DM without the DKD group. The proportion of hypertension in the DKD group was the highest.
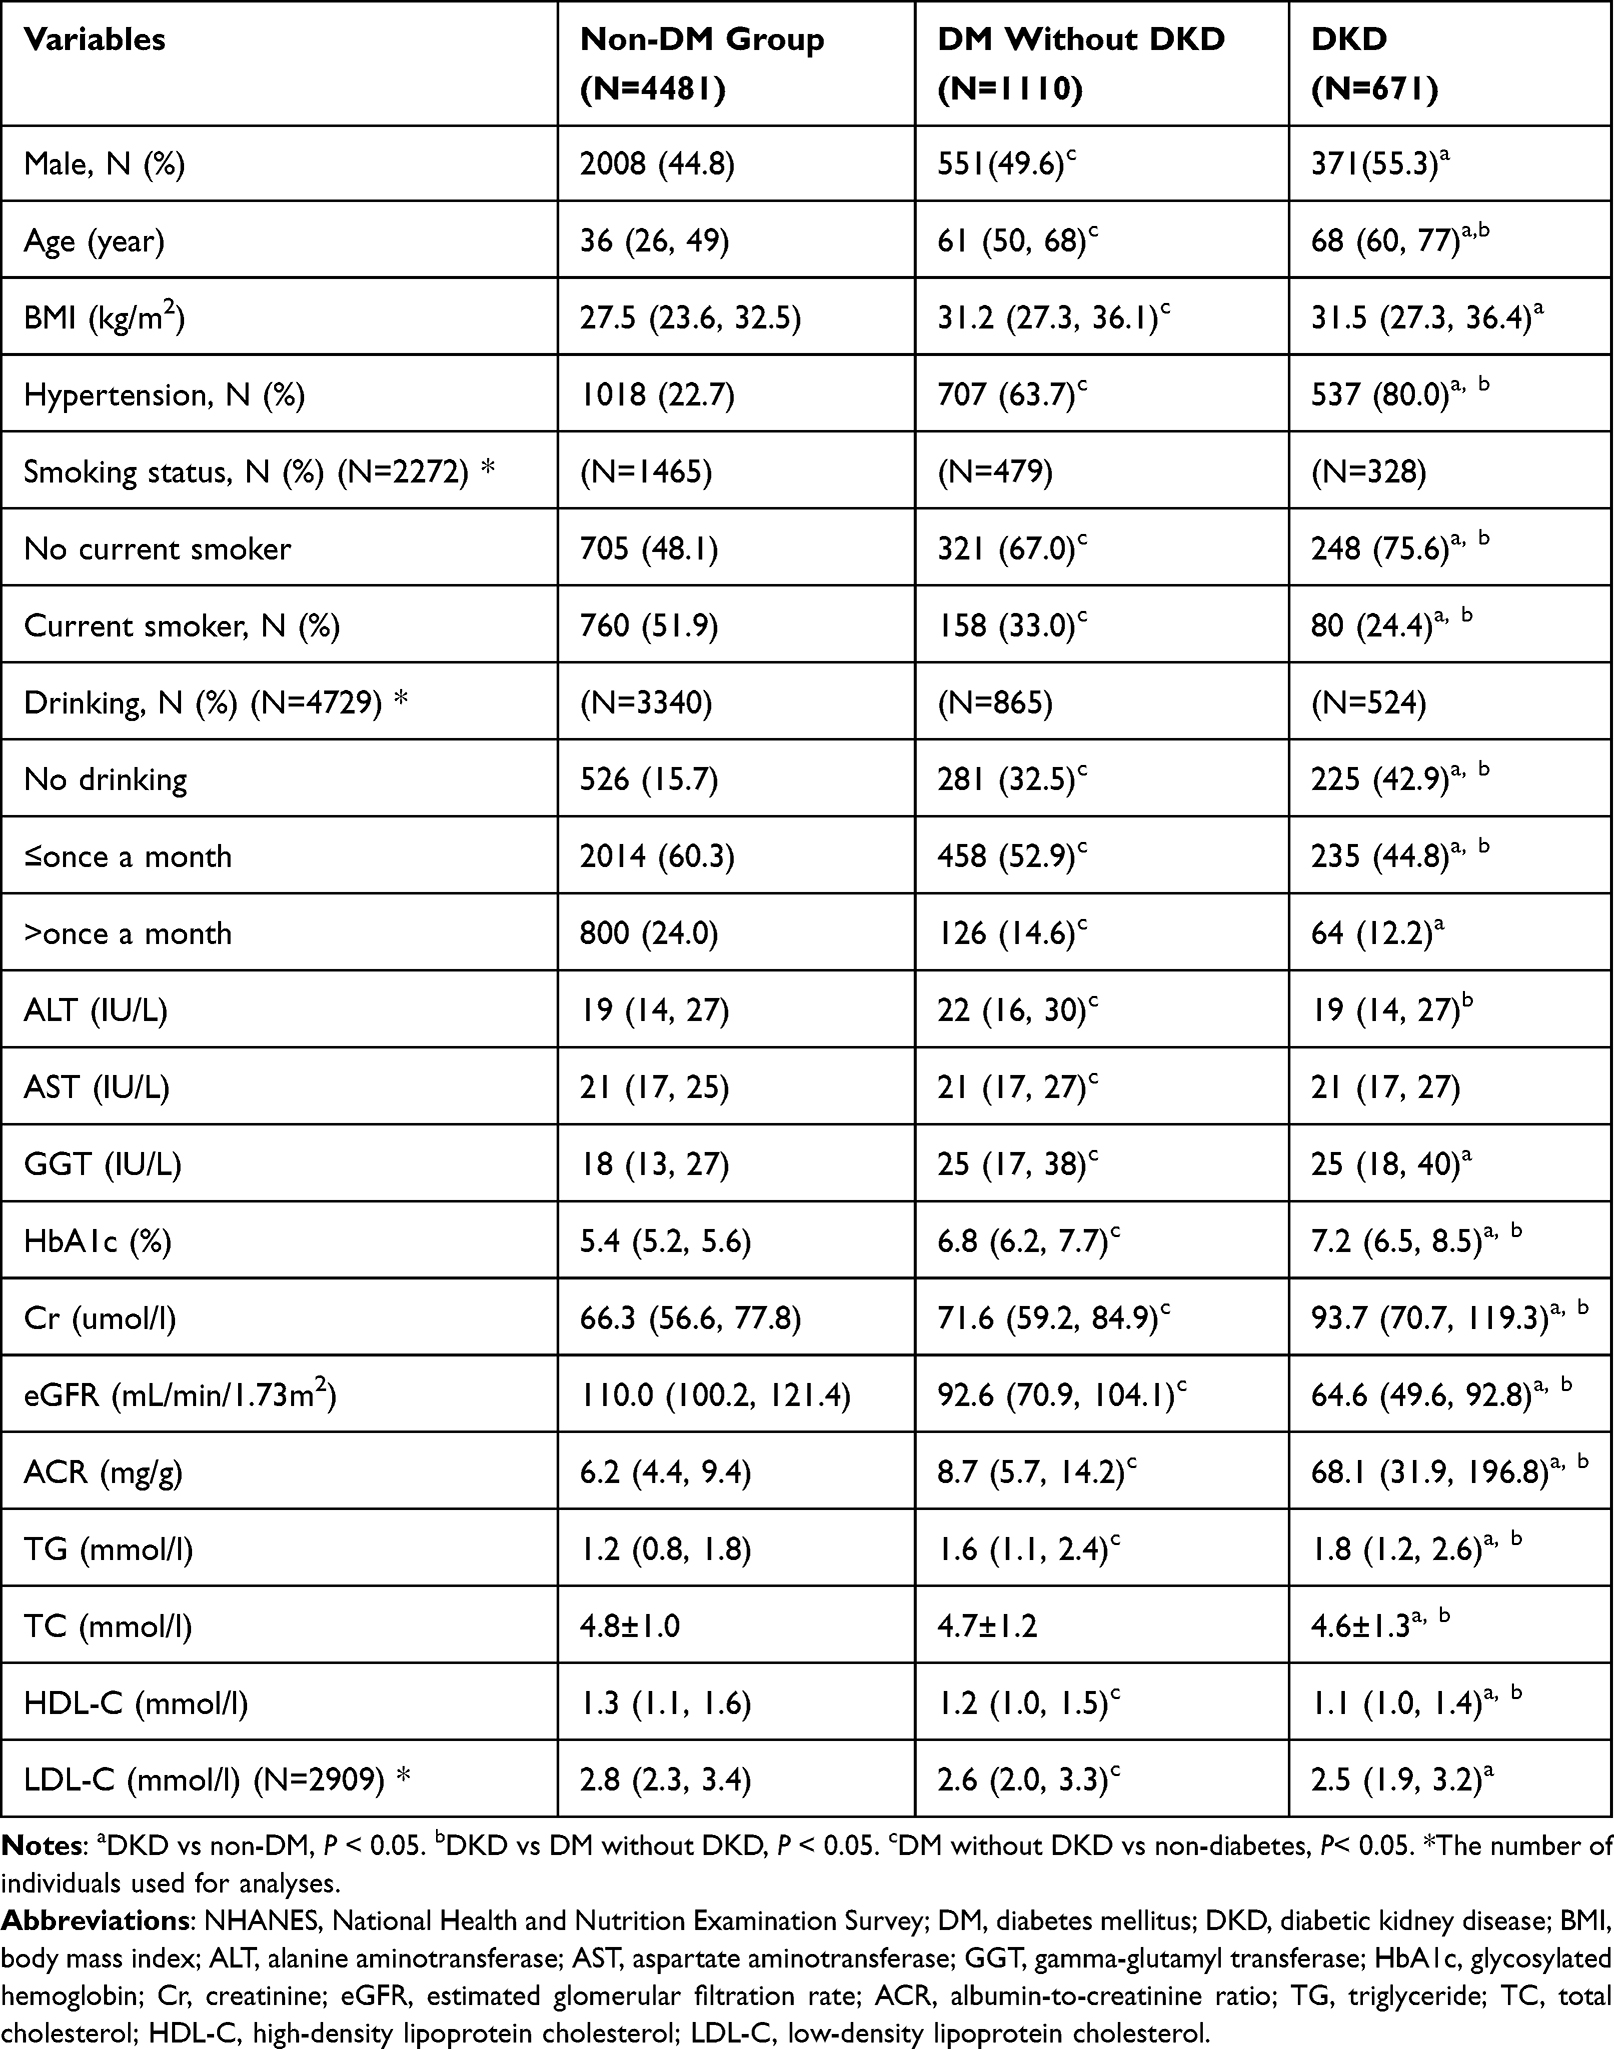 |
Table 2 Characteristics of the Participants in the NHANES Dataset |
It was worth noting that the changing trend of ALT among the three groups in the NHANES dataset was concordant with the pattern in the Chinese dataset (Figure 1B). The median ALT activity increased from 19 IU/L in the non-DM group to 22 IU/L in DM without the DKD group (P < 0.001). Nevertheless, the ALT activity decreased to 19 IU/L when DM developed to the DKD stage (P < 0.001).
Association of ALT and Risk of DKD
The cross-sectional analyses in both datasets indicated that the relationship between ALT and DKD might be nonlinear without adjusting confounding factors. GAM identified a nonlinear U-shaped relationship between ALT and DKD risk in both the Chinese (P non-linear=0.007) and the NHANES datasets (P non-linear<0.001) (Figure 2), and the lowest range of ALT was 40–50 IU/L. Both lower (<40 IU/L) and higher (>50 IU/L) ALT activity were found to be positively associated with DKD risk. In the two models, the potential confounding factors including sex, age, BMI, smoking, alcoholic drinking, hypertension, GGT, and TG were adjusted.
 |
Figure 2 Plots given by generalized additive models in which adjusted for sex, age, body mass index, smoking, alcoholic drinking, aspartate aminotransferase, gamma-glutamyl transferase, and triglyceride based on Chinese dataset (A) and the National Health and Nutrition Examination Survey dataset (B). The x-axis represented the activity of alanine aminotransferase [ALT (IU/L)], and the y-axis represented log odd for diabetic kidney disease (DKD). The solid line represented the smooth curve fit between variables, and the dotted line represented the 95% of confidence interval from the fit. |
The two nonlinear U-shaped relationship between ALT and DKD risk shared some similarities (Figure 2). First, both the Chinese and NHANES datasets presented a first dropping and then rising nonlinear pattern. Second, the ranges of ALT activity corresponding to the lowest DKD risk were mostly overlapped.
Discussion
In this cross-sectional analysis, we observed a similar change in ALT activity in the non-DM group, DM without DKD, and DKD group in both the clinical data and NHANES dataset. Consistent with the previous studies, ALT activity in the DM group was higher than that in the non-DM group.14–16 Further, ALT activity decreased when DM progressed to DKD. Another cross-sectional study has also revealed that ALT activity in the DKD group was lower than that in the DM without DKD group (20 IU/L vs 22 IU/L, P < 0.001).17
The relationship between ALT and DKD presented a nonlinear U-shaped pattern as per the dose–response curves created by GAMs. Both lower (<40 IU/L) and higher (>50 IU/L) ALT activity increased the risk of DKD. Several studies tailored to CKD populations have investigated the relationship between ALT activity and CKD.18–20 For example, one study including 142 predialysis CKD individuals with a mean eGFR of 29.1±13 mL/min/1.73m2 revealed that ALT was reduced in proportion to the decrease in eGFR,18 and Selen et al also reported similar results.19 In contrast, another study including 29,133 individuals showed that ALT activity in the CKD group was greater than that in the non-CKD group and indicated that elevated ALT activity (>40 IU/L) significantly increased the risk of CKD (OR=1.53, 95% CI=1.31–1.79) compared to that in individuals with a normal ALT activity (≤40 IU/L, considered a reference).20 Another study targeting DKD patients showed that elevated ALT activity was associated with the remission of DKD.12 However, above analyses have shown that the relationship between ALT and CKD either descended or ascended monotonically. This might be attributed to the fact that a linear assumption of the association between the two attributes has been made in these previous studies. In the present study, we focused on the dose–response relationship and identified a first decreasing and then increasing U-shaped nonlinear pattern between ALT and DKD.
For the descending phase of the nonlinear U-shaped curve, lower ALT activity (<40IU/L) was correlated with higher DKD risk, implying decreased ALT activity with DKD progression. The possible pathophysiological mechanism might be the reduced activity of pyridoxal-5’-phosphate, a coenzyme of transaminases.21 Besides, uremic toxins might also suppress the synthesis of ALT in hepatocytes and inhibit the release of ALT from the hepatocytes into the blood.22,23 The ascending phase of the nonlinear curve indicated that elevated ALT (>50IU/L) increased the risk of DKD. This might be partially explained by the fact that elevated ALT activity commonly results from non-alcoholic fatty liver disease (NAFLD)-related hepatocyte damage. Previous studies suggested that NAFLD increases the risk of DKD through insulin resistance and the release of proinflammatory cytokines.24,25 Therefore, without conditioning on NAFLD, there is a positive correlation between ALT activity and DKD risk (Figure 3).
 |
Figure 3 The possible mechanism by which elevated alanine aminotransferase (ALT) activity (>50IU/L) increases the risk of diabetic kidney disease (DKD). ALT activity increases the risk of DKD while elevated ALT activity commonly results from non-alcoholic fatty liver disease (NAFLD)-related hepatocyte damage. NAFLD might directly increase the risk of DKD. Without considering on NAFLD, there is a positive correlation between ALT activity and DKD risk. |
This study had several advantages over previous studies. First, this is one of the first efforts to investigate the dose–response relationship between ALT and DKD, and a nonlinear U-shaped relationship is identified; however, previous studies have investigated the linear relationship between these two variables. Furthermore, in our previous study, we concluded that no linear causal association existed between ALT and DKD based on the Mendelian randomization analysis and hypothesized a nonlinear causal association.26 This study confirmed the non-linear association with clinical data. Second, we focused on diabetic individuals and assessed the relationship between ALT and DKD, which has seldom been investigated. Previous studies have focused mainly on the relationship between ALT activity and CKD.18,19 Third, two different datasets were used in this study, and the same conclusion was reached, thus minimizing the influence of racial disparities and improving its credibility. Lastly, previous studies divided the participants into either non-DM and DM groups or DM without DKD and DKD groups for relevant analysis. In this study, participants covered the onset and development of DM, namely, non-DM controls, diabetes without DKD, and DKD patients.
However, there were a few limitations as well. First, in the cross-sectional study, the temporal sequence between ALT and the incidence of DKD was indistinguishable. Therefore, we were unable to ascertain if the nonlinear association in the observational study is nonlinear causal. Second, the proportion of individuals with elevated ALT activity was relatively low. To investigate the impact of elevated ALT activity on DKD, additional research with a larger population size is required. Third, we could not rule out the possibility that the individuals with DKD were accompanied by renal damage caused by other disease, such as hypertensive renal injury. Finally, in the Chinese dataset, the difference in the absolute value of ALT activity between the DM and DKD groups was small (but it was statistically significant), which may be partially explained by the relatively small sample size and slight poor sample representativeness.
The nonlinear relationship found between ALT and DKD could have significant clinical implications. The individuals are at high risk of DKD when their ALT activities are significantly lower, such as the low-tail ranges of the nonlinear curve. In such cases, more attention should be paid to the activity of albuminuria and Cr. Further, for the individuals at high risk of DKD due to their significantly elevated ALT activity, such as the high-tail ranges of the non-linear curve, care should be taken to protect the liver from damage, thereby reducing the risk of DKD.
In conclusion, our clinical data showed a nonlinear U-shaped relationship between ALT and DKD risk, in concordance with the analysis of NHANES data. The risk of DKD increased by both lower or higher ALT activity. Early detection and prevention of DKD require more attention to an apparent abnormal ALT activity. Larger prospective studies or Mendelian randomization analysis are needed to verify if the nonlinear relationship is a nonlinear causal effect.
Data Sharing Statement
Restrictions apply to the availability of some data analyzed during this study to preserve patient confidentiality. The corresponding author will on request detail the restrictions and any conditions under which access to some data may be provided.
Ethics Approval and Informed Consent
The study was approved by Ethics Committee of the First Hospital of Jilin University. The patients’ personal data are anonymous, and the informed consent was therefore waived by the Ethics Committee. This study complied with the Declaration of Helsinki.
Acknowledgment
The authors thank the participants of the study.
Funding
This work was supported by the Science Technology Department of Jilin Province (20230505002ZP, YDZJ202201ZYTS121).
Disclosure
The authors report no conflicts of interest in this work.
References
1. Gupta S, Dominguez M, Golestaneh L. Diabetic kidney disease: an update. Med Clin North Am. 2023;107(4):689–705. doi:10.1016/j.mcna.2023.03.004
2. Sagoo MK, Gnudi L. Diabetic nephropathy: an overview. Methods Mol Biol. 2020;2067:3–7.
3. Senior JR. Alanine aminotransferase: a clinical and regulatory tool for detecting liver injury-past, present, and future. Clin Pharmacol Ther. 2012;92(3):332–339. doi:10.1038/clpt.2012.108
4. Liu A, Chen S, Guo X, Li Z, Zheng L, Sun Y. Relationship between alanine aminotransferase levels and type 2 diabetes mellitus in the general Chinese population. J Diabetes. 2017;9(12):1120–1123. doi:10.1111/1753-0407.12588
5. Fraser A, Harris R, Sattar N, Ebrahim S, Davey Smith G, Lawlor DA. Alanine aminotransferase, gamma-glutamyltransferase, and incident diabetes: the British Women’s Heart and Health Study and meta-analysis. Diabetes Care. 2009;32(4):741–750. doi:10.2337/dc08-1870
6. Wang CS, Chang TT, Yao WJ, Wang ST, Chou P. Impact of increasing alanine aminotransferase levels within normal range on incident diabetes. JFormos Med Assoc. 2012;111(4):201–208. doi:10.1016/j.jfma.2011.04.004
7. Jiamjarasrangsi W, Sangwatanaroj S, Lohsoonthorn V, Lertmaharit S. Increased alanine aminotransferase level and future risk of type 2 diabetes and impaired fasting glucose among the employees in a university hospital in Thailand. Diabetes Metabolism. 2008;34(3):283–289. doi:10.1016/j.diabet.2008.01.009
8. Vozarova B, Stefan N, Lindsay RS, et al. High alanine aminotransferase is associated with decreased hepatic insulin sensitivity and predicts the development of type 2 diabetes. Diabetes. 2002;51(6):1889–1895. doi:10.2337/diabetes.51.6.1889
9. Schneider AL, Lazo M, Ndumele CE, et al. Liver enzymes, race, gender and diabetes risk: the Atherosclerosis Risk in Communities (ARIC) Study. Diabetic Med. 2013;30(8):926–933. doi:10.1111/dme.12187
10. Kunutsor SK, Apekey TA, Walley J. Liver aminotransferases and risk of incident type 2 diabetes: a systematic review and meta-analysis. Am J Epidemiol. 2013;178(2):159–171. doi:10.1093/aje/kws469
11. Deravi N, Dehghani Firouzabadi F, Moosaie F, et al. Non-alcoholic fatty liver disease and incidence of microvascular complications of diabetes in patients with type 2 diabetes: a prospective cohort study. Front Endocrinol. 2023;14:1147458. doi:10.3389/fendo.2023.1147458
12. Yanagawa T, Koyano K, Azuma K. Retrospective study of factors associated with progression and remission/regression of diabetic kidney disease-hypomagnesemia was associated with progression and elevated serum alanine aminotransferase levels were associated with remission or regression. Diabetol Int. 2021;12(3):268–276. doi:10.1007/s13340-020-00483-1
13. Afarideh M, Aryan Z, Ghajar A, et al. Association of non-alcoholic fatty liver disease with microvascular complications of type 2 diabetes. Prim Care Diabetes. 2019;13(6):505–514. doi:10.1016/j.pcd.2019.03.009
14. Bi Y, Yang S, Liu Y, et al. To explore association between gamma-glutamyl transferase and type 2 diabetes using a real-world study and Mendelian randomization analysis. Front Endocrinol. 2022;13:899008. doi:10.3389/fendo.2022.899008
15. Noroozi Karimabad M, Khalili P, Ayoobi F, Esmaeili-Nadimi A, La Vecchia C, Jamali Z. Serum liver enzymes and diabetes from the Rafsanjan cohort study. BMC Endocr Disord. 2022;22(1):127. doi:10.1186/s12902-022-01042-2
16. Ahamed F, Karim MR, Haque MA, et al. Study on alanine aminotransferase in patients of type 2 diabetes mellitus. Mymensingh Med J. 2021;30(2):343–350.
17. Wang J, Liu F, Kong R, Han X. Association between globulin and diabetic nephropathy in type 2 diabetes mellitus patients: a cross-sectional study. Front Endocrinol. 2022;13:890273. doi:10.3389/fendo.2022.890273
18. Sette LH, Lopes EP. The reduction of serum aminotransferase levels is proportional to the decline of the glomerular filtration rate in patients with chronic kidney disease. Clinics. 2015;70(5):346–349. doi:10.6061/clinics/2015(05)07
19. Selen T, Akoglu H, Agbaht K. Relationship between liver function tests & cardiovascular risk factors in stage 3–5 pre-dialysis chronic kidney disease. Indian J Med Res. 2022;155(3&4):397–402. doi:10.4103/ijmr.IJMR_1777_19
20. Ochiai H, Shirasawa T, Yoshimoto T, et al. Elevated alanine aminotransferase and low aspartate aminotransferase/alanine aminotransferase ratio are associated with chronic kidney disease among middle-aged women: a cross-sectional study. BMC Nephrol. 2020;21(1):471. doi:10.1186/s12882-020-02144-6
21. Ono K, Ono T, Matsumata T. The pathogenesis of decreased aspartate aminotransferase and alanine aminotransferase activity in the plasma of hemodialysis patients: the role of vitamin B6 deficiency. Clin nephrol. 1995;43(6):405–408.
22. Ray L, Nanda SK, Chatterjee A, Sarangi R, Ganguly S. A comparative study of serum aminotransferases in chronic kidney disease with and without end-stage renal disease: need for new reference ranges. Int J App Basic Med Res. 2015;5(1):31–35. doi:10.4103/2229-516X.149232
23. Fabrizi F, Lunghi G, Finazzi S, et al. Decreased serum aminotransferase activity in patients with chronic renal failure: impact on the detection of viral hepatitis. Am J Kidney Dis. 2001;38(5):1009–1015. doi:10.1053/ajkd.2001.28590
24. Perdomo CM, Garcia-Fernandez N, Escalada J. Diabetic kidney disease, cardiovascular disease and non-alcoholic fatty liver disease: a new triumvirate? J Clin Med. 2021;10(9):2040. doi:10.3390/jcm10092040
25. Targher G, Lonardo A, Byrne CD. Nonalcoholic fatty liver disease and chronic vascular complications of diabetes mellitus. Nat Rev Endocrinol. 2018;14(2):99–114. doi:10.1038/nrendo.2017.173
26. Bi Y, Liu Y, Wang H, Tian S, Sun C. The association of alanine aminotransferase and diabetic microvascular complications: a Mendelian randomization study. Front Endocrinol. 2023;14:1104963. doi:10.3389/fendo.2023.1104963
 © 2024 The Author(s). This work is published and licensed by Dove Medical Press Limited. The
full terms of this license are available at https://www.dovepress.com/terms
and incorporate the Creative Commons Attribution
- Non Commercial (unported, 3.0) License.
By accessing the work you hereby accept the Terms. Non-commercial uses of the work are permitted
without any further permission from Dove Medical Press Limited, provided the work is properly
attributed. For permission for commercial use of this work, please see paragraphs 4.2 and 5 of our Terms.
© 2024 The Author(s). This work is published and licensed by Dove Medical Press Limited. The
full terms of this license are available at https://www.dovepress.com/terms
and incorporate the Creative Commons Attribution
- Non Commercial (unported, 3.0) License.
By accessing the work you hereby accept the Terms. Non-commercial uses of the work are permitted
without any further permission from Dove Medical Press Limited, provided the work is properly
attributed. For permission for commercial use of this work, please see paragraphs 4.2 and 5 of our Terms.