Back to Journals » Diabetes, Metabolic Syndrome and Obesity » Volume 13
CHDH-PNPLA3 Gene–Gene Interactions Predict Insulin Resistance in Children with Obesity
Authors Chirita-Emandi A ![]() , Serban CL
, Serban CL ![]() , Paul C, Andreescu N, Velea I
, Paul C, Andreescu N, Velea I ![]() , Mihailescu A, Serafim V
, Mihailescu A, Serafim V ![]() , Tiugan DA
, Tiugan DA ![]() , Tutac P
, Tutac P ![]() , Zimbru C
, Zimbru C ![]() , Puiu M
, Puiu M ![]() , Niculescu MD
, Niculescu MD
Received 16 August 2020
Accepted for publication 26 September 2020
Published 19 November 2020 Volume 2020:13 Pages 4483—4494
DOI https://doi.org/10.2147/DMSO.S277268
Checked for plagiarism Yes
Review by Single anonymous peer review
Peer reviewer comments 2
Editor who approved publication: Professor Ming-Hui Zou
Adela Chirita-Emandi,1,2,* Costela Lacrimioara Serban,2,3,* Corina Paul,4,5,* Nicoleta Andreescu,1,2 Iulian Velea,4,5 Alexandra Mihailescu,1 Vlad Serafim,1,6 Diana-Andreea Tiugan,1 Paul Tutac,1 Cristian Zimbru,1,7 Maria Puiu,1,2 Mihai Dinu Niculescu1,8
1Department of Microscopic Morphology - Genetics, Center of Genomic Medicine, University of Medicine and Pharmacy “Victor Babes”, Timisoara, Romania; 2Regional Center of Medical Genetics Timis, Clinical Emergency Hospital for Children “Louis Turcanu”, Timisoara, Romania; 3Department of Functional Sciences, University of Medicine and Pharmacy “Victor Babes”, Timisoara, Romania; 4Pediatrics Department – Pediatrics Discipline II, University of Medicine and Pharmacy “Victor Babes”, Timisoara, Romania; 5Pediatrics, Endocrinology and Diabetes Department, Clinic II Pediatrics, “Pius Branzeu” Clinical Emergency County Hospital, Timisoara, Romania; 6The National Institute of Research and Development for Biological Sciences, Bucharest, Romania; 7Department of Automation and Applied Informatics, Politehnica University of Timisoara, Timisoara, Romania; 8Advanced Nutrigenomics, Cary, NC 27511, USA
*These authors contributed equally to this work
Correspondence: Nicoleta Andreescu
Department of Microscopic Morphology - Genetics, Center of Genomic Medicine, University of Medicine and Pharmacy “Victor Babes”, Timisoara, Romania
Email [email protected]
Introduction: Insulin resistance plays a major role in metabolic syndrome and is recognized as the most common risk factor for non-alcoholic fatty liver disease (NAFLD). Identifying predictors for insulin resistance could optimize screening and prevention.
Purpose: To evaluate the contribution of multiple single nucleotide polymorphisms across genes related to NAFLD and choline metabolism, in predicting insulin resistance in children with obesity.
Methods: One hundred fifty-three children with obesity (73 girls), aged 7– 18 years, were evaluated within the NutriGen Study (ClinicalTrials.gov-NCT02837367). Insulin resistance was defined by Homeostatic Model Assessment for insulin-resistance cut-offs that accommodated pubertal and gender differences. Anthropometric, metabolic, intake-related variables, and 55 single nucleotide polymorphisms related to NAFLD and choline metabolism were evaluated. Gene–gene interaction effects were assessed using Multiple Data Reduction Software.
Results: Sixty percent (93/153) of participants showed insulin resistance (58.7% of boys, 63% of girls). Children with insulin resistance presented significantly higher values for standardized body mass index, triglycerides, transaminases and plasma choline when compared to those without insulin resistance. Out of 52 single nucleotide polymorphisms analysed, the interaction between genotypes CHDH(rs12676) and PNPLA3(rs738409) predicted insulin resistance. The model presented a 6/10 cross-validation consistency and 0.58 testing accuracy. Plasma choline levels and alanine aminotransferase modulated the gene interaction effect, significantly improving the model.
Conclusion: The interaction between genotypes in CHDH and PNPLA3 genes, modulated by choline and alanine aminotransferase levels, predicted insulin-resistance status in children with obesity. If replicated in larger cohorts, these findings could help identify metabolic risk in children with obesity.
Keywords: insulin-resistance, obesity, gene–gene interaction, CHDH-PNPLA3, choline, children
Introduction
Obesity prevalence is increasing worldwide, in both adults and children,1,2 concomitantly escalating the risk for type 2 diabetes and cardio-metabolic diseases.3 Insulin resistance plays a major part in both metabolic syndrome and type 2 diabetes mellitus.4 Furthermore, insulin resistance is recognized as the most common risk factor for non-alcoholic fatty liver disease (NAFLD) development and progression in adults.5,6 NAFLD has rapidly evolved into becoming the most common liver disease in the paediatric population in the United States, an inducer of insulin resistance, and being associated with increased adiposity.7 Evidence suggests that NAFLD is associated with hepatic and non-hepatic morbidity and mortality, and could progress to cirrhosis and end-stage liver disease.8 Identifying predictors of insulin resistance could help optimize screening and prevention.
Insulin resistance in children is influenced by several factors including degree and disposition of adiposity, gender, pubertal stage, diet, lipid metabolism and genetic predisposition.9,10 Single Nucleotide Polymorphisms (SNPs) in several genes, including PNPLA3, TM6SF2, MBOAT7 and GCKR, have been identified to predict the development and severity of NAFLD in relation to insulin resistance in adults.10–12 Another study identified SNPs related to choline metabolism genes including PNPLA3, CHDH, PEMT, ABCB4, MTHFR, and SLC44A1, which were associated with liver steatosis in adults with obesity.13 Choline was identified as an essential nutrient for liver, muscle, and brain function, having a key role in the synthesis of acetylcholine, methylation, gene expression and lipid metabolism.14 However, the potential roles of genetic variations on the risk of paediatric NAFLD are currently not well established.11 This study aimed to evaluate the contribution of multiple SNPs across genes related to NAFLD and choline metabolism, and their interactions, in predicting insulin resistance in children with obesity.
Participants and Methods
Participants and Samples
Two hundred children (95 males, 105 females) aged 7–18 years, with obesity defined using the World Health Organization 2007 reference, if more than +2 Standard Deviation (SD),15 were evaluated within the NutriGen Study protocol. The trial is registered at ClinicalTrials.gov, NCT02837367. Clinical evaluation was performed in a paediatric hospital in Timisoara, Romania. Exclusion criteria were previously described elsewhere16 and included diagnosis of cancer, or medical history of cancer; auto-immune disease; psychiatric disorder; blood coagulation disorders; history of drug abuse; familial hypercholesterolemia; endocrine-induced obesity, hypothalamus-induced obesity, genetic syndromes; deposition diseases; personal history for: convulsive disorders, nephrotic syndrome, or asthma that required corticoid treatment. Subjects with incomplete sequencing data (1 SNP missing) were excluded from this study (n=47). Consequently, the present analysis included 153 children (80 boys, 73 girls). The term “children” will be used in this manuscript to also include adolescents.
The study was approved by the Ethics Committee of the “Victor Babes” University of Medicine and Pharmacy (6/20.06.2016), Timisoara, Romania, and conducted in accordance with the Declaration of Helsinki. Participants and their parents or legal guardians were informed about the aims and methods of the study. Written consent was signed by parents or legal guardians of the participants and children provided verbal consent to be included in the study.
Anthropometric Measurements
Anthropometric measurements were performed following international guidelines,17 as described previously.16 Standardized BMI-for-age z-scores (zBMI) were calculated according to the World Health Organization guidelines taking into account the age and gender of the child.15 Waist circumference was measured with an inextensible anthropometric tape, by a trained person, to the nearest 0.1 cm, in standing position, at the midpoint between the end of the rib cage and the top of the iliac crest. Hip circumference was measured around the widest portion of the hip.18 Waist to hip ratio (WHR) was calculated by dividing waist circumference (cm) to hip circumference (cm).
Food and Drink Intakes
Food and drink intakes were evaluated using 5-pass 24-h dietary recalls as previously described.19 In short, four recalls were performed on each participant, if older than 13 years of age, or to both a parent and the child, if the participant was younger. The declared amounts for each day investigated (foods and drinks) were converted to energy and nutrient intakes using a web-application (Nutritio, Bucharest, Romania, https://nutritioapp.com), using the United States Department of Agriculture Food and Nutrient Database for Dietary Studies and other databases for local foods, and with appropriate adaptations described elsewhere.19 Resting energy expenditure (REE), validated in children with obesity, was computed using the formula proposed by Lazzer et al,20 in order to compare food and drink intakes across different ages and genders. Energy intake and macronutrient percentage (carbohydrate and fat) were calculated as means of the four 24 h recalls for each child. The fraction of energy intake from REE was computed as energy intake (kcal)/REE (kcal) and further used as a variable.
Participants’ intakes were evaluated during the period when they followed medical recommended diet and supervision, following recommendations from Endocrine Society Clinical Practice 2017 Guideline.3 In brief, the main recommendations were to reduce portion size, decrease consumption of fast foods, high-fat, high-sodium, processed foods, added table sugar and the elimination of sugar-sweetened beverages.
Biochemistry
Blood samples were collected in the morning, following overnight fasting (for at least 8 h), in EDTA sterile vacutainers. Total plasma concentrations of aspartate aminotransferase (AST), alanine aminotransferase (ALT), total cholesterol, high-density lipoprotein (HDL) cholesterol, triglycerides, and glucose were performed using its standardized reagents and following the manufacturer’s protocols, as presented previously.16 Insulin measurements were performed using ELISA method, as shown.16
Homeostatic model assessment for insulin resistance (HOMA-IR) was calculated using the formula: fasting insulin (mIU/L) × fasting glucose (mmol/L)/22.5. In order to account for differences between boys and girls and for the physiological insulin resistance during puberty,21 different HOMA-IR cut-offs were used to define insulin resistance, stratified by gender and by age groups. For boys 13 years old or younger, HOMA-IR above 2.67 was used to define insulin resistance, while for boys older than 13 years, insulin resistance was defined if HOMA-IR was higher than 5.22. For girls, 11 years old or younger, HOMA-IR above 2.22 was used to define insulin resistance, while for girls older than 11 years, insulin resistance was defined if HOMA-IR was higher than 3.82, similarly to that described by Kurtoğlu et al 2010.22
Fatty Acids Quantification
Fatty acids quantification from red blood cell (RBC) membrane was performed by high-performance liquid chromatography–tandem mass spectrometry (LC-MS/MS), using an adaptation of a previously described protocol.16
Quantification of Plasma Choline and Betaine
Choline and betaine were measured from plasma by liquid chromatography-tandem mass spectrometry (LC-MS/MS) using a previously described method,23 with adaptations for the laboratory specifics. Method is described in the supplementary material (Table S1 and supplementary “Quantification of plasma choline and betaine” section).
Genetic Analysis of Single Nucleotide Polymorphisms (SNPs)
Genotyping was performed on a MiSeq sequencer (Illumina, San Diego, CA, USA) using a custom-made hotspot sequencing kit for 55 SNPs within 14 genes involved in choline/1-carbon metabolism,16 selected based on their previous association with increased lipids, non-alcoholic fatty liver, or cardiovascular disease.13 Three SNPs (rs12103822 in PEMT, rs7525338 and rs868014 in MTHFR) were excluded from analysis due to lack of variation in the participants (only homozygous status was identified).
Statistical Analysis
Data analysis was performed using IBM-SPSS version 25 (IBM, Armonk, New York, U.S.A.). Descriptive statistics for numerical variables included means and standard deviations. For categorical variables, frequency as percentage (%) and/or count (n) were included. The t-test with two-factor comparisons was used for variables assuming normal distribution. For variables with non-parametric distribution, the Mann–Whitney test was used. Normal distribution was assessed with the Kolmogorov–Smirnov test. Chi-square was used for proportion comparison. The multiple comparisons were adjusted for false discovery rate (FDR), using an online tool (https://tools.carbocation.com/FDR). This method adjusted the p values obtained by statistical tests to the number of tests per each research hypothesis. The threshold of statistical significance for adjusted p-values was p<0.05. Gene-gene interaction effects were assessed using Multifactor Dimensionality Reduction (MDR) version 3.0.2 (http://epistasis.org/). MDR software was used to evaluate the influence of the SNPs tested and/or their interactions on the insulin resistance, set as categorical outcome (no/yes), using the HOMA-IR (gender- and puberty-specific) cut-offs. Choline levels and ALT levels were grouped in tertiles and introduced in the model as covariates.
Results
Sixty percent (93/153) of the children with obesity (58.7% of boys and 63% of girls) included in the present study presented insulin resistance, defined by HOMA-IR cut-offs that accommodate for pubertal and gender differences (see Materials and Methods). None of the children presented type 2 diabetes mellitus. Proportions of increased ALT levels (>40 U/L) were similar between children with or without insulin resistance 20.0% (12), respective 33.3% (31), p=0.073. Descriptive statistics presented in Table 1 show the mean ± SD values of anthropometric, metabolic and intake-related variables, overall and separately for gender and insulin-resistance status. Between-gender comparisons showed higher mean values of zBMI, WHR and fraction of energy intake form REE for boys, as compared to girls. Participants with insulin resistance (defined by HOMA-IR status) presented significantly higher values for zBMI, triglycerides, AST, ALT and choline, compared to those without insulin resistance.
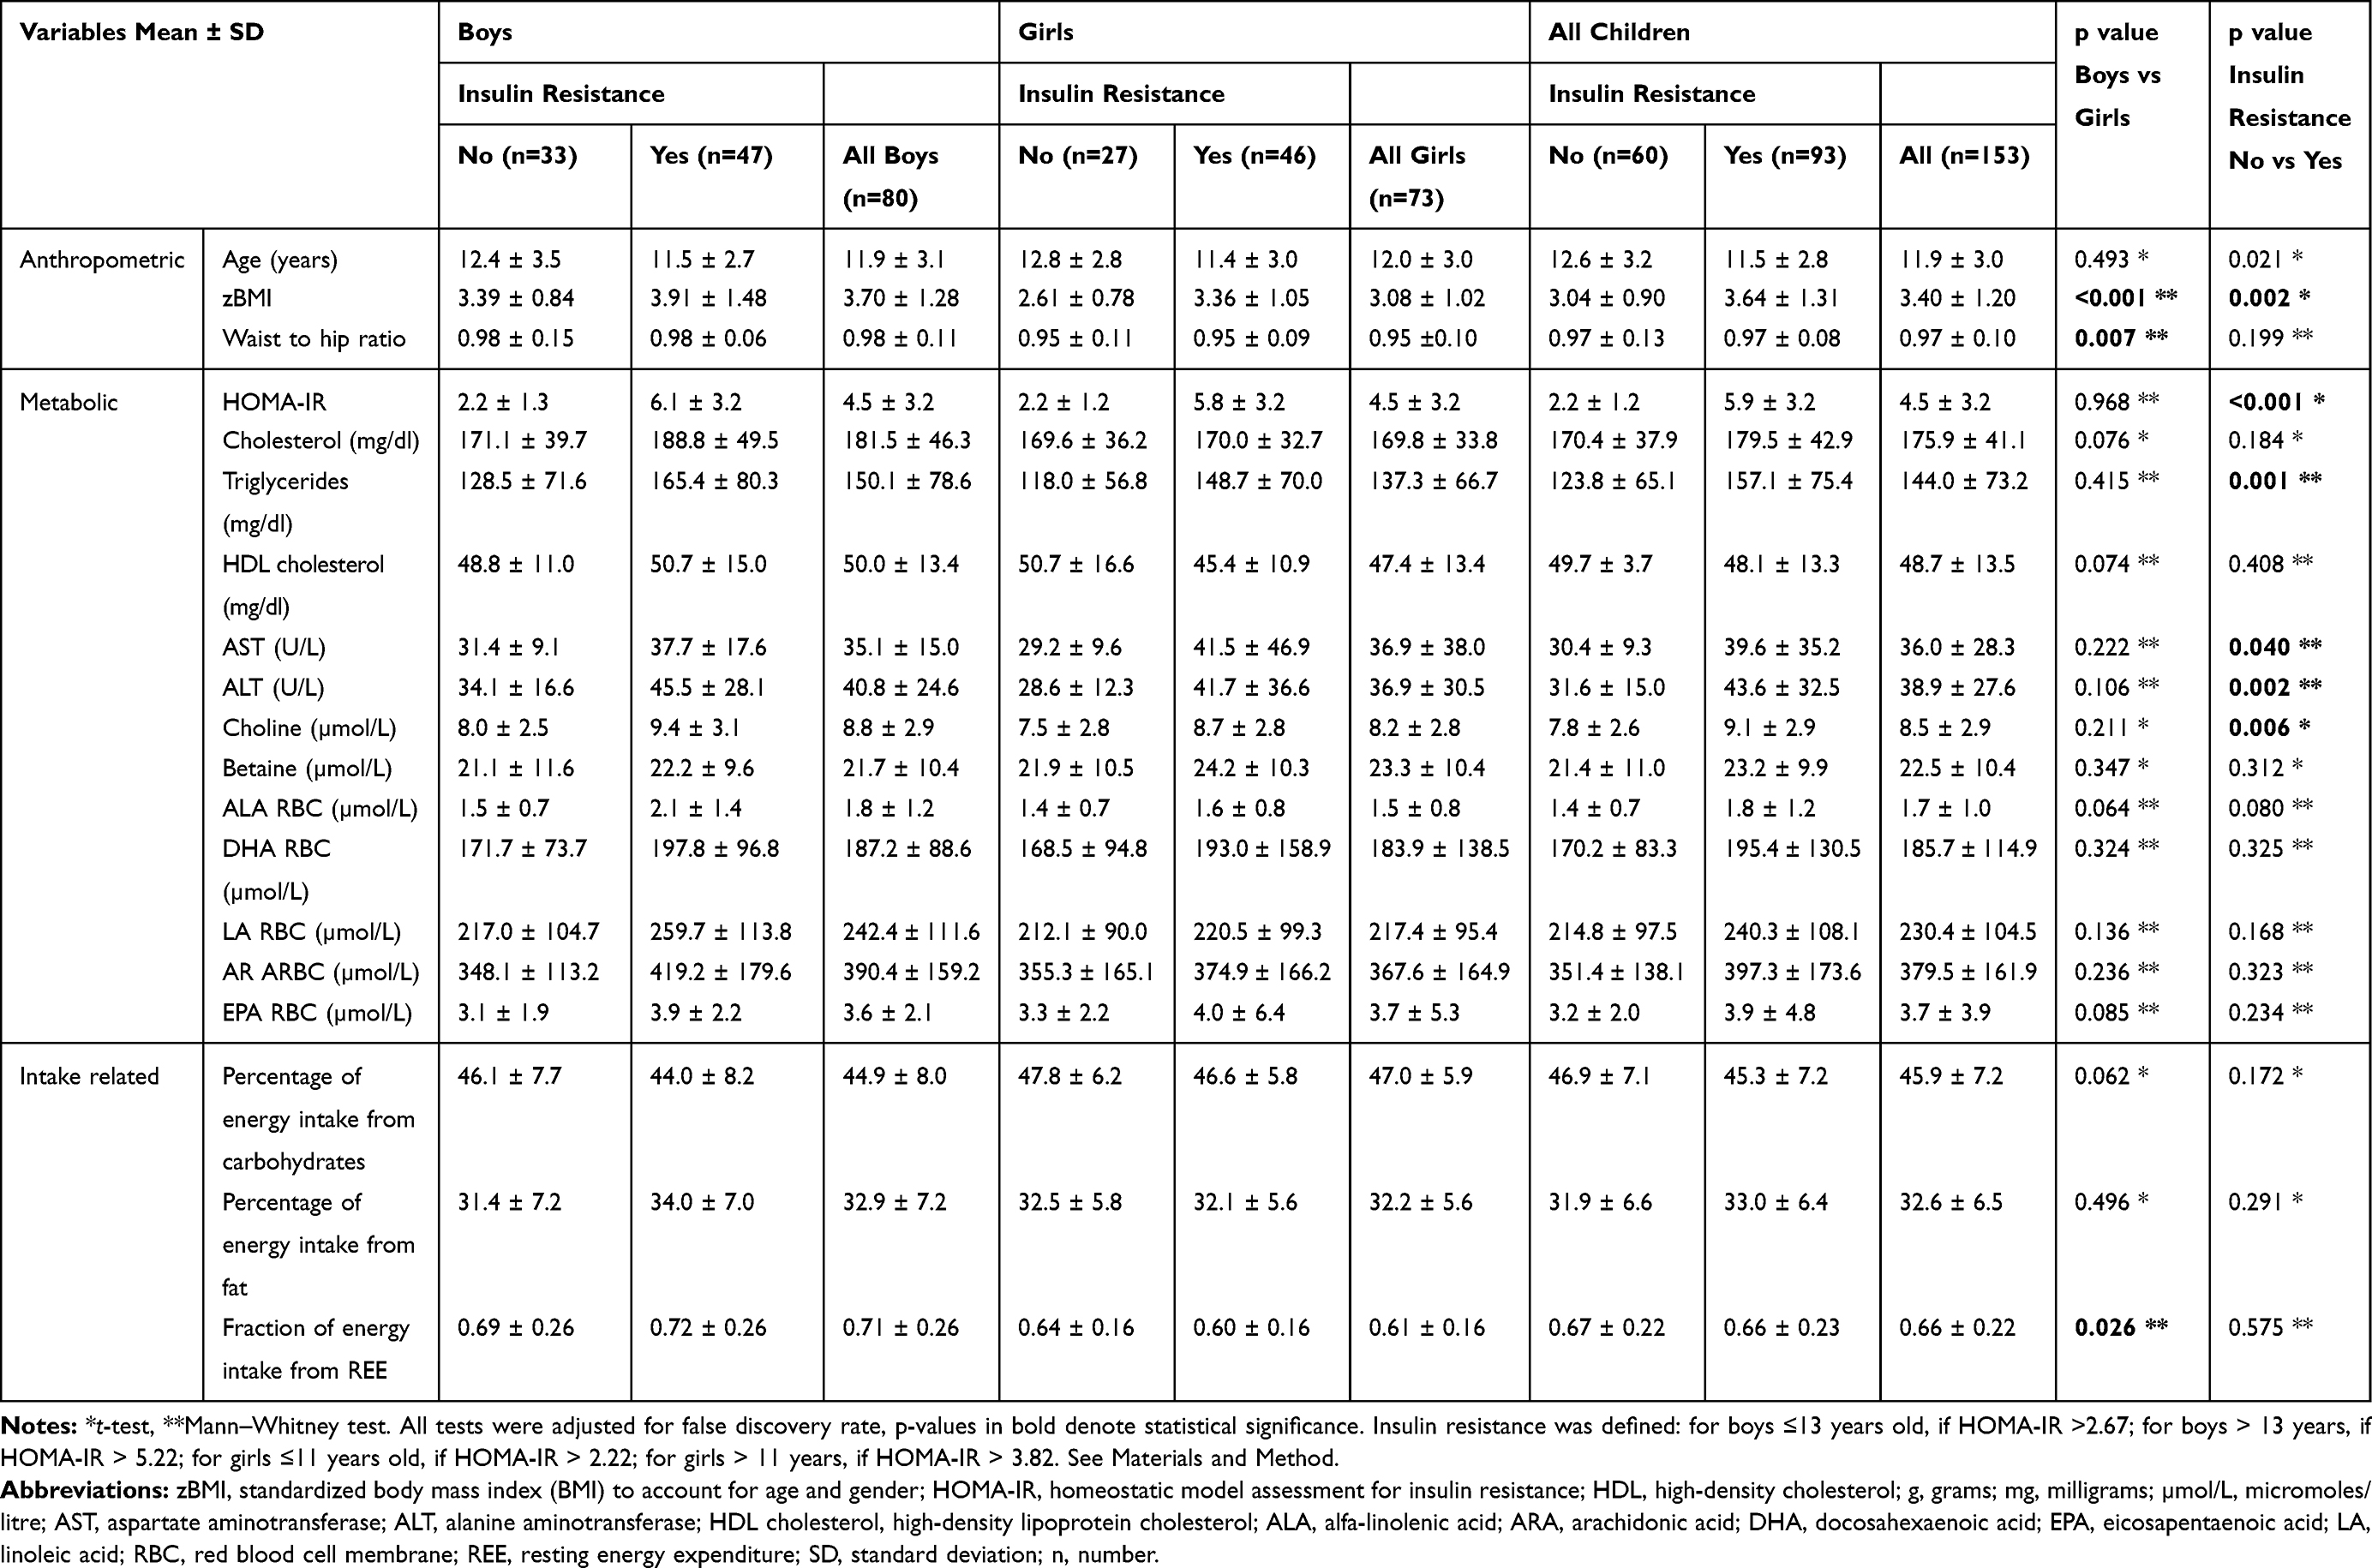 |
Table 1 Descriptive Statistics (Mean ± SD) of Anthropometric, Biochemical and Intake-Related Variables in 153 Children with Obesity and Comparatively in Boys and Girls |
Age distribution of HOMA-IR values depicted as boxplot separately for boys and girls in Figure 1, showed a peak value of 5.25 at age 12 years in girls and a peak value of 6.67 at age 14 years in boys. The number of children in each age group is presented in supplementary material (Table S2).
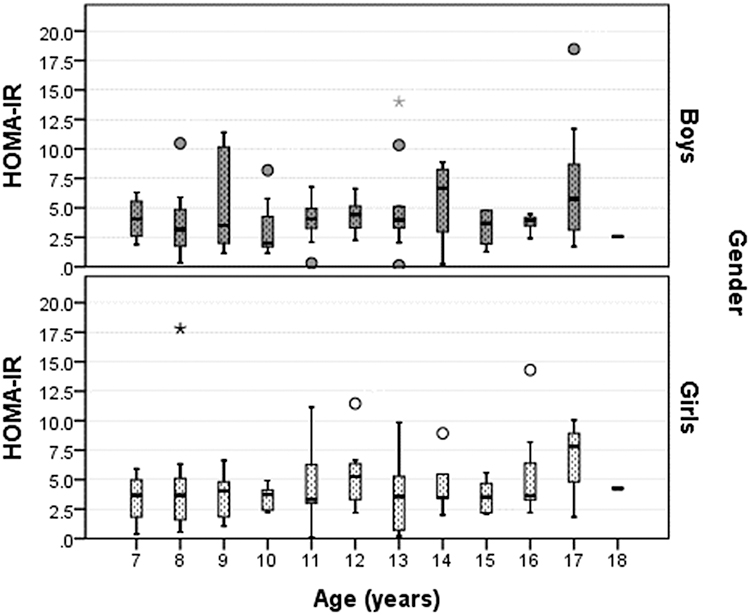 |
Figure 1 Distribution of HOMA-IR values depicted as boxplot separately for boys and girls, by age (rounded).Notes: Horizontal lines, within each boxplot, indicate minimum, first quartile (Q1), median, third quartile (Q3), and maximum. Outliers marked with circles are cases with values between 1.5 and 3 times the IQ range, beyond the whiskers. Outliers marked with a star are cases with values more than 3 times the IQ range. |
The frequency of the 52 SNPs studied in our cohort of 153 children with obesity is presented in Supplementary Material (Table S3). Using 52 SNPs, in a multifactor dimensionality reduction statistical model, the interactions between genotypes in rs12676 (CHDH) and rs738409 (PNPLA3) were identified as the best predictor for insulin resistance. The nine interactions between the two SNPs were grouped in high and low risk, as shown in Table 2 and further used in Table 3. The high and low risk for insulin-resistance model presented a cross-validation consistency of 6/10 and a testing accuracy of 0.58, which exceeded the threshold 0.5 expected under the null hypothesis. Considering that, CHDH and PNPLA3 genes are involved in choline metabolism, and that choline plasma concentrations were different between participants with and without insulin resistance, we further evaluated the modulating effect of choline on the model. When using choline as covariate, an improvement in the model’s cross-validation consistency (9/10) and testing accuracy (0.63) was detected. When using ALT as covariate, the model has improved even further with cross-validation consistency (10/10) and testing accuracy (0.69).
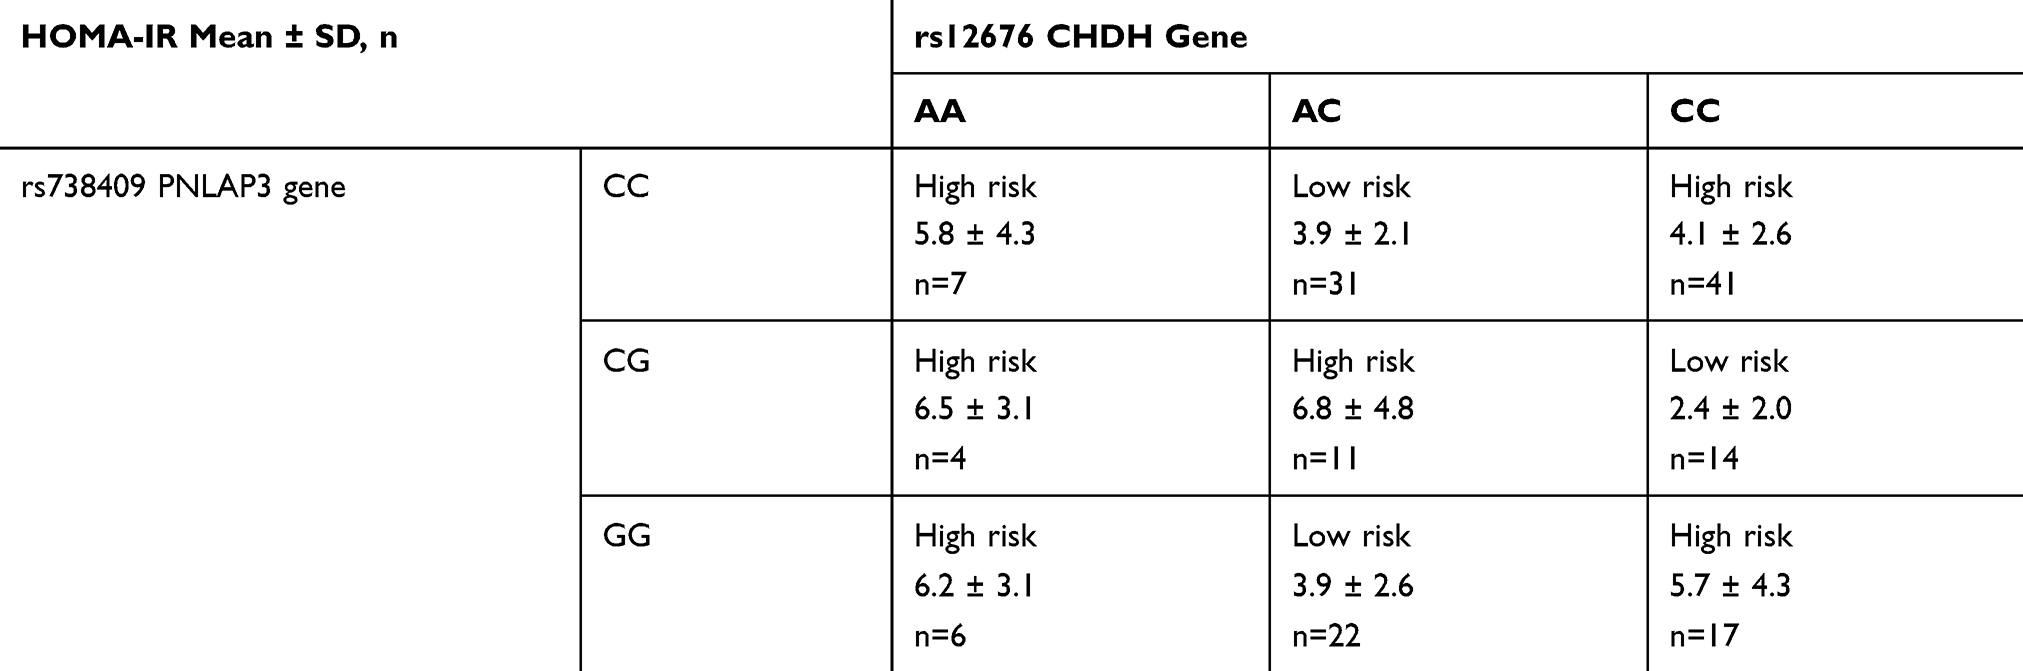 |
Table 2 Description of Interaction Groups Formed by Genotypes in rs12676 in CHDH and rs738409 in PNPLA3 Gene to Predict Insulin Resistance Using the Gender and Puberty-Specific HOMA-IR Cut-Offs |
 |
Table 3 Comparison Between Anthropometric, Biochemical and Intake-Related Variables in 153 Children with Obesity, Classified by the Interaction Between Rs12676 and Rs738409, to Predict High/Low Risk for Insulin Resistance Using the Gender and Puberty-Specific HOMA-IR Cut-Offs |
Comparisons of anthropometric, metabolic and intake-related variables between high and low risk for insulin resistance, classified by the interaction between rs12676 and rs738409, are presented in Table 3. The only significant difference was for HOMA-IR levels, with higher values in the high-risk group.
Discussion
Obesity is increasingly prevalent in adults and children.1,2 Obesity-related complications, such as cardiovascular disease and type 2 diabetes are also rising, and are frequently diagnosed in the paediatric population with obesity.1 In Romania, almost one in four children, aged 6–19 years, was either overweight or with obesity, in a pooled analysis performed between 2006 and 2015.24 Insulin resistance was recognized as the most common risk factor for non-alcoholic fatty liver disease (NAFLD), in the setting of excess adiposity, in adults and children.7 Recognizing the predictors of insulin resistance is crucial for optimal screening. However, considering normal physiological changes that occur in children during puberty, it is difficult to establish a standard definition for insulin resistance across paediatric age groups.
Defining Insulin Resistance
The gold standard to determine insulin resistance is the euglycemic-hyperinsulinemic clamp study. However, this invasive method is not routinely used in daily clinical practice. HOMA-IR is the most widely used surrogate measure for insulin resistance.25 In a systematic review of 298 articles, 51 different HOMA-IR cut-off values were used to classify patients as having insulin resistance.25 The authors indicated that 85.6% of studies used a predetermined fixed cut-off value, with the most frequently used HOMA-IR cut-offs of 3.16 and 2.5.25 Nonetheless, children normally experience transient insulin resistance at puberty.22 This circumstance needs to be accounted for in defining insulin resistance in children. A systematic review, summarizing population-based studies on the epidemiology of insulin resistance during childhood, showed that prevalence rates vary widely due to the variety of definitions used.26 A European study identified insulin resistance (using HOMA-IR>3.4) in 16.6% of prepubertal children (<10 years) with obesity and 47.3% of adolescents (11–18 years) with obesity,4 comparable to the prevalence identified by this study.
In this study, HOMA-IR distribution across ages and genders was similar to that identified by Kurtoğlu et al 2010.22 Notably in this study, the age of the HOMA-IR peak was higher in boys and girls when compared to Kurtoğlu et al 2010.22 We defined insulin resistance using HOMA-IR cut-offs that accommodated gender and puberty,22 in order to avoid classifying physiological pubertal values as pathologic status. Insulin resistance in our cohort was observed in 60.7% of the children with obesity (58.7% of boys and 63% of girls) using HOMA-IR cut-offs that accommodate gender and pubertal differences.
Gender Differences in Insulin Resistance
Gender differences in body composition and energy balance are well known.27 In this study, boys presented higher standardized BMI score when compared to girls (Table 1), in accordance with other studies from Romania regarding children with obesity.24 Boys presented higher mean values of waist-to-hip ratio when compared to girls, similar to other studies in this age group, showing differences in adiposity disposition between genders, especially after puberty.28 The mean fraction of energy intake from REE was higher for boys when compared to girls. In the same way, a large study on 6553 children aged 9–11 years from 12 countries has shown that boys had a lower compliance with dietary recommendations as compared to girls.29 These findings may provide insight into the pathogenesis of insulin resistance, visceral adiposity and obesity, with the potential to guide gender-tailored interventions for prevention and treatment.
Metabolic Predictors for Insulin Resistance
Participants with insulin resistance in our cohort presented significantly higher values for standardized BMI, triglycerides, AST and ALT, as compared to those without insulin resistance. Similar findings were observed in many studies,4,5,30,31 reflecting the metabolic risk in children with obesity and insulin resistance.9 Furthermore, insulin resistance, dyslipidaemia and ALT are the recommended screening makers for NAFLD in all children with obesity or overweight starting at the age of 9–11 years, according to the NASPGHAN 2017 guidelines.7 Based on these recommendations, the children with insulin resistance in our cohort showed an increased risk for NAFLD.
No significant differences regarding the prevalence of insulin resistance between girls and boys were noted in this study, in the context of the variable cut-offs used, which were tailored for gender and pubertal status.
Choline was significantly higher in children with insulin resistance when compared to those without. We did not identify other studies that investigated choline in children with obesity and in relationship with their insulin resistance. In adults, higher levels of serum choline were associated with a healthier body composition only in men.32 Higher intakes of choline were found negatively associated with insulin resistance,33 subclinical markers of cardiovascular disease and incidence of cardiovascular disease34 in both genders and risk of type 2 diabetes in men.35,36 Choline metabolism is involved in very low-density lipoprotein secretion in the liver, making this nutritional pathway an important contributor to hepatic lipid homeostasis. It also intersects with multiple pathways that intervene in the deposition of lipids in the liver.13 The contribution of choline in the complexity of insulin-regulated glycolytic and lipogenic homeostasis is insufficiently understood in children.
The fatty acid level of RBC could reflect their status in other organs and could potentially represent a proxy for the evaluation of polyunsaturated fatty acid homeostasis in the human body.16 In our study, fatty acids measured in RBC were not significantly different between those with and without insulin resistance. However, alfa-linolenic acid (ALA, Table 1) was higher in those with insulin resistance, and close to significance (p=0.08), suggesting the possibility that, in a larger cohort, the difference could reach significance. A study in Danish adolescents (10–17 years old, out of which 8% with obesity) observed a tendency toward a significant association between HOMA-IR and RBC-DHA (0.052), but not with ALA.37 Nonetheless, comparison is difficult as the population differed in obesity prevalence and feeding practices.
Genetic Predictors for Insulin Resistance
We used a machine-learning automatic approach, within a multifactor dimensionality reduction analysis to evaluate the association of 52 SNPs and/or their interactions with insulin resistance. Prediction for insulin resistance was identified for the interaction between genotypes rs12676 (CHDH) and rs738409 (PNPLA3) (shown in Table 2), which was further modulated by choline plasma levels and ALT (used as a proxy for NAFLD). These findings were not reported in other studies, although many nutrigenomic studies investigated the influence of single or multiple SNPs using multiple regression.38,39 Regression is limited due to the complex evaluation of the million possible genetic interactions between various SNPs. The MDR overcomes this limitation, being a non-parametric machine-learning method, proposed in 2001, that classifies multi-dimensional genotypes into one dimensional, binary approach.40,41 Thus, MDR is able to evaluate complex outcomes associated with multiple genetic and environmental factors alone, as well as with their interactions. MDR is increasingly popular and has been recognized as a robust methodology for the evaluation of gene–gene interaction effects.42–44
Different studies have chosen different SNPs to evaluate the association with insulin resistance, using a hypothesis-driven approach, as presented in the 2017 ISNN consensus regarding nutrigenetic, nutrigenomic and nutriepigenetic approaches for precision nutrition involving the prevention and management of chronic diseases associated with obesity.39 Most of this research has used results from Genome Wide Association Studies (GWAS) to identify the effects of genetic variants on the disease risk. However, the identified SNPs have a modest effect, leading to the “missing heritability” problem. Many findings from GWAS are not replicated in smaller cohorts. For example, results on 53 loci, in several genes including INSR, IRS1 and PIK3R1 genes, selected based on genome-wide analyses of fasting insulin adjusted for BMI, did not identify loci with a primary effect on higher adiposity and insulin resistance in a large study on adults.38 However, a genetic score, computed from the same 53 loci, was associated with insulin resistance, in children with overweight or obesity,45 suggesting that genomic approaches need to be integrative, and also envisaging gene–gene interaction effects. SNPs identified to be associated with NAFLD were not included in the 53 SNPs studied in relation to insulin resistance. Nonetheless, other studies have investigated PNPLA3, TM6SF2, MBOAT7, GCKR, CHDH, PEMT, ABCB4, MTHFR, and SLC44A1 genes and identified associations with the development and severity of NAFLD in relation to insulin resistance in adults.10–13 Genes in choline and 1‐carbon metabolism, including CHDH and PNLAP3, were shown to influence hepatic lipid balance. The unfavorable balance between lipid intake and output contributes to hepatic steatosis. Secretion of very low-density lipoproteins requires synthesis of a lipid cover enclosing apoproteins and phosphatidylcholine. Several gene products interplay in the lipid balance in the liver, including CHDH and PNLAP3. CHDH is an important gene for the pathway forming phosphatidylcholine, which is used to make very low-density lipoproteins, or can be hydrolyzed in a pathway implicating PNPLA3, or secreted in bile by a flippase encoded by ABCB4 gene.13
The PNPLA3 rs738409 polymorphism may be the most investigated SNP in relation to the accumulation of lipids in the liver.10,13,39,46,47 Despite this, the variants’ effects on the risk of paediatric NAFLD are currently not well established.11 Findings from the current study bring additional clues into the elucidation of the insulin-regulated glucose and lipid metabolism in children with obesity.
A special discussion deserves the “U”-shaped association between the combination of genetic variants and the outcome (high-risk versus low risk for HOMA-IR values), presented in Table 2. With the exception of the AA rs12676 genotype (CHDH), which in any association with the rs738409 (PNLAP3) genotypes, had a higher risk, other gene–gene interactions suggested a “U”-shaped effect, as the heterozygosity of any of the two variants associated to the outcome does not fit a hypothetical gene dosage effect. However, a lack of linearity in gene dosage has been previously described for gene–gene interactions (e.g.48). The non-linear association of complex genotypic traits with health outcomes has been previously discussed in the context of gene–environment interactions, including nutrition.49 In the same context, the statistical approaches in analyzing gene–gene interactions have been also discussed in regard to why assumptions of linearity in gene–environment interactions, with consequences upon gene–gene interactions, are not necessarily always true.50 Moreover, epigenetics is another factor that sometimes plays important roles in gene–environment interactions, and their association with defined phenotypes (e.g.51). The design of our study did not allow us to further explore such possible intricacies.
Notably, the observed gene–gene interactions in children might not be necessarily comparable with the effect observed in adults with obesity, as prolonged exposure to environmental factors and associated comorbidities might have more intricate effects in adults. Future studies are needed to examine the interaction between rs12676 in CHDH and rs738409 in PNPLA3 genes, and the potential modulating role of plasma choline, in larger populations andadults. Potentially, these findings could be used as a clinical tool for the identification of children with an increased risk of insulin resistance, to ultimately prevent type 2 diabetes mellitus and cardiovascular disease.
Limitations
This study presents relevant metabolic and genetic predictors for insulin resistance in children with obesity, but with some limitations. Pubertal stage was not assessed using the Tanner method; however, age and HOMA-IR peaks were used as a proxy for puberty onset, in relation to other studies previously published.25,52 We did not assess liver steatosis using ultrasound, as the NASPGHAN 2017 guidelines recommended against using it routinely for screening, and due to low sensitivity.7 Conversely, we have used ALT as proxy for NAFLD, in order to identify children at risk.7,10
Notably, due to study design, intake assessments do not reflect children’s usual diets, but rather the compliance to the dietary recommendations made by their doctors, in order to improve their body weight and metabolic status. Therefore, gene–diet interactions could not be addressed in our prediction model, as nutrition intakes would not necessarily be causal to the phenotype.
Another limitation of the study was the relatively small number of cases, diminishing statistical power and strongly suggesting that these results need to be replicated in larger studies.
Conclusion
Participants with insulin resistance and obesity presented significantly higher values for standardized BMI, triglycerides, transaminases, and choline when compared to those without insulin resistance, indicating increased risk for NAFLD. Out of 52 explored SNPs related to NAFLD, choline and 1-carbon metabolism, the interaction between rs12676 (CHDH) and rs738409 (PNPLA3) genotypes was identified to predict insulin resistance in children with obesity, using gender and puberty-specific HOMA-IR cut-offs. Plasma choline levels and ALT modulated the gene interaction effect, significantly improving the model’s cross-validation consistency and testing accuracy. If replicated in larger cohorts, this gene–gene interaction could help identify the metabolic risk in children with obesity.
Abbreviations
µmol/L, micromoles/litre; AA, homozygous for one allele (generic); ABCB4, ATP binding cassette subfamily B member 4; AB, heterozygous (generic); ALA, alfa-linolenic acid, ALT, alanine aminotransferase; APOC3, apolipoprotein C3; ARA, arachidonic acid; AST, aspartate aminotransferase; BB, homozygous for the other allele (generic); BMI, body mass index; CHDH, choline dehydrogenase; CHKB, choline/ethanolamine kinase beta; DHA, docosahexaenoic acid; EPA, eicosapentaenoic acid; FADS2, fatty acid desaturase 2; g, grams; HDL chol, high-density lipoprotein cholesterol, HDL, high-density lipoprotein cholesterol; HOMA-IR, Homeostatic model assessment for insulin resistance; LA, linoleic acid; LC-MS/MS, high-performance liquid chromatography–tandem mass spectrometry; NAFLD, non-alcoholic fatty liver disease; MDR, Multifactor dimensionality reduction (software); mg, milligrams; MTHFD1, methylenetetrahydrofolate dehydrogenase; MTHFR, methylenetetrahydrofolate reductase; PCYT1A, phosphate cytidylyltransferase 1, choline, alpha; PCYT1B, phosphate cytidylyltransferase 1, choline, beta; PEMT, phosphatidylethanolamine N-methyltransferase; PNPLA3, patatin-like phospholipase domain containing 3; RBC, red blood cell membrane; REE, resting energy expenditure; SCD, stearoyl-CoA desaturase; SD, standard deviation; SLC44A1, solute carrier family 44 member 1; SNP, Single Nucleotide Polymorphism; STAT3, signal transducer and activator of transcription 3; zBMI, Standardized BMI-for-age z-scores; WHR, waist to hip ratio.
Data Sharing Statement
Raw data for variables of the cohort are available at request.
Ethics Approval
The study was approved by the Ethics Committee of the “Victor Babes” University of Medicine and Pharmacy (6/20.06.2016), Timisoara, Romania, and conducted in accordance with the Declaration of Helsinki.
Consent to Participate
Participants and their parents or legal guardians were informed about the aims and methods of the study. Written consent was signed by parents or legal guardians of the participants and children provided verbal consent to be included in the study.
Acknowledgments
This work was performed at the Center of Genomic Medicine, “Victor Babes” University of Medicine and Pharmacy.
Author Contributions
All authors made substantial contributions to conception and design, acquisition of data, or analysis and interpretation of data; took part in drafting the article or revising it critically for important intellectual content; agreed on the journal to which the article will be submitted; gave final approval of the version to be published; and agree to be accountable for all aspects of the work.
Funding
This research was funded by the POC Project “Use of nutrigenomic models for the personalized treatment with medical foods in obese people” (NutriGen) 2016–2019, SMIS: 104852, 91/09.09.2016, ID P_37-684. The funders had no role in study design, data collection and analysis, decision to publish, or preparation of the manuscript.
Disclosure
Mihai Dinu Niculescu is the founder and CEO of Advanced Nutrigenomics LLC. The authors declare no other potential conflicts of interest.
References
1. NCD Risk Factor Collaboration (NCD-RisC). Worldwide trends in body-mass index, underweight, overweight, and obesity from 1975 to 2016: a pooled analysis of 2416 population-based measurement studies in 128·9 million children, adolescents, and adults. Lancet. 2017. doi:10.1016/S0140-6736(17)32129-3
2. NCD Risk Factor Collaboration (NCD-RisC). Trends in adult body-mass index in 200 countries from 1975 to 2014: a pooled analysis of 1698 population-based measurement studies with 19·2 million participants. Lancet. 2016;387:1377–1396. doi:10.1016/S0140-6736(16)30054-X
3. Styne DM, Arslanian SA, Connor EL, et al. Pediatric obesity-assessment, treatment, and prevention: an endocrine society clinical practice guideline. J Clin Endocrinol Metab. 2017;102:709–757. doi:10.1210/jc.2016-2573
4. Lentferink YE, Elst MAJ, Knibbe CAJ, van der Vorst MMJ. Predictors of insulin resistance in children versus adolescents with obesity. J Obes. 2017;2017:3793868. doi:10.1155/2017/3793868
5. Lomonaco R, Ortiz-Lopez C, Orsak B, et al. Effect of adipose tissue insulin resistance on metabolic parameters and liver histology in obese patients with nonalcoholic fatty liver disease. Hepatology. 2012;55:1389–1397. doi:10.1002/hep.25539
6. Bugianesi E, Gastaldelli A, Vanni E, et al. Insulin resistance in non-diabetic patients with non-alcoholic fatty liver disease: sites and mechanisms. Diabetologia. 2005;48:634–642. doi:10.1007/s00125-005-1682-x
7. Vos MB, Abrams SH, Barlow SE, et al. NASPGHAN clinical practice guideline for the diagnosis and treatment of nonalcoholic fatty liver disease in children: recommendations from the expert committee on NAFLD (ECON) and the North American Society of Pediatric Gastroenterology, Hepatology and Nutrition (NASPGHAN). J Pediatr Gastroenterol Nutr. 2017;64:319–334. doi:10.1097/MPG.0000000000001482
8. Goyal NP, Schwimmer JB. The progression and natural history of pediatric nonalcoholic fatty liver disease. Clin Liver Dis. 2016;20:325–338. doi:10.1016/j.cld.2015.10.003
9. Tobisch B, Blatniczky L, Barkai L. Cardiometabolic risk factors and insulin resistance in obese children and adolescents: relation to puberty. Pediatr Obes. 2015;10:37–44. doi:10.1111/j.2047-6310.2013.00202.x
10. Nobili V, Alisi A, Valenti L, et al. NAFLD in children: new genes, new diagnostic modalities and new drugs. Nat Rev Gastroenterol Hepatol. 2019;16:517–530. doi:10.1038/s41575-019-0169-z
11. Dongiovanni P, Stender S, Pietrelli A, et al. Causal relationship of hepatic fat with liver damage and insulin resistance in nonalcoholic fatty liver. J Intern Med. 2018;283:356–370. doi:10.1111/joim.12719
12. Sookoian S, Pirola CJ. Meta-analysis of the influence of I148M variant of patatin-like phospholipase domain containing 3 gene (PNPLA3) on the susceptibility and histological severity of nonalcoholic fatty liver disease. Hepatology. 2011;53:1883–1894. doi:10.1002/hep.24283
13. Corbin KD, Abdelmalek MF, Spencer MD, et al. Genetic signatures in choline and 1-carbon metabolism are associated with the severity of hepatic steatosis. FASEB J. 2013;27:1674–1689. doi:10.1096/fj.12-219097
14. Wallace TC, Blusztajn JK, Caudill MA, et al. Choline: the neurocognitive essential nutrient of interest to obstetricians and gynecologists. J Diet Suppl. 2019;1–20. doi:10.1080/19390211.2019.1639875
15. de Onis M, Onyango AW, Borghi E, et al. Development of a WHO growth reference for school-aged children and adolescents. Bull World Health Organ. 2007;85:660–667. doi:10.2471/BLT.07.043497
16. Serafim V, Chirita-Emandi A, Andreescu N, et al. Single nucleotide polymorphisms in PEMT and MTHFR genes are associated with omega 3 and 6 fatty acid levels in the red blood cells of children with obesity. Nutrients. 2019;11:2600. doi:10.3390/nu11112600
17. de Onis M, Wijnhoven TMA, Onyango AW. Worldwide practices in child growth monitoring. J Pediatr. 2004;144:461–465. doi:10.1016/j.jpeds.2003.12.034
18. Report of a WHO Expert Committee. Physical status: the use and interpretation of anthropometry. World Health Organ Tech Rep Ser. 1995;854:1–452.
19. Șerban CL, Sima A, Hogea CM, et al. Assessment of nutritional intakes in individuals with obesity under medical supervision. A cross-sectional study. Int J Environ Res Public Health. 2019;16:3036. doi:10.3390/ijerph16173036
20. Lazzer S, Agosti F, De Col A, Sartorio A. Development and cross-validation of prediction equations for estimating resting energy expenditure in severely obese Caucasian children and adolescents. Br J Nutr. 2006;96:973–979. doi:10.1017/bjn20061941
21. Moran A, Jacobs DR, Steinberger J, et al. Insulin resistance during puberty: results from clamp studies in 357 children. Diabetes. 1999;48:2039–2044. doi:10.2337/diabetes.48.10.2039
22. Kurtoğlu S, Hatipoğlu N, Mazıcıoğlu M, et al. Insulin resistance in obese children and adolescents: HOMA−IR cut−off levels in the prepubertal and pubertal periods. J Clin Res Pediatr Endocrinol. 2010;2:100–106. doi:10.4274/jcrpe.v2i3.100
23. Kirsch SH, Herrmann W, Rabagny Y, Obeid R. Quantification of acetylcholine, choline, betaine, and dimethylglycine in human plasma and urine using stable-isotope dilution ultra performance liquid chromatography-tandem mass spectrometry. J Chromatogr B Analyt Technol Biomed Life Sci. 2010;878:3338–3344. doi:10.1016/j.jchromb.2010.10.016
24. Chirita-Emandi A, Barbu CG, Cinteza EE, et al. Overweight and underweight prevalence trends in children from Romania - pooled analysis of cross-sectional studies between 2006 and 2015. Obes Facts. 2016;9:206–220. doi:10.1159/000444173
25. Fox C, Bernardino L, Cochran J, et al. Inappropriate use of homeostasis model assessment cutoff values for diagnosing insulin resistance in pediatric studies. J Am Osteopath Assoc. 2017;117:689–696. doi:10.7556/jaoa.2017.135
26. van der Aa MP, Fazeli Farsani S, Knibbe CAJ, et al. Population-based studies on the epidemiology of insulin resistance in children. J Diabetes Res. 2015;2015:1–9. doi:10.1155/2015/362375
27. Geer EB, Shen W. Gender differences in insulin resistance, body composition, and energy balance. Gend Med. 2009;6:60–75. doi:10.1016/j.genm.2009.02.002
28. Bacopoulou F, Efthymiou V, Landis G, et al. Waist circumference, waist-to-hip ratio and waist-to-height ratio reference percentiles for abdominal obesity among Greek adolescents. BMC Pediatr. 2015;15:50. doi:10.1186/s12887-015-0366-z
29. Gomes TN, Katzmarzyk PT, Hedeker D, et al. Correlates of compliance with recommended levels of physical activity in children. Sci Rep. 2017;7. doi:10.1038/s41598-017-16525-9
30. Ali O, Cerjak D, Kent JW, et al. Obesity, central adiposity and cardiometabolic risk factors in children and adolescents: a family-based study. Pediatr Obes. 2014;9:e58–62. doi:10.1111/j.2047-6310.2014.218.x
31. Love-Osborne K, Butler N, Gao D, Zeitler P. Elevated fasting triglycerides predict impaired glucose tolerance in adolescents at risk for type 2 diabetes. Pediatr Diabetes. 2006;7:205–210. doi:10.1111/j.1399-5448.2006.00179.x
32. Gao X, Randell E, Zhou H, Sun G, Ginsberg SD. Higher serum choline and betaine levels are associated with better body composition in male but not female population. PLoS One. 2018;13(2):e0193114. doi:10.1371/journal.pone.0193114
33. Gao X, Wang Y, Sun G. High dietary choline and betaine intake is associated with low insulin resistance in the Newfoundland population. Nutrition. 2017;33:28–34. doi:10.1016/j.nut.2016.08.005
34. Millard HR, Musani SK, Dibaba DT, et al. Dietary choline and betaine; associations with subclinical markers of cardiovascular disease risk and incidence of CVD, coronary heart disease and stroke: the Jackson Heart Study. Eur J Nutr. 2018;57(1):51–60. doi:10.1007/s00394-016-1296-8
35. Virtanen JK, Tuomainen T, Voutilainen S. Dietary intake of choline and phosphatidylcholine and risk of type 2 diabetes in men: the Kuopio Ischaemic heart disease risk factor study. Eur J Nutr. 2020. doi:10.1007/s00394-020-02223-2
36. Dibaba DT, Johnson KC, Kucharska-Newton AM, Meyer K, Zeisel SH, Bidulescu A. The association between dietary choline and betaine with the risk of type 2 diabetes: the Atherosclerosis Risk in Communities (ARIC) study [published online ahead of print, 2020 Sep 8]. Diabetes Care. 2020;dc200733. doi:10.2337/dc20-0733
37. Lauritzen L, Harsløf LBS, Hellgren LI, et al. Fish intake, erythrocyte n −3 fatty acid status and metabolic health in Danish adolescent girls and boys. Br J Nutr. 2012;107:697–704. doi:10.1017/S0007114511002418
38. Lotta LA, Gulati P, Day FR, et al. Integrative genomic analysis implicates limited peripheral adipose storage capacity in the pathogenesis of human insulin resistance. Nat Genet. 2017;49:17–26. doi:10.1038/ng.3714
39. Ramos-Lopez O, Milagro FI, Allayee H, et al. Guide for current nutrigenetic, nutrigenomic, and nutriepigenetic approaches for precision nutrition involving the prevention and management of chronic diseases associated with obesity. LFG. 2017;10:43–62. doi:10.1159/000477729
40. Chattopadhyay A, Lu T-P. Gene-gene interaction: the curse of dimensionality. Ann Transl Med. 2019;7:813. doi:10.21037/atm.2019.12.87
41. Gola D, Mahachie John JM, van Steen K, König IR. A roadmap to multifactor dimensionality reduction methods. Brief Bioinform. 2016;17:293–308. doi:10.1093/bib/bbv038
42. Mostowska A, Hozyasz KK, Wojcicki P, et al. Associations of folate and choline metabolism gene polymorphisms with orofacial clefts. J Med Genet. 2010;47:809–815. doi:10.1136/jmg.2009.070029
43. Liu J, Yu G, Ren Y, et al. TrioMDR: detecting SNP interactions in trio families with model-based multifactor dimensionality reduction. Genomics. 2019;111:1176–1182. doi:10.1016/j.ygeno.2018.07.014
44. Motsinger AA, Ritchie MD. Multifactor dimensionality reduction: an analysis strategy for modelling and detecting gene-gene interactions in human genetics and pharmacogenomics studies. Hum Genomics. 2006;2:318–328. doi:10.1186/1479-7364-2-5-318
45. Graae A-S, Hollensted M, Kloppenborg JT, et al. An adult-based insulin resistance genetic risk score associates with insulin resistance, metabolic traits and altered fat distribution in Danish children and adolescents who are overweight or obese. Diabetologia. 2018;61:1769–1779. doi:10.1007/s00125-018-4640-0
46. Dai G, Liu P, Li X, et al. Association between PNPLA3 rs738409 polymorphism and nonalcoholic fatty liver disease (NAFLD) susceptibility and severity: a meta-analysis. Medicine (Baltimore). 2019;98:e14324. doi:10.1097/MD.0000000000014324
47. Lu F-B, Hu E-D, Xu L-M, et al. The relationship between obesity and the severity of non-alcoholic fatty liver disease: systematic review and meta-analysis. Expert Rev Gastroenterol Hepatol. 2018;12:491–502. doi:10.1080/17474124.2018.1460202
48. Qian Q-J, Yang L, Wang Y-F, et al. Gene-gene interaction between COMT and MAOA potentially predicts the intelligence of attention-deficit hyperactivity disorder boys in China. Behav Genet. 2010;40:357–365. doi:10.1007/s10519-009-9314-8
49. Sing CF, Stengård JH, Kardia SLR. Dynamic relationships between the genome and exposures to environments as causes of common human diseases. World Rev Nutr Diet. 2004;93:77–91. doi:10.1159/000081252
50. Yang R-C. Analysis of linear and non-linear genotype × environment interaction. Front Genet. 2014;5:227. doi:10.3389/fgene.2014.00227
51. Kaminen-Ahola N. Fetal alcohol spectrum disorders: genetic and epigenetic mechanisms. Prenat Diagn. 2020;40(9):1185–1192. doi:10.1002/pd.5731
52. Salgado ALF, Carvalho L, Oliveira AC, et al. Insulin resistance index (HOMA-IR) in the differentiation of patients with non-alcoholic fatty liver disease and healthy individuals. Arq Gastroenterol. 2010;47:165–169. doi:10.1590/s0004-28032010000200009
 © 2020 The Author(s). This work is published and licensed by Dove Medical Press Limited. The
full terms of this license are available at https://www.dovepress.com/terms
and incorporate the Creative Commons Attribution
- Non Commercial (unported, 3.0) License.
By accessing the work you hereby accept the Terms. Non-commercial uses of the work are permitted
without any further permission from Dove Medical Press Limited, provided the work is properly
attributed. For permission for commercial use of this work, please see paragraphs 4.2 and 5 of our Terms.
© 2020 The Author(s). This work is published and licensed by Dove Medical Press Limited. The
full terms of this license are available at https://www.dovepress.com/terms
and incorporate the Creative Commons Attribution
- Non Commercial (unported, 3.0) License.
By accessing the work you hereby accept the Terms. Non-commercial uses of the work are permitted
without any further permission from Dove Medical Press Limited, provided the work is properly
attributed. For permission for commercial use of this work, please see paragraphs 4.2 and 5 of our Terms.