")
Back to Journals » Infection and Drug Resistance » Volume 16
Characterization of the Microbiome and Host’s Metabolites of the Lower Respiratory Tract During Acute Community-Acquired Pneumonia Identifies Potential Novel Markers
Authors Xiao Q , Tan S, Liu C, Liu B, Li Y, Guo Y, Hu P, Su Z, Chen S, Lei W, Li X, Su M, Rong F
Received 18 November 2022
Accepted for publication 16 January 2023
Published 26 January 2023 Volume 2023:16 Pages 581—594
DOI https://doi.org/10.2147/IDR.S394779
Checked for plagiarism Yes
Review by Single anonymous peer review
Peer reviewer comments 2
Editor who approved publication: Professor Suresh Antony
Qiang Xiao,1,* Shukun Tan,1,2,* Changzhi Liu,3,* Bin Liu,1 Yingxiong Li,1 Yehui Guo,1 Peiyan Hu,1 Zhuoying Su,1 Siqin Chen,1 Wei Lei,1 Xi Li,1 Minhong Su,4 Fu Rong1
1Pulmonary and Critical Care Medicine, Shunde Hospital, Southern Medical University (the First People’s Hospital of Shunde Foshan), Foshan, 528300, People’s Republic of China; 2Respiratory Medicine of the Sixth Affiliated Hospital, School of Medicine, South China University of Technology, Foshan, 528222, People’s Republic of China; 3Critical Care Medicine, Shunde Hospital, Southern Medical University (the First People’s Hospital of Shunde Foshan), Foshan, 528300, People’s Republic of China; 4Pulmonary and Critical Care Medicine, Zhujiang Hospital, Southern Medical University, Guangzhou, 510280, People’s Republic of China
*These authors contributed equally to this work
Correspondence: Fu Rong, Pulmonary and Critical Care Medicine, Shunde Hospital, Southern Medical University (The First People’s Hospital of Shunde Foshan), No. 1, Jiazi Road, Lunjiao Street, Shunde District, Foshan, 528300, People’s Republic of China, Tel +86-757-22318689, Email [email protected] Minhong Su, Pulmonary and Critical Care Medicine, Zhujiang Hospital, Southern Medical University, 253 Gongye Middle Avenue, Haizhu District, Guangzhou, 510280, People’s Republic of China, Tel +86-20-62782290, Email [email protected]
Purpose: Community-acquired pneumonia (CAP) is one of the most frequently encountered infectious diseases worldwide. Few studies have explored the microbial composition of the lower respiratory tract (LRT) and host metabolites of CAP. We analyzed the microbial composition of the LRT and levels of host metabolites to explore new biomarkers for CAP.
Patients and Methods: Bronchoalveolar lavage fluid (BALF) was collected from 28 CAP patients and 20 healthy individuals. Following centrifugation, BALF pellets were used for amplicon sequencing of a variable region of the bacterial 16S rDNA gene to characterize the microbial composition. Non-targeted metabolomics was used to detect host’s metabolites in the supernatant.
Results: Compared with healthy individuals, the bacterial alpha diversity in the LRT of CAP patients was significantly lower in CAP patients (p< 0.05). On the bacterial genus level, over 20 genera were detected with lower relative abundance (p< 0.05), while the relative abundance of Ruminiclostridium-6 was significantly higher in CAP patients. The levels of the host metabolites dimethyldisulfide, choline, pyrimidine, oleic acid and N-acetyl-neuraminic acid were all increased in BALF of CAP patients (p< 0.05), while concentrations of lysophosphatidylcholines (LPC (12:0/0:0)) and phosphatidic acid (PA (20:4/2:0)) were decreased (p< 0.05). Furthermore, the relative abundance of Parvimonas, Treponema-2, Moraxella, Aggregatibacter, Filifactor, Fusobacterium, Lautropia and Neisseria negatively correlated with concentrations of oleic acid (p< 0.05). A negative correlation between the relative abundance of Treponema-2, Moraxella, Filifactor, Fusobacterium and dimethyldisulfide concentrations was also observed (p< 0.05). In contrast, the relative abundance of Treponema-2, Moraxella, Filifactor, and Fusobacterium was found to be positively associated with concentrations of LPC (12:0/0:0) and PA (20:4/2:0) (p< 0.05).
Conclusion: The composition of the LRT microbiome differed between healthy individuals and CAP patients. We propose that some respiratory microbial components and host metabolites are potentially novel diagnostic markers of CAP.
Keywords: community-acquired pneumonia, microbiome, metabolites, biomarker, diagnosis
Introduction
Community-acquired pneumonia (CAP), a frequent bacterial infection with a high mortality rate and a high burden on health care systems, is receiving increased attention worldwide. In the past few decades, the mortality of CAP has remained high in both developing and developed countries, and morbidity and mortality gradually increase with age.1–3 For instance, in Germany, CAP was the major infection-related cause of death, causing more hospitalization than cardiovascular and cerebrovascular diseases, and the hospital mortality rate remained between 12% and 14% for 10 years.4
As more microbiome studies become available, it is becoming clear that a normal bacterial microbiome in the respiratory tract contains important components that assist in mucosal defense against infections.5–7 A dysbiotic bacterial community may increase the opportunity of infection, while infection in turn may change the composition of the commensal bacteria as well.8 For instance, the microbial composition of the lower respiratory tract (LRT) was characterized for CAP patients suffering from Pseudomonas aeruginosa.9 However, limited data are still available that describe the changes of the microbiome in LRT of CAP cases.
The metabolomics approach, the youngest and possibly the most promising “omics” technology, characterizes quantitative and qualitative changes in metabolites present in a biological sample,10–12 and this provides an alternative means to study the pathogenesis and unearthing specific diagnostic biomarkers of respiratory diseases and therapeutic approaches.13,14 The metabolites studied by metabolomics are typically small molecules with a molecular weight below 1000 Da.15 Recently, metabolomics research has made large contributions to studies on host immunity, physiology, diagnose, and therapy of COVID-19 pneumonia patients.16–18
Here, we analyzed the composition of the LRT microbiome and describe differences in the host’s metabolite levels using a metabolomics approach between CAP patients and healthy controls, in order to explore new biomarkers for CAP.
Methods
Participants
We enrolled 28 adult acute CAP patients who were admitted to the SMU Shunde Hospital (Shunde, China) and 20 healthy volunteers (H group) between August 2017 and August 2019. This study complied with the Declaration of Helsinki and approval for the study was obtained from the Institutional Human Research and Ethics Committee of the Southern Medical University (SMU), Shunde (China). Informed consent was obtained from all participants. CAP was defined according to the American Thoracic Society standard.19 The pathogens in the LRT of the patients included in this study was limited to bacteria, as the patients were clinically improved after receiving appropriate antibacterial drugs. Meanwhile, three routine sputum smear tests for acid-fast bacilli, a sputum TB-DNA test and sputum fungus culture were performed for all patients. The following exclusion criteria were applied: individuals who were infected with Mycobacterium tuberculosis or with determined fungal or viral airway infections; individuals who had ever undergone a lung transplantation or were using systemic immunosuppressants; and, since participation was voluntary, any person who declined to provide a sample or refused cooperation following initial consent was excluded from further participation without consequences to those individuals.
Collection of Bronchoalveolar Lavage Fluid (BALF) Samples
CT scans and bronchoscopy was performed within 72h after hospital admission. Experienced clinicians determined the necessity and feasibility of bronchoscopy on a case-by-case basis. Sterile normal saline was instilled into the diseased region of the lungs of the CAP patients as guided by the CT scan results, or into the right middle lobe or lingua for healthy individuals. BALF was retrieved by gentle suctioning using the bronchoscope port. The BALF samples were centrifuged at 10,000×g for 10 min at 4 °C and supernatants and pellets were separately frozen (−80 °C) before further analysis.13
BALF Microbiota Profile
The pellets of BALF were used to extract bacterial DNA using the HiPure Soil DNA Kit (Magen, Guangzhou, China). Following yield quantification by UV adsorption at 260/280 nm, the V3–V4 domain of bacterial 16S rDNA was amplified using universal primers 341F (CCTACGGGNGGCWGCAG) and 806R (GGACTACHVGGGTATCTAAT).20 The amplicons were normalized, pooled, and sequenced on an Illumina Novaseq 6000 platform.
Raw data were quality-filtered, de-multiplexed, and analyzed by standard methods, whereby sequences with more than one ambiguous nucleotide or with ambiguities within barcodes or primers were removed. The remaining sequences were clustered into operational taxonomic units (OTUs) with a ≥97% similarity threshold using UPARSE (v.9.2.64).21 The representative sequences were classified to families by a naive Bayesian model, which used RDP classifiers (v.2.2)22 based on SILVA (v.132)23 with a confidence threshold value of 0.8. Alpha diversity index was calculated with QIIME (v.1.9.1) and Beta-diversity was estimated by computing the unweighted Bray-Curtis distance. The KEGG pathway analysis of the OTUs was inferred using PICRUSt (v.2.1.4).
BALF Metabolomics by UHPLC-QE
The BALF supernatants were thawed at 4 °C on ice and 100 µL was mixed with 300 µL of methanol, vortexed for 30s, and sonicated for 10 minutes in an ice-water bath, followed by incubation for 1 h at −20 °C to precipitate proteins. After centrifugation (12,000 rpm, 15 min, 4 °C) the resulting supernatants were stored at −80 °C until analysis by ultra-high-performance liquid chromatography coupled with Q-exactive hybrid Orbitrap mass spectrometry (UHPLC–QE Orbitrap/MS)24. A quality control (QC) sample was injected once for every eight samples, which was prepared by combining equal volume aliquots of all supernatants from all samples. LC–MS/MS analyses was performed using a UHPLC system (1290, Agilent Technologies) with a UPLC HSS T3 column (2.1 mm×100 mm, 1.8 μm) coupled to Q Exactive (Orbitrap MS, Thermo) as described elsewhere25. Obtained MS raw data files were converted to the mzML format using ProteoWizard and processed by R package XCMS (v.3.2) as described25. For this, a data matrix was generated consisting of the retention time (RT), mass-to-charge ratio (m/z) values, and peak intensity. After XCMS data processing, peak annotation was performed with OSI-SMMS (v.1.0, Dalian Chem Data Solution Information Technology Co. Ltd.) with the use of an in-house MS/MS database.
Statistical Analysis
Summary statistics for group H and group CAP were expressed as means with SD if normally distributed, and otherwise (nonparametric data) as the median (interquartile ranges). Statistical comparisons were performed by Welch’s t-test and Wilcoxon rank test using R project Vegan package (v.2.5.3).26 Comparisons between the two groups for nonparametric data were performed by the Adonis test or Wilcoxon rank sum test. Results were reported with a statistical significance of P<0.05.
The stacked bar plot of the community composition, the OTU rarefaction curve and rank abundance curves were visualized in R with the ggplot2 package (v.2.2.1).27 Alpha diversity indexes were compared by Welch’s t-test and Wilcoxon rank test. Beta-diversity was visualized using principal coordinate analysis (PCoA), and an Anosim test was computed in R with the Vegan package.28 Comparison of bacterial phyla and families between the groups was calculated by Welch’s t-test and Wilcoxon rank test. Biomarker features in each group were screened in R by randomforest package (0.4.6.12), or in pROC package (v.1.10.0). Functional comparison based on KEGG analysis of the OTUs was performed by Welch’s t-test.
Principal component analysis (PCA) was applied to all samples using R package models. The groups were discriminated by orthogonal partial least squares discriminant analysis (OPLS-DA). For this, R2 (as a measure for model fitness) and Q2 (as a measure for predictability) cum values were used to assess the validity of the model. Variable importance in the projection (VIP) in the model was used to rank the metabolites for importance in discriminating between the groups. Any differences were tested by a Mann–Whitney test at P<0.05 followed by the Benjamini–Hochberg procedure to control for false discovery rate (FDR). Metabolites with VIP >1 in the OPLS-DA model and with P <0.05 were selected as biomarkers for BALF samples of the H and CAP groups at baseline.
Correlations between different metabolites and bacterial communities were assessed by Spearman correlation analysis using the heatmap package in R.
Results
Baseline Characteristics
There were no significant differences in the baseline data between the CAP group and the healthy control group, except for blood values of % neutrophils, C-reactive protein (CRP) and erythrocyte sedimentation rate (ESR), indicative of acute infection in CAP patients (Table 1).
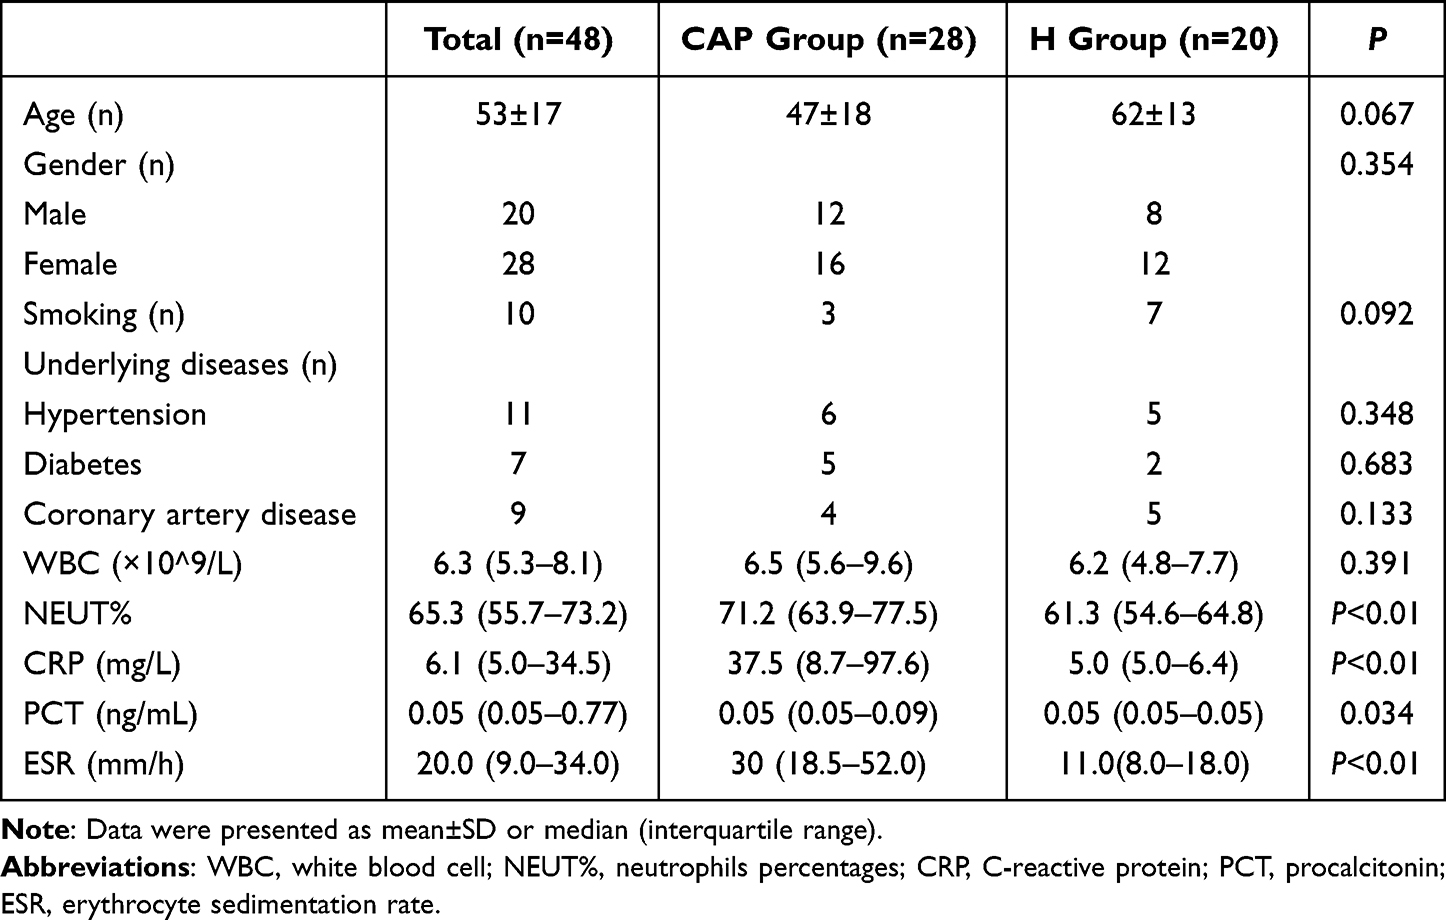 |
Table 1 Baseline Data in the Two Groups |
Analysis of the Lower Respiratory Tract Microbiomes
Differences in the Microbial Community Structure
Following amplicon sequencing of the partial 16S rRNA gene, a satisfactory read coverage (>99.0%) was obtained for both groups, indicating that the sequencing depth was sufficient (Figure 1A). The Chao1 index, a measure of alpha diversity (richness), was significantly higher in CAP (p<0.05) (Figure 1B) but the Shannon index, another measure of alpha diversity (richness and evenness), was significantly lower in CAP (p<0.01), with a wider spread, than in the control group (Figure 1C). Although the total number of observed OTUs was higher in CAP, their related abundances were different and lower. Figure 1D shows a principal co-ordinates analysis (PCoA) where samples of the same group are clustered together, which means the microbial composition was similar. The composition of the two groups were different, and by Adonis test this difference was significant (p<0.05). Moreover, the spread of the data is much larger in CAP than in H, which indicates a state of dysbiosis in the patients.
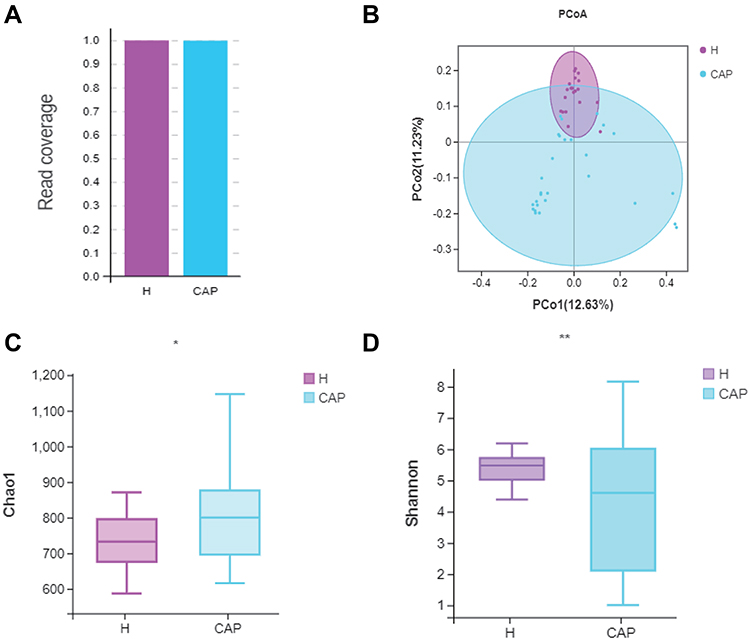 |
Figure 1 Comparison of the diversity of the LRT microbiome in CAP patients and control group H. Notes: (A) Read coverage was sufficient for both groups; (B) PCoA based on unweighted unifrac distances; (C) Chao1 index and (D) Shannon indexes were significantly different by Welch’s t-test, (*p<0.05, **p < 0.01). The significant differences between the groups were calculated by analysis of similarity (Adonis) tests. |
Classification Based Comparison of Bacterial Class and Genus Levels
All obtained reads were classified to OTUs and the relative abundances (r.a.) were first analyzed at class level (Figure 2A). The top five dominant classes were the same in both groups, namely Gammaproteobacteria, Bacilli, Bacteroidia, Clostridia, and Actinobacteria, which in combination contributed to over 80% of the reads from both groups. However, the r.a. of these dominant classes differed, notably for Gammaproteobacteria (47.3% in CAP but only 23.4% in H), Bacilli (12.5% and 26.0%, respectively), and Bacteroidia (14.7% and 21.4%, respectively). A difference in r.a. of Actinobacteria was also noted (3.0% in CAP but 8.2% in H). The significance of these differences is depicted in Figure 2B-F.
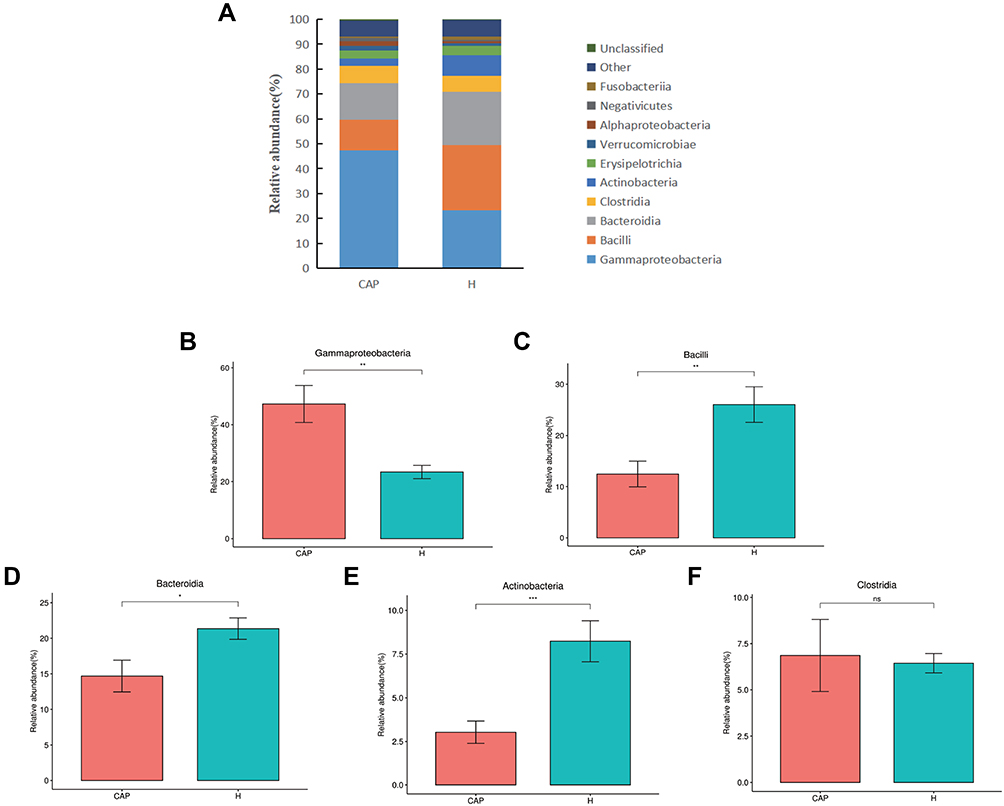 |
Figure 2 Relative abundance of microbial LRT components at class level. Abbreviation: ns, not significant. Notes: (A) the relative abundances of the top 10 classes in the two groups, with (B-F) giving the statistical relevance of differences per class as per Welch’s t-test (p > 0.05; *p < 0.05; **p < 0.01,***p < 0.001). |
The r.a. of the top 30 bacterial genera that were identified is shown in Figure 3. The top 10 genera of the CAP group were Lactobacillus, Bacteroides, Streptococcus, Escherichia-Shigella, Pseudomonas, Akkermansia, Turicibacter, Parasutterella, Dubosiella and Veillonella, with abundances between 6.8% and 1.0%. In contrast, the most abundant genus in the H group was Staphylococcus (12.4%), followed by Lactobacillus (7.9%), and abundances between 6.6% and 2.1% for Bacteroides, Rothia, Neisseria, Porphyromonas, Streptococcus, Escherichia-Shigella, Acinetobacter, and Moraxella. The differences in the genera with r.a. ≥0.01% between the two groups were analyzed by Welch’s t-test, with data summarized in Supplementary Table S1. The r.a. of Ruminiclostridium-6 was highly significantly increased in the CAP group (p<0.001), while the r.a. of 24 genera in the CAP group was highly significantly decreased compared to control (p<0.001).
 |
Figure 3 Relative abundances of the top 30 bacterial genera detected in two groups. |
Indicator Bacterial Genera of the Microbiomes
Based on the result of Welch’s t-test analysis at the genus level, over 20 bacterial genera could be considered to represent indicator genera. In order to determine the predictive value of these, we trained a random forest (RF) model with bacterial abundance data from all CAP and H subjects. The discriminatory power for the bacterial genera was measured by a receiver operating characteristic (ROC) curve. According to Figure 4A, nine bacterial genera had predictive power to differentiate CAP from H: Parvimonas, Treponema-2, Moraxella, Aggregatibacter, Filifactor, Fusobacterium, Lautropia, Neisseria and Staphylococcus had the strongest predictive power and except for Staphylococcus (AUC=0.84, Figure 4B), and these genera produced a high accuracy in classifying the CAP group versus the H group (AUC>0.9, Figure 4B).
 |
Figure 4 Classification of the two groups by abundance of bacterial genera. Notes: (A) Mean decrease accuracy of the discriminant genera in the model (shown are genera with mean decrease accuracy over 0.01). (B) Classification performance of the random forest model as assessed by area under the curve (AUC). |
Functional Characterization of the Respiratory Microbiomes
To explore the functional characteristics of the respiratory microbiomes from CAP patients, we performed PICRUSt prediction analyses based on 16S rDNA gene abundance profiles. About 120 functional pathways were identified with significance in relation to CAP patients (Supplementary Table S2). The findings were categorized and reported as bar plots of fold changes related to CAP patients (Figure 5). As shown, a total of 11 metabolic pathways were significantly enriched and in most cases a positive log2 fold change in relative abundance was observed in CAP compared to control individuals.
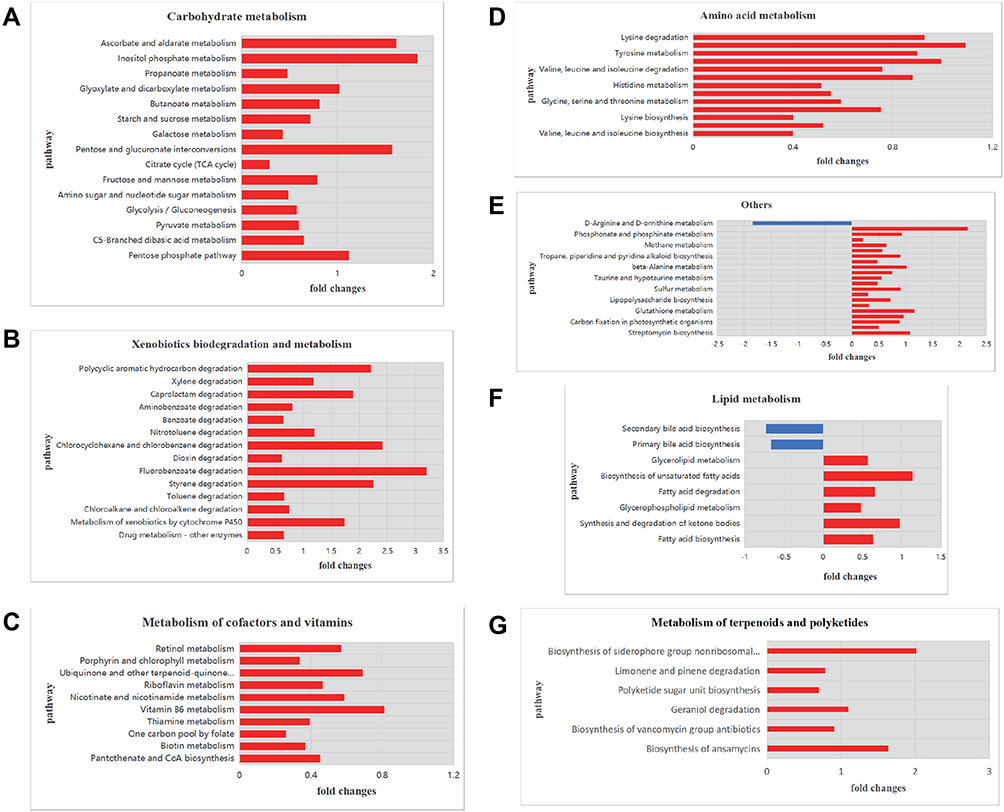 |
Figure 5 Functional characterization of the microbiomes of CAP patients and healthy controls based on PICRUSt analyses of partial 16S amplicons. Notes: Shown are pathways for (A) carbohydrate metabolism, (B) xenobiotics biodegradation and metabolism, (C) metabolism of terpenoids and polyketides, (D) amino acid metabolism, (G) metabolism of cofactors and vitamins, (F) lipid metabolism, and (E) other pathways. The plots report log2 fold changes of a pathway at P < 0.05. A negative log2 fold change is shown in blue and a positive log2 fold change in red. |
Analysis of Bronchoalveolar Lavage Fluid Metabolites
We used LC-MS combined with positive ion mode (POS) and negative ion mode (NEG) for bronchoalveolar lavage fluid metabolite analysis.29 A total of 152 metabolites were identified, of which 132 metabolites were obtained in the positive mode, and 20 in the negative mode.
PCA was employed to reveal any difference in the distribution of the BALF metabolites from the two groups. For the metabolites scored in positive mode (Figure 6A) separation in the second component only was observed, which did not represent significant group clustering (PC1: 21.4% and PC2: 15.8%). Metabolites identified in the negative ion mode (Figure 6B) segregated in the first component, with a PC1 of 43.8% and a PC2 of 20.2%.
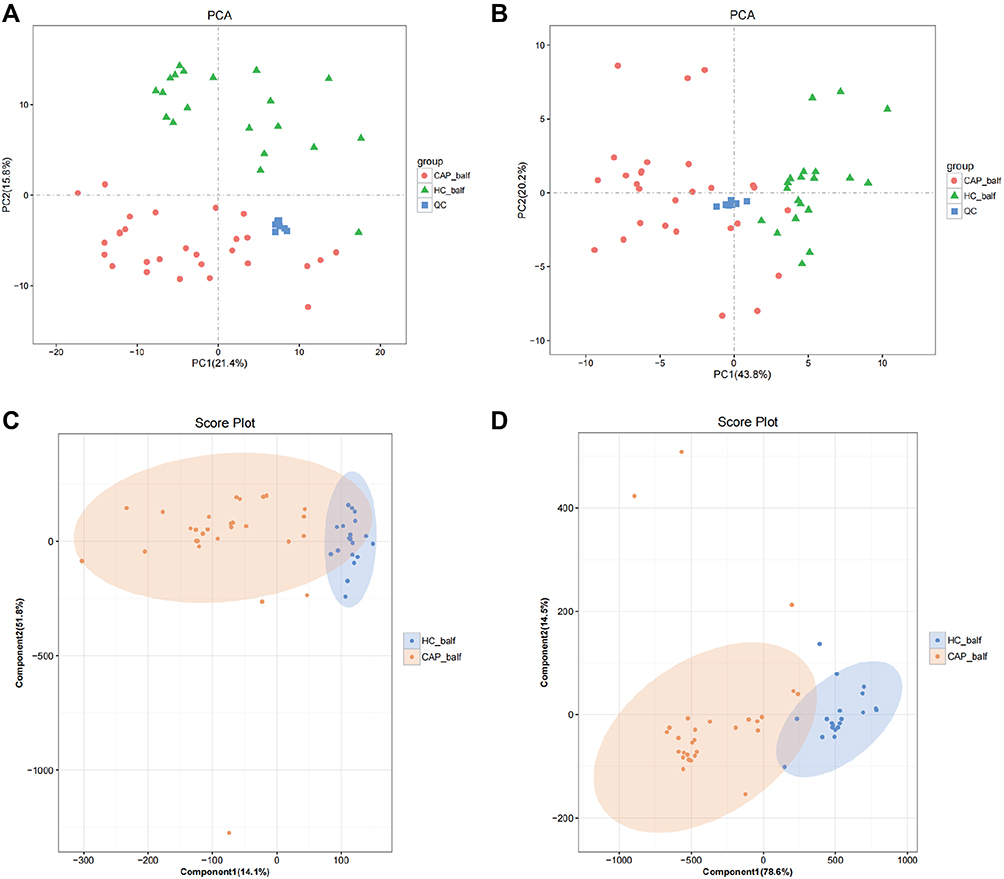 |
Figure 6 Statistical analysis of the metabolites in positive (A and C) and negative (B and D) mode. Notes: (A and B) show PCA score plots of metabolites and (C and D) show the OPLS-DA score plots. |
From the results, summarized as PCA score plots of positive and negative ion mode (Figure 6C and D), a clear clustering trend is visible. The OPLS-DA score plots of positive ion mode (Figure 6C) produced an R2X of 0.659, an R2Y of 0.692, and a Q2 of 0.572, and for the negative ion mode (Figure 6D) these parameters were 0.931, 0.762 and 0.675, respectively.
Identification and Evaluation of Potential Biomarkers
The differences of metabolites content were considered significant when (1) differences between CAP and H reached >1.5 times or < 0.5; (2) p values were <0.05; (3) VIP≥1. Of the analyzed 152 metabolites, 7 were identified to fulfill these criteria, summarized in Table 2. Four of these were identified in the positive iron model: choline, pyrimidine, oleic acid, and N-acetyl-neuraminic acid, which were all upregulated in the CAP group. Of those metabolites identified in the negative iron model, one was upregulated (dimethyldisulfide) and two were downregulated (lysophosphatidylcholine (LPC) and phosphatidic acid (PA)). Their detected fold-change levels are shown in the heatmaps of Figure 7A and B.
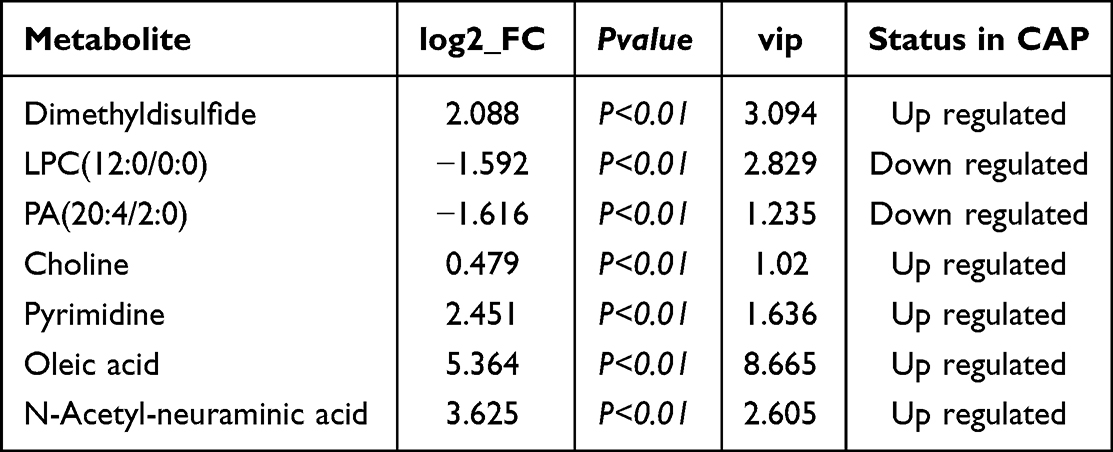 |
Table 2 Selection of Seven Potential Biomarkers |
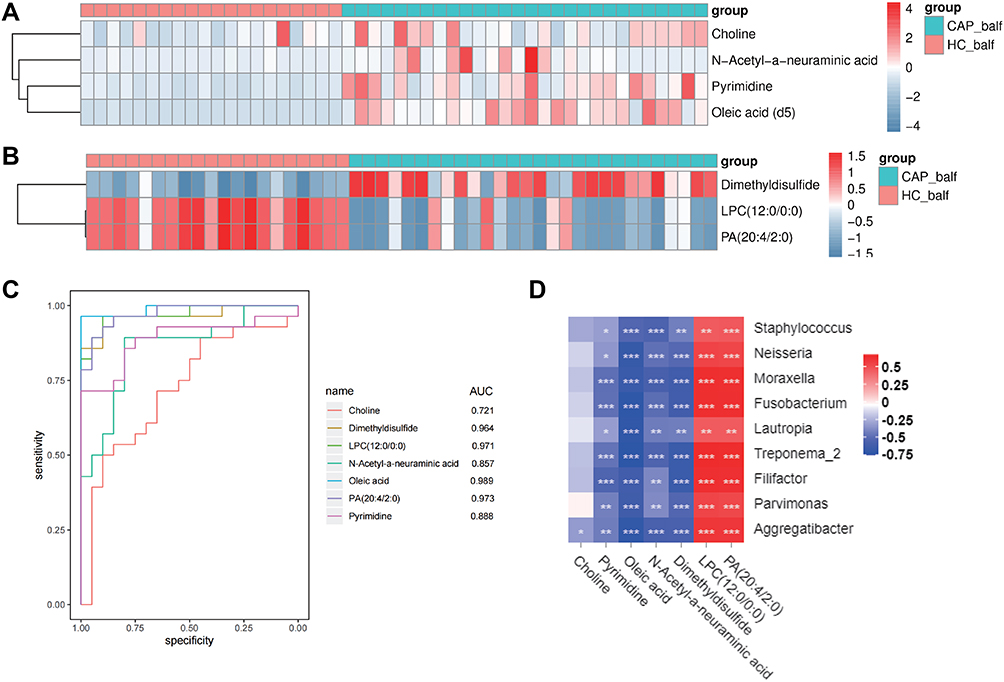 |
Figure 7 Identification and evaluation of the potential biomarkers. Notes: (A) Heatmap of the differential metabolites detected in the negative ion mode; (B) Heatmap of the differential metabolites in the positive ion mode; and (C) ROC curves of the 7 potential biomarkers; (D) Association between differences in the host metabolites and components of the LRT microbiome, for CAP cases compared to controls (*p<0.05, **p<0.01, ***p<0.001). Red refers to a positive correlation and blue to a negative correlation. |
The diagnostic potential of these 7 metabolites was further evaluated by ROC, with details shown in supplementary Table S3. As shown in the Figure 7C, the AUC values of ROC curve of pyrimidine, oleic acid, N-acetyl-neuraminic acid, dimethyldisulfide, LPC (12:0/0:0) and PA (20:4/2:0) were all higher than 0.8, which indicates good predictive ability. We conclude that these metabolites could be potential biomarkers for diagnosis of CAP. As summarized in supplementary Table S3, a diagnostic sensitivity of 96.4% and a specificity of 100% was found for oleic acid, for dimethyldisulfide the sensitivity and specificity were 85.7% and 100%, respectively, for LPC (12:0/0:0) these were 96.4% and 90%, and for PA (20:4/2:0) they were 89.3% and 95%, respectively.
The Conjoint Analysis of Metabolomics and Microbiome
Taking the observed differences in the microbial composition and the different expression of the metabolites into consideration, we combined all available data to investigate potential correlations between metabolites and microbes. The abundances of the nine indicator genera that were significantly lower in the CAP group were compared to the levels of metabolites with significantly differential expression levels between the CAP group and the H group, with data summarized in supplementary Table S4. This analysis revealed that oleic acid was negatively correlated with all genera except Staphylococcus (r>0.6, p<0.001). Further, Treponema-2, Moraxella, Filifactor, and Fusobacterium were negatively correlated with dimethyldisulfide, while these four genera were positively correlated with LPC (12:0/0:0) and PA (20:4/2:0) (r>0.6, p<0.001). These results indicated that the change of the relative abundance of these bacterial genera was possibly associated with the change in concentrations of these metabolites.
Discussion
There are trillions of microorganisms living on or inside the human host, not only inside the oral and gastrointestinal tract and on the skin but also inside the lungs, and on all these locations the microbes are closely associated with human health.30 Commensal microorganisms colonize the LRT of healthy individuals, and their microbial composition is affected by diet, antibiotic intakes and presence of infections, amongst other factors.31 There are a variety of symbiotic bacteria residing in the respiratory mucosa of healthy individuals, and they are in equilibrium with each other and participate in the normal mucosal barrier of the respiratory tract. When pathogenic bacteria invade the respiratory tract and proliferate, they disrupt the community composition of symbiotic bacteria, which leads to various pathophysiological processes of pneumonia. For lower respiratory tract infections (LRTIs), metabolic profiling provides an alternative approach for identification of biomarkers for diagnosis, stratification of severity, and prognosis.32–34 For example, lipidomic profiling of BALF has revealed that aberrant airway lipid composition is related to different intensities of host inflammatory responses.13 Although LRTIs appear to be limited to respiratory tract lesions, the host responses involve multiple organs such as liver, bone marrow, spleen, gut, and adipose tissue,35 all of which create large quantities of metabolites in the blood circulation. Here, we utilized 16S rDNA sequencing to identify the differences in the microbial composition in the LRT between acute CAP cases and healthy controls, together with UPLC-MS analysis to quantify the expression of host metabolites.
The diversity and composition of the LRT microbiome are associated with the onset and development of many respiratory diseases.36–38 A clinical trial by Mayhew and colleagues has proved that infection can frequently be responsible for a lower microbial diversity and a higher disease severity.39 In this study, we observed that the microbial diversity in the LRT of CAP patients was significantly lower than in healthy volunteers. We focused only on the alpha diversity during acute CAP infection which, according to some research, can initially recover after infection, but with higher frequency and severity of infections, the alpha diversity can fail to recover.40 When sequence data were analyzed on the level of bacterial classes, the top 5 dominant classes were indiscriminately Gammaproteobacteria, Bacilli, Bacteroidia, Clostridia, and Actinobacteria, but their fractions were different in the two groups that were analyzed here. The relative abundance of Gamma-proteobacteria was significant higher in CAP patients than in healthy controls, while the Bacilli, Bacteroidia, and Actinobacteria classes were less abundant. These three latter classes represent the most common commensal microorganisms of the respiratory tract, and comprise the core microbiome of the airways. The Gammaproteobacteria contain a number of potentially pathogenic bacterial genera of CAP, and their outgrowth was associated with a decrease of the microbial diversity.41 In addition, we observed that over 20 genera were significantly lower in the CAP group, while the Ruminiclostridium-6 were significantly higher compared to controls. Based on our results, we propose the possibility that the identified genera can be explored to be diagnosis biomarkers of CAP. As in ROC curve analysis the AUC of eight genera were all higher than 0.9, this can be narrowed down to these bacterial genera having a high value in diagnosis of CAP patients. However, Parvimonas, Treponema-2, Aggregatibacter and Filifactor had a low abundance (≤1%) in both groups, so these four genera were less likely candidates to be explored as biomarkers for diagnosis of CAP. The most promising candidates were Moraxella, Fusobacterium, Lautropia, and Neisseria. Since there were significant differences in microbial composition between the two analyzed groups, we further explored the data for potential functional characterization of the microbiome composition. This resulted in significant overall differences in metabolic potential between both groups. We suppose there is a close relationship between the metabolism of the LRT microbiome and that of the host.
During respiratory infection, pathogenic invasion may induce rapid metabolic changes in the host, regulated by the inflammatory immune response.42 A study using untargeted ultra-high-performance liquid chromatography with tandem mass spectrometry (LC-MS/MS)-based metabolomics on serum samples CAP patients demonstrated that serum metabolite signature can be used for disease severity assessment.43 Another study performed metabolomics with ultra-high-performance liquid chromatography quadrupole time-of-flight mass spectrometry (UHPLC-Q-TOF-MS) on plasma samples from CAP patients, which revealed several lipid metabolites with potential as diagnostic and prognostic biomarkers.44 We observed that the concentrations of dimethyldisulfide, choline, pyrimidine, oleic acid, N-acetyl-neuraminic acid, LPC (12:0/0:0), and PA (20:4/2:0) were all significantly different in CAP patients. Among these, oleic acid, LPC (12:0/0:0) and PA (20:4/2:0) are lipid metabolites, and choline is a basic constituent of lecithin, a precursor of acetylcholine, that also plays an important role in lipid metabolism. Lipids are not only basic components of cell membrane providing a biological barrier, but also play other biological roles, from cellular signaling molecules to acting as energy storage. Different lipid composition of the LRT is related to different degrees of inflammation, and the alternation of the host lipidome results in dysregulation of eicosanoid immune mediators that are probably related to severe pneumonia.13,16 Phosphatidylcholine (PC) and phosphatidic acid (PA) are glycerophospholipids, the main constituents of cellular membranes, and are involved in cellular signal transduction, whose alternation is related to many diseases.45 Lysophosphatidylcholines (LPCs) are bioactive lipids derived by hydrolysis of PCs, and play an important role in immuno-inflammatory responses.46 The lower concentration of LPCs during the acute stage of CAP may be related to LPCs consumption that would recover after antibiotic therapy. LPCs may protect CAP from developing, as it was reported that injection of LPC before pneumonia could reduce lethality and bacterial burdens.47 Moreover, in a clinical trial, it was shown that the concentration of LPCs was dynamic during the various clinical stages of CAP, and it was suggested that LPCs might be used as biomarkers for evaluating disease as the LPC concentration dynamic was less variable than that of IL-6 and CRP.48 We support this view and our data suggest that lipid metabolism plays important role in the pathophysiological mechanisms of CAP. Furthermore, we report that oleic acid, dimethyldisulfide, LPC (12:0/0:0), and PA (20:4/2:0) are possibly reliable markers for diagnosis of CAP, based on our recorded AUC higher than 0.9, and a high diagnostic sensitivity and specificity.
Based on the results of 16S rDNA sequencing, we supposed that the differential microbial composition of LRT was related to changes in the host metabolism, so we sought for associations between these two.49 Negative associations were identified for eight genera and concentrations of oleic acid (p<0.05) and a negative correlation also existed between the relative abundance of Treponema-2, Moraxella, Filifactor, Fusobacterium and dimethyldisulfide concentrations (p<0.05). In contrast, these four genera were positively associated with concentrations of LPC (12:0/0:0) and PA (20:4/2:0) (p<0.05). That the human microbiome composition can influence host metabolism has been investigated before, but most of those studies dealt with the gut microbiome.50 A recent study conducted by Cribbs and colleagues revealed alternations in the composition of the respiratory microbiome that were responsible for the change in host metabolites.51 Unfortunately, in our study, we could not assess mechanistic explanations how the LRT microbiome composition affects the host metabolism, for which further studies need to be conducted.
Strengths and Limitations
The strength of this study is that correlations between different metabolites and bacterial communities were investigated, which could expound the local pathological changes of respiratory tract and systemic pathophysiology in host pneumonia from different perspectives. This helps us understand the pathogenesis of pneumonia from a new perspective and provides a theoretical basis for the development of new potential therapeutic targets. Meanwhile, BALF is sampled from the lower respiratory tract, which can better reflect the local pathophysiological process of bronchopulmonary tissue, and the sample of is less likely to be contaminated by oral colonization bacteria.
This study had several limitations. (1) The number of subjects enrolled was small (n = 41). Our study was a single-center study. Retrospective or prospective multi-center study are needed. (2) Due to the difficulty of successful etiological culture, the enrolled pneumonia patients lacked etiological diagnosis except for clinical manifestations and chest x-rays/CT scans. (3) All samples were collected before the use of antibiotics at the early stage of the disease. Collection of samples from different periods of LTRI would be needed to investigate how the disease develops, and patients with severe pneumonia should be included in further studies. (4) The microbiome was sequenced only by 16S rDNA amplicons, and the bacteria could only be identified at the genus level rather than species level. Metagenomics would be needed to further study the species level and microbial function.
Conclusion
In summary, our study demonstrated that the LRT microbial composition in acute CAP patients was different from healthy controls, with an overall decrease in microbial diversity. We propose that Moraxella, Fusobacterium, Lautropia and Neisseria can potentially serve as the novel diagnostic biomarkers of CAP, whereas oleic acid, dimethyldisulfide, LPC (12:0/0:0), PA (20:4/2:0), and N-acetyl-neuraminic acid can serve as novel potential diagnostic metabolic markers. We conjecture a mutual regulatory relation between abundance of eight bacterial genera and levels of oleic acid, of which Treponema-2, Moraxella, Filifactor, and Fusobacterium correlated positively with levels of dimethyldisulfide and negatively with LPC(12:0/0:0), and PA (20:4/2:0) in BALF.
Data Sharing Statement
All data are available in the main text or the Supplementary Materials.
Acknowledgments
This work was supported by grants from Foshan Science and Technology Innovation Project (FS0AA-KJ218-1301-0014), China Postdoctoral Science Foundation (2020M670014ZX), Guangdong Basic and Applied Basic Research Foundation (2019A1515110787, 2020A1515110973), Medical Scientific Research Foundation of Guangdong Province (B2019033), Research launch project of Shunde Hospital of Southern Medical University (SRSP2019003).
Disclosure
Authors declare that they have no competing interests.
References
1. GBD 2016 Causes of Death Collaborators. Mortality and Causes of Death Collaborators. Global, regional, and national age-sex specific mortality for 264 causes of death, 1980-2016: a systematic analysis for the Global Burden of Disease Study 2016. Lancet. 2017;390(10100):1151–1210. doi:10.1016/S0140-6736(17)32152-9
2. Vos T, Barber RM, Bell B, et al. Global, regional, and national incidence, prevalence, and years lived with disability for 301 acute and chronic diseases and injuries in 188 countries, 1990-2013: a systematic analysis for the Global Burden of Disease Study 2013. Lancet. 2015;386(9995):743–800. doi:10.1016/S0140-6736(15)60692-4
3. Wang H, Naghavi M, Allen C. Global, regional, and national life expectancy, all-cause mortality, and cause-specific mortality for 249 causes of death, 1980-2015: a systematic analysis for the Global Burden of Disease Study 2015. Lancet. 2016;388(10053):1459–1544.
4. Forstner C, Patchev V, Rohde G, et al. Rate and Predictors of Bacteremia in Afebrile Community-Acquired Pneumonia. Chest. 2020;157(3):529–539. doi:10.1016/j.chest.2019.10.006
5. Wypych TP, Wickramasinghe LC, Marsland BJ. The influence of the microbiome on respiratory health. Nat Immunol. 2019;20(10):1279–1290. doi:10.1038/s41590-019-0451-9
6. Yatera K, Noguchi S, Mukae H. The microbiome in the lower respiratory tract. Respir Investig. 2018;56(6):432–439. doi:10.1016/j.resinv.2018.08.003
7. Man WH, de Steenhuijsen PW, Bogaert D. The microbiota of the respiratory tract: gatekeeper to respiratory health. Nat Rev Microbiol. 2017;15(5):259–270. doi:10.1038/nrmicro.2017.14
8. Li KL, Wang BZ, Li ZP, et al. Alterations of intestinal flora and the effects of probiotics in children with recurrent respiratory tract infection. World J Pediatr. 2019;15(3):255–261. doi:10.1007/s12519-019-00248-0
9. Qi X, Qu H, Yang D, et al. Lower respiratory tract microbial composition was diversified in Pseudomonas aeruginosa ventilator-associated pneumonia patients. Respir Res. 2018;19(1):139. doi:10.1186/s12931-018-0847-3
10. Cacciatore S, Loda M. Innovation in metabolomics to improve personalized healthcare. Ann N Y Acad Sci. 2015;1346(1):57–62. doi:10.1111/nyas.12775
11. Newgard CB. Metabolomics and Metabolic Diseases: where Do We Stand? Cell Metab. 2017;25(1):43–56. doi:10.1016/j.cmet.2016.09.018
12. Cheng J, Lan W, Zheng G, et al. Metabolomics: a High-Throughput Platform for Metabolite Profile Exploration. Methods Mol Biol. 2018;1754:265–292.
13. Zheng Y, Ning P, Luo Q, et al. Inflammatory responses relate to distinct bronchoalveolar lavage lipidome in community-acquired pneumonia patients: a pilot study. Respir Res. 2019;20(1):82. doi:10.1186/s12931-019-1028-8
14. Swietlik EM, Ghataorhe P, Zalewska KI, et al. Plasma metabolomics exhibit response to therapy in chronic thromboembolic pulmonary hypertension. Eur Respir J. 2021;57:4. doi:10.1183/13993003.03201-2020
15. Wishart DS. Metabolomics for Investigating Physiological and Pathophysiological Processes. Physiol Rev. 2019;99(4):1819–1875. doi:10.1152/physrev.00035.2018
16. Schwarz B, Sharma L, Roberts L, et al. Cutting Edge: severe SARS-CoV-2 Infection in Humans Is Defined by a Shift in the Serum Lipidome, Resulting in Dysregulation of Eicosanoid Immune Mediators. J Immunol. 2021;206(2):329–334. doi:10.4049/jimmunol.2001025
17. Meoni G, Ghini V, Maggi L, et al. Metabolomic/lipidomic profiling of COVID-19 and individual response to tocilizumab. PLoS Pathog. 2021;17(2):e1009243. doi:10.1371/journal.ppat.1009243
18. Shen B, Yi X, Sun Y, et al. Proteomic and Metabolomic Characterization of COVID-19 Patient Sera. Cell. 2020;182(1):59–72. doi:10.1016/j.cell.2020.05.032
19. Mandell LA, Wunderink RG, Anzueto A, et al. Infectious Diseases Society of America/American Thoracic Society consensus guidelines on the management of community-acquired pneumonia in adults. Clin Infect Dis. 2007;44(Suppl2):S27–S72. doi:10.1086/511159
20. Guo M, Wu F, Hao G, et al. Bacillus subtilis Improves Immunity and Disease Resistance in Rabbits. Front Immunol. 2017;8:354. doi:10.3389/fimmu.2017.00354
21. Edgar RC. UPARSE: highly accurate OTU sequences from microbial amplicon reads. Nat Methods. 2013;10(10):996–998. doi:10.1038/nmeth.2604
22. Wang Q, Garrity GM, Tiedje JM, et al. Naive Bayesian classifier for rapid assignment of rRNA sequences into the new bacterial taxonomy. Appl Environ Microbiol. 2007;73(16):5261–5267. doi:10.1128/AEM.00062-07
23. Pruesse E, Quast C, Knittel K, et al. SILVA: a comprehensive online resource for quality checked and aligned ribosomal RNA sequence data compatible with ARB. Nucleic Acids Res. 2007;35(21):7188–7196. doi:10.1093/nar/gkm864
24. Naz S, Vallejo M, García A, et al. Method validation strategies involved in non-targeted metabolomics. J Chromatogr A. 2014;1353:99–105. doi:10.1016/j.chroma.2014.04.071
25. Liu Z, Yan F, Mi H, et al. N-Carbamoylglutamate Supplementation on the Digestibility, Rumen Fermentation, Milk Quality, Antioxidant Parameters, and Metabolites of Jersey Cattle in High-Altitude Areas. Front Vet Sci. 2022;9:848912. doi:10.3389/fvets.2022.848912
26. Oksanen OB, Vegan: community Ecology Package. R Package Version 2.3-5. [EB/OL]. Available from: http://CRAN.R-project.org/package=vegan.
27. Wickham HCW ggplot2: an implementation of the Grammar of Graphics[J]. R package version 0.7[EB/OL]. Available from: http://CRAN.R-project.org/package=ggplot2.
28. Al BM, Henschel A, Mousa M, et al. Gut Microbiota Interplay With COVID-19 Reveals Links to Host Lipid Metabolism Among Middle Eastern Populations. Front Microbiol. 2021;12:761067. doi:10.3389/fmicb.2021.761067
29. Del BG, Stocchero M, Giordano G, et al. New insights into pediatric community-acquired pneumonia gained from untargeted metabolomics: a preliminary study. Pediatr Pulmonol. 2020;55(2):418–425. doi:10.1002/ppul.24602
30. Turnbaugh PJ, Ley RE, Hamady M, et al. The human microbiome project. Nature. 2007;449(7164):804–810. doi:10.1038/nature06244
31. Marsland BJ, Gollwitzer ES. Host-microorganism interactions in lung diseases. Nat Rev Immunol. 2014;14(12):827–835. doi:10.1038/nri3769
32. Stringer KA, McKay RT, Karnovsky A, et al. Metabolomics and its application to acute lung diseases. Front Immunol. 2016;7. doi:10.3389/fimmu.2016.00044
33. Beloborodova NV, Olenin AY, Pautova AK. Metabolomic findings in sepsis as a damage of host-microbial metabolism integration. J Crit Care. 2018;43:246–255. doi:10.1016/j.jcrc.2017.09.014
34. Nickler M, Ottiger M, Steuer C, et al. Systematic review regarding metabolic profiling for improved pathophysiological understanding of disease and outcome prediction in respiratory infections. Respir Res. 2015;16:125. doi:10.1186/s12931-015-0283-6
35. Quinton LJ, Walkey AJ, Mizgerd JP. Integrative Physiology of Pneumonia. Physiol Rev. 2018;98(3):1417–1464. doi:10.1152/physrev.00032.2017
36. Pragman AA, Knutson KA, Gould TJ, et al. Chronic obstructive pulmonary disease upper airway microbiota alpha diversity is associated with exacerbation phenotype: a case-control observational study. Respir Res. 2019;20(1):114. doi:10.1186/s12931-019-1080-4
37. Taylor SL, Leong L, Choo JM, et al. Inflammatory phenotypes in patients with severe asthma are associated with distinct airway microbiology. J Allergy Clin Immunol. 2018;141(1):94–103. doi:10.1016/j.jaci.2017.03.044
38. Al BM, Hamoudi RA, Dash NR, et al. Altered respiratory microbiota composition and functionality associated with asthma early in life. Bmc Infect Dis. 2020;20(1):697. doi:10.1186/s12879-020-05427-3
39. Mayhew D, Devos N, Lambert C, et al. Longitudinal profiling of the lung microbiome in the AERIS study demonstrates repeatability of bacterial and eosinophilic COPD exacerbations. Thorax. 2018;73(5):422–430. doi:10.1136/thoraxjnl-2017-210408
40. Zhao J, Schloss PD, Kalikin LM, et al. Decade-long bacterial community dynamics in cystic fibrosis airways. Proc Natl Acad Sci U S A. 2012;109(15):5809–5814. doi:10.1073/pnas.1120577109
41. Ditz B, Christenson S, Rossen J, et al. Sputum microbiome profiling in COPD: beyond singular pathogen detection. Thorax. 2020;75(4):338–344. doi:10.1136/thoraxjnl-2019-214168
42. Chauhan P, Saha B. Metabolic regulation of infection and inflammation. Cytokine. 2018;112:1–11. doi:10.1016/j.cyto.2018.11.016
43. Ning P, Zheng Y, Luo Q, et al. Metabolic profiles in community-acquired pneumonia: developing assessment tools for disease severity. Crit Care. 2018;22(1):130. doi:10.1186/s13054-018-2049-2
44. To KK, Lee KC, Wong SS, et al. Lipid metabolites as potential diagnostic and prognostic biomarkers for acute community acquired pneumonia. Diagn Microbiol Infect Dis. 2016;85(2):249–254. doi:10.1016/j.diagmicrobio.2016.03.012
45. Wang R, Li B, Lam SM, et al. Integration of lipidomics and metabolomics for in-depth understanding of cellular mechanism and disease progression. J Genet Genomics. 2020;47(2):69–83. doi:10.1016/j.jgg.2019.11.009
46. Sevastou I, Kaffe E, Mouratis MA, et al. Lysoglycerophospholipids in chronic inflammatory disorders: the PLA (2)/LPC and ATX/LPA axes. Biochim Biophys Acta. 2013;1831(1):42–60. doi:10.1016/j.bbalip.2012.07.019
47. Smani Y, Domínguez-Herrera J, Ibáñez-Martínez J, et al. Therapeutic efficacy of lysophosphatidylcholine in severe infections caused by Acinetobacter baumannii. Antimicrob Agents Chemother. 2015;59(7):3920–3924. doi:10.1128/AAC.04986-14
48. Müller DC, Kauppi A, Edin A, et al. Phospholipid levels in blood during community-acquired pneumonia. PLoS One. 2019;14(5):e216379. doi:10.1371/journal.pone.0216379
49. Garg N, Wang M, Hyde E, et al. Three-Dimensional Microbiome and Metabolome Cartography of a Diseased Human Lung. Cell Host Microbe. 2017;22(5):705–716. doi:10.1016/j.chom.2017.10.001
50. Ley RE, Bäckhed F, Turnbaugh P, et al. Obesity alters gut microbial ecology. Proc Natl Acad Sci USA. 2005;102(31):11070–11075. doi:10.1073/pnas.0504978102
51. Cribbs SK, Park Y, Guidot DM, et al. Metabolomics of bronchoalveolar lavage differentiate healthy HIV-1-infected subjects from controls. AIDS Res Hum Retroviruses. 2014;30(6):579–585. doi:10.1089/aid.2013.0198
 © 2023 The Author(s). This work is published and licensed by Dove Medical Press Limited. The full terms of this license are available at https://www.dovepress.com/terms.php and incorporate the Creative Commons Attribution - Non Commercial (unported, v3.0) License.
By accessing the work you hereby accept the Terms. Non-commercial uses of the work are permitted without any further permission from Dove Medical Press Limited, provided the work is properly attributed. For permission for commercial use of this work, please see paragraphs 4.2 and 5 of our Terms.
© 2023 The Author(s). This work is published and licensed by Dove Medical Press Limited. The full terms of this license are available at https://www.dovepress.com/terms.php and incorporate the Creative Commons Attribution - Non Commercial (unported, v3.0) License.
By accessing the work you hereby accept the Terms. Non-commercial uses of the work are permitted without any further permission from Dove Medical Press Limited, provided the work is properly attributed. For permission for commercial use of this work, please see paragraphs 4.2 and 5 of our Terms.