Back to Journals » Journal of Inflammation Research » Volume 17
Characterization of the Immune Microenvironment and Identification of Biomarkers in Chronic Rhinosinusitis with Nasal Polyps Using Single-Cell RNA Sequencing and Transcriptome Analysis
Authors Wang Y, Song X, Jin M, Lu J
Received 19 September 2023
Accepted for publication 21 December 2023
Published 12 January 2024 Volume 2024:17 Pages 253—277
DOI https://doi.org/10.2147/JIR.S440409
Checked for plagiarism Yes
Review by Single anonymous peer review
Peer reviewer comments 3
Editor who approved publication: Dr Tara Strutt
Yakun Wang,1,* Xinyu Song,2,* Mulan Jin,1 Jun Lu1
1Department of Pathology, Beijing Chaoyang Hospital, Capital Medical University, Beijing, 100020, People’s Republic of China; 2Department of Otorhinolaryngology, Head and Neck Surgery, Beijing Chaoyang Hospital, Capital Medical University, Beijing, 100020, People’s Republic of China
*These authors contributed equally to this work
Correspondence: Mulan Jin; Jun Lu, Department of Pathology, Beijing Chaoyang Hospital, Capital Medical University, Beijing, 100020, People’s Republic of China, Email [email protected]; [email protected]
Purpose: Chronic rhinosinusitis is a prevalent condition in the field of otorhinolaryngology; however, its pathogenesis remains to be elucidated. The immunological defense of the nasal mucosa is significantly influenced by dendritic cells (DCs). We identified specific biological indicators linked to DCs and explored their significance in cases of chronic rhinosinusitis with nasal polyps (CRSwNP).
Patients and Methods: We categorized cells using single-cell RNA (scRNA) sequencing, and combined transcriptome sequencing was used to identify potential candidate genes for CRSwNP. We selected three biomarkers based on two algorithms and performed enrichment and immune correlation analyses. Biomarkers were verified using training and validation sets, receiver operating characteristic curves, immunohistochemistry, and quantitative real-time reverse-transcription PCR (qRT-PCR). Variations in biomarker expression were validated using pseudotime analysis. The networks of competing transcription factor (TF)-mRNA and competing endogenous RNA (ceRNA) were established, and the protein drugs associated with these biomarkers were predicted.
Results: Both scRNA-seq and transcriptome data showed that DCs immune infiltration was higher in the CRSwNP group than in the control group. Three DC-related biomarkers (NR4A1, CLEC4G, and CD163) were identified. In CRSwNP, NR4A1 expression decreased, whereas CLEC4G and CD163 expression increased. All biomarkers were shown to be involved in immunological and metabolic pathways by enrichment analysis. These biomarkers were associated with γδ T cells, effector memory CD4 + T cells, regulatory T cells, and immature DCs. According to pseudotime analysis, NR4A1 and CD163 expression decreased from high to low, whereas CLEC4G expression remained low.
Conclusion: We screened and identified potential DC-associated biomarkers of CRSwNP progression by integrating scRNA-seq with whole transcriptome sequencing. We analyzed the biological pathways in which they were involved, explored their molecular regulatory mechanisms and related drugs, and constructed ceRNA, TF-mRNA, and biomarker–drug networks to identify new CRSwNP treatment targets, laying the groundwork for the clinical management of CRSwNP.
Keywords: CRSwNP, dendritic cell, single-cell sequencing, transcriptomic sequencing, biomarker
Introduction
Chronic rhinosinusitis (CRS) is a common disease in the field of otorhinolaryngology, however, information about its pathogenesis remains to be elucidated. Different pathogenic mechanisms of CRS mediate different types of immunopathologies (“disease endotypes”), which produce different clinical manifestations known as disease phenotypes.1 Clinically, CRS is frequently classified into two distinct phenotypes based on the presence or absence of nasal polyps: CRS sans nasal polyps and CRS with nasal polyps (CRSwNPs). The latter is divided into eosinophilic CRSwNP (eCRSwNP) and non-eosinophilic CRSwNP (neCRSwNP).2 The inflammatory microenvironment in CRSwNP is believed to contribute to the disease among other factors including inflammation and allergies.3 Allergic rhinitis is a chronic inflammatory disease of the nasal mucosa. The long-term existence of allergic rhinitis, so that the inflammatory response delayed, which can lead to chronic sinusitis and nasal polyp formation.4 Asthma is the most important and common complication of allergic rhinitis. Epidemiological studies and clinical trials have found a correlation between the three diseases. Allergic rhinitis, sinusitis and asthma are three different manifestations of a common pathological process with similar pathological mechanisms. As a result of being affected by allergies, eosinophils are thought to damage the epithelium by releasing cytokines and other pro-inflammatory proteins. On this side, the damaged cytokines and chemokines, further attract eosinophils, play a central role in this process. Chronic airway mucosal inflammation and remodelling play a key integrative role in these diseases.5 Increasing evidence suggests that CRSwNP does not occur as a solitary disease, and instead, it presents as a heterogeneous condition with different clinical phenotypes and treatment prognoses driven by different pathogenic mechanisms.6
Although the exact cause of the persistent inflammation associated with CRSwNP is unknown, it is possible that it arises from a multitude of interactions involving environmental factors and the host immune system.7 Infection, metaplasia, mucosal cilia damage, and anatomical variations of the nose-sinus are usually considered to be causative factors. Bacteria can directly trigger inflammation and exacerbate the pathological process of CRS. S. aureus is thought to play an important role in the immunopathogenesis of CRSwNP and secretes a variety of exotoxins. It acts as a superantigen and produces toxins that regulate the immune system. These exotoxins enhance the invasive capacity and persistence of the bacteria by hindering the body’s immune system response against them. Among which interleukins (LukED) may serve as prototypical targets for CRSwNP.8 Additionally, epigenetics contributes to contribute to a deeper understanding of the pathogenesis of CRSwNP by regulating the expression and activity of host genes, the epigenome can undergo rapid DNA methylation changes when the environment is altered. In addition to DNA methylation, histone modifications and miRNA aberrations can contribute to disease by regulating downstream genes, cytokines, transcription factors, proteins, etc.9 The immune system is a dynamic and complete network comprising multiple types of immune cells distributed throughout the body in different organs and tissues, which work together to maintain intra-tissue homeostasis and participate in protective immunity.10–12 Numerous investigations have delved into the makeup of immune cells within human tissues and organs through single-cell transcriptome sequencing (scRNA-seq) and have identified immune cells unique to specific tissues.13,14 A strong T2-type immune response is a typical feature of CRSwNP, and many studies have identified multiple specific cellular subpopulations and molecules that contribute to the heterogeneity of CRS subtypes underneath the T2-type immune response by scRNA-seq. Among them, ALOX15+ cDC2s and macrophages play a key role in the pathogenesis of type 2 immunity in eCRSwNP.15 In addition, the diversity of epithelial cells, which are central to the pathogenesis of CRSwNP, decreases with changes in the T2 immune environment. This leads to a severely impaired physiological barrier function. The pathophysiology of CRSwNP is further exacerbated by mast cell (MC) cells as an important source of high levels of highly concentrated pro-inflammatory mediators.16 In turn, basal cells in CRSwNP develop a “memory” of long-term exposure to an inflammatory T2 environment, which in turn leads to a “memory” of an entire cellular ecosystem that deviates from productive differentiation and propagates disease.17 ScRNA-seq quantifies gene expression, functional enrichment, and metabolic pathways of mRNAs in single cells, which can evaluate cellular heterogeneity in research fields such as early embryonic development, stem cells, cancer, and immunology and represents a potent apparatus for exploring gene expression at the single cell level.18–20 Dendritic cells (DCs) are specifically responsible for presenting antigens and constitute the initial front line of primary and innate cellular immune reactions.21 DCs are derived from continuously proliferating progenitor cells within the bone marrow and precursor cells relocate into the vascular system, where they undergo the process of monocyte transformation.22,23 Depending on further antigenic stimulation, immature DCs typically enter the regional lymph nodes and spleen, transforming into immunologically mature forms that stimulate T and B lymphocytes for the generation of immune responses tailored to specific antigens.24 DC-mediated immune responses lead to the simultaneous expression of proinflammatory cytokines, namely IL-1, TNF-α, and growth factors (TGF-α, PDGF, EGF, and FGF) in peculiar patterns of massive release.24–26 However, the pathogenic mechanisms underlying DC accumulation, proinflammatory cytokine overexpression, and nasal polyp formation remain unclear. We performed the study according to Ordovas-Montanes et al16 and Zhang et al15 annotation results of DC cells from tissue samples of CRSwNP identified cell types and corresponding maker genes.
Here, the objective of this investigation was to identify a population of DCs with dysregulated gene expression in CRSwNP and identify potential biomarkers linked to DCs during the course of CRSwNP development, to construct a DC-centered global regulatory network. By analyzing the biological pathways, molecular regulatory mechanisms, and related drugs of DC-related biomarkers in CRSwNP to uncover vital pathways that could lead to the discovery of candidate genes for drug-targeting thus supporting the clinical management of CRSwNP.
Materials and Methods
Study Design and Population
Ethical Statement
The Beijing Chaoyang Hospital’s Ethics Committee’s Institutional Review Board (No. 2020-3-16-18 and date of approval: 2020-3-19) gave its approval to this work. All experiments involving human participants adhered to the institutional ethical guidelines and followed the principles of the Declaration of Helsinki. Before participating in the study, all participants involved provided written informed permission and finished informed consent procedure.
Subject Recruitment and Sample Collection
Between July 2021 and July 2022, the patients who received nasal polyp surgery or surgical correction of a deviated septum were enrolled. The diagnosis of CRSwNP was in accordance with the European Position Paper on Rhinosinusitis and Nasal Polyps 2020.27 Participants who had fungal sinusitis, antrochoanal polyps, unilateral polyps, cystic fibrosis or primary ciliary dyskinesia were excluded. And CRSwNP patients who took oral glucocorticoids, antimicrobials, antileukotrienes, and antihistamines 4 weeks prior to sample collection were excluded. Deviated nasal septum patients with coexisting asthma, allergic rhinitis, and/or aspirin sensitivity were also excluded. A total of 72 patients were enrolled, including CRSwNP group (n=36) and control group (n=36). Three samples were randomly selected from each group for scRNA-seq analysis: three mucosal tissue samples from nasal polyps (NP group), three nasal mucosa tissue samples adjacent to nasal polyps (NM group) from the CRSwNP group, and three nasal mucosa tissue samples from the control group (CM group).
To conduct transcriptome sequencing, the CRSwNP model’s training dataset was created using eight nasal mucosal tissue samples from the nasal polyp group and eight nasal mucosal tissue samples from the control group. Furthermore, data from GSE136825, encompassing 42 polyp samples from CRSwNP patients and 28 turbinate samples from non-CRS controls, were retrieved from the Gene Expression Omnibus (GEO) database (https://www.ncbi.nlm.nih.gov/) and served as the validation dataset.28 Tissue samples from 15 patients with NP in the CRSwNP group and 15 nasal mucosal tissue samples from the control group were processed for immunohistochemistry (IHC) analysis to verify the analytical results. Tissue samples from ten patients with NP in the CRSwNP group and ten nasal mucosal tissue samples from the control group were used in quantitative real-time reverse transcription polymerase chain reaction (qRT-PCR) analysis to validate the results.
Single-Cell Sequencing Analysis
Single-Cell Sequencing
The concentration and quality of the single-cell suspensions were strictly controlled based on the source and characteristics of the tissue or cell samples. The obtained tissue samples were washed 3 times in DPBS and transferred to centrifuge tube with 10 cm surgical scissors cut into small pieces. The samples were incubated at 37°C in a constant temperature water bath with the enzymatic digestion kit 1 hour. The size, cell number and viability of the tissue block were observed every 30 min during dissociation. Generally, the number of cells reached 106, the digestion solution became cloudy, and the incubation was terminated when the tissue block disappeared. The cells were filtered through a 40 µm sieve. The cell suspension was centrifuged at 300rcf for 5 min at 4°C, and the cells were resuspended. The cells were incubated at 4°C for 5 min, and immediately after the end, the cells were centrifuged at 300rcf for 5min at 4°C. The cells were fully resuspended by adding 1mL of resuspension. The target concentration was 700–1200 cells /μL. The cell activity was more than 90% and the agglomeration was less than 15%. Once the final cell concentration and activity were reached, the cells were placed on ice and the on-machine experiments of the 10x Genomics single-cell transcriptome chip were performed within 30 min. Cell quality inspection standard: cell concentration: 700–1200 cells/microliter. Cell volume:>60 microliters. Cell activity:> 90%. Agglomeration rate:< 15%. Cell diameter: <30 microns. It is important to note that because of the difficulty in isolating granulocytes from frozen samples, fresh tissue samples were selected first and should be processed immediately after granulocyte collection, no more than 2 hours later. Increasing the number of PCR cycles Increasing the number of PCR cycles by two during cDNA amplification of nonenriched samples may help to keep granulocyte-specific transcripts above the background. Unsupervised analysis of samples by Cell Ranger software may filter out those neutrophils that do not have much mRNA. We used the “--force-cells” parameter and set its value to target cell recovery.29,30
Chromium Next GEM Single-Cell 3ʹ Reagent Kits v3.1 were employed in conjunction with the Chromium Controller from 10×Genomics to generate libraries for scRNA-seq. Cell Ranger software and STRA aligner were used to analyze the sequencing data. Specifics regarding the preparation of sequencing libraries and preprocessing of scRNA-seq data can be found in the Supplementary Material 1. Seurat (4.3.0) software was used to cluster the data and its dimensionality was reduced using principal component analysis (PCA). Uniform manifold approximations and projections were used for visualization and presentation. SingleR (version 2.0.0) was used for automatic annotation of cellular taxa and manual annotation corrections. Cell types were corrected using the Cell Marker (http://bio-bigdata.hrbmu.edu.cn/CellMarker/).
Identifying the Differentially Expressed Genes Related to DCs via Single-Cell Analysis
First, quality control procedures were carried out using the “Seurat” R platform (version 4.3.0) based on scRNA-seq data with 500 < nFeature RNA < 7,000, nCount RNA < 50,000, and percent mt < 20%.31 Data were standardized through the utilization of the Normalize Date function on the “Seurat” R package (version 4.3.0). The top 2,000 high-variance genes were extracted using the FindVariable Features function. Clustering analyses were performed on the cells remaining after data integration and PCA dimensionality reduction. Subsequently, we used Human Primary Cell Atlas Data as a reference dataset and annotated the cell types via the “SingleR” R package (version 2.0.0), with the expression of marker genes obtained from the published literature.32,33 Moreover, cell to cell communication was evaluated via the “CellChat” R package. Myeloid cells were re-clustered and re-annotated. Differences in DCs among the NP, NM, and CM groups were assessed using the χ2-test. Differentially expressed genes (DEGs) were detected between NP and CM, and between NP and NM groups employing FindMarkers within the “Seurat” R package (version 4.3.0) with P<0.05 and |log2FC| > 0.25. These DEGs were then intersected to obtain common DEGs, which were re-annotated as DEGs1.
Analysis of Transcriptome Sequencing
Whole Transcriptome Sequencing
Using the TRIzol reagent (Invitrogen, USA), RNA was isolated from the samples and purified in accordance with the manufacturer’s instructions. The total RNA’s amount and purity were verified using a NanoDrop ND-1000 (NanoDrop, USA). Additionally, RNA integrity was evaluated using a Bioanalyzer 2100 (Agilent, USA) with a focus on achieving RIN values exceeding 7.0 and validated by denaturing agarose gel electrophoresis. Illumina NovaSeq 6000 (LC Bio-Technology CO., Ltd. Hangzhou, China) was used for bipartite sequencing according to standard procedures. The sequencing mode used was PE150. Reads with adapter contamination were removed using the Fastp program (https://github.com/OpenGene/fastp). Sequencing data were compared to GRCh38_gencode_v33 using HISAT2 (https://ccb.jhu.edu/software/hisat2) to obtain the read alignment file (in.bam file format). With the default settings, StringTie (https://ccb.jhu.edu/software/stringtie) was used to generate the mapped readings from each sample. Transcripts from all samples were amalgamated to reconstruct an all-encompassing transcriptome using gffcompare (https://github.com/gpertea/gffcompare/). Genes and transcripts were assembled and quantified as total_exon_ fragments/mapped_reads (in millions) × exon_length (in kilobases) using the StringTie software (https://ccb.jhu.edu/software/hisat2).(DEGs) between samples were scrutinized using the R package “DESeq2” (version 1.34.0), with criteria including P<0.05 and |log2FC|>0.5.34 Gene Ontology (GO) and Kyoto Encyclopedia of Genes and Genomes (KEGG) enrichment analyses were conducted for genes through the DAVID software (https://david.ncifcrf.gov/).
Analysis of Immune Cell Infiltration
The infiltrating abundance of 28 immune cells in the CRSwNP and control groups was evaluated using a single-sample gene set enrichment analysis. Discrepancies between the CRSwNP and control groups were compared using the Wilcoxon test. Moreover, the correlation between immune cells was evaluated by Spearman correlation analysis in the “corrplot” R package (version 0.92).35
Creation of a Weighted Gene Co-Expression System
To uncover modules linked to DCs, co-expression of weighted genes was executed based on transcriptome sequencing data. Outliers were cleared using sample clustering. To ensure that the gene interactions conformed as much as possible to a scale-free distribution, we performed soft threshold (β) determination. Next, the similarity among genes was calculated according to adjacency, and a gene dendrogram including different modules was created using the degree of dissimilarity. The relationships between the modules and DCs were calculated using Pearson’s correlation analysis.36 Modules with an absolute correlation value greater than 0.5 were most positively or negatively associated with DCs and were therefore selected for further study; the genes in these modules were termed DC-related genes (DCRGs).
Identification of Candidate Genes
First, the DEGs between the CRSwNP and control groups (DEGs2) were identified using the “DESeq2” R package (version 1.34.0) (P<0.05) and |log2FC|>0.5.37 DEGs1, DCRGs, and DEGs2 were then intersected to obtain intersecting genes via the “ggvenn” R package (version 0.1.9), which were recorded as candidate genes. The biological functional enrichment analysis of candidate genes based on the GO and KEGG databases was carried out using the “clusterProfiler” R package (version 4.7.1) and “org.Hs.eg.db” R package (version 3.16.0) (P< 0.05).38
Selection of Biomarkers
Support vector machine-recursive feature elimination (SVM–RFE) was implemented using the “caret” R platform and XGBoost (through the “xgboost” R package) were employed to identify characteristic genes.39 We then established an intersection between the two machine-learning-obtained characteristic genes to identify common characteristic genes.
Expression Analysis of Biomarkers
Analysis of Tissue Expression and Validation of External Data Sets
The expression trends of the common characteristic genes in the training and validation sets were examined. The diagnostic potential of these shared characteristic genes for CRSwNP was evaluated by constructing receiver operating characteristic curves through the “pROC” R package (version 1.18.0).40 In both the training and validation datasets, genes exhibiting statistically significant expression differences and displaying consistent expression patterns between the CRSwNP and control groups were considered. Additionally, the area under the curve (AUC) values higher than 0.7 were considered biomarkers.
Single-Cell Analysis of Biomarkers and Pseudotime Analysis
To visualize the expression levels of the three hub genes (NR4A1, CLEC4G, and CD163) across various cell types, the DotPlot function from the “Seurat” R package was employed. To conduct a more comprehensive analysis of biomarker expression in different tissues, the expression of these biomarkers was examined using the Human Protein Atlas (https://www.proteinatlas.org/). Additionally, the expression of biomarkers in different cell types was assessed via the DotPlot function in the “Seurat” R package. We further selected cells in which all biomarkers were expressed for pseudotime analysis using the “monocle3” R package. Finally, the correlation coefficients calculated by Spearman’s technique were used to evaluate the relationship between biomarkers and immune cells.
Immunohistochemical Analysis
Tissue samples underwent a series of processing steps, including dehydration, paraffin embedding, rotary microtome sectioning, and placement onto glass slides. The sections were dried for approximately 1 hour at 65°C. The tissue sections were deparaffinized using xylene and ethanol, immersed in a citrate solution, and heated for 20 minutes in a microwave oven. To prevent non-specific antibody binding, bovine serum albumin was used as a blocking agent. Subsequently, the tissue sections were incubated with primary antibodies (anti-NR4A1, 1:200 dilution; Proteintech; anti-CLEC4G, 1:100 dilution; anti-CD163, 1:1,000 dilution; Abcam, Cambridge, MA USA) in a humidified chamber at 4°C overnight. Subsequently, the cells were incubated with the secondary antibodies for 40 minutes at room temperature. The ImageJ software was used to analyze IHC staining for positivity (Bethesda, MD, USA).
qRT-PCR
RNA from tissues was purified using TRIzol (Invitrogen, USA) and was reverse transcribed using a reverse transcription kit (Transgene, Beijing, China). qRT-PCR analyses were performed using SYBR Green (Transgene, Beijing, China) on an Applied Biosystems 7500 Real-Time PCR System (Life Technologies, Gaithersburg, MD, USA), and gene expression levels were normalized to endogenous GAPDH. The primer sequences (5’-3’) used to amplify NR4A1 were forward, GCTTCGGGGACTGGATTGA and reverse, GGTGATGAGGACAAGGGCAGA. The primers used to amplify CLEC4G were forward, CGACCTGCTGAGGACAAACG and reverse, AGTCTCCGACCTCCTCCTTCA. The primers used to amplify CD163 were forward, CCAAAATCCAGGCAACAAACA and reverse, CTGTGGGCTGAGCAGGTAATT. The primers used to amplify GAPDH were forward, GGAAGCTTGTCATCAATGGAAATC and reverse TGATGACCCTTTTGGCTCCC.
Enrichment Analysis of Gene Sets
To perform an in-depth investigation into the biological functions and signaling pathways associated with the biomarkers, the median value of each biomarker’s expression was used as a criterion to divide the training dataset samples into groups with high and low expression, and subsequent differential analysis was conducted. Genes were ranked by logFC values, and gene set enrichment analysis was performed, considering adj P<0.05 and (|NES|) ≥ 1 as criteria.
Correlation Analysis Between Biomarkers and Immune Cells
Spearman correlation between gene expression and the fraction of immune cells was performed using the R package ggplot2 to illustrate the relationship between immune cell infiltration and the levels of biomarker expression. Initially, data consolidation and normalization were performed by processing the gene expression matrix and the list of results related to immune cell infiltration. Subsequently, correlation tests were performed for various immune cell types within the dataset, and the outcomes were visualized using correlation scatterplots. Finally, the relationship between the biomarkers and immune cells was depicted using a lollipop plot.
Creation of Regulatory Networks
To further investigate the mechanisms underlying biomarkers in CRSwNP, we created competing endogenous RNA (ceRNA) and TF-mRNA networks. First, the miRNAs regulating biomarkers were predicted using the MicroCosm (http://www.ebi.ac.uk/enright-srv/microcosm/htdocs/targets/v5/) and miRDB (http://www.mirdb.org/) databases. The miRNAs sourced from the two databases were compared to identify shared miRNAs, which were used to construct a ceRNA network. These common miRNAs were further employed in the starBase database (https://starbase.sysu.edu.cn/) to predict lncRNAs involved in regulatory interactions. Moreover, we selected lncRNAs with clipExpNum > 4 to construct the ceRNA network. TFs were predicted using the NetworkAnalyst database (https://www.networkanalyst.ca/). Finally, Cytoscape was used to visualize the regulatory networks.
Drug Prediction and Disease Prediction
The Drug-Gene Interaction Database (https://dgidb.genome.wustl) and the Comparative Toxicogenomics Database (CTD) (http://ctd.mdibl.org) were used to predict the correlation between drugs and diseases (ear, nose, and throat diseases) and biomarkers. The Cytoscape software was used to create a visual representation of the biomarker-drug network.
Statistical Analysis
Quantitative variables were expressed as median value and interquartile range and the Mann Whitney U-test was utilized. Categorical variables were presented as value and percentage with the chi-square test used. The significant level of differences between groups was ascertained by using the student’s t test to assess the expression levels of biomarkers. Based on the empirical Bayes method, the R package “DESeq2” was used for the analysis of common transcriptome differential genes. Spearman correlation analysis was used to explore the relationship between two variables, such as the correlation between immune cells. The statistical software SPSS (Version 21, Chicago, lL, USA), GraphPad Prism (Version 9.3.0, GraphPad Software Inc., San Diego, USA), or R software (Version 4.2.3) were used when appropriate. Statistical difference was defined as a two-sided P value<0.05. (ns, no significant, * P < 0.05, ** P < 0.01, *** P < 0.001, **** P < 0.0001).
Results
Patient Characteristics
The demographic characteristics were descripted in Table 1. According to the inclusion and exclusion criteria, a total of 72 patients were enrolled, including CRSwNP group (n=36) and control group (n=36). The median age was 44.50 and 49.00, respectively. There were 21 males and 15 females in the CRSwNP group, while 16 males and 20 females in the control group. Based on the exclusion criteria, no asthma, allergic rhinitis, or NERD were in the control group. In contrast, there were 5 cases with asthma (13.9%), 19 with allergic rhinitis (52.8%), and 1 with NERD (2.8%) in the CRSwNP group. A significant difference was found in allergic rhinitis between the two groups (P<0.001).
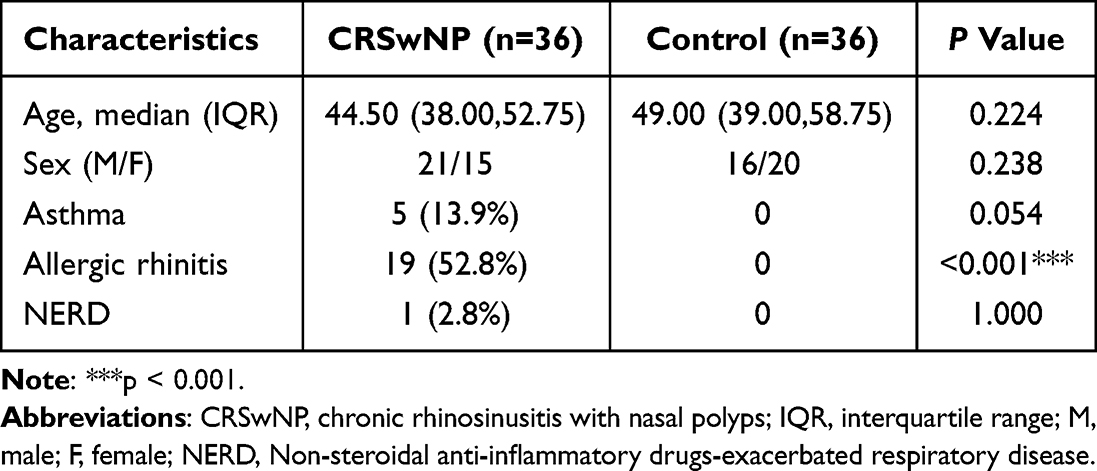 |
Table 1 Overall Patient Demographic Characteristics and Associated Clinical Features |
Identification of Common DEGs Between Different Groups
After quality control, 53,571 cells and 29,931 genes were used for subsequent analyses (Supplementary Figure 1A, and B). After data normalization, we characterized the top 2,000 genes with elevated variance and the top ten genes (Supplementary Figure 1C). Once the data were integrated across samples, PCA downscaling analysis was performed, and 20 principal components (P<0.05) were selected for subsequent analyses (Supplementary Figure 1D). The grouping of the two principal components was relatively high in the CM, NM, and NP groups (Supplementary Figure 1E). A total of 21 cell clusters were identified; however, cell cluster 9 was present only in the NP and NM groups and cell cluster 20 was present only in the NP and CM groups (Figure 1A, and B). A total of 21 clusters of cells were identified as epithelial cells, endothelial cells, fibroblasts, smooth muscle cells, B cells, T cells, and myeloid cells (Figures 1C, and D), all of which were present in the CM, NM, and NP groups (Figure 1E). Cluster 9 was epithelial cells; cluster 20 was fibroblasts. The number of epithelial cells was highest level in the NM and CM groups, whereas the percentage of endothelial cells was highest in the NP group (Figure 1F). Cell-cell communication analysis demonstrated that all seven cell types interacted with each other; however, the strength of the interaction varied from cell to cell (Supplementary Figure 2A, and B), We subsequently characterized the clusters of myeloid cells. Eleven cell clusters were identified and annotated into four cell types: mast cells, neutrophils, DCs, and macrophages (Figures 2A–C). Differential analysis showed that the distribution of DCs differed considerably among the NP, NM, and CM groups (P= 1.48×10⁻²¹). Therefore, we screened the DEGs for DCs in NP vs NM and NP vs CM. In the NP vs NM group, 779 DEGs were identified, including 548 upregulated and 231 downregulated genes (Figure 2D), whereas 1,339 DEGs were found in the NP vs CM group, including 675 upregulated and 664 downregulated genes (Figure 2D). Following this intersection, we obtained 358 DEGs1 that could play a key role in CRSwNP progression (Figure 2E).
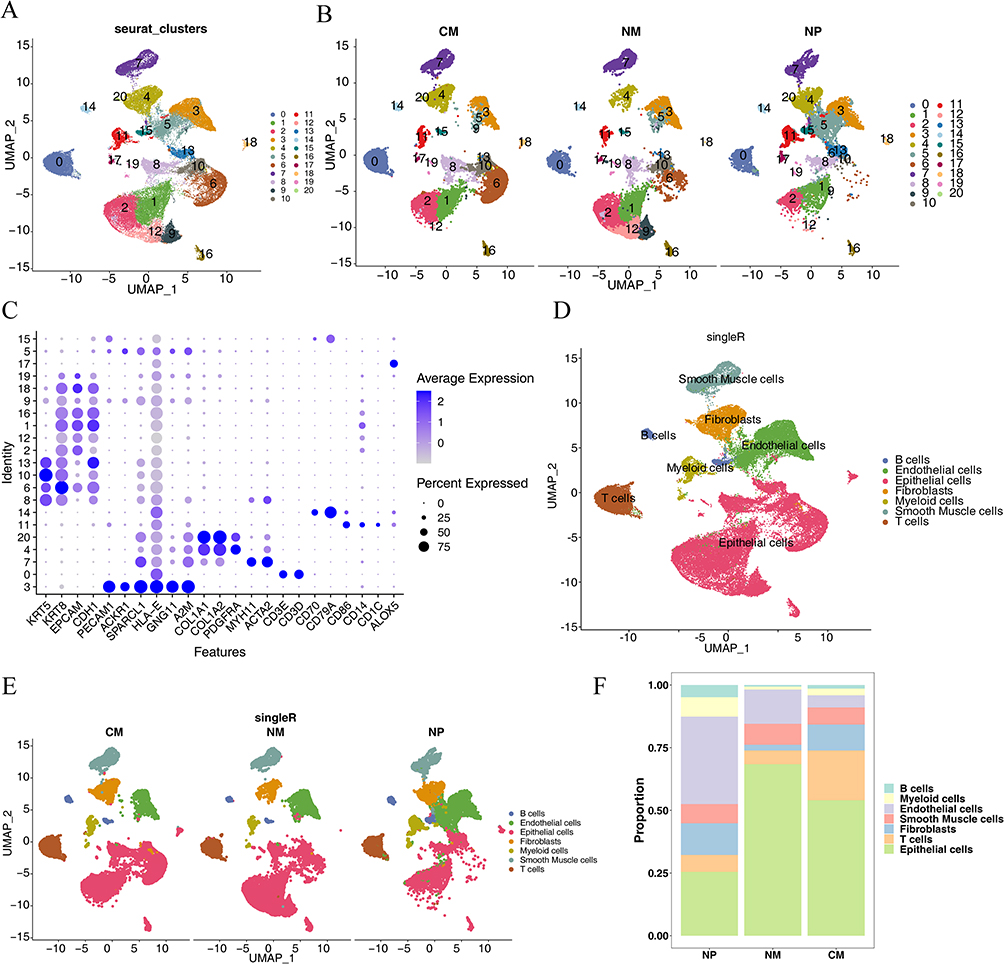 |
Figure 1 Characterization of cell clusters for all cells. (A) Uniform manifold approximation and projection (UMAP) cell clustering for the entire dataset. (B) UMAP cell clustering for the three groups (CM: nasal mucosa tissue samples from the control group; NM: nasal mucosa tissue samples adjacent to nasal polyps; NP: mucosal tissue samples from nasal polyps). (C) Bubble plots of the expression patterns of various marker genes within cellular clusters. (D) Annotation of cell type marker genes. (E) Annotation of cell type marker genes in CM, NM, and NP. (F) Proportion of each cell type in CM, NM, and NP. |
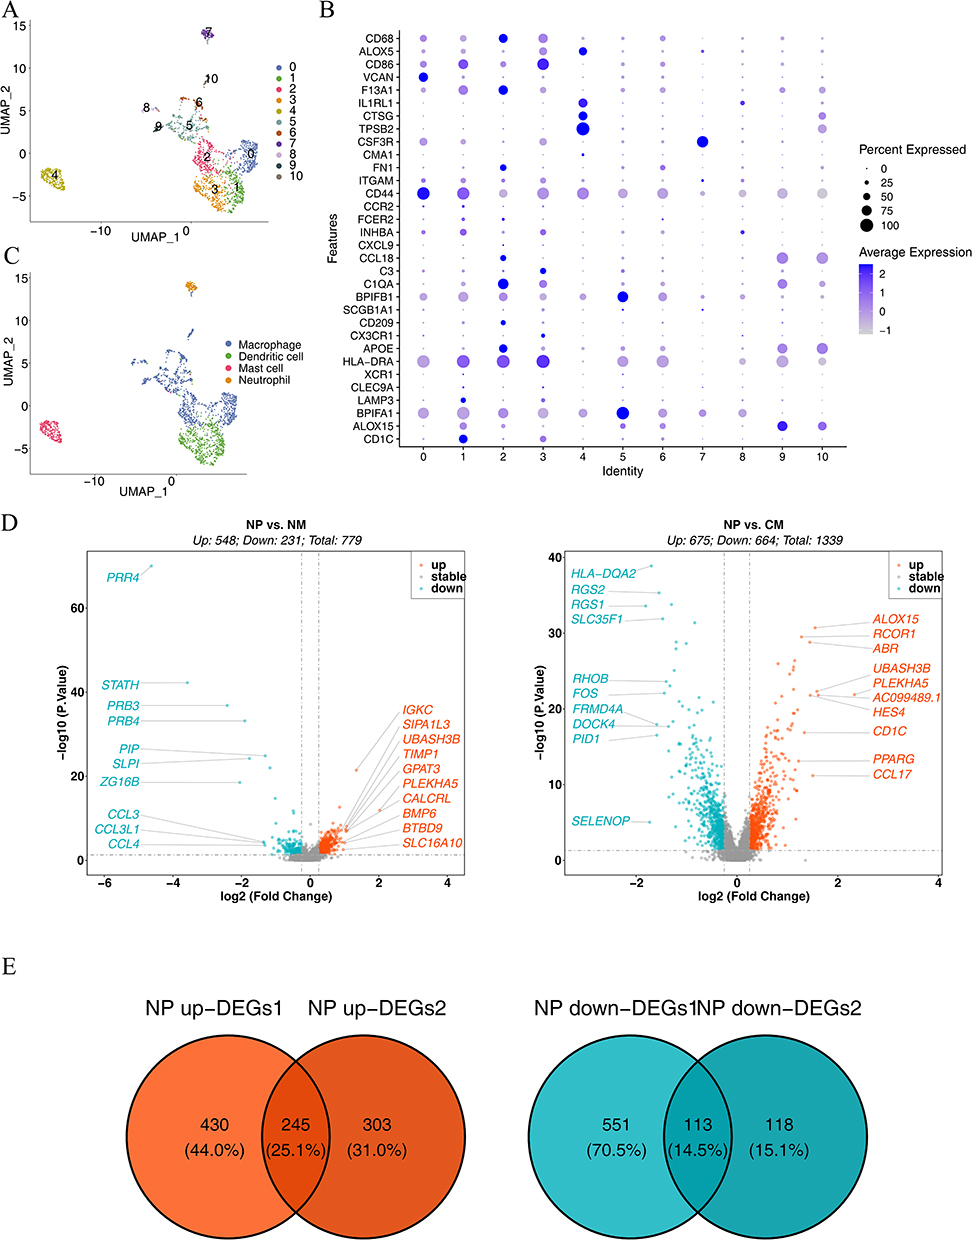 |
Figure 2 Characterization of cell clusters for myeloid cells. (A) UMAP downscaling and cellular taxa. (B) Bubble plots of the expression profiles of diverse marker genes in cellular taxa. (C) Annotation of marker gene cell types. (D) Volcanogram for differential gene analysis. The horizontal coordinate represents the multiplicity of differences in gene expression; the vertical coordinate represents the pvalue, which was taken as -log10. In NP vs NM, 779 DEGs were detected, encompassing 548 upregulated and 231 downregulated genes. In NP vs CM, 1,339 DEGs were identified, namely, 675 upregulated and 664 downregulated genes. (E) Screening for shared upregulated and downregulated differential genes. A total of 358 DEGs1 were identified after the intersection. |
Immune Infiltration Analysis Between the CRSwNP and Control Groups
The heatmap in Figure 3A illustrates the abundance of 28 immune cell types infiltrating both the CRSwNP and control groups. Five immune cell types exhibited statistically significant differences in their infiltration levels between the two groups: immature DCs, γδ T cells, neutrophils, effector memory CD4 T cells, and regulatory T cells (Figure 3B). Moreover, the abundance of these five immune cell types was notably elevated in the CRSwNP group. Immune infiltration of DCs showed the same trend for transcriptome and single-cell sequencing data, both of which were notably elevated in the CRSwNP group compared to the control. The correlations among immune cells are shown in Figure 4. Immature DCs were positively associated with effector memory CD4 T cells (cor = 0.77, P = 0.0137), suggesting that these two immune cells exhibit synergy in their functions.
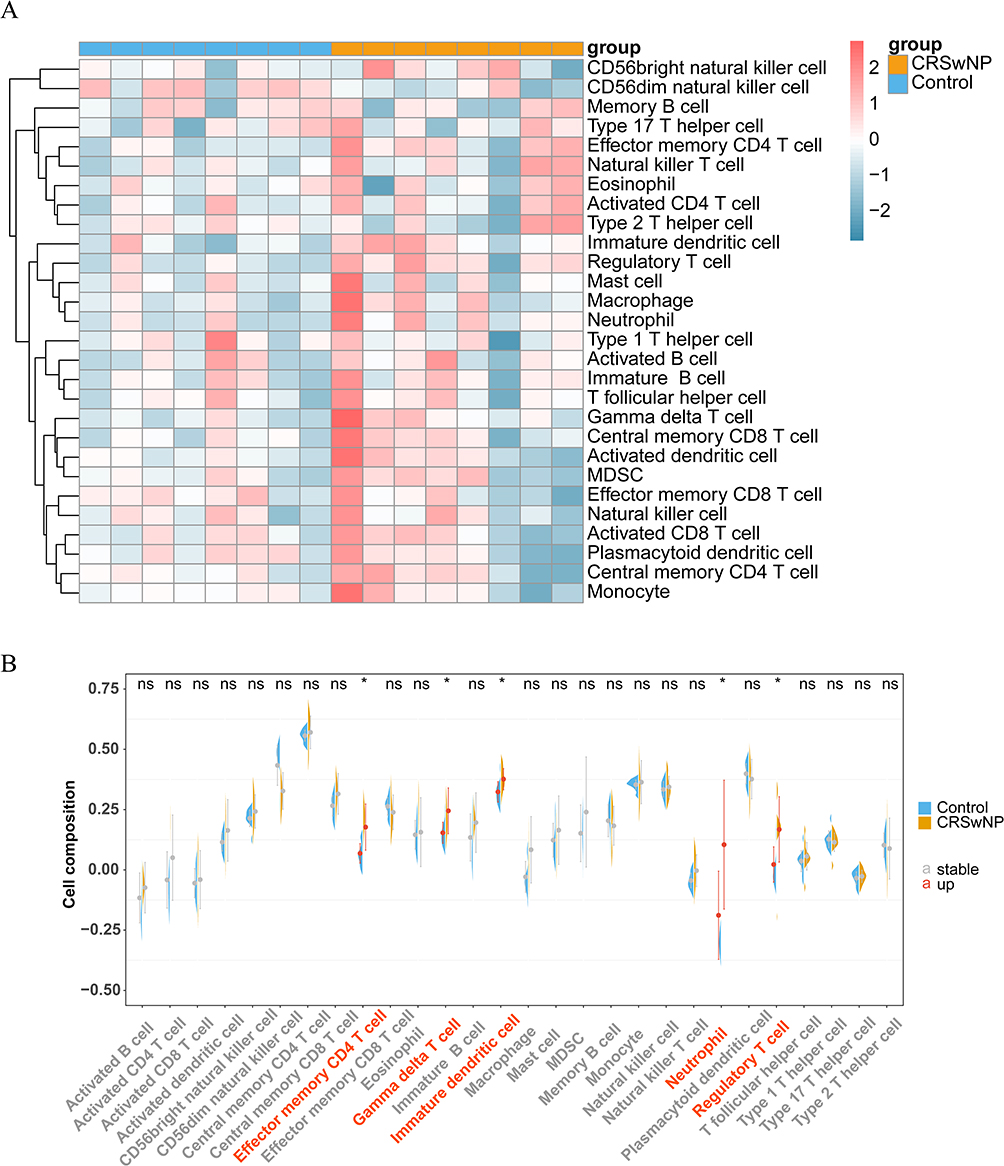 |
Figure 3 Analysis of immune cell infiltration. (A) Heat map showing the extent of immune cell infiltration. (B) Distinctions in immune cell abundance between the CRSwNP and control groups. ns, no significant, *P < 0.05. “a” indicates abscissa. The red abscissa indicates that the cell abundance of CRSwNP is up compared to the control group, the gray abscissa indicates no significant. |
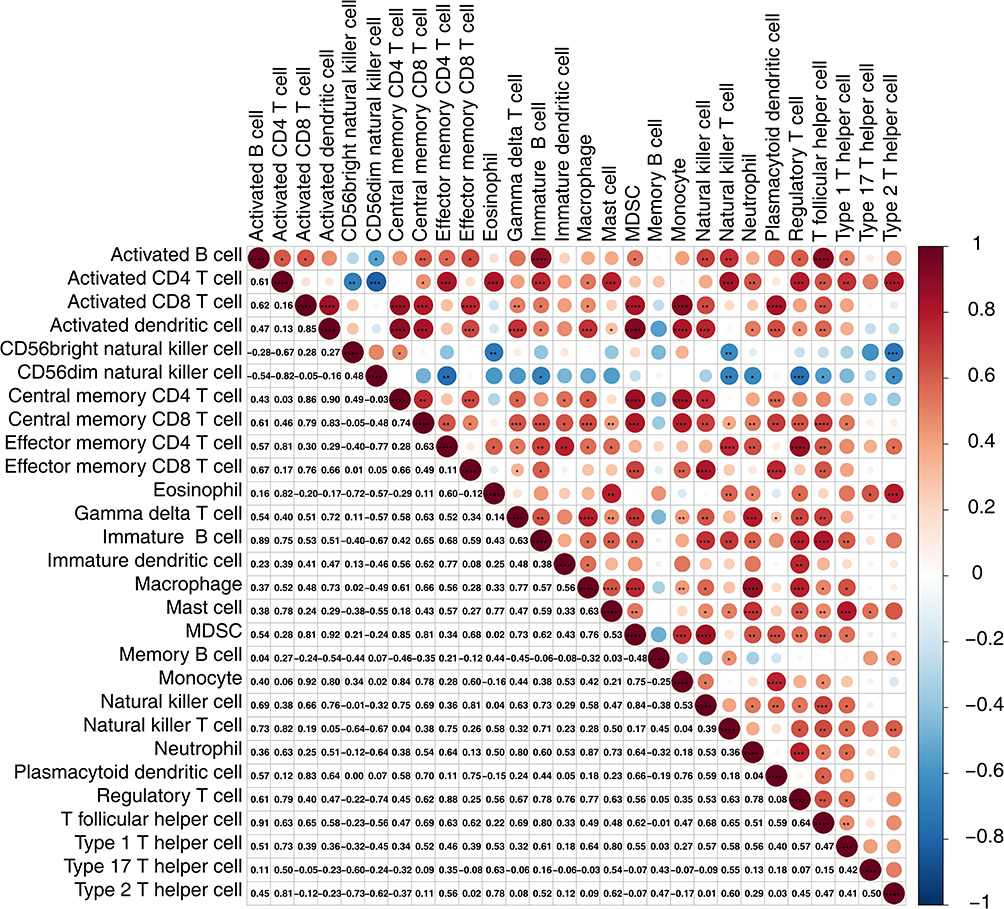 |
Figure 4 Immune cell correlation analysis. *P < 0.05, **P < 0.01, ***P < 0.001, ****P < 0.0001. |
Identification of 18 Candidate Genes
Sample clustering analysis revealed the absence of outlier samples in the training set (Supplementary Figure 3A). When β=20, mean connectivity converged to zero (Supplementary Figure 3B). In total, seven modules with unique colors were characterized: the MEblack module was most positively linked to DCs (r=0.63, P=0.009), whereas the MEblue module was most negatively linked to DCs (r=−0.58, P=0.02) The absolute value of the correlation is greater than 0.4 and significant (Figures 5A, and B). A total of 1,970 DCRGs were obtained for subsequent analyses. In total, 3,298 DEGs2, including 2,683 upregulated and 615 downregulated ones, were uncovered across the CRSwNP group and its control (Figures 5C, and D). Subsequently, 18 candidate genes were identified by intersecting DEGs1, DCRGs, and DEGs2 (Figure 5E). The GO results were enriched in 186 GO items (including 130 GO BP, 28 GO CC, and 28 GO MF) (Supplementary Table 1), including “cellular response to glucocorticoid stimulus”, “cytosolic small ribosomal subunit”, and “eme binding” (Figures 6A, and B). In total, 30 KEGG pathways exhibited enrichment (Supplementary Table 2), among them, four pathways were notably enriched and activated. These pathways include “coronavirus disease-COVID-19”, “tryptophan metabolism”, “ribosome”, and “collecting duct acid secretion” (Figure 7A). Combined with Z-score >0 (Red) indicates these four pathways are related to “metabolism”, “genetic information processing”, “biological systems”, and “human disorders” (Figure 7B).
 |
Figure 5 Identification of 18 candidate genes. (A) Gene-module tree plot. Each branch symbolizes an individual gene, and the colors below represent distinct co-expression modules. (B) Module-trait relationship chart. Seven modules were formed: MEblack (r=0.63, P=0.009) and MEblue (r=−0.58, P=0.02) modules were most significantly related to DCs. (C and D) Volcano and heat maps were used to analyze the differentially expressed genes. (E) Screening for candidate genes. |
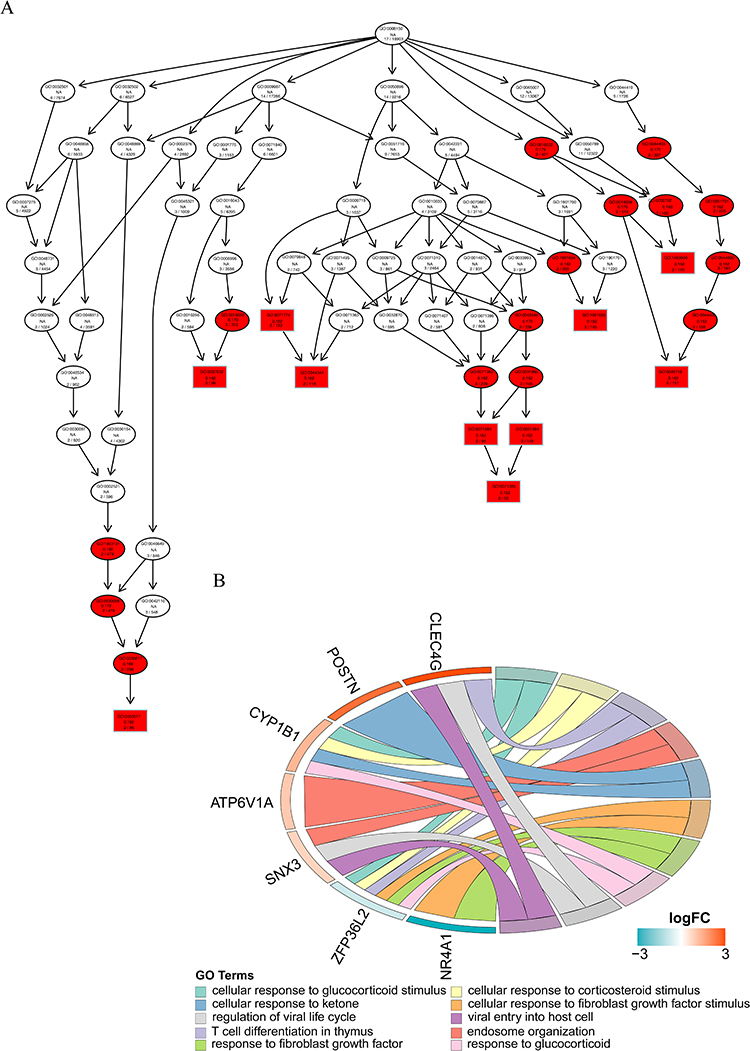 |
Figure 6 (A–B) GO: BP-enriched directed acyclic graphs and chordal graphs. Each box (or oval) displays the GO number and enrichment significance value. Different colors represent different enrichment significance. White indicates no answer, there are missing values or incomplete data in the sample. Red indicates significance. |
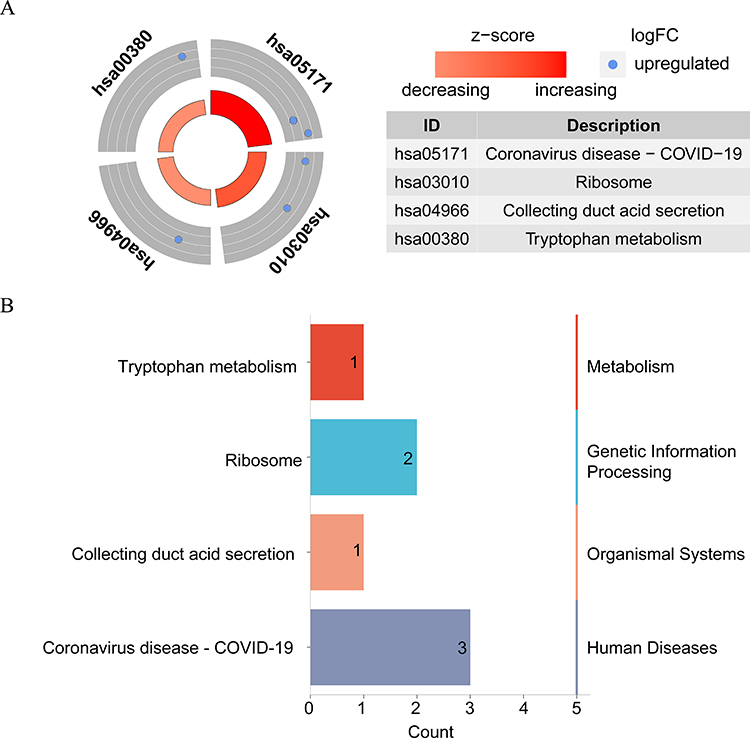 |
Figure 7 (A–B) KEGG enrichment circle diagram and classification of the results. |
Identification of Three Biomarkers
The SVM–RFE algorithm was used to identify nine characteristic genes: NR4A1, CLEC4G, CD163, RSRP1, BACH1, F13A1, ITSN1, APBB1IP, and ATP6V1A (Figure 8A). Four characteristic genes were extracted using the XGBoost algorithm: NR4A1, CLEC4G, ZFP36L2, and CD163 (Figure 8B). Three common characteristic genes (NR4A1, CLEC4G, and CD163) were identified using the two machine-learning algorithms (Figure 8C). Within both the training and validation sets, between the CRSwNP and control groups, there were notable differences in the expression levels of all common characteristic genes, with low NR4A1 expression and high CLEC4G and CD163 expression in the CRSwNP group (Figures 8D, and E). The AUC levels for all common characteristic genes exceeded 0.7 in both the training and validation sets (Figures 8F, and G). In conclusion, we identified three common characteristic genes as potential biomarkers for CRSwNP.
 |
Figure 8 Identification of the three biomarkers. (A) Curve showing the change in the actual value predicted by the SVM–RFE algorithm to obtain nine characteristic genes. (B) Histogram of four characteristic genes obtained using the XGBoost algorithm. (C) Wayne diagram showing the three screened candidate hub genes. (D) Expression of potential central genes in the training set. *P < 0.05, ***P < 0.001. (E) Expression levels of the potential central genes in the validation gene set. ***P < 0.001, ****P < 0.0001. (F) Receiver operating characteristic (ROC) analysis of potential central genes across the training set. (G) ROC analysis of potential central genes from the validation gene set. |
Biomarker Expression Levels
According to the HPA database, all biomarkers were expressed in the liver, lymph nodes, adipose tissue, and urinary bladder (Supplementary Figure 4A–C). All biomarkers were expressed in myeloid cells for all cell types (Figures 9A, and B). Therefore, we selected myeloid cells for the pseudotime analysis. Based on the expression levels of CD86 (a myeloid identifier), the starting stage of the pseudotime period was undifferentiated monocytes in the polyp tissue, which then differentiated into DCs and macrophages (Figures 9C, and D). Moreover, during the pseudotime, the expression of NR4A1 and CD163 showed a trend from high to low, whereas that of CLEC4G remained low (Figure 9E).
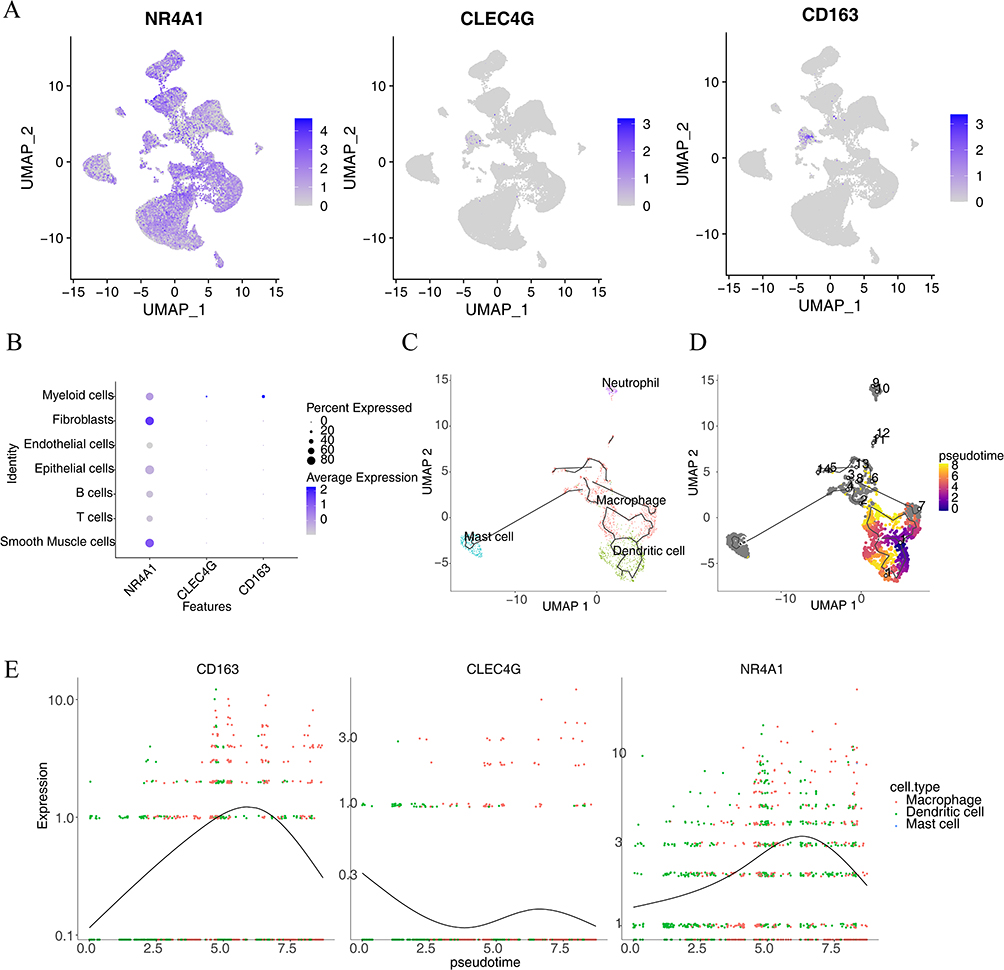 |
Figure 9 Single-cell expression analysis and pseudotime analysis. (A) Hub gene expression threshold across diverse cell taxa. (B) Bubble plot of gene expression in various cell types. (C) Immune cell differentiation pathways. (D) Map showing the differences in differentiation time between immune cells. (E) Expression of hub genes in pseudotime analysis. |
IHC analysis was used to measure NR4A1, CLEC4G, and CD163 levels in 15 patients with CRSwNP and 15 control subjects. The IHC staining results indicated that NR4A1 was primarily localized in the cytoplasm. Quantitative analysis revealed that the proportion of NR4A1-positive cells was significantly higher in the control group than in the CRSwNP group (P<0.05; Figure 10A). Similarly, IHC staining demonstrated that CLEC4G was predominantly expressed in the cytoplasm, with a significantly higher percentage of CLEC4G-positive cells in the CRSwNP group than in the control group (P<0.0001; Figure 10B). Finally, CD163 expression was detected in both the cytoplasm and nucleus, and the proportion of CD163-positive cells was notably elevated in the CRSwNP group (P<0.0001; Figure 10C).
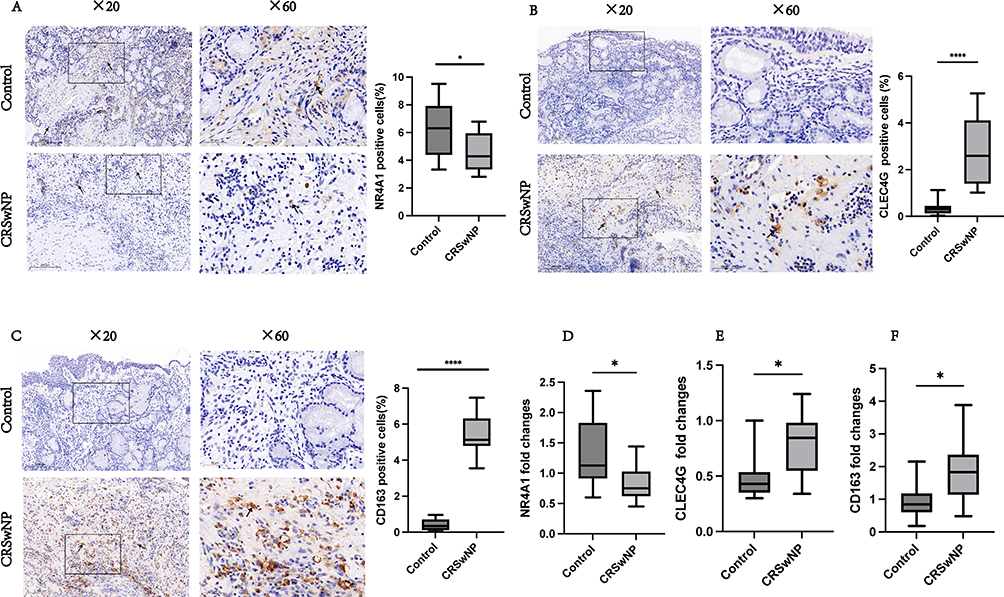 |
Figure 10 Experimental validation. NR4A1, CLEC4G, and CD163 expression in the control (n=15) and CRSwNP (n=15) groups was examined by IHC staining. The boxes display high-power images (×60) extracted from the low-power images (×20). NR4A1, CLEC4G, and CD163 staining are indicated by black arrows. Bar = 100 μm. The significance of the differences in NR4A1, CLEC4G, and CD163 expression between the control and CRSwNP groups (A–C) was determined using unpaired t-tests. qRT-PCR was employed to assess the mRNA levels of NR4A1, CLEC4G, and CD163 in both the control (n=10) and CRSwNP (n=10) groups (done in triplicate) (D–F). *P<0.05, ****P<0.0001. |
To confirm our findings, we used qRT-PCR to examine the mRNA levels of NR4A1, CLEC4G, and CD163 in ten samples from the CRSwNP and control groups. NR4A1 levels were higher in the control group compared to the CRSwNP group (P<0.05; Figure 10D), while CLEC4G (P<0.05; Figure 10E) and CD163 (P<0.05; Figure 10F) levels were higher in the CRSwNP group compared to the control group.
Enrichment and Immune Correlation Analysis for Biomarkers
According to the absolute rankings of NES, we determined the top five pathways with NES > 0 or NES < 0. The results demonstrated that all biomarkers were enriched throughout the Notch signaling, olfactory transduction, neuroactive ligand receptor interaction, and circadian rhythm pathways in mammals. NR4A1 is involved in starch, sucrose, retinol, and drug metabolism. CLEC4G was enriched in the calcium signaling pathway, hematopoietic cell lineage, and cytokine-cytokine receptor interaction pathway. CD163 is involved in “ABC transporters”, “steroid hormone biosynthesis”, and “complement and coagulation cascades”, among others (Figure 11A, Supplementary Table 3–5).
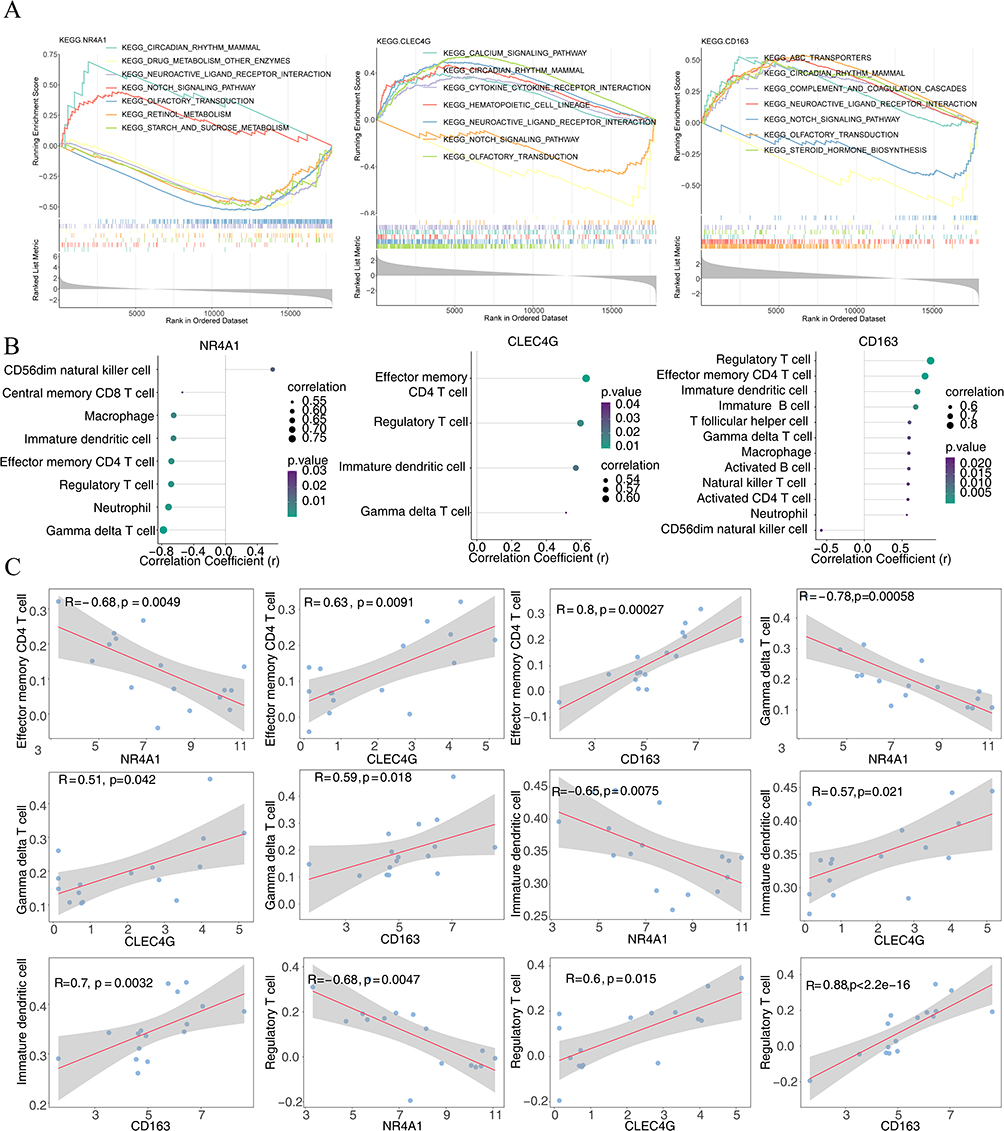 |
Figure 11 Enrichment and immune correlation analyses for biomarkers. (A) Gene set enrichment analysis assembled based on hub gene expression levels. (B) The Lollipop diagram shows that NR4A1, CLEC4G, and CD163 were significantly correlated with 8, 4, and 12 immune cell infiltrations, respectively. Circle size represents the absolute correlation coefficient value; circle color corresponds to the P value from the correlation test. (C) Scatter plots of the relationship among NR4A1, CLEC4G, and CD163 expression in different immune cells. R: correlation coefficient; P<0.05, significant correlation. |
Additionally, the correlation between biomarkers and immune cell results showed that NR4A1, CLEC4G, and CD163 were considerably correlated with eight, four, and 12 immune cells, respectively (Figure 11B). Among them, all biomarkers were significantly correlated to effector memory CD4 T cells (NR4A1: r=−0.68, P=0.0049; CLEC4G: r=0.63, P=0.0091; CD163: r=0.80, P=0.00027), γδ T cells (NR4A1: r=−0.78, P=0.00058; CLEC4G: r=0.51, P=0.042; CD163: r=0.59, P=0.018), immature DCs (NR4A1: r=−0.65, P=0.0075; CLEC4G: r=0.57, P=0.021; CD163: r=0.70, P=0.0032), and regulatory T cells (NR4A1: r=−0.68, P=0.0047; CLEC4G: r=0.60, P=0.015; CD163: r=0.88, P<2.2e-16) (Figure 11C, Supplementary Table 6–8).
Regulation Networks and Drug Prediction
Five common miRNAs namely hsa-miR-559, hsa-miR-608, hsa-miR-623, hsa-miR-200b-5p, and hsa-miR-124-3p were obtained from the two databases (Figure 12A). Next, a ceRNA network was created, which included two mRNAs, five miRNAs, and 12 lncRNAs. Interestingly, 12 lncRNAs only regulated hsa-miR-124-3p (Figures 12B, and C). The TF-mRNA network contained three mRNAs and 17 TFs (Figure 12D). For example, GATA2 regulated all biomarkers, whereas YY1, CREB1, HINFP, and POU2F2 regulated the expression of NR4A1 and CD163.
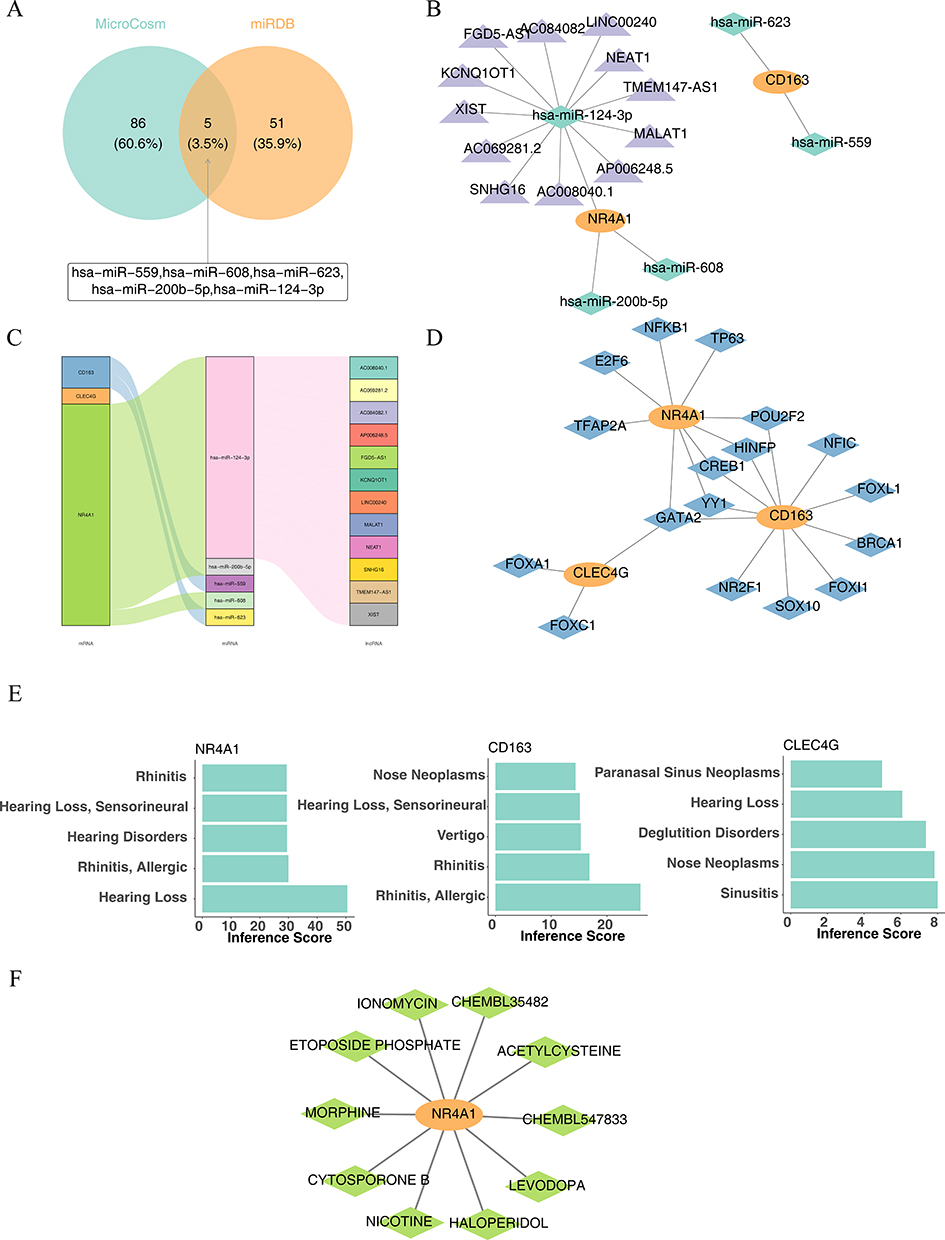 |
Figure 12 Prediction of regulatory networks and drugs. (A) Screening for targeted miRNAs. (B) ceRNA network. Orange: mRNA; green: miRNA; purple: lncRNA. (C) Alluvial diagram. (D) TF-mRNA network. Orange: mRNA; blue: TF. (E) Hub genes are significantly associated with ear, nose, and throat disorders. (F) Hub gene and corresponding small-molecule drug network map. Orange: hub genes; green: small-molecule therapeutics. |
According to the CTD databases, NR4A1 and CD163 were associated with “rhinitis”, “allergy”, and “hearing loss”. Additionally, CLEC4G was associated with “nose neoplasms” and “sinusitis” (Figure 12E). Finally, a biomarker–drug network was built, comprising one biomarker (NR4A1) and 10 drugs (Figure 12F), including ionomycin, chembl35482, and acetylcysteine.
Discussion
In our study, we detected elevated dendritic cell infiltration in CRSwNP and searched for potential biomarkers (NR4A1, CLEC4G and CD163) associated with dendritic cells during disease progression in CRSwNP. All biomarkers were significantly correlated to effector memory CD4 T cells, γδ T cells, immature DCs, and regulatory T cells. And we constructed a dendritic cell-centred global regulatory network by analysing the biological pathways, molecular regulatory mechanisms, and relevant drugs of dc-related biomarkers in CRSwNP (Figure 13). First, we performed cluster analysis of all cells and genes detected in the three sample groups (CM, NM, and NP) after quality control. We screened myeloid cells for subcellular identification, and C3F3R was used as a neutrophil Marker gene according to the annotation results.15,16 After observing the expression of C3F3R in each subgroup of Myeloid cells, it was found that C3F3R was significantly higher in Cluster7. Therefore, Cluster7 can be identified as neutrophils. Furthermore, our results showed that the distribution of DCs varied considerably among the NP, NM, and CM groups. In contrast, Kim et al41 found that the rate of innate immune cell infiltration was increased in the NP group. Moreover, CRSwNP tissues displayed an increased number of innate immune cells and also showed a more pronounced increase in MBP+, CD68+, and CD11c+ cells. Since CD68 and CD11c are not limited to dendritic cells (DCs), but also can be expressed by macrophages and monocytes, the proportion of myeloid cells is significantly increased in patients with CRSwNP. It has been reported that the levels of eosinophils, dendritic cells, basophils, and neutrophils are increased in patients with CRSwNP. Myeloid cells included granulocytes, erythrocytes, megakaryocytes, and monocytes, thus consistent with our findings.41 That is, the level of myeloid immune cells was elevated in CRSwNP tissues compared to the other two groups, which is consistent with our findings. Notably, we showed that the immune infiltration of DC was highest in the diseased (CRSwNP) group. DC cells are specialized antigen-presenting cells in the organism that efficiently take up, process and present antigens. It has been shown that the significant increase in the number of DCs in nasal polyp tissues may be the main reason for the imbalance of the Th1/Th2 and the general predominance of the expression of Th2 cytokines in the pathological process of nasal polyps.42,43 In our study, correlation analysis among immune cells indicated a functional synergy between immature DCs and effector memory CD4+ T cells, DCs mediate the activation of T cells and receive the activation signals back from T cells. Zhang et al15 identified DC cells as a key determinant of the type of immune response, and specific DC cell subpopulations were isolated that could induce type 2 immunity. In our study, we screened for biomarkers of DCs, of these, both CD163 and NR4A1 were highly expressed early in CRSwNP, and CD163+ DCs was shown to correlate with the activation of naïve T cells early in the disease.44 Lin et al45 reported a substantial increase in the number of DCs in individuals with NP, which could lead to the activation of B7-1 (CD80) and B7-2 (CD86) expression through their interaction with CD40L on T cells. DC-expressed B7 molecules can activate T cells through the CD28/CTLA-4 pathway, and numerous studies have implicated a collaborative interaction involving DCs and CD4+ T cells in antigen presentation during the immune response.45,46 This process of antigen presentation operates bidirectionally, involving DCs facilitating T cell activation while concurrently receiving activation signals from T cells. Notably, T cells exhibit heightened expression of CD80/CD86 on their surfaces during this interaction and undergo reduced adhesion and phagocytosis.47 The interplay between DCs and T cells could potentially trigger T cell maturation and the secretion of cytokines, thereby inducing a more substantial influx of both DCs and T cells into NP tissues. Consequently, the increased quantities of DCs and T cells observed in this study may further contribute to the progression of NP.48
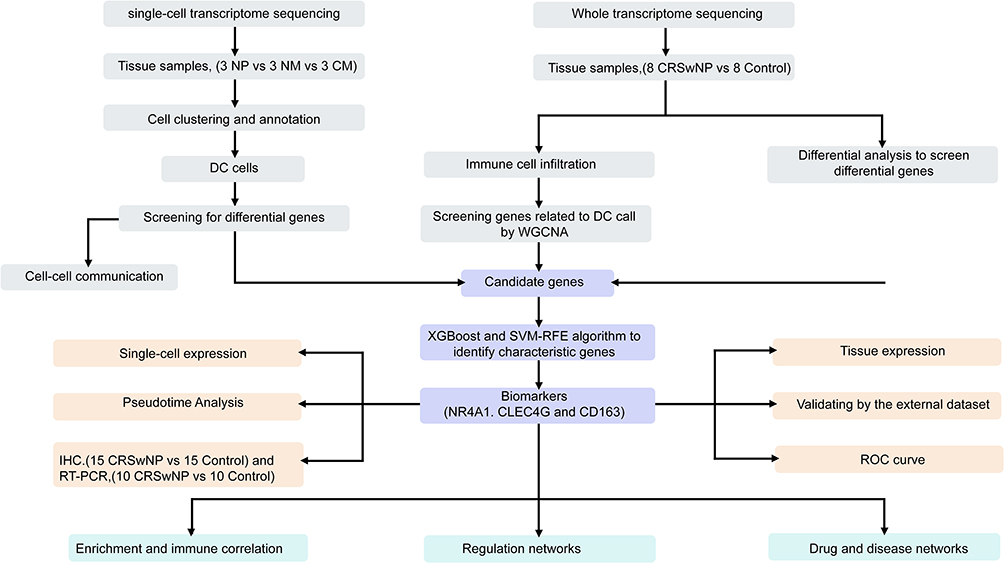 |
Figure 13 Flowchart of the study. |
In this study, we carried out whole transcriptome sequencing, accompanied by pairwise comparisons of the CRSwNP and control groups, to identify candidate genes that play a role in the development of NPs. Three hub genes, NR4A1, CLEC4G, and CD163, were identified using the XGBoost and SVM–RFE algorithms. NR4A1 is a member of the NR4A family of orphan nuclear receptors. These are present in various tissues and can be rapidly induced to express several stimuli.49–51 One of the most prominent functions of NR4A1 is to regulate inflammation, with its anti-inflammatory properties in various cell types, including macrophages, epithelial cells, and endothelial cells.52 Prior investigations have indicated that NR4A1 deficiency can intensify airway inflammation, particularly in individuals with asthma by inhibiting airway inflammation through the NF-κB/IκBα signaling pathway. NR4A1 might be an asthma biomarker and a potential prognostic factor for asthma immunotherapy.53 In our study, NR4A1 expression was reduced in the CRSwNP group. Pathway analysis revealed that NR4A1 was mainly involved in glucose metabolism, cell differentiation, proliferation, and apoptosis. Therefore, our results indicated that NR4A1 may act as a prognostic predictor of CRSwNP.CLEC4G, a C-type lectin protein family member, is highly expressed in monocytes.54,55 CLEC4G is the second most upregulated gene in CRSwNP and interacts with the surface glycoproteins of diverse viruses, including the spike proteins of SARS coronaviruses.56 Here, our study found that CLEC4G was upregulated in NP tissues, which is in agreement with previous studies. CD163 is a monocyte and macrophage transmembrane scavenger receptor protein that can be induced by glucocorticoids and IL-10.57 CD163 mediates the binding of monocytes to bacteria, leading to the release of inflammatory cytokines.58 However, the diversity, ontogeny, and functional capacity of DC subpopulations in humans are not fully understood. First, macrophages and dendritic cells have homology. They are monocyte-derived immune cells, and they share a common progenitor cell, which can be induced to differentiate into dendritic cells and macrophages in culture. In our results of pseudotime analysis, CD163 expression level was first increased and then decreased, indicating that the dendritic cell population in CRSwNP had the characteristics of M2-type macrophages at the early stage of disease progression. In addition, it has been found that circulating CD163+ DCs are a specific subpopulation of DC cells, called DC3s, which develop independently of CDC-restricted (CDP) and monocyte-restricted (cMoP) progenitor cells through a specific pathway activated by GM-CSF. DC3s can drive the activation of naive T cells.44 In our study, we uncovered a pivotal role played by CD163+ DCs in the progression of CRSwNP. Bourdely et al59 demonstrated that CD163+ DCs change through a defined pathway activated by GM-CSF. Unlike conventional DCs, CD163+ DCs activate naïve T cells, which is consistent with the results obtained in this study on the synergistic effects of DC and T cells. Additionally, we examined changes in biomarker expression levels at multiple differentiation stages of DCs using pseudotime analysis after single-cell sequencing. The expression levels of both NR4A1 and CD163 initially increased and then decreased. Thus, these markers can predict the specific immune activation in sinusitis.
In our whole transcriptome sequencing enrichment analysis, we observed that all biomarkers were involved in the cytokine and cytokine receptor pathways. NR4A1 can directly inhibit NF-κB signaling and inflammatory factor expression.60 CD163 is a key player in the NF-κB pathway in fibroinflammatory diseases.61 Moreover, the NF-κB signaling pathway is critical for cytokine-induced gene expression.62 The CLEC4G receptor on DC surfaces can bind ligands on the surface of T cells and induce intracellular signaling via DAP12 to promote cytokine secretion, which induces initial CD4+ T cell differentiation.63 According to immune correlation analysis, the three biomarkers were significantly associated with T cells, and previous studies have shown that NR4A1 can be rapidly induced by signaling by T cell antigen receptors64 and removal of CD163 leads to massive infiltration of activated T cells.65 Furthermore, CLEC4G triggers CD8+ T cell tolerance and CD4+ T cell differentiation.66 In addition, CTD database analysis revealed that the biomarkers CD163 and NR4A1 were associated with rhinitis, whereas CLEC4G was associated with sinusitis. In our constructed biomarker–drug network, we found one biomarker (NR4A1) and 10 drugs, including ionomycin, chembl35482, and acetylcysteine. Acetylcysteine has been used in the antioxidative stress treatment of CRSwNP.67 Nicotine is an exogenous nicotinic acetylcholine receptor agonist that suppresses proinflammatory cytokines release by triggering cholinergic anti-inflammatory pathways. It is used clinically to treat ulcerative colitis and combat inflammation. According to recent studies, nicotine is a potential new CRSwNP treatment for patients with severe SARS-CoV-2.68
Our study presented reliable DC biomarkers and their associated signaling pathways, and the identified DEGs represent a valuable resource. By combining scRNA-seq and whole transcriptome sequencing to analyze immune and non-immune cells from mucosal tissue samples extracted from nasal polyps, nasal mucosa tissues neighboring nasal polyps, and nasal mucosa tissue samples from a control group, and identify DCs as a key immune cell population in CRSwNP and three hub genes as biomarkers of CRSwNP. Furthermore, the constructed ceRNA, TF-mRNA, and biomarker–drug networks provided new targets for CRSwNP treatment.
Limitations
Our study had some limitations. We identified 3 hub genes related to DCs in CRSwNP, the precise roles of these hub genes in the pathogenesis of CRSwNP need to be further elucidated. Therefore, extensive animal experiments are required to explore these functions. In addition, we need more research to confirm our findings by expanding the sample size.
Conclusion
We identified DCs as a key immune cell population in CRSwNP and three hub genes (NR4A1, CLEC4G and CD163) as biomarkers of CRSwNP by combining scRNA-seq and whole transcriptome sequencing. CD163 and NR4a1 were highly expressed in the early stage of CRSwNP and were involved in the activation of T cells. Furthermore, the constructed ceRNA, TF-mRNA, and biomarker–drug networks provided new targets for CRSwNP treatment. This study provides potential therapeutic agents for the clinical treatment of CRSwNP based on key genes.
Abbreviations
AUC, area under the curve; CRS, chronic rhinosinusitis; CRSwNP, chronic rhinosinusitis accompanied by nasal polyps; NP group, nasal polyps; NM group, nasal mucosa tissue samples adjacent to nasal polyps from the CRSwNP group; CM group, nasal mucosa tissue samples from the control group; DCs, Dendritic cells; DCRGs, DC-related genes; ceRNA, endogenous RNA; GEO, Gene Expression Omnibus; GO, Gene Ontology; KEGG, Kyoto Encyclopedia of Genes and Genomes; PCA, principal component analysis; qRT-PCR, quantitative real-time reverse transcription-polymerase chain reaction; scRNA, single cell; SVM–RFE RNA, Support vector machine-recursive feature elimination; TF-mRNA, transcription factor; UMAP, Uniform manifold approximation and projection.
Ethics Approval and Informed Consent
The Beijing Chaoyang Hospital’s Ethics Committee’s Institutional Review Board (No. 2020-3-16-18) gave its approval to this work. All experiments involving human participants adhered to the institutional ethical guidelines and followed the principles of the Declaration of Helsinki. Before participating in the study, all participants involved provided written informed permission.
Data Sharing Statement
The unique inputs included in the study are outlined in the article/supplementary material. Further questions or concerns may be directed to the corresponding author.
Acknowledgments
We appreciate Dr. Lu’s insightful advice and constructive comments regarding our study.
Funding
This research received funding support from the National Natural Science Foundation of China (82071068).
Disclosure
The authors report no conflicts of interest in this work.
References
1. Cho SH, Hamilos DL, Han DH, Laidlaw TM. Phenotypes of chronic rhinosinusitis. J Allergy Clin Immunol Pract. 2020;8(5):1505–1511. doi:10.1016/j.jaip.2019.12.021
2. Morcom S, Phillips N, Pastuszek A, Timperley D. Sinusitis. Aust Fam Physician. 2016;45(6):374–377.
3. Gan W, Zhang H, Yang F, et al. The influence of nasal bacterial microbiome diversity on the pathogenesis and prognosis of chronic rhinosinusitis patients with polyps. Eur Arch Otorhinolaryngol. 2021;278(4):1075–1088. doi:10.1007/s00405-020-06370-4
4. Ahmad N, Zacharek MA. Allergic rhinitis and rhinosinusitis. Otolaryngol Clin North Am. 2008;41:267–281. doi:10.1016/j.otc.2007.11.010
5. Marseglia GL, Caimmi S, Marseglia A, et al. Rhinosinusitis and asthma. Int J Immunopathol Pharmacol. 2010;23:29–31. doi:10.1177/03946320100230S108
6. Cho DY, Hunter RC, Ramakrishnan VR. The microbiome and chronic rhinosinusitis. Immunol Allergy Clin North Am. 2020;40:251–263. doi:10.1016/j.iac.2019.12.009
7. Huang J, Xu Y. Autoimmunity: a new focus on nasal polyps. Int J Mol Sci. 2023;24:8444.
8. Poddighe D, Vangelista L. Staphylococcus aureus infection and persistence in chronic rhinosinusitis: focus on Leukocidin ED. Toxins. 2020;12(11):678. doi:10.3390/toxins12110678
9. Brar T, Marks L, Lal D. Insights into the epigenetics of chronic rhinosinusitis with and without nasal polyps: a systematic review. Front Allergy. 2023;4:1165271. doi:10.3389/falgy.2023.1165271
10. Chiarella SE, Grammer LC. Immune deficiency in chronic rhinosinusitis: screening and treatment. Expert Rev Clin Immunol. 2017;13(2):117–123. doi:10.1080/1744666X.2016.1216790
11. Takabayashi T, Schleimer RP. Formation of nasal polyps: the roles of innate type 2 inflammation and deposition of fibrin. J Allergy Clin Immunol. 2020;145(3):740–750. doi:10.1016/j.jaci.2020.01.027
12. Triantafillou V, Workman AD, Kohanski MA, Cohen NA. Taste receptor polymorphisms and immune response: a review of receptor genotypic-phenotypic variations and their relevance to chronic rhinosinusitis. Front Cell Infect Microbiol. 2018;8:64. doi:10.3389/fcimb.2018.00064
13. Liu Z, Shi H, Xu J, et al. Single-cell transcriptome analyses reveal microglia types associated with proliferative retinopathy. JCI Insight. 2022;7(23): doi:10.1172/jci.insight.160940
14. Chi H, Zhao S, Yang J, et al. T-cell exhaustion signatures characterize the immune landscape and predict HCC prognosis via integrating single-cell RNA-seq and bulk RNA-sequencing. Front Immunol. 2023;14:1137025. doi:10.3389/fimmu.2023.1137025
15. Wang W, Xu Y, Wang L, et al. Single-cell profiling identifies mechanisms of inflammatory heterogeneity in chronic rhinosinusitis. Nat Immunol. 2022;23(10):1484–1494. doi:10.1038/s41590-022-01312-0
16. Ordovas-Montanes J, Dwyer DF, Nyquist SK, et al. Allergic inflammatory memory in human respiratory epithelial progenitor cells. Nature. 2018;560(7720):649–654. doi:10.1038/s41586-018-0449-8
17. Bangert C, Villazala-Merino S, Fahrenberger M, et al. Comprehensive analysis of nasal polyps reveals a more pronounced type 2 transcriptomic profile of epithelial cells and mast cells in aspirin-exacerbated respiratory Disease. Front Immunol. 2022;13:850494. doi:10.3389/fimmu.2022.850494
18. Li Z, Yang Q, Tang X, et al. Single-cell RNA-seq and chromatin accessibility profiling decipher the heterogeneity of mouse gammadelta T cells. Sci Bull. 2022;67(4):408–426. doi:10.1016/j.scib.2021.11.013
19. Nakamura S, Ohuchida K, Ohtsubo Y, et al. Single-cell transcriptome analysis reveals functional changes in tumour-infiltrating B lymphocytes after chemotherapy in oesophageal squamous cell carcinoma. Clin Transl Med. 2023;13(1):e1181. doi:10.1002/ctm2.1181
20. Derbois C, Palomares MA, Deleuze JF, Cabannes E, Bonnet E. Single cell transcriptome sequencing of stimulated and frozen human peripheral blood mononuclear cells. Sci Data. 2023;10:433. doi:10.1038/s41597-023-02348-z
21. Gardner A, de Mingo Pulido A, Ruffell B. Dendritic cells and their role in immunotherapy. Front Immunol. 2020;11:924. doi:10.3389/fimmu.2020.00924
22. Collin M, Bigley V. Human dendritic cell subsets: an update. Immunology. 2018;154:3–20. doi:10.1111/imm.12888
23. Tiberio L, Del Prete A, Schioppa T, et al. Chemokine and chemotactic signals in dendritic cell migration. Cell Mol Immunol. 2018;15(4):346–352. doi:10.1038/s41423-018-0005-3
24. Zanna MY, Yasmin AR, Omar AR, et al. Review of dendritic cells, their role in clinical immunology, and distribution in various animal species. Int J Mol Sci. 2021;22(15):8044. doi:10.3390/ijms22158044
25. Huang L, Baban B, Johnson BA3rd, Mellor AL. Dendritic cells, indoleamine 2,3 dioxygenase and acquired immune privilege. Int Rev Immunol. 2010;29(2):133–155. doi:10.3109/08830180903349669
26. Hubbe ML, Jaehger DE, Andresen TL, Andersen MH. Leveraging endogenous dendritic cells to enhance the therapeutic efficacy of adoptive t-cell therapy and checkpoint blockade. Front Immunol. 2020;11:578349. doi:10.3389/fimmu.2020.578349
27. Fokkens WJ, Lund VJ, Hopkins Cet al. European position paper on rhinosinusitis and nasal polyps 2020. Rhinology. 2020;58(1):1–464. doi:10.4193/Rhin20.401
28. Peng Y, Zi XX, Tian TF, et al. Whole-transcriptome sequencing reveals heightened inflammation and defective host defence responses in chronic rhinosinusitis with nasal polyps. Eur Respir J. 2019;54(5):1900732. doi:10.1183/13993003.00732-2019
29. Giordani L, He GJ, Negroni E, et al. High-dimensional single-cell cartography reveals novel skeletal muscle-resident cell populations. Mol Cell. 2019;74(3):609–621.e606. doi:10.1016/j.molcel.2019.02.026
30. Park J, Shrestha R, Qiu C, et al. Single-cell transcriptomics of the mouse kidney reveals potential cellular targets of kidney disease. Science. 2018;360(6390):758–763. doi:10.1126/science.aar2131
31. Hao Y, Hao S, Andersen-Nissen E, et al. Integrated analysis of multimodal single-cell data. Cell. 2021;184(13):3573–3587 e3529. doi:10.1016/j.cell.2021.04.048
32. Aran D, Looney AP, Liu L, et al. Reference-based analysis of lung single-cell sequencing reveals a transitional profibrotic macrophage. Nat Immunol. 2019;20(2):163–172. doi:10.1038/s41590-018-0276-y
33. Dwyer DF, Ordovas-Montanes J, Allon SJ, et al. Human airway mast cells proliferate and acquire distinct inflammation-driven phenotypes during type 2 inflammation. Sci Immunol. 2021;6(56): doi:10.1126/sciimmunol.abb7221
34. Wen F, Guan X, Qu HX, Jiang XJ. Integrated analysis of single-cell and bulk RNA-seq establishes a novel signature for prediction in gastric cancer. World J Gastrointest Oncol. 2023;15(7):1215–1226. doi:10.4251/wjgo.v15.i7.1215
35. Liu Z, Zhang X, Zhang H, et al. Multi-omics analysis reveals intratumor microbes as immunomodulators in colorectal cancer. Microbiol Spectr. 2023;11:e0503822.
36. Ding Y, Yang X, Han X, et al. Ferroptosis-related gene expression in the pathogenesis of preeclampsia. Front Genet. 2022;13:927869. doi:10.3389/fgene.2022.927869
37. Ritchie ME, Phipson B, Wu D, et al. limma powers differential expression analyses for RNA-sequencing and microarray studies. Nucleic Acids Res. 2015;43(7):e47. doi:10.1093/nar/gkv007
38. Yu G, Wang LG, Han Y, He QY. clusterProfiler: an R package for comparing biological themes among gene clusters. OMICS. 2012;16(5):284–287. doi:10.1089/omi.2011.0118
39. Friedman J, Hastie T, Tibshirani R. Regularization paths for generalized linear models via coordinate descent. J Stat Softw. 2010;33:1–22. doi:10.18637/jss.v033.i01
40. Robin X, Turck N, Hainard A, et al. pROC: an open-source package for R and S+ to analyze and compare ROC curves. BMC Bioinf. 2011;12:77. doi:10.1186/1471-2105-12-77
41. Kim DK, Park MH, Chang DY, et al. MBP-positive and CD11c-positive cells are associated with different phenotypes of Korean patients with non-asthmatic chronic rhinosinusitis. PLoS One. 2014;9(10):e111352. doi:10.1371/journal.pone.0111352
42. Hulse KE, Stevens WW, Tan BK, Schleimer RP. Pathogenesis of nasal polyposis. Clin Exp Allergy. 2015;45:328–346. doi:10.1111/cea.12472
43. Alam J, Yazdanpanah G, Ratnapriya R, et al. Single-cell transcriptional profiling of murine conjunctival immune cells reveals distinct populations expressing homeostatic and regulatory genes. Mucosal Immunol. 2022;15:620–628. doi:10.1038/s41385-022-00507-w
44. Monedero P, Paz-Martín D, Barturen F, et al. Reply to the letter: ”Intensive care in Spain” A. Suárez-de-la-Rica, G. Aguilar and E. Maseda. Rev Esp Anestesiol Reanim. 2021;68(7):430–431. doi:10.1016/j.redar.2020.06.002
45. Lin X, Zhuang X, Li C, Wang X. Interactions between dendritic cells and T lymphocytes in pathogenesis of nasal polyps. Exp Ther Med. 2018;15:5167–5172. doi:10.3892/etm.2018.6128
46. Svajger U, Rozman PJ. synergistic effects of interferon-gamma and vitamin D(3) signaling in induction of ILT-3(high)PDL-1(high) tolerogenic dendritic cells. Front Immunol. 2019;10:2627. doi:10.3389/fimmu.2019.02627
47. Li JG, Du YM, Yan ZD, et al. CD80 and CD86 knockdown in dendritic cells regulates Th1/Th2 cytokine production in asthmatic mice. Exp Ther Med. 2016;11:878–884. doi:10.3892/etm.2016.2989
48. Sun L, Zhang W, Zhao Y, et al. Dendritic cells and T cells, partners in atherogenesis and the translating road ahead. Front Immunol. 2020;11:1456. doi:10.3389/fimmu.2020.01456
49. Liu X, Wang Y, Lu H, et al. Genome-wide analysis identifies NR4A1 as a key mediator of T cell dysfunction. Nature. 2019;567:525–529. doi:10.1038/s41586-019-0979-8
50. Yu HZ, Zhu BQ, Zhu L, Li S, Wang LM. NR4A1 agonist cytosporone B attenuates neuroinflammation in a mouse model of multiple sclerosis. Neural Regen Res. 2022;17:2765–2770. doi:10.4103/1673-5374.339492
51. Heidbreder K, Sommer K, Wiendl M, et al. Nr4a1-dependent non-classical monocytes are important for macrophage-mediated wound healing in the large intestine. Front Immunol. 2022;13:1040775. doi:10.3389/fimmu.2022.1040775
52. de Almeida M S, Taladriz-Blanco P, Drasler B, et al. Cellular uptake of silica and gold nanoparticles induces early activation of nuclear receptor NR4A1. Nanomaterials. 2022;12: doi:10.3390/nano12040690
53. Spitz MR, Gorlov IP, Amos CI, et al. Variants in inflammation genes are implicated in risk of lung cancer in never smokers exposed to second-hand smoke. Cancer Discov. 2011;1:420–429. doi:10.1158/2159-8290.CD-11-0080
54. Kizuka Y, Kitazume S, Sato K, Taniguchi N. Clec4g (LSECtin) interacts with BACE1 and suppresses abeta generation. FEBS Lett. 2015;589:1418–1422. doi:10.1016/j.febslet.2015.04.060
55. Huang YW, Meng XJ. Identification of a porcine DC-SIGN-related C-type lectin, porcine CLEC4G (LSECtin), and its order of intron removal during splicing: comparative genomic analyses of the cluster of genes CD23/CLEC4G/DC-SIGN among mammalian species. Dev Comp Immunol. 2009;33:747–760. doi:10.1016/j.dci.2008.12.007
56. Torinsson Naluai A, Ostensson M, Fowler PC, et al. Transcriptomics unravels molecular changes associated with cilia and COVID-19 in chronic rhinosinusitis with nasal polyps. Sci Rep. 2023;13:6592. doi:10.1038/s41598-023-32944-3
57. Etzerodt A, Moestrup SK. CD163 and inflammation: biological, diagnostic, and therapeutic aspects. Antioxid Redox Signal. 2013;18:2352–2363. doi:10.1089/ars.2012.4834
58. Guo L, Akahori H, Harari E, et al. CD163+ macrophages promote angiogenesis and vascular permeability accompanied by inflammation in atherosclerosis. J Clin Invest. 2018;128:1106–1124. doi:10.1172/JCI93025
59. Bourdely P, Anselmi G, Vaivode K, et al. Transcriptional and functional analysis of CD1c(+) human dendritic cells identifies a CD163(+) subset priming CD8(+)CD103(+) T cells. Immunity. 2020;53:335–352.e338. doi:10.1016/j.immuni.2020.06.002
60. Li L, Liu Y, Chen HZ, et al. Impeding the interaction between nur77 and p38 reduces LPS-induced inflammation. Nat Chem Biol. 2015;11:339–346. doi:10.1038/nchembio.1788
61. Ratajczak W, Atkinson SD, Kelly C. The TWEAK/Fn14/CD163 axis-implications for metabolic disease. Rev Endocr Metab Disord. 2022;23:449–462. doi:10.1007/s11154-021-09688-4
62. Lawrence T. The nuclear factor NF-kappaB pathway in inflammation. Cold Spring Harb Perspect Biol. 2009;1:a001651.
63. Yoshida O, Kimura S, Dou L, et al. DAP12 deficiency in liver allografts results in enhanced donor DC migration, augmented effector T cell responses and abrogation of transplant tolerance. Am J Transplant. 2014;14:1791–1805. doi:10.1111/ajt.12757
64. Chen J, Lopez-Moyado IF, Seo H, et al. NR4A transcription factors limit CAR T cell function in solid tumours. Nature. 2019;567:530–534. doi:10.1038/s41586-019-0985-x
65. Shan T, Chen S, Chen X, et al. M2‑TAM subsets altered by lactic acid promote T‑cell apoptosis through the PD‑L1/PD‑1 pathway. Oncol Rep. 2020;44:1885–1894. doi:10.3892/or.2020.7767
66. Tang L, Yang J, Liu W, et al. Liver sinusoidal endothelial cell lectin, LSECtin, negatively regulates hepatic T-cell immune response. Gastroenterology. 2009;137:
67. Lee SH, Han MS, Lee TH, et al. Hydrogen peroxide attenuates rhinovirus-induced anti-viral interferon secretion in sinonasal epithelial cells. Front Immunol. 2023;14:1086381. doi:10.3389/fimmu.2023.1086381
68. Gonzalez-Rubio J, Navarro-Lopez C, Lopez-Najera E, et al. Cytokine Release Syndrome (CRS) and nicotine in COVID-19 patients: trying to calm the storm. Front Immunol. 2020;11:1359. doi:10.3389/fimmu.2020.01359
 © 2024 The Author(s). This work is published and licensed by Dove Medical Press Limited. The
full terms of this license are available at https://www.dovepress.com/terms
and incorporate the Creative Commons Attribution
- Non Commercial (unported, 3.0) License.
By accessing the work you hereby accept the Terms. Non-commercial uses of the work are permitted
without any further permission from Dove Medical Press Limited, provided the work is properly
attributed. For permission for commercial use of this work, please see paragraphs 4.2 and 5 of our Terms.
© 2024 The Author(s). This work is published and licensed by Dove Medical Press Limited. The
full terms of this license are available at https://www.dovepress.com/terms
and incorporate the Creative Commons Attribution
- Non Commercial (unported, 3.0) License.
By accessing the work you hereby accept the Terms. Non-commercial uses of the work are permitted
without any further permission from Dove Medical Press Limited, provided the work is properly
attributed. For permission for commercial use of this work, please see paragraphs 4.2 and 5 of our Terms.