Back to Journals » Journal of Pain Research » Volume 15
Characterization of Ferroptosis-Related Molecular Subtypes with Immune Infiltrations in Neuropathic Pain
Authors Bi YH, Wang J, Guo ZJ ![]() , Jia KN
, Jia KN ![]()
Received 16 August 2022
Accepted for publication 18 October 2022
Published 22 October 2022 Volume 2022:15 Pages 3327—3348
DOI https://doi.org/10.2147/JPR.S385228
Checked for plagiarism Yes
Review by Single anonymous peer review
Peer reviewer comments 2
Editor who approved publication: Professor E Alfonso Romero-Sandoval
Yan-Hua Bi,1 Jia Wang,1 Zhi-Jun Guo,2 Kai-Ning Jia3
1Neurosurgery Department, Huabei Petroleum Administration Bureau General Hospital, Renqiu, People’s Republic of China; 2Medical Imaging Department, Huabei Petroleum Administration Bureau General Hospital, Renqiu, People’s Republic of China; 3Clinical Trials Center, Huabei Petroleum Administration Bureau General Hospital, Renqiu, People’s Republic of China
Correspondence: Kai-Ning Jia, Clinical Trials Center, Huabei Petroleum Administration Bureau General Hospital, Renqiu, 062550, People’s Republic of China, Email [email protected]
Background: Neuropathic pain (NP) caused by a lesion or disease of the somatosensory nervous system is a common chronic pain condition that has a major impact on quality of life. However, NP pathogenesis remains unclear. The purpose of this study was to identify differentially expressed genes (DEGs) and specific and meaningful gene targets for the diagnosis and treatment of NP.
Methods: Data from rat spinal nerve ligations and the sham group were downloaded from the Gene Expression Omnibus (GEO) database. Based on the single-sample gene set enrichment analysis (ssGSEA) method, 29 immune gene sets were identified in each sample, and these samples were correlated with the immune infiltration phenotype. LASSO regression modeling was used to screen key genes to identify diagnostic gene markers. According to GSEA and GSVA, NP is concentrated in a large number of immune-related pathways and genes. Additionally, we used the DGIdb database and correlation test to construct gene-drug and transcription factor interaction networks for differentially expressed genes relevant to NP-related ferroptosis. We used WGCNA to identify gene co-expression modules of NP, and explored the relationship between gene networks and phenotypes. Finally, we crossed core genes with diagnostic markers and analyzed gene correlation with molecular subtypes and immune cells.
Results: We identified 224 DEGs, including 191 upregulated genes and 33 downregulated genes. APC co-stimulation, CCR, cytolytic activity, humid-promoting, neutrophils, NK cells, and RGS4, CXCL2, DRD4 and other 7 genes related to ferroptosis were involved in NP development. Key genes of RGS4 and HIF− 1 signaling pathway were screened.
Conclusion: This study contributes to our understanding of the neuroimmune mechanism of neuropathic pain, provides a reference for NP biomarkers and drug targets. Ferroptosis may be the next research direction to explore NP mechanism.
Keywords: neuropathic pain, regulator of G protein signaling 4, RGS4, immune infiltration, ferroptosis
Introduction
Neuropathic pain (NP) is one of the most debilitating chronic pain syndromes worldwide. NP is chronic pain caused by lesions or disorders of the somatosensory nervous system, manifesting as spontaneous pain, hyperalgesia, and abnormal pain.1 This disease is refractory and has a complex pathogenesis that affects the quality of life of many patients. Currently, there is no effective method for relieving NP.2 To develop treatments, it is important to identify targets and their underlying disease-related mechanisms. However, the specific processes that lead to NP remain unclear.
One such process that can contribute to NP development and persistence is ferroptosis. The modes of cell death are mainly divided into non-programmed death and programmed death. Non-programmed cell death is caused by the direct action of physical and chemical factors and cannot be regulated, whereas programmed cell death can be regulated.3 As a programmed death, the most important feature of ferroptosis is the peroxidation of intact cell membrane lipids, which leads to the deposition of lethal amounts of reactive oxygen species (ROS). This process is iron-dependent and be inhibited by iron chelatorsm.4 Iron is an important cofactor in neurons and other metabolically active cytokines. Mitochondrial function and axonal transport require the fine regulation of iron.5,6 Ferroptosis has a complex regulatory network, and the process of cell death is accompanied by the accumulation of a large amount of iron ions.7 Neuronal ion content is elevated during neuropathy, and materials containing high iron ion content in the damaged nervous system may increase the risk of ferroptosis.8 Previous studies indicate that ferroptosis contributes to NP development, but therapeutic targets and diagnostic markers are limited. Further research can identify more reliable therapeutic targets and diagnostic markers.
Recently, transcriptome sequencing technology combined with bioinformatics analysis has been widely used to identify genetic changes, which helps to define the role of differentially expressed genes (DEGs) and functional pathways involved in conditions such as NP.9 In this study, we used bioinformatics to comprehensively analyze the gene expression data of neuropathic pain models from the Gene Expression Omnibus (GEO) database. This study aimed to identify new therapeutic targets and markers for the early diagnosis of NP, and to provide insights into the underlying pathological mechanisms of neuropathic pain.
Materials and Methods
Data Acquisition
Gene expression profiling data of neurologic pain tissues were obtained from the Gene Expression Omnibus (GEO) database,10 including GSE24982,11 GSE30691,12,13 and GSE89224.14 The GSE24982 (GPL1355 [Rat230_2] Affymetrix Rat Genome 230 2.0 Array) dataset has 40 samples, including 20 spinal nerve ligation (SNL) simples, 20 sham control samples. The GSE30691 (GPL85 [RG_U34A] Affymetrix Rat Genome U34 Array) dataset contained 56 samples, including chronic contractile injury (CCI), spinal cord nerve ligation (SNL, Ch) and sham controls (SH), There were 11 in the Ch group, 9 in the ChSH group. The GSE89224 (GPL6885 Illumina MouseRef-8 v2.0 expression beadchip) dataset included 40 samples. There were 7 samples in sham group. There were three in groups: 8h, 16h, 24h, 48h, 72h, 5 days, 6 days, 7 days, and 8 days after dorsal root ganglion injury, and two in dorsal root ganglion injury after 4, 9, and 10 days respectively (Table 1).
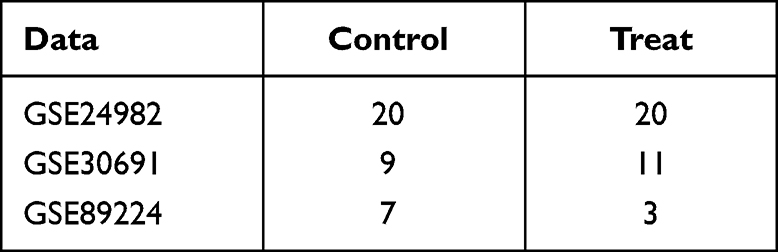 |
Table 1 Data Information Data Sheet |
Analysis of Differentially Expressed Genes
We first used the ComBat function15 of the R software “sva” package, including data background adjustment, normalization, merging, and further filtering, followed by differentially expressed genes screened by the ‘limma’ package16 for NP and sham control groups. We set logFC>0.817 for the upregulated and logFC<-0.8 for downregulated genes. P value<0.05 was considered statistically significant.
GSEA and GSVA Enrichment Analysis
Gene Set Enrichment Analysis (GSEA) was used to assess gene distribution trends from a predefined gene set for phenotype correlation to determine phenotype contribution.18 We obtained the “c2.kegg.v7.4. symbols” and “c5.go. The v7.4. symbols” gene set from the MSigDB database.19 These two gene sets were separately used for GSEA in NP and sham control groups by using the “clusterProfiler” R package,20 P-value <0.05 was considered statistically significant.19
Gene Set Variation Analysis (GSVA), is a nonparametric unsupervised analysis method that is used to evaluate the gene set enrichment results of the chip nuclear transcriptome. We mainly assessed whether different metabolic pathways are enriched among different samples by transforming gene set expression matrices. We respond to the “c2.kegg.v7.4. symbols” and “c5.go.The v7.4. symbols” gene set was analyzed for GSVA in neural pain and shams and for GSVA enrichment analysis using the “GSVA” R package.21 This analysis was visualized using the “heatmap” package.
Analysis of Immune Infiltration and Immune Characterized Subtype Construction
Single Sample Gene Set Enrichment Analysis (ssGSEA) is a method that has been used in GSEA because it analyzes the gene sets within one sample, We obtained 29 immune-related gene sets from He et al.22 We assessed the immune infiltration level in each sample using the expression of immune cell-specific marker genes. The ssGSEA analysis was implemented using the R program “GSVA” package. Immune infiltration analysis was performed on NP and sham control groups using the ‘limma’ package,16 which identified immune cells that are differentially enriched between NP and sham control groups. It also calculated the Pearson correlation coefficient between gene expression levels and immune cells to assess any relationship between genes and immune infiltration levels.
Based on the results of the ssGSEA algorithm, we used the “sparcl” package to perform NP and sham control group clustering analysis, separating the samples by the immune content. To validate of this grouping, we performed principal component analysis (PCA) of all genes expression levels, and the results were visualized by the “ggplot2” package. We also determined the DEGs between 29 immune cells between different groups and visualized it by the “heatmap” package.
Bioinformatics Analysis of Differentially Expressed Ferroptosis-Related Genes
We intersected NP and sham control group, DEGs and ferroptosis-related genes to identify those that may play a role in NP. We used the R packages, “clusterProfiler”20 for GO functional annotation analysis and the “GOSemSim”23 for Friends analysis. Lastly, we used the DOSE package24 for the DO analysis of these potential target genes. P value<0.05 was considered statistically significant.
LASSO Algorithm for Diagnostic Markers and Model Validation
We performed LASSO regression analysis using the “glmnet” package25 on the ferroptotic DEGs. The LASSO algorithm reduces the high-latitude data dimensionality and explains data characteristics using a model with fewer variables.26 We used ten-fold cross-validation to avoid overfitting the models to the training cohort constructs. Lastly, we validated the model gene expression in the GSE89224 dataset and the experimental group at the 16 h.
WGCNA and Gene Enrichment Key Module Analysis
We constructed a weighted correlation network analysis (WGCNA) package27 in the R program to determined their clustering module28 according to clinicopathological features and significantly different immune cells. Module characteristic genes and clinicopathological features correlations were calculated to identify highly correlated modules. The screening conditions were gene significance (GS) > 0.5 and module membership (MM) > 0.7.
The Kyoto Encyclopedia of Genes and Genomes (KEGG) is a widely used for storing information about genomes, biological pathways, diseases, and drugs.29 We used the “clusterProfiler” R package15 for GO functional annotation analysis and KEGG pathway enrichment analysis for module genes. The DOSE20 package was used to analyze the DO of these target genes. P value < 0.05 was considered to be statistically significant.
Constructing a Diagnostic Marker Gene Interaction Network
To determine the relationships between diagnostic markers and proteins, drugs, transcription factors, and module genes, we used FunRich (V 3.1.3) software to obtain diagnostic marker - protein interactions and visualized these in Cytoscape (version 3.9.0).30,31 We used the DGIdb to predict compounds or drugs with diagnostic marker interactions32 (Drug-Gene Interaction database, https://dgidb.org/). The Diagnostic marker genes and Transcription Factors (TFs) and module genes were tested separately to obtain diagnostic marker - TFs relationship pairs and diagnostic marker-gene relationship pairs with a correlation coefficient > 0.4 and p<0.05. An interaction network of diagnostic markers with drugs, TFs, and module genes was also constructed in Cytoscape (version 3.9.0).
Construction of Molecular Subtypes Associated with Neuropathological Pain
We used the “hclust function” of the “sparcl” package in R program to cluster SNL and sham control DEGs, dividing samples into different groups by the content of immune cells. To determine grouping validity, we performed PCA of all genes expression levels, and visualized the results using the “ggplot2” package.
Key Gene Identification and Corresponding Functional Analysis
We intersected the module signature genes in WGCNA with diagnostic genes to identify the key genes in NP. To determine whether the key genes played a role in neuralgia through immune cell infiltration, we tested these genes with the constructed immune characteristic subtypes and different levels of immune cell infiltration.
Statistical Analysis
All data calculations and statistical analyses were performed using the R program (https://www.r-project.org/, version 4.0.2). For comparison of two consecutive groups of continuous variables, statistical significance of normally distributed variables was estimated by using the independent Student’s t-test, and differences between non-normally distributed variables were analyzed using the Mann–Whitney U-test (i e, Wilcoxon rank sum test). All Student’s t-test were two-sided, with P<0.05 and FDR<0.25 were considered statistically significant.
Results
Data Retrieval and Analysis Process
We prepared a graphical summary for the overall process used to identify key NP-related genes (Figure 1), and prepared a table correlating these key genes with molecular subtypes and immune cells.
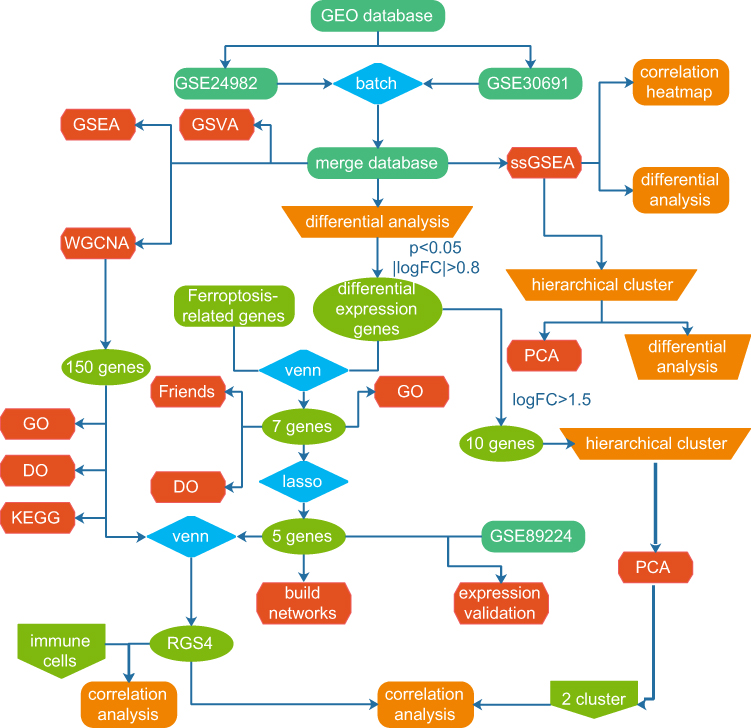 |
Figure 1 Flow chart. In this study, we compared the gene expression and immune infiltration characteristics in spinal nerve ligation and sham tissues. Predictive models and interaction networks for module genes, small molecules, and transcription factors were constructed. Molecular subtype analysis to select diagnostic markers was performed. |
Differential Genes Between Spinal Nerve Ligation and Sham Tissues
To analyze the effect of gene expression values on the SNL tissues relative to the sham tissue, we first performed differential gene expression analysis (Figure 2A and B) using the “limma” package on the integrated gene expression matrix (Figure 2C and D). We identified 224 DEGs in the spinal nerve ligation and sham group comparisons, including 191 upregulated genes and 33 downregulated genes.
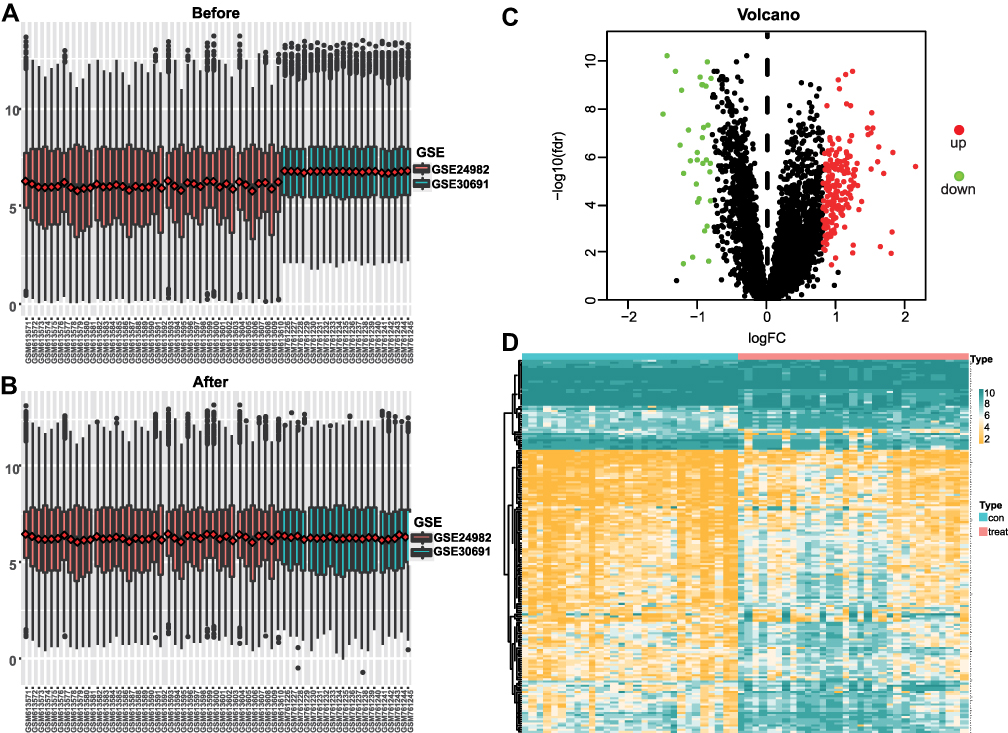 |
Figure 2 Neuralgia expression matrix data integration and differential gene screening. (A) Global expression values of genes before correction for 2 GEO datasets. (B) Global expression values of corrected genes in 2 GEO datasets. (C) Differentially expressed volcano map. Highly expressed genes are in red and low expressed genes are in green. (D) Heatmap of differentially expressed genes. |
GSEA and GSVA
To identify functional differences between spinal nerve ligation and normal tissues, GSEA and GSVA enrichment analyses were performed on both sample groups (Figure 3, Tables 2 and 3). The main biological processes enriched in SNL tissue included actin filament organization, immune activation responses, biosynthesis, ATP metabolism, and axon development (Figure 3A and B). The main KEGG pathways enriched in SNL tissues included those related to degenerative neurological diseases, cardiac muscle contraction and oxidative phosphorylation (Figure 3C and D). The volcano plot of the GSVA GO pathway showed 8 upregulated and 10 downregulated pathway with significant differences in the experimental group (Figure 3E). Based on GSVA enrichment results, the main biological processes enriched in the SNL tissues, including platelet-derived growth factor receptor binding, chemokine binding, regulation of neutrophil chemotaxis, peptidase activator activity, fibronectin binding, histone acetyltransferase binding, regulation of T helper 1 type immune response, and peptide cross-linking (Figure 3F). The volcano map of KEGG pathway of the GSVA showed 9 pathways with significant differences, of which 5 were downregulated and 4 were upregulated in the experimental group (Figure 3G). As before, immune and autoimmune responses were among the enriched pathways (Figure 3H).
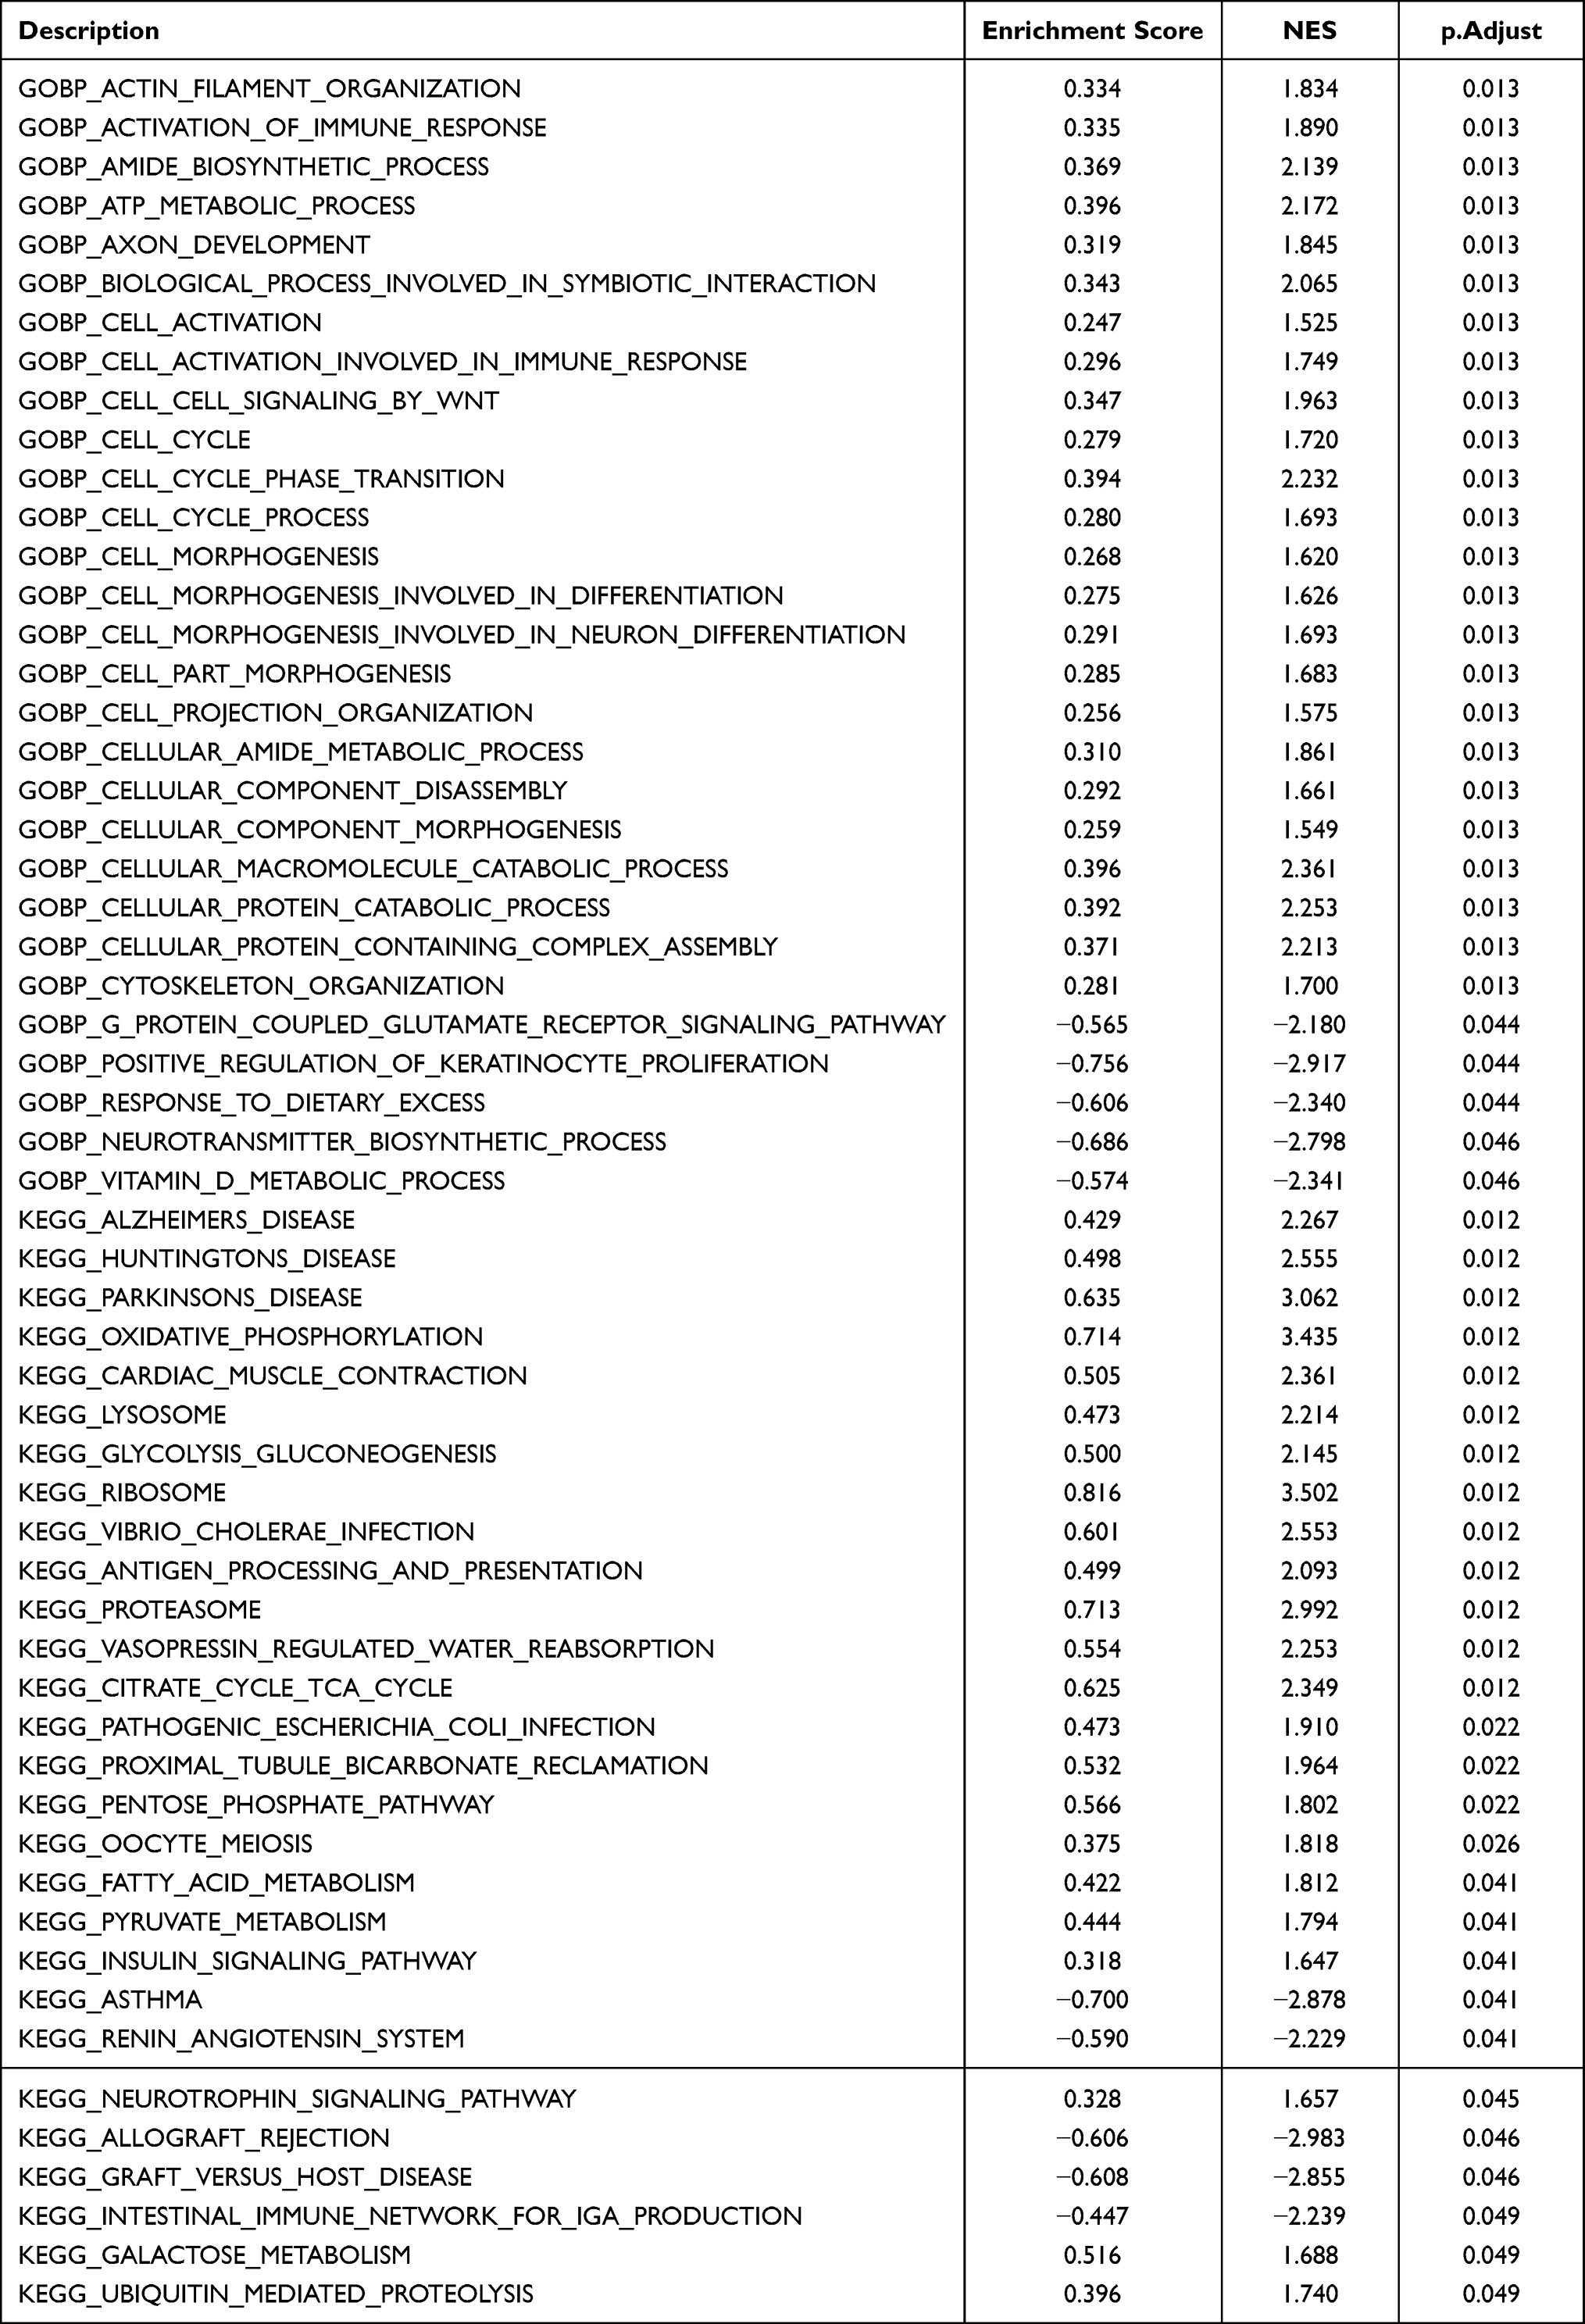 |
Table 2 GSEA Analysis |
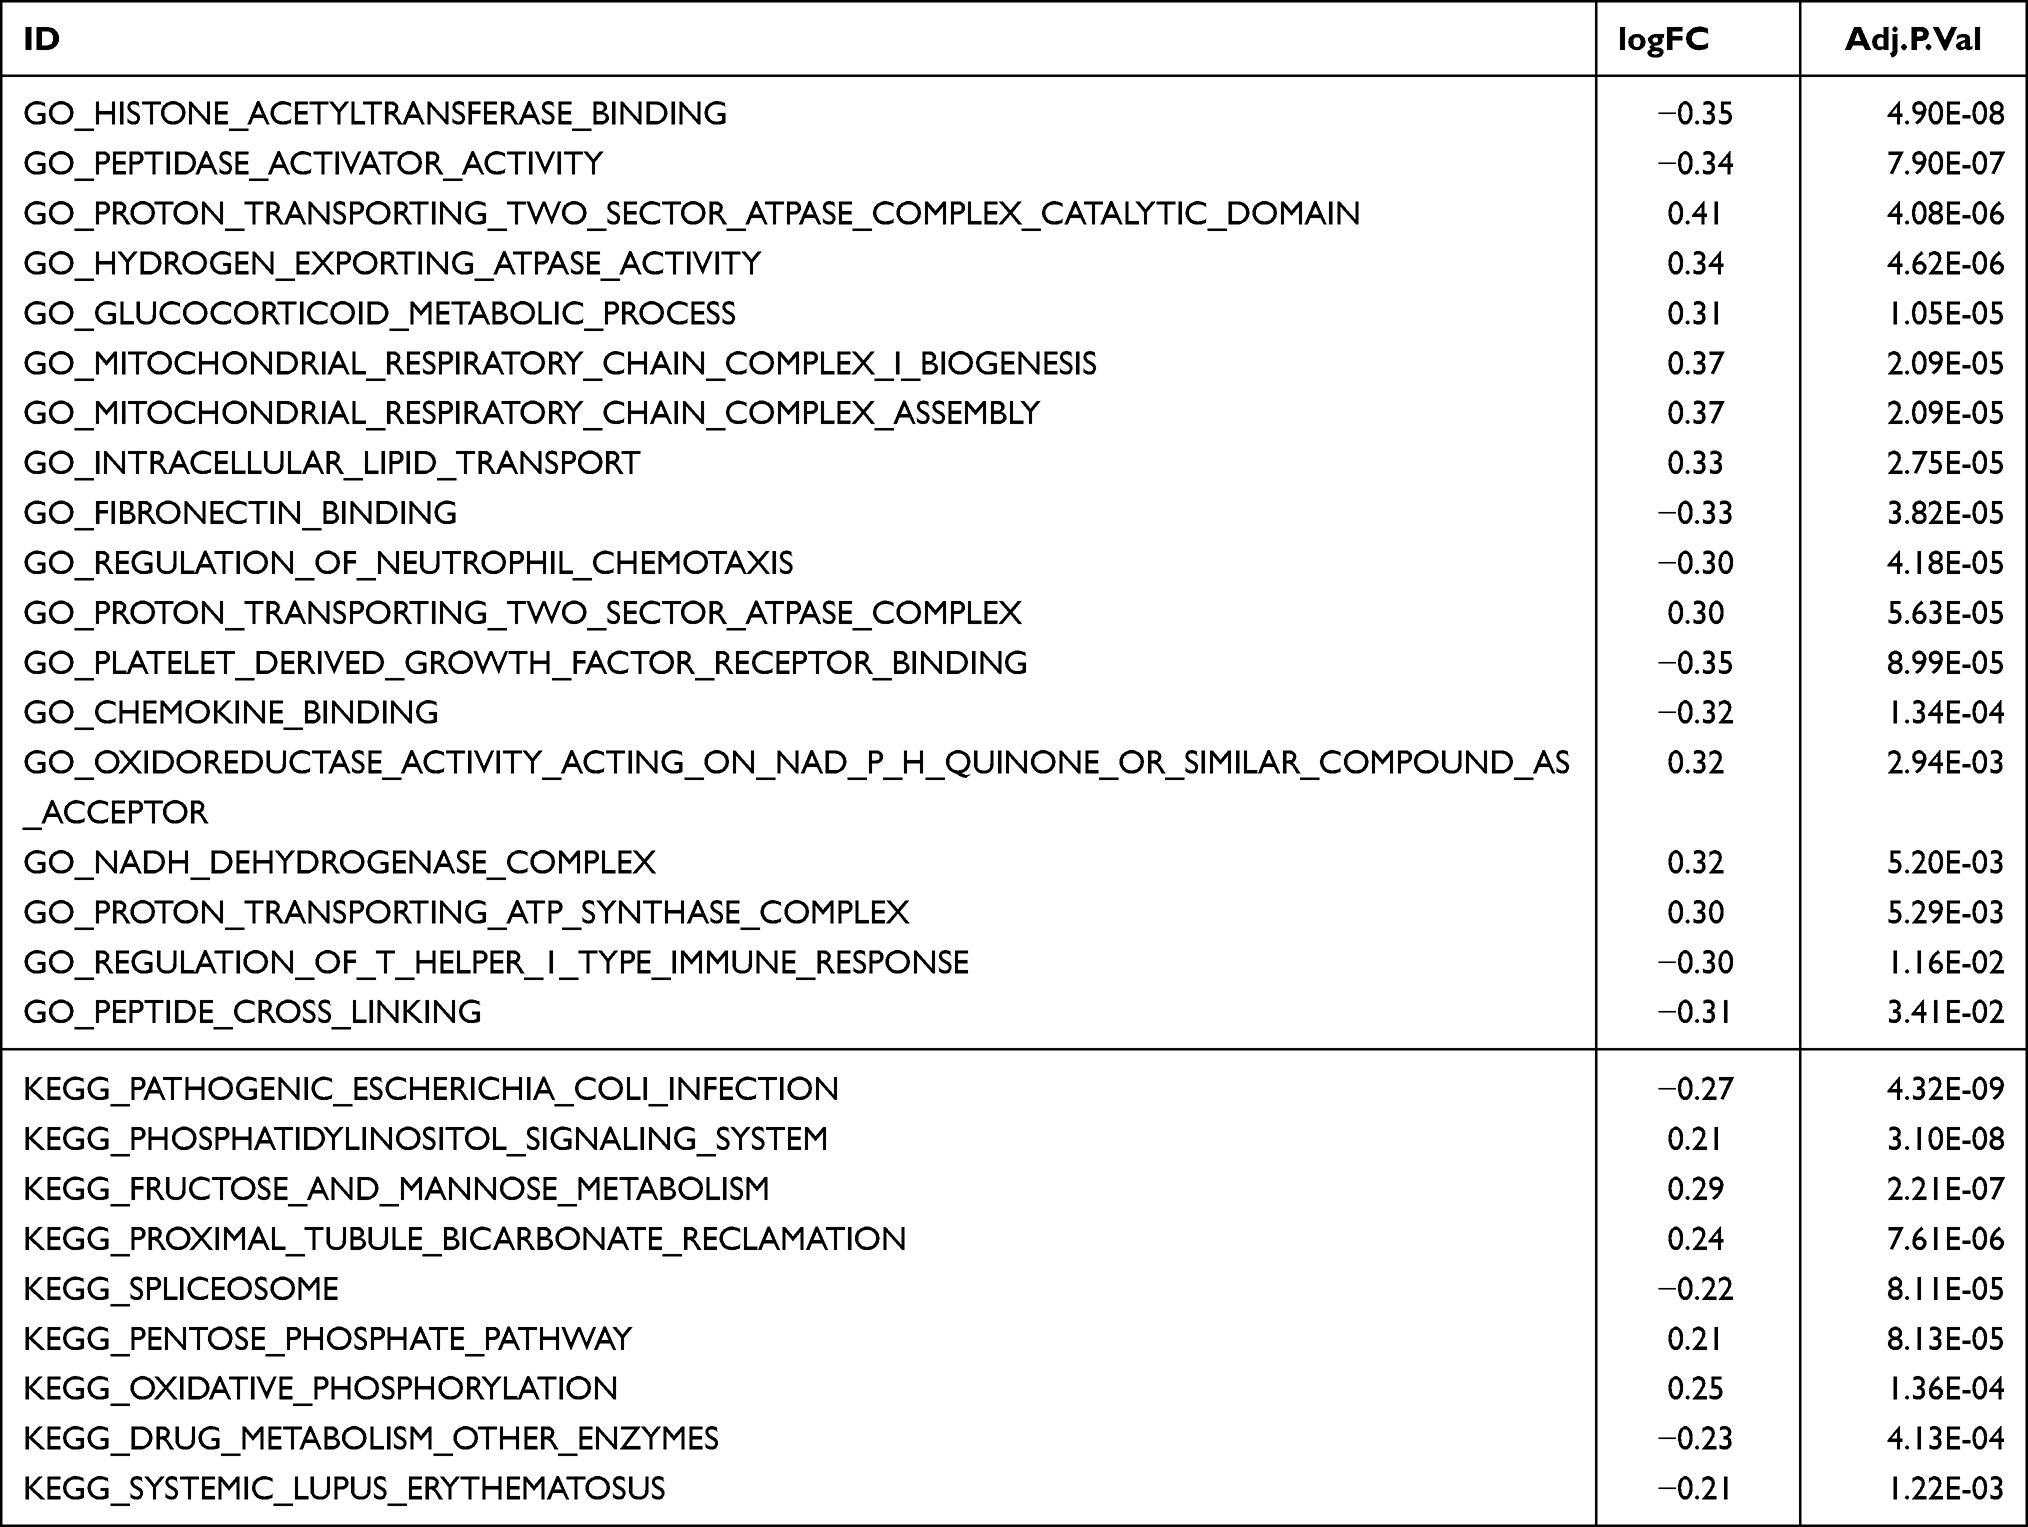 |
Table 3 GSVA Analysis |
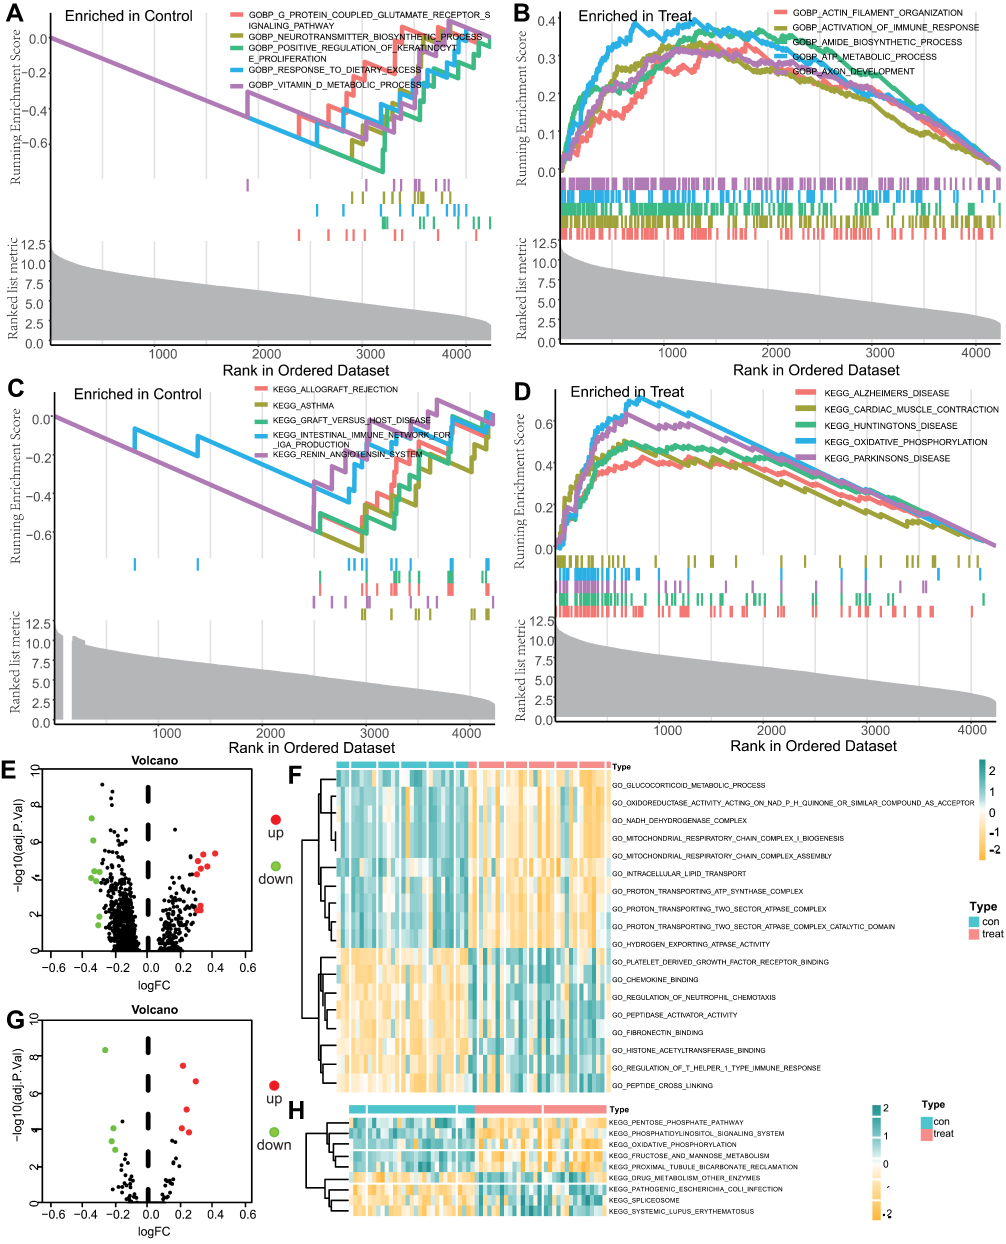 |
Figure 3 GSEA and GSVA enrichment analysis. (A–D) Results of gene set enrichment analysis (GSEA). (E–H): results of gene set variation analysis (GSVA). (E and G) shows the differential pathway volcano. (F and H) show the differential pathway heatmaps. The sham group is in green and the experimental group is in red. |
Analysis of Immune Cell Infiltration
To analyze the variability in immune infiltration between SNL and sham control tissues, we calculated 29 immune cells infiltration levels in both tissues using ssGSEA. Correlation analysis indicated that CCR was strongly associated with most immune cells (Figure 4A). Immune-related pathways and 14 immune cells varied significantly in the SNL and sham tissues (Figure 4B and C), including APC co-stimulation, CCR, Cytolytic activity, Inflammation-promoting, Neutrophils, NK cells, Parainflammation, T helper cells, Tfh, Th1 cells, Th2 cells, TIL, T cells regulatory (Tregs) and Type II IFN response cells (p<0.001). These 8 immune cells were used for subsequent analysis.
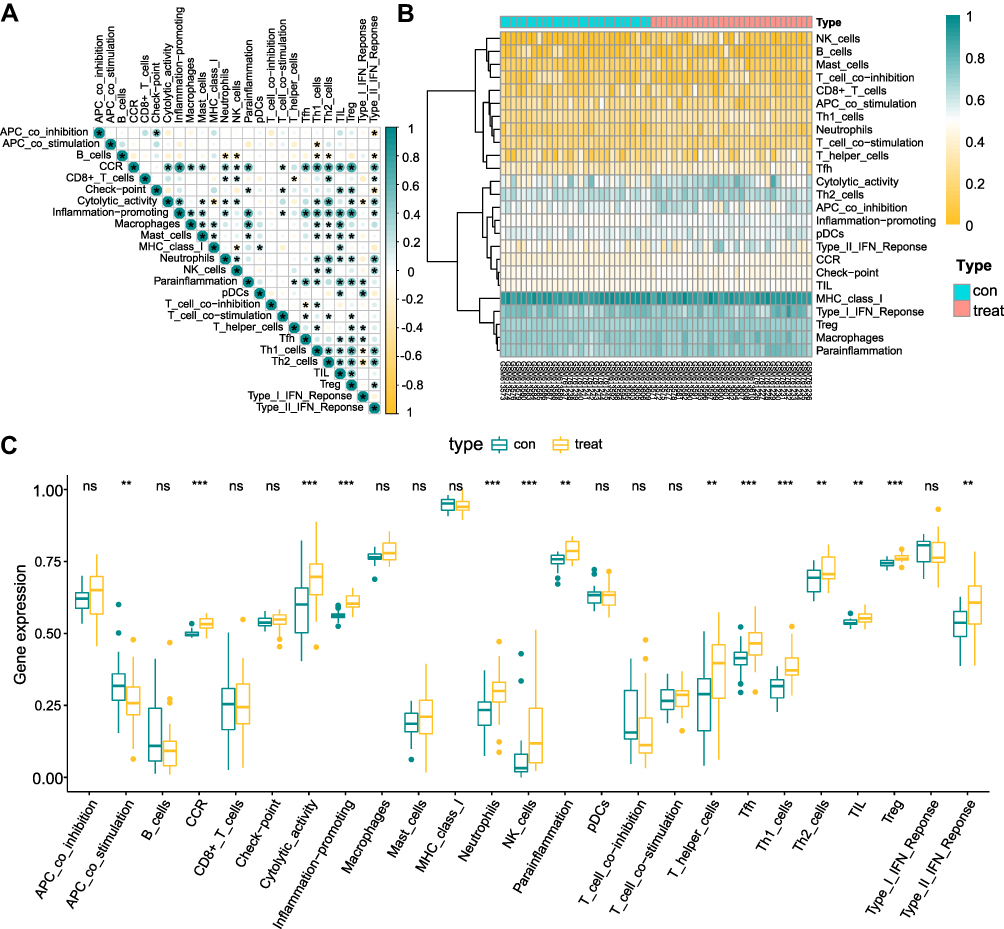 |
Figure 4 Analysis of immune cell infiltration. (A) Correlation of 29 immune cell infiltrations in spinal nerve ligation and sham tissues. Yellow is a negative correlation, green is a positive correlation. (B and C) Differential analysis of 29 immune cells infiltrations between spinal nerve ligation and sham tissues. *p <0.05, **p <0.01, ***p <0.001. |
Identifying Key Tissue Immune Characteristics
We performed hierarchical clustering of the SNL and sham tissues using the expression of 29 immune cell gene sets. PCA showed higher separation quality (Figure 5B) by dividing all samples into two different subtypes (1: n=38; 2: n=22, Figure 5A). Further differential analysis showed that APC co-stimulation, Cytolytic activity, Neutrophils, Type II IFN response and Th2 cells were significantly differentially expressed across the different groups (p < 0.001) (Figure 5C and D).
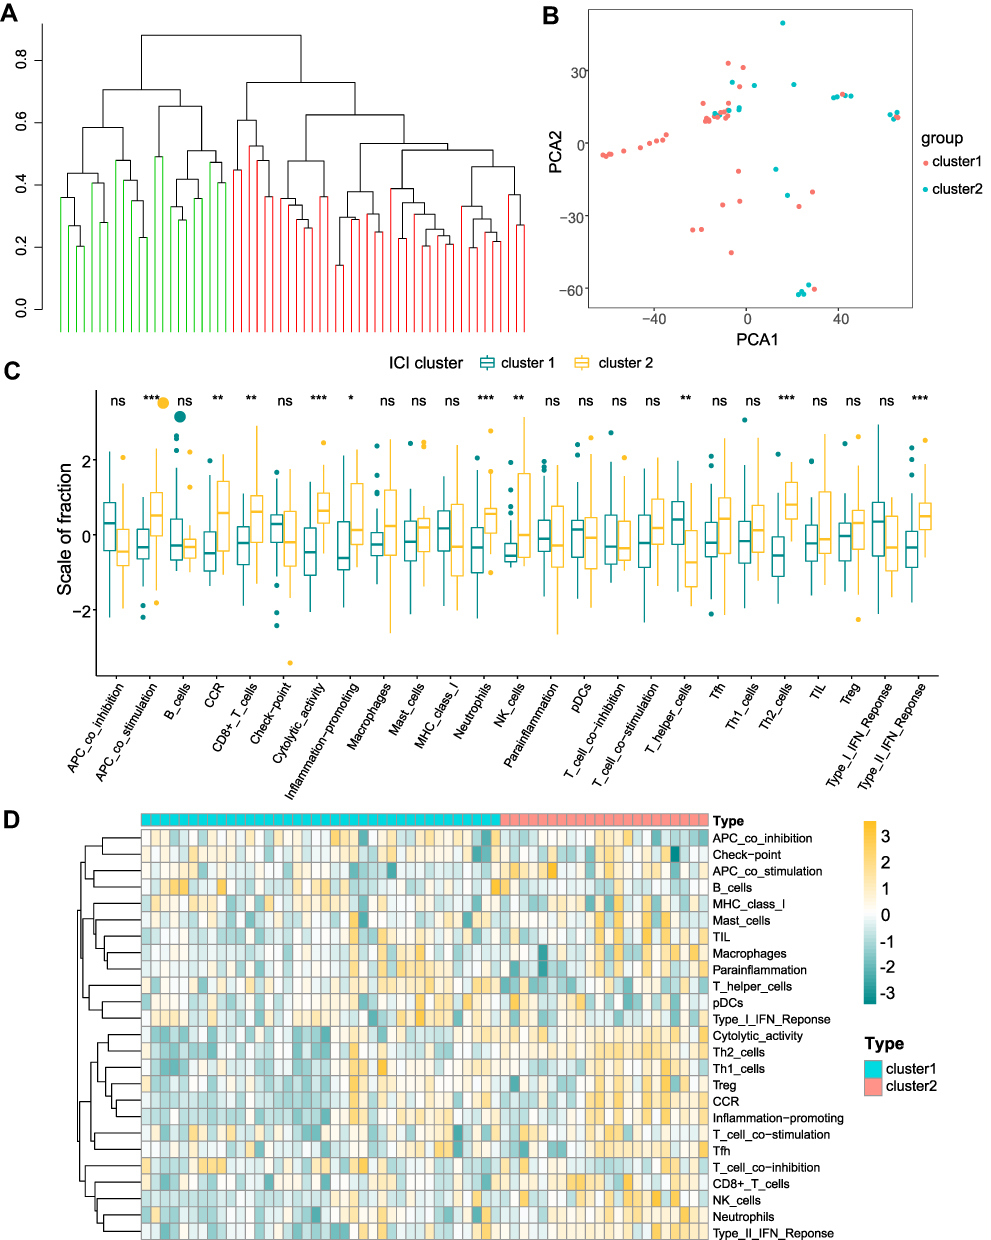 |
Figure 5 Constructing immune subtype signatures. (A) Groups based on the clustering of spinal nerve ligation and sham samples from 29 immune cells. (B) Principal Component Analysis (PCA) in cluster 1 (red) and cluster 2 (blue). (C and D) Analysis of immune cell differences between different clusters, cluster 1 (green) and cluster 2 (yellow). *p <0.05, **p <0.01, ***p <0.001. |
Functional Enrichment Analysis of Differentially Expressed Genes Associated with Ferroptosis
To examining the effect of ferroptosis genes on SNL tissues, we intersected ferroptosis genes with NP DEGs and obtained seven ferroptosis-related genes (Figure 6A). Additionally, we performed functional enrichment analyses for these genes (Figure 6B and C, Tables 4 and 5). The intersecting genes in Figure 6B were related to neurotransmitter modulation and uptake levels. The intersecting genes in Figure 6C were linked to neurological disorders. According to the Friends analysis, TP63, MT3, and RGS4 may play a greater role in the above pathways (Figure 6D).
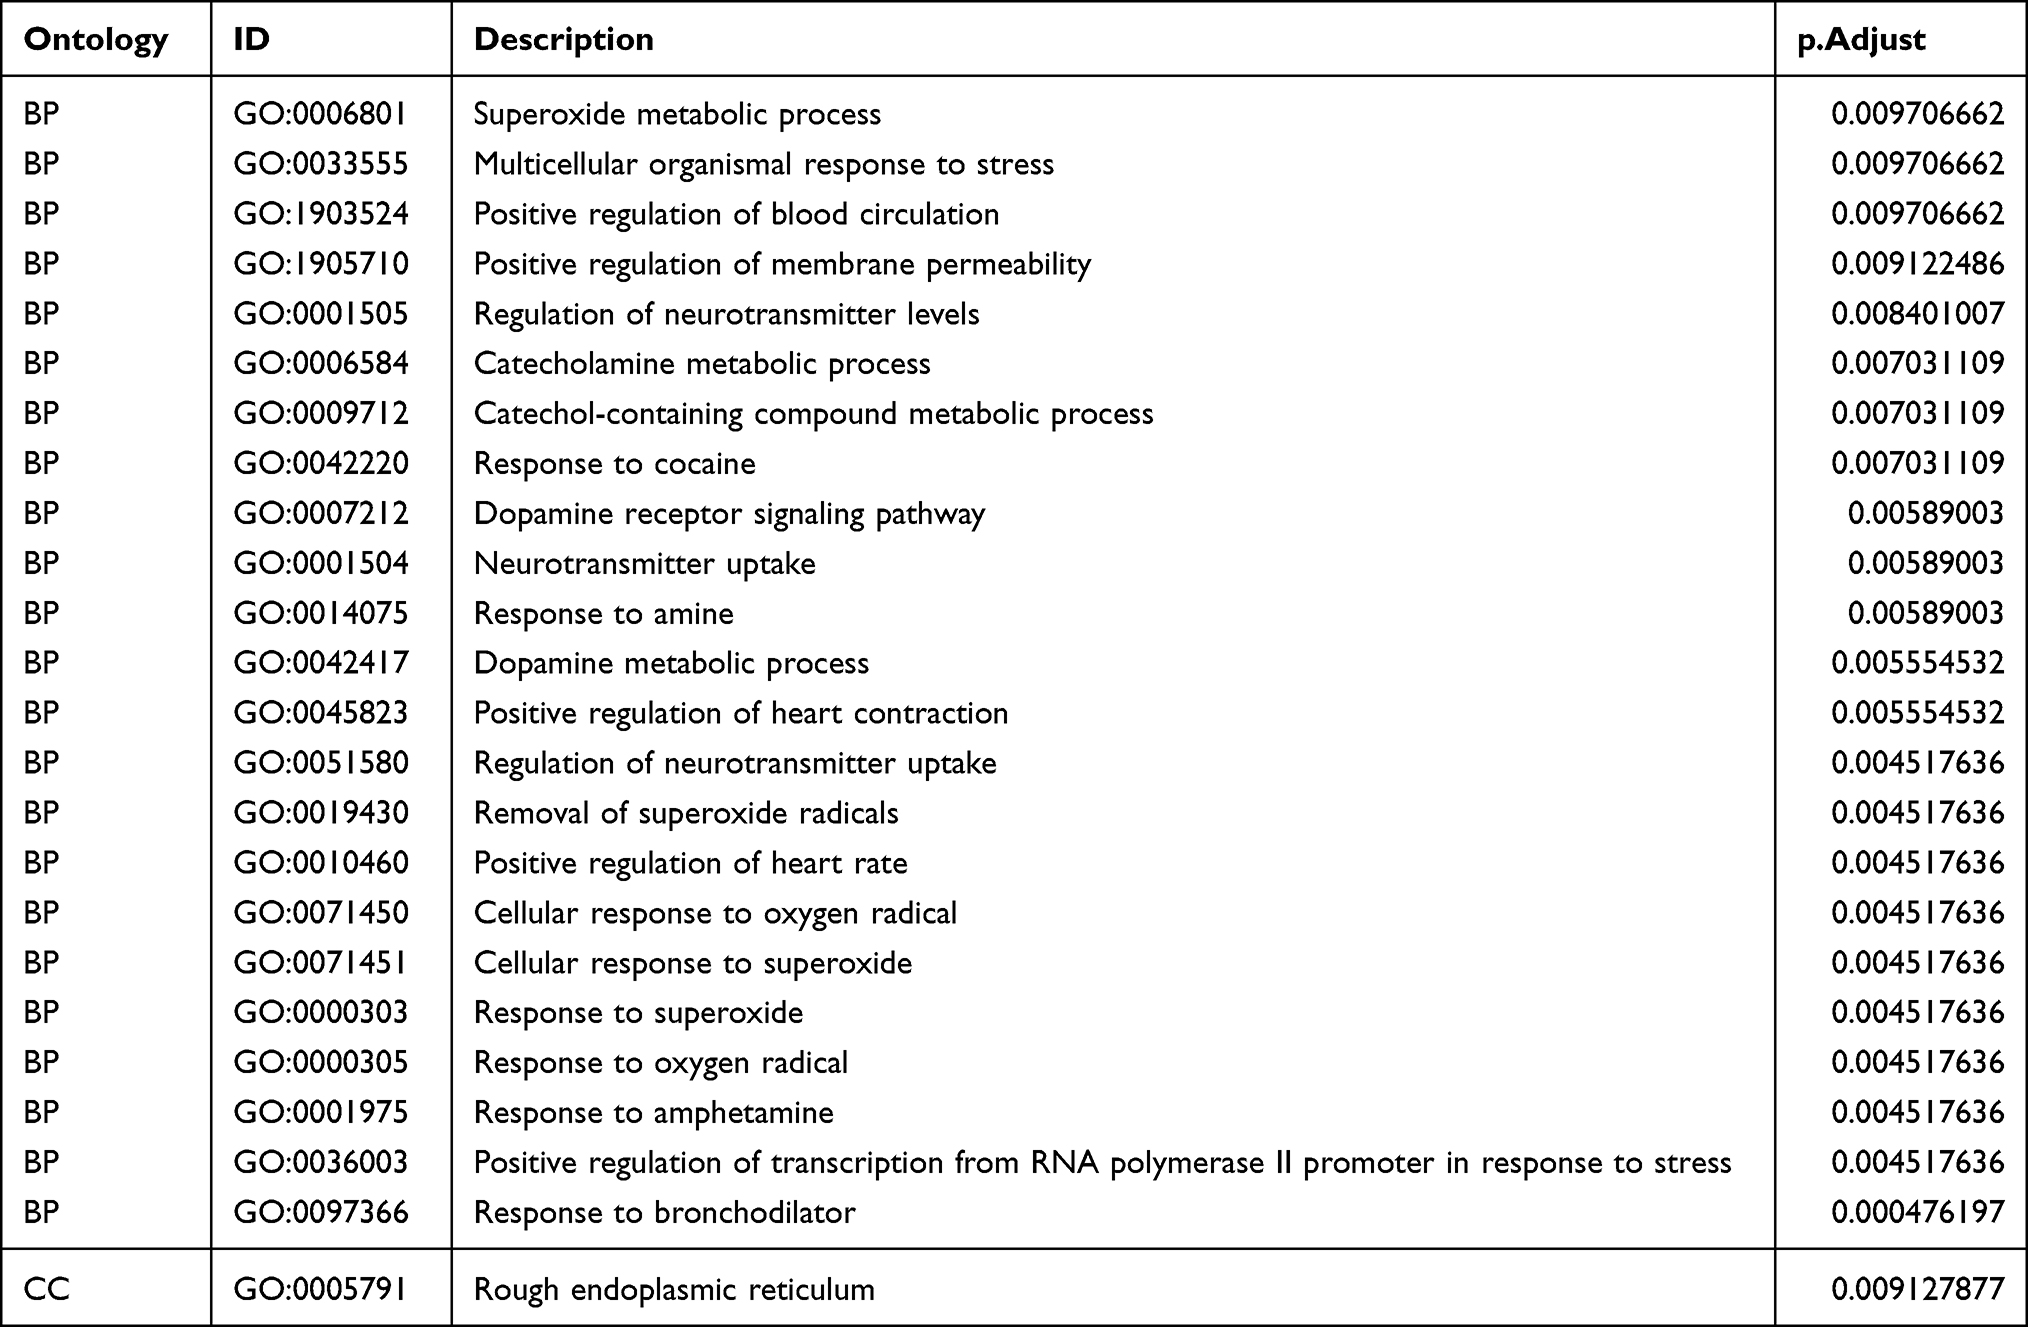 |
Table 4 GO Enrichment Analysis of Differentially Expressed Ferroptosis Genes |
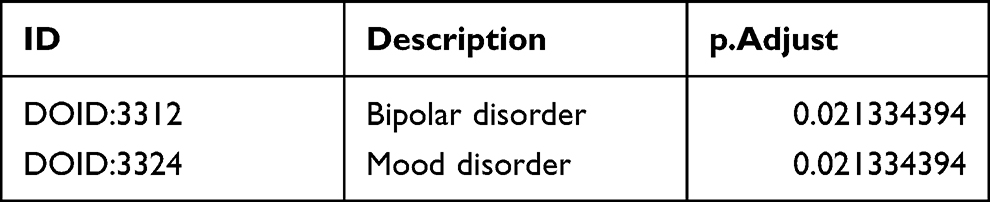 |
Table 5 DO Enrichment Analysis of Differentially Expressed Ferroptosis Genes |
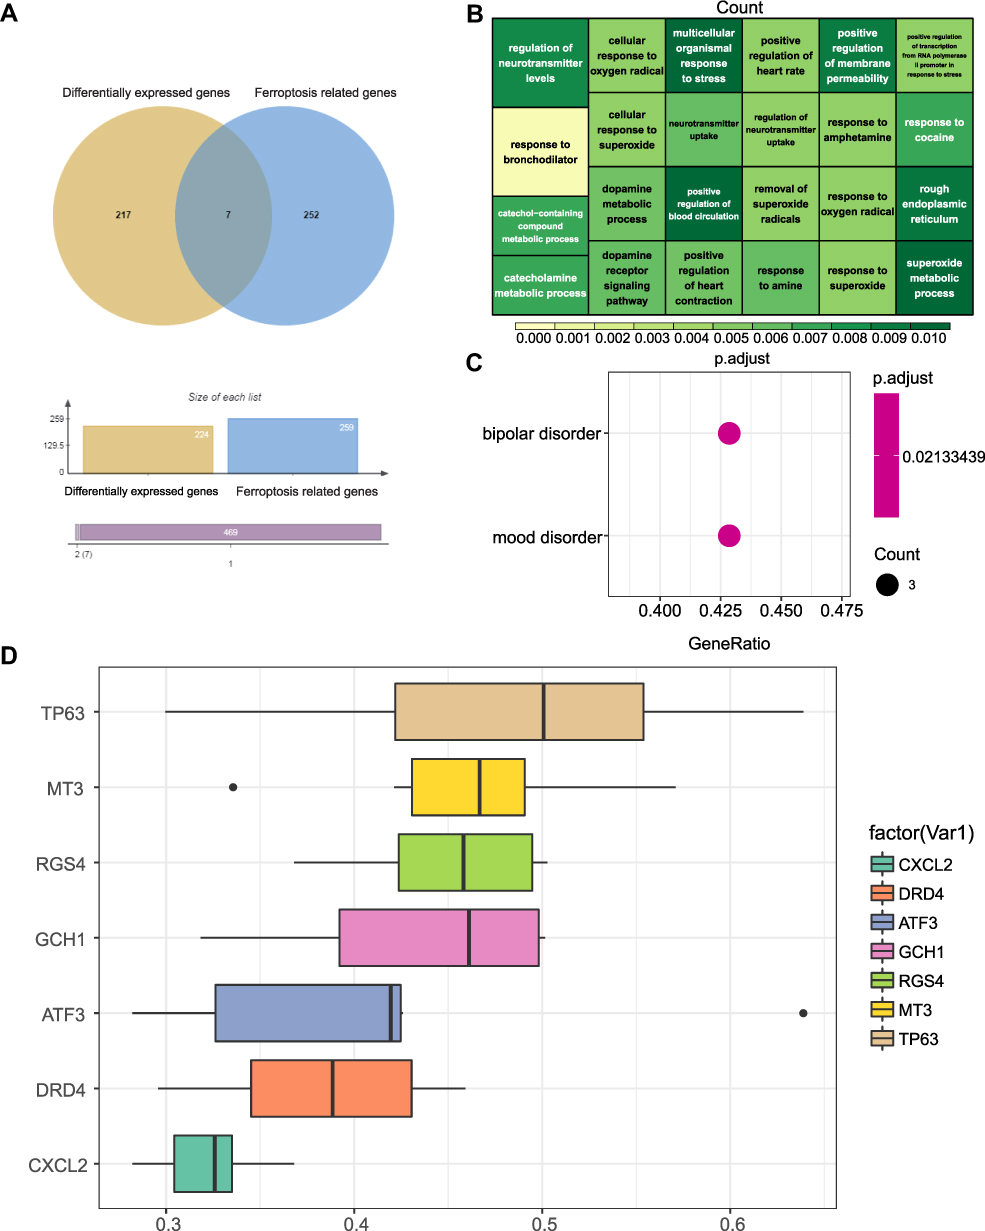 |
Figure 6 Ferroptosis-related differentially expressed gene screening. (A) Differentially expressed genes and ferroptosis-related genes Wayne diagram. Differentially expressed genes (yellow), ferroptosis-related genes (blue). (B) GO analysis, where each rectangle indicates a pathway, the lighter the color, the smaller the P value, and the darker the color, the larger the P value. The size of the rectangle indicates how many genes are in the pathway. (C) DO analysis. (D) Friends analysis of 7 genes, where higher gene position indicates higher correlation. |
Algorithms Predict Diagnostic Markers and Model Validation
Based on the DEGs associated with ferroptosis, we constructed an NP prediction model using LASSO regression and expression of RGS4, CXCL2, DRD4, TP63, and GCH1 (Figure 7A and B). Validation of these five genes in the new GEO dataset revealed that RGS4 and GCH1 expression differed between the SNL and sham control groups (Figure 7C and F).
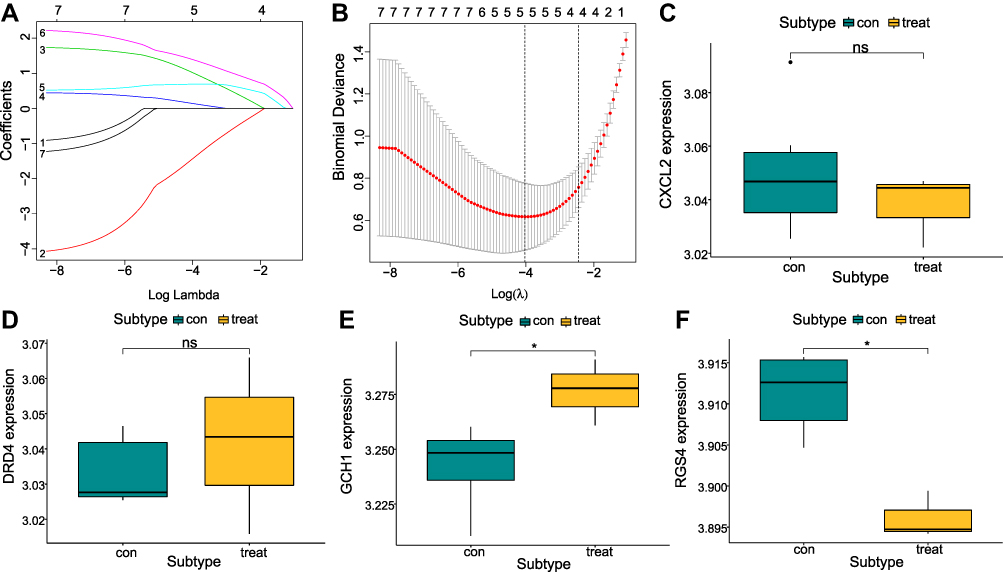 |
Figure 7 LASSO regression model construction screening and diagnostic marker screening. (A and B) Determine the best P value in the LASSO regression algorithm, screening for diagnostic gene markers. (C–F) Expression validation of diagnostic markers in the new GEO dataset. Experimental group (yellow) and sham group (green). *p <0.05. |
WGCNA Analysis and Module Enrichment Analysis
Based on the WGCNA analysis of the combined GEO dataset expression profiles, we calculated the correlation between each module and clinical features and immune cells (Figure 8). Because the turquoise module significantly negatively associated with CCR (−0.81), we selected this module for the next study (Figure 8A and B). In this module we selected the genes in this module with a GS> 0.5 and MM> 0.7 for the enrichment analysis (Figure 8C).
 |
Figure 8 Screening for co-expression module based on WGCNA. (A) Cluster dendrogram of co-expression module. (B) Association between module and immune cells of neuralgia samples. (C) Scatter plot of module feature factors. |
GO analysis of the 150 module genes showed that the majority of pathways are related to nerves, neuroapoptosis and positive regulation of neurogenesis (Figure 9A). The DO results showed that these genes were associated with bipolar disorder and affective disorder (Figure 9B), which is consistent with the seven ferroptosis-related NP differential genes, therefore we crossed the two gene sets to obtain RGS4. The KEGG results showed that the module genes were mostly enriched in HIF-1 signaling pathway, neuroactive ligand receptor interaction, cAMP signaling pathway, and other pathways (Figure 9C). We further analyzed the HIF-1 signaling pathway in detail (Figure 9D and E).
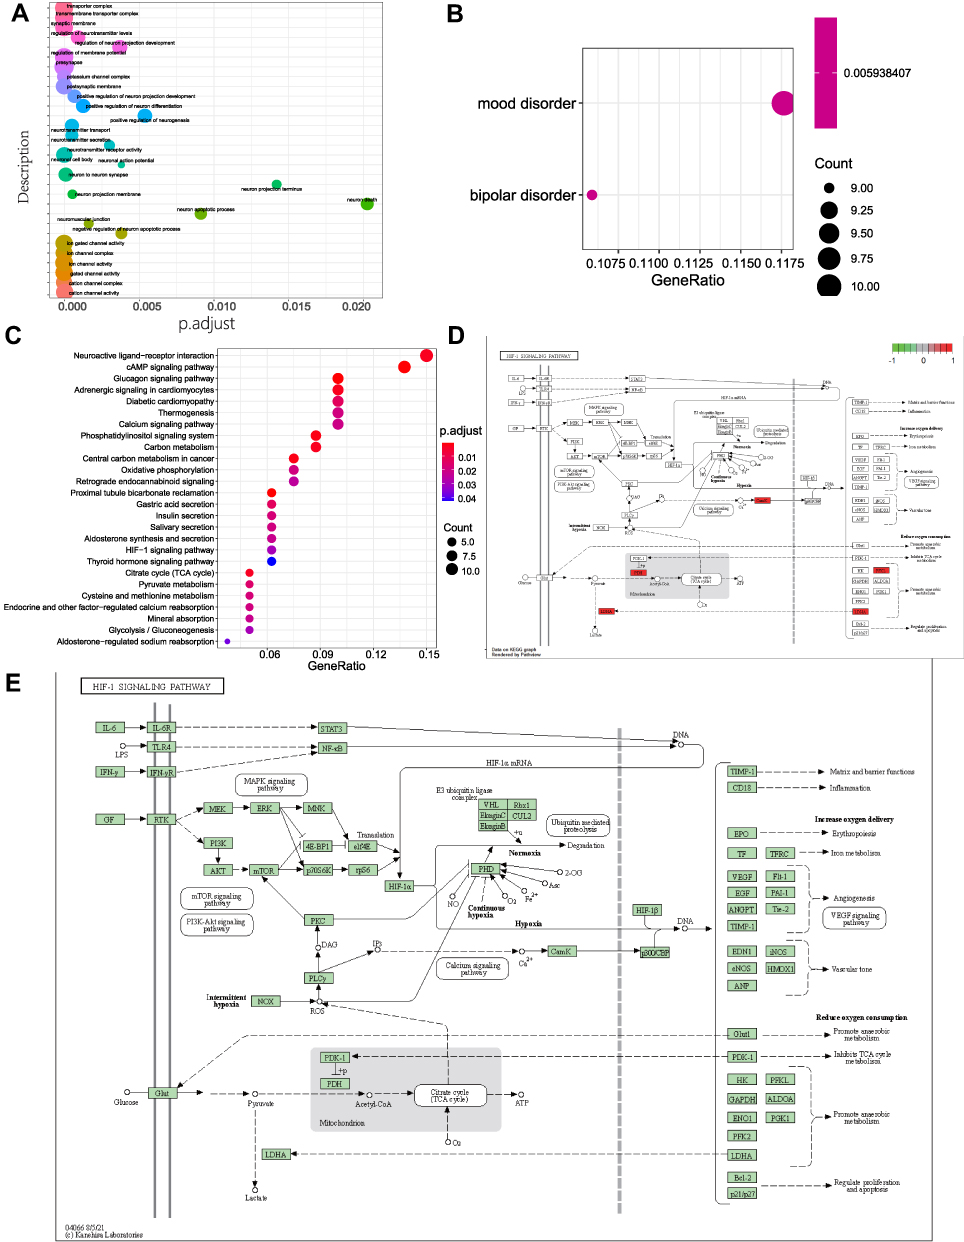 |
Figure 9 Module gene enrichment analysis. (A) GO analysis results, horizontal axis represents P-adjust value, and the circle size corresponds to the number of genes in the pathway, and the larger the circle, the more genes there are. (B) DO analysis results. Circle size indicates the number of genes in the pathway, the larger the circle. (C) KEGG enrichment analysis, abscissa is gene ratio, ordinate is the KEGG pathway, and color indicates -log10 (P value); (D and E) HIF 1 signaling pathway of KEGG. |
Interplay Network Construction
To verify the interactions of diagnostic proteins, drug small molecules and transcription factors, we constructed an interplay network (Figure 10). Tp63 had the highest correlation among proteins selected, RGS4 and GCH1 had the highest correlation with genes in the key module (Figure 10A and 1B), and RGS4 correlated with Cisplatin and Mitoxantrone (Figure 10C and D). These results demonstrate that RGS4 can be used as a hub gene in this study.
 |
Figure 10 Gene interaction network. (A) Diagnostic marker - protein interaction network. (B) Diagnostic marker - key module gene interaction network. (C) Diagnostic marker - drug small molecule interaction network. (D) Diagnostic marker - transcription factor interaction network. Key genes (pink circles), key module genes (yellow-green hexagons), small molecules (blue squares), transcription factors (green diamonds). |
Hub Genetic Analysis
To investigate hub gene functions in NP, we performed correlation analysis between the hub genes and the immune microenvironment. RGS4 was significantly negative correlated (−0.79) with innate and acquired immune cell infiltration, including macrophages and Tfh. CCR was the second most negatively correlated hub gene (−0.63) (Figure 11).
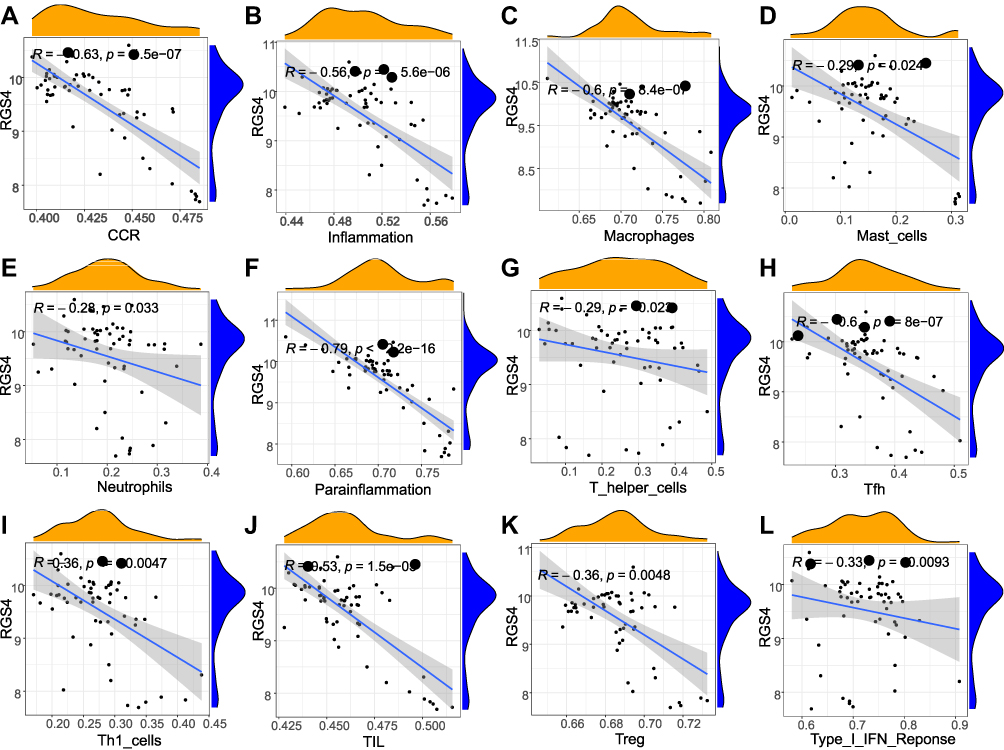 |
Figure 11 Correlation analysis of hub gene and immune cells. Correlation between RGS4 gene and immune cells, the slope is the magnitude of the correlation and the P-value indicates the significance level. P value < 0.05 was considered as statistically significant. R > 0: General, | R | > 0.95: significant correlation. | R | ≥ 0.8: highly relevant. 0.5≤ | R | < 0.8: moderate relevant. 0.3 ≤ | R | < 0.5: low relevant. | R | < 0.3: not relevant. (A) RGS4 and CCR (R= −0.63, P < 0.05). (B) RGS4 and Inflammation (R= −0.56, P < 0.05). (C) RGS4 and Macrophages (R= −0.6, P < 0.05). (D) RGS4 and Mast_cells (R= −0.29, P < 0.05). (E) RGS4 and Neutrophils (R= −0.28, P < 0.05). (F) RGS4 and Parainflammation (R= −0.79, P < 0.05). (G) RGS4 and T_helper_cells (R= −0.29, P < 0.05). (H) RGS4 and Tfh (R= −0.6, P < 0.05). (I) RGS4 and Th1_cells (R= - 0.36, P < 0.05). (J) RGS4 and TIL (R= - 0.53, P < 0.05). (K) RGS4 and Treg (R= −0.36, P < 0.05). (L) RGS4 and Type_I_IFN_Reponse (R= −0.33, P < 0.05). |
To explore gene expression in SNL tissues, we performed hierarchical clustering of all samples using the significantly expressed DEGs associated NP. Samples were divided into two different subtypes (A: n = 55; B: n = 5, Figure 12A), and the PCA results showed a high separation quality (Figure 12B). Further differential analysis of the hub gene in Groups A and B showed that RGS4 was significantly differentially expressed (P <0.001) (Figure 12C), from which we hypothesized that RGS4 could be a key gene in neuralgia.
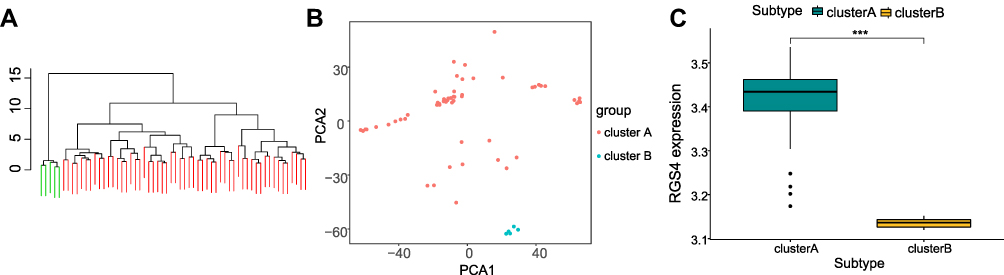 |
Figure 12 Correlation analysis of hub genes and molecular subtypes of neuropathic pain. (A) Cluster grouping of samples based on significant differentially expressed genes in spinal nerve ligation and sham groups. (B) PCA under different groups, including cluster A (red), cluster B (blue). (C) Differential expression of RGS4 in different groups, cluster A (green) and cluster B (yellow). ***p <0.001. |
Discussion
NP is a type of refractory pain for which there are no effective treatment options. Therefore understanding the pathological and molecular mechanisms of NP is essential for its clinical diagnosis and treatment. Molecular mechanisms of disease occurrence and development have been explored through microarray and bioinformatics analyses, that was allowed us to identify genetic variations and identify potential diagnostic biomarkers. In the present study, a dataset of NP expression profiles was retrieved from the GEO database. The ssGSEA method was used to identify the expression levels of the 29 immune gene sets in each sample. We analyzed the immune infiltration phenotypes and related functions. In the new GEO dataset, LASSO regression modeling was used to identify diagnostic markers by screening key genes. The DGIdb and correlation test were then used to construct gene-drug and gene-transcription factor interaction networks for ferroptosis DEGs associated with NP. WGCNA was used to identify gene modules co-expressed by neuralgia, and explore the association between gene networks, phenotype, and core genes. Finally, the key genes were derived from intersecting core genes and diagnostic markers. The correlation between key genes, molecular subtypes and immune cells was analyzed. We found that ferroptosis may be critical in this disease, but the mechanism and target have not been clarified.
GSEA and GSVA enrichment analyses were performed to understand the functional differences between the SNL tissue and sham control tissue. The GSEA results showed that the GO-enriched biological processes in SNL tissues included immune response activation, amide biosynthetic process, and ATP metabolic process. The major enriched KEGG pathways included Alzheimer’s disease, cardiac muscle contraction, and Parkinson’s disease. GSVA results showed that GO-enriched biological processes included platelet-derived growth factor receptor binding, chemokine binding, regulation of Neutrophil chemotaxis, the major enriched KEGG pathways included drug metabolism other pathos, pathogenic Escherichia coli infection, etc. Several gene programs involved in NP have been reported in recent years. During noxious stimuli, inflammatory receptor activity, Na+/K+-ATPase activity, and actin filament organization increase in the central nervous system, thereby contributing to neuroinflammation. ATP regulates glial activity by modulating and activating P2X (ionic channels) and P2Y (metabolic import) receptors, and these ATP receptors act as gatekeepers in neuropathic pain microglial signaling pathways.33 Some experiments have found that NP caused by peripheral nerve injury can reduce the size of myocardial infarction, heart disease can cause the perception of pain, and body pain may also affect myocardial remodeling.34,35 Furthermore, chronic pain can cause anxiety and depression in rodents and humans, as well as cognitive impairment.36,37
GSEA and GSVA showed that NP DEGs were concentrated in many immune-related pathways and genes. In recent years, studies have identified that NP occurs because of the combined action of neurons, glial cells and a large number of immune cell-mediated inflammatory cytokines and chemokines in the nervous systems.38 Therefore, the role in NP of neuro-associated immune cells has received increasing attention. To further investigate the immune-related pathway genes identified, we conducted immune infiltration analysis and constructed immune subtype signatures. Sensitization of injury receptors by the immune system is achieved mainly through the complement system, immune cells, glial cells, cytokines and chemokines. For example, macrophages are activated by chemokine and chemokine receptor-mediated aggregation, and release soluble mediators enhances injury receptor sensitization. Monocytes are the first to invade the site of injury, producing acute inflammation and releasing large amounts of pro-inflammatory cytokines that activate and attract other inflammatory cells. T cells release both pro- and anti-inflammatory cytokines, and the balance of these releasing anti-inflammatory and pro-inflammatory cytokines plays an important role in peripheral receptor sensitization.39
However, the interaction between various components of neuroimmunity is extremely complex, including neuroprotective factors, such as Th2 cell anti-inflammatory cytokines, etc. There are also nerve damaging factors such as macrophages, neutrophils, Th1 cells and glial cells, which further release pro-inflammatory mediators such as the complement protein prostaglandin, which ultimately leads to persistent pain.40–42 Future research and treatment of immunology involved in pain signal transduction pathways should focus on immune cells and inflammatory regulation. Therefore, the immune system may be an ideal entry point for the NP treatment.
Ferroptosis is a type of cell death caused by the accumulation of iron-dependent lipid peroxidation products. It is a regulated cell death mode along with apoptosis and programmed necrosis, and is involved in the occurrence and development of many diseases, such as stroke, neurodegenerative diseases, cancer, etc. Current studies showed that under normal physiological conditions, intracellular antioxidants and intracellular ROS (reactive oxygen species) are dynamic balance, but when mitochondria are damaged, the production of ROS is higher than the normal level, and endogenous related antioxidants such as GSH are seriously consumed, which breaks the balance between the two, leading to intracellular oxidative stress.43 Oxidative stress can not only seriously damage tissues and cells, but also lead to highly activated signaling pathways in cells mediated by growth factors and cytokines, thus leading to the occurrence of NP. Oxidative stress may also lead to changes in the related structure and function of mitochondria, and aggravate the occurrence of NP.44 Wang and his colleagues found that ferroptosis is involved in the development of NP in male rats by blocking neuron and astrocyte activation in the spinal dorsal horn.45 Guo suggests that the spinal ferroptosis-like cell death was involved in the development of neuropathic pain resulted from peripheral nerve injury, and inhibition of ferroptosis by liproxstatin-1 could alleviate mechanical and thermal hypersensitivities.46 LI found that sirtuin 2 (SIRT2) achieves a neuroprotective pain by suppressing ferroptosis.47 Several preclinical and clinical studies have shown that NP mechanisms are related to ferroptosis. Overall, this evidences suggest that the ferrotosin pathway to induce cell death could be a key mechanism to NP.
Among the ferroptosis-related pathways, Friends analysis showed that TP63, MT3 and RGS4 may play more roles in these pathways. Prediction models containing the expression of the five genes were constructed separately. These five genes were validated in the new GEO dataset, and RGS4 and GCH1 were different in the SNL and sham groups. TP63, a member of the TP53 family, has oncogenic effects activates various. TP53 downstream target genes, triggering cell cycle arrest and apoptosis.48,49 The TP53 family regulates NF-κB/REL expression, which in turn promotes proliferative inflammation and the malignant phenotype of head and neck squamous carcinomas.50 Human metallothionein 3 (MT3), which regulates metal homeostasis, is downregulated by at least 30% in the AD brain. Metal ion metabolism and MT3 deficiency may play a role in the pathogenesis of AD.51 Gene GCH1 (GTP Cyclohydrolase 1) is associated with body pain. GCH1 encodes GTP cyclohydrolase 1, which synthesizes BH4 (Tetrahydrobiopterin). BH4 regulates pain sensitivity and persistence. In some diseases, gene polymorphisms of the GCH1 gene have been found to modulate pain susceptibility.52,53 Regulator of G-protein signaling 4 (RGS4) is a potent G-protein-coupled receptor regulator, expressed in brain neurocircuitry that mediates nociception, mood, and motivation.54 Aberrant RGS4 function has been linked to severe human neurological disorders such as schizophrenia, Parkinson’s disease, and addiction.55–57 RGS4 is expressed in many structures involved in the transmission and maintenance of chronic pain, including the spinal cord’s dorsal horn, the periaqueductal gray, the thalamus, and the basal ganglia.58
By WGCNA method, most of the NP pathways were found to be associated with the nervous system, including apoptosis, positive regulation of neurogenesis, etc. DO results showed that these genes were associated with affective disorders and bipolar disorder, which is consistent with our ferroptosis-related DEGs screening results. Nociceptive pain modulation is related to psychological and psychiatric conditions. Ettore Favaretto and his workmates found that pain sensitivity is modulated by affective temperament through the study from the population-based CHRIS Affective Disorder (CHRIS-AD).59 Emma K and her colleagues found that common familial risk factors underlying back/neck pain with MDD, whereas there was within-individual comorbidity of bipolar with back/neck pain.60 The previous literature shows that bipolar disorder or affective disorders is related to NP. Therefore, exploring potential targets and mechanisms of neuralgia is helpful for the diagnosis, occurrence and development of NP, bipolar disorder and affective disorders.
RGS4 was found to be associated with Cisplatin and Mitoxantrone through the gene-drug network interaction. Cisplatin, a platinum compound, is a chemotherapeutic drug, which is widely used in lung cancer and testicular cancer by inhibiting DNA synthesis and repair. Mitoxantrone is an anti-tumor antibiotic chemotherapy drug that changes RNA replication by embedding RNA and prevents DNA synthesis by transcription. However, severe neuralgia is a major complication of these drugs.61,62 Patients with severe chemotherapeutic neuralgia may even be suicidal.63 Therefore, the discovery of new therapeutic agents for chemotherapy-induced NP is an urgent topic. We found that the hub gene RGS4 was significantly negatively correlated with the infiltration of innate and acquired immune cells such as CCR, Macrophages, Parainflammation, and Tfh. In the hierarchical clustering of expression of DEGs in neuropathic pain, we found that significantly different RGS4 expression in different subgroups (p<0.001). Thus, we hypothesized that RGS4 could be a key gene in neuropathic pain.
As the large number of data sets included, we tried to control variables as much as possible to study the common information in these neuralgia data sets. The lack of using time node information for analysis is a limitation. In the future, we will construct a mouse or rat neuralgia model at different time nodes. Additionally, to control for clinical variables, this study focused on the results of the clinical predictive model in the SNL group VS sham group. CCI samples were not included in the joint study with the SNL model, which is also the deficiency of our study. Second, even though the fact that microarray based bioinformatic analysis is a powerful tool to understand disease mechanisms and identify potential biomarkers. Further experimental validations of RGS4 are needed at the molecular, cellular, and organismal levels.
Conclusion
This study used public databases and rich bioinformatics analysis to identify ferroptosis involvement in the pathological processes of NP. RGS4 may well promote the pathological occurrence or development caused by ferroptosis, such as immune response, which will help us further analyze the NP pathogenesis and provide a direction for NP therapies. Additionally, we should study ferroptosis in more detail to assist in therapeutic efforts.
Abbreviations
NP, Neuropathic pain; DEG, differentially expressed gene; GEO, Gene Expression Omnibus; ssGSEA, single-sample gene set enrichment analysis; LASSO, least absolute shrinkage and selector operator; GSVA, Gene set variation analysis; DGIdb Drug Gene Interaction database; CCI, chronic contractile injury; SNL, spinal nerve ligation; SH, sham groups; KEGG, Kyoto Encyclopedia of Genes and Genomes; TF, transcription factor; MT3, Human metallothionein 3; GCH1, GTP cyclohydrolase 1; BH4, tetrahydrobiopterin; RGS4, Regulator of G-protein signaling 4; GPCR, G-protein-coupled receptor; GS, gene significance; MM, module membership; DO, disease ontology; PCA, Principal Component Analysis; ROS, reactive oxygen species.
Data Sharing Statement
The datasets used and analyzed during the current study are available from the corresponding author on reasonable request.
Ethical Approval and Consent to Participate
The study was approved by the Ethics Committee of the Huabei Petroleum Administration Bureau General Hospital.
Funding
This work was financially supported by the Scientific Research Project of the Hebei Administration of Traditional Chinese Medicine (No. 2021204).
Disclosure
The authors declare no conflict of interests.
References
1. Raja SN, Carr DB, Cohen M., et al. The revised international association for the study of pain definition of pain: concepts, challenges, and compromises. Pain. 2020;161(9):1976–1982. PMID: 32694387; PMCID: PMC7680716. doi:10.1097/j.pain.0000000000001939
2. Meacham K, Shepherd A, Mohapatra DP, Haroutounian S. Neuropathic pain: central vs. peripheral mechanisms. Curr Pain Headache Rep. 2017;21(6):28. PMID: 28432601. doi:10.1007/s11916-017-0629-5
3. Dixon S, Lemberg K, Lamprecht M, et al. Ferroptosis: an iron-dependent form of nonapoptotic cell death. Cell. 2012;149(5):1060–1072. doi:10.1016/j.cell.2012.03.042
4. Friedmann Angeli JP, Schneider M, Proneth B, et al. Inactivation of the ferroptosis regulator Gpx4 triggers acute renal failure in mice. Nat Cell Biol. 2014;16(12):1180–1191. doi:10.1038/ncb3064
5. Galy B, Ferring-Appel D, Sauer SW, et al. Iron regulatory proteins secure mitochondrial iron sufficiency and function. Cell Metab. 2010;12(2):194–201. doi:10.1016/j.cmet.2010.06.007
6. Millecamps S, Julien JP. Axonal transport deficits and neurodegenerative diseases. Nat Rev Neurosci. 2013;14(3):161–176. doi:10.1038/nrn3380
7. Mou Y, Wang J, Wu J, et al. Ferroptosis, a new form of cell death: opportunities and challenges in cancer. J Hematol Oncol. 2019;12(1):34. doi:10.1186/s13045-019-0720-y
8. Fanzani A, Poli M. Iron, oxidative damage and ferroptosis in rhabdomyosarcoma. Int J Mol Sci. 2017;18(8):1718. doi:10.3390/ijms18081718
9. Tang S, Jing H, Huang Z, et al. Identification of key candidate genes in neuropathic pain by integrated bioinformatic analysis. J Cell Biochem. 2020;121(2):1635–1648. PMID: 31535407. doi:10.1002/jcb.29398
10. Barrett T, Troup DB, Wilhite SE, et al. NCBI GEO: mining tens of millions of expression profiles--database and tools update. Nucleic Acids Res. 2007;35:D760–765. doi:10.1093/nar/gkl887
11. Von Schack D, Agostino MJ, Murray BS, et al. Dynamic changes in the microRNA expression profile reveal multiple regulatory mechanisms in the spinal nerve ligation model of neuropathic pain. PLoS One. 2011;6:e17670. doi:10.1371/journal.pone.0017670
12. Costigan M, Belfer I, Griffin RS, et al. Multiple chronic pain states are associated with a common amino acid-changing allele in KCNS1. Brain. 2010;133:2519–2527. doi:10.1093/brain/awq195
13. Ma C, Brenner GJ, Omura T, et al. The BMP coreceptor RGMb promotes while the endogenous BMP antagonist noggin reduces neurite outgrowth and peripheral nerve regeneration by modulating BMP signaling. J Neurosci. 2011;31:18391–18400. doi:10.1523/jneurosci.4550-11.2011
14. Cobos E, Nickerson CA, Gao F, et al. Mechanistic differences in neuropathic pain modalities revealed by correlating behavior with global expression profiling. Cell Rep. 2018;22:1301–1312. doi:10.1016/j.celrep.2018.01.006
15. Leek J, Johnson W, Parker H, Jaffe A, Storey J. The sva package for removing batch effects and other unwanted variation in high-throughput experiments. Bioinformatics. 2012;28:882–883. doi:10.1093/bioinformatics/bts034
16. Ritchie M, Phipson B, Wu D, et al. limma powers differential expression analyses for RNA-sequencing and microarray studies. Nucleic Acids Res. 2015;43:e47. doi:10.1093/nar/gkv007
17. Galamb O, Kalmár A, Barták BK, et al. Aging related methylation influences the gene expression of key control genes in colorectal cancer and adenoma. World J Gastroenterol. 2016;22:10325–10340. doi:10.3748/wjg.v22.i47.10325
18. Subramanian A, Tamayo P, Mootha VK, et al. Gene set enrichment analysis: a knowledge-based approach for interpreting genome-wide expression profiles. Proc Natl Acad Sci USA. 2005;102:15545–15550. doi:10.1073/pnas.0506580102
19. Liberzon A, Birger C, Thorvaldsdóttir H, et al. The Molecular Signatures Database (MSigDB) hallmark gene set collection. Cell Syst. 2015;1:417–425. doi:10.1016/j.cels.2015.12.004
20. Yu G, Wang LG, Han Y, He QY. Clusterprofiler: an R package for comparing biological themes among gene clusters. Omics. 2012;16:284–287. doi:10.1089/omi.2011.0118
21. Hänzelmann S, Castelo R, Guinney J. GSVA: gene set variation analysis for microarray and RNA-seq data. BMC Bioinform. 2013;14:7. doi:10.1186/1471-2105-14-7
22. He Y, Jiang Z, Chen C, Wang X. Classification of triple-negative breast cancers based on Immunogenomic profiling. J Exp Clin Cancer Res. 2018;37:327. doi:10.1186/s13046-018-1002-1
23. Yu G, Li F, Qin Y, et al. GOSemSim: an R package for measuring semantic similarity among GO terms and gene products. Bioinformatics. 2010;26:976–978. doi:10.1093/bioinformatics/btq064
24. Yu G, Wang L, Yan G, He Q. DOSE: an R/Bioconductor package for disease ontology semantic and enrichment analysis. Bioinformatics. 2015;31:608–609. doi:10.1093/bioinformatics/btu684
25. Friedman J, Hastie T, Tibshirani R. Regularization paths for generalized linear models via coordinate descent. J Stat Softw. 2010;33:1–22. doi:10.18637/jss.v033.i01
26. Gui J, Li H. Penalized cox regression analysis in the high-dimensional and low-sample size settings, with applications to microarray gene expression data. Bioinformatics. 2005;21:3001–3008. doi:10.1093/bioinformatics/bti422
27. Langfelder P, Horvath S. WGCNA: an R package for weighted correlation network analysis. BMC Bioinform. 2008;9:559. doi:10.1186/1471-2105-9-559
28. Botía J, Vandrovcova J, Forabosco P, et al. An additional k-means clustering step improves the biological features of WGCNA gene co-expression networks. BMC Syst Biol. 2017;11:47. doi:10.1186/s12918-017-0420-6
29. Kanehisa M, Goto S. KEGG: Kyoto encyclopedia of genes and genomes. Nucleic Acids Res. 2000;28:27–30. doi:10.1093/nar/28.1.27
30. Pathan M, Keerthikumar S, Ang C-S, et al. FunRich: an open access standalone functional enrichment and interaction network analysis tool. Proteomics. 2015;15:2597–2601. doi:10.1002/pmic.201400515
31. Doncheva N, Morris J, Gorodkin J, Jensen L. Cytoscape StringApp: network analysis and visualization of proteomics data. J Proteome Res. 2019;18:623–632. doi:10.1021/acs.jproteome.8b00702
32. Freshour S, Kiwala S, Cotto KC, et al. Integration of the Drug-Gene Interaction Database (DGIdb 4.0) with open crowdsource efforts. Nucleic Acids Res. 2021;49:D1144–D1151. doi:10.1093/nar/gkaa1084
33. Trang T, Beggs S, Salter MW. ATP receptors gate microglia signaling in neuropathic pain. Exp Neurol. 2012;234(2):354–361. PMID: 22116040; PMCID: PMC3748033. doi:10.1016/j.expneurol.2011.11.012
34. Cheng YF, Chang YT, Chen WH, et al. Cardioprotection induced in a mouse model of neuropathic pain via anterior nucleus of paraventricular thalamus. Nat Commun. 2017;8(1):826. doi:10.1038/s41467-017-00891-z
35. Yang Z, Li C, Wang Y, et al. Melatonin attenuates chronic pain related myocardial ischemic susceptibility through inhibiting RIP3-MLKL/CaMKII dependent necroptosis. J Mol Cell Cardiol. 2018;125:185–194. doi:10.1016/j.yjmcc.2018.10.018
36. Wang XM, Zhang GF, Jia M, et al. Environmental enrichment improves pain sensitivity, depression-like phenotype, and memory deficit in mice with neuropathic pain: role of NPAS4. Psychopharmacology. 2019;236(7):1999–2014. doi:10.1007/s00213-019-5187-6
37. Zhou W, Kavelaars A, Heijnen CJ. Metformin prevents cisplatin-induced cognitive impairment and brain damage in mice. PLoS One. 2016;11(3):e0151890. doi:10.1371/journal.pone.0151890
38. Mika J, Zychowska M, Popiolek-Barczyk K, et al. Importance of glial activation in neuropathic pain. Eur J Pharmacol. 2013;716(1–3):106–119. doi:10.1016/j.ejphar.2013.01.072
39. Austin PJ, Moalem-Taylor G. The neuro-immune balance in neuropathic pain: involvement of inflammatory immune cells, immune-like glial cells and cytokines. J Neuroimmunol. 2010;229(1–2):
40. Grace PM, Hutchinson MR, Maier SF, et al. Watkins pathological pain and the neuroimmune interface. Nat Rev Immunol. 2014;14(4):217–231. doi:10.1038/nri3621
41. Coraggio V, Guida F, Boccella S, et al. Neuroimmune driven neuropathic pain establishment: a focus on gender differences. Int J Mol Sci. 2018;19((1)):281. doi:10.3390/ijms19010281
42. Xu N, Tang XH, Pan W, et al. Spared nerve injury increases the expression of microglia M1 markers in the prefrontal cortex of rats and provokes depression-like behaviors. Front Neurosci. 2017;11:209. doi:10.3389/fnins.2017.00209
43. Angeli JPF, Shah R, Pratt DA, Conrad M. Ferroptosis Inhibition: mechanisms and Opportunities. Trends Pharmacol Sci. 2017;38(5):489–498. doi:10.1016/j.tips.2017.02.005
44. Baad-Hansen L, Benoliel R. Neuropathic orofacial pain: facts and fiction. Cephalalgia. 2017;37(7):670–679. doi:10.1177/0333102417706310
45. Wang H, Huo X, Han C, et al. Ferroptosis is involved in the development of neuropathic pain and allodynia. Mol Cell Biochem. 2021;476(8):3149–3161. doi:10.1007/s11010-021-04138-w
46. Guo Y, Du J, Xiao C, et al. Inhibition of ferroptosis-like cell death attenuates neuropathic pain reactions induced by peripheral nerve injury in rats. Eur J Pain. 2021;25(6):1227–1240. doi:10.1002/ejp.1737
47. Zhang X, Song T, Zhao M, et al. Sirtuin 2 alleviates chronic neuropathic pain by suppressing ferroptosis in rats. Front Pharmacol. 2022;13:827016. doi:10.3389/fphar.2022.827016
48. Mills AA, Zheng B, Wang XJ, et al. P63 is a p53 homologue required for limb and epidermal morphogenesis. Nature. 1999;398(6729):708–713. doi:10.1038/19531
49. Aylon Y, M O. New plays in the p53 theater. Curr Opin Genet Dev. 2011;21(1):86–92. doi:10.1016/j.gde.2010.10.002
50. Yang X, Lu H, Yan B, et al. Deltanp63 versatilely regulates a broad NF-kappab gene program and promotes squamous epithelial proliferation, migration, and inflammation. Cancer Res. 2011;71(10):3688–3700. doi:10.1158/0008-5472.CAN-10-3445
51. Xu W, Xu Q, Cheng H, Tan X. The efficacy and pharmacological mechanism of Zn7MT3 to protect against Alzheimer’s Disease. Sci Rep. 2017;7(1):13763. PMID: 29061973; PMCID: PMC5653791. doi:10.1038/s41598-017-12800-x
52. Kraft VAN, Bezjian CT, Pfeiffer S, et al. GTP cyclohydrolase l/tetrahydrobiopterin counteract ferroptosis through lipid re-modeling. ACS Cent Sci. 2020;6(1):41–53. doi:10.1021/acscentsci.9b01063
53. Tang Z, Liu L, Guo Y, et al. Exendin-4 reverses endothelial dysfunction in mice fed a high-cholesterol diet by a GTP cyclohydrolase-1/tetrahydrobiopterin pathway. Mol Med Rep. 2018;18(3):3350–3358. doi:10.3892/mmr.2018.9345
54. Kuner R, Flor H. Structural plasticity and reorganisation in chronic pain. Nat Rev Neurosci. 2016;18(1):20–30. doi:10.1038/nrn.2016.162
55. Ding J, Guzman JN, Tkatch T, et al. RGS4-dependent attenuation of M4 autoreceptor function in striatal cholinergic interneurons following dopamine depletion. Nat Neurosci. 2006;9(6):832–842. PMID: 16699510. doi:10.1038/nn1700
56. Terzi D, Stergiou E, King SL, Zachariou V. Regulators of G protein signaling in neuropsychiatric disorders. Prog Mol Biol Transl Sci. 2009;86:299–333.
57. Lerner TN, Kreitzer AC. RGS4 is required for dopaminergic control of striatal LTD and susceptibility to parkinsonian motor deficits. Neuron. 2012;73(2):347–359. doi:10.1016/j.neuron.2011.11.015
58. Taccola G, Doyen PJ, Damblon J, et al. A new model of nerve injury in the rat reveals a role of Regulator of G protein Signaling 4 in tactile hypersensitivity. Exp Neurol. 2016;286:1–11. doi:10.1016/j.expneurol.2016.09.008
59. Favaretto E, Gögele M, Bedani F, et al. Pain sensitivity is modulated by affective temperament: results from the population-based CHRIS affective disorder (CHRIS-AD) study. J Affect Disord. 2022;316:209–216. doi:10.1016/j.jad.2022.08.015
60. Stapp EK, Cui L, Guo W, Paksarian D, Merikangas KR. Comorbidity and familial aggregation of back/neck pain in the NIMH family study of affective spectrum disorders. J Psychosom Res. 2022;158:110927. doi:10.1016/j.jpsychores.2022.110927
61. Sharma S, Ganesh T, Kingston DG, Bane S. ”Promotion of tubulin assembly by poorly soluble taxol analogs”. Anal Biochem. 2006;360:56–62. doi:10.1016/j.ab.2006.10.014
62. Kelland L. The resurgence of platinum-based cancer chemotherapy. Nat Rev Cancer. 2007;7(8):573–584. doi:10.1038/nrc2167
63. Bauduer F, Capdupuy C, Renoux M. Characteristics of deaths in a department of oncohaematology within a general hospital. A study of 81 cases. Support Care Cancer. 2000;8(4):302–306. doi:10.1007/s005209900087
 © 2022 The Author(s). This work is published and licensed by Dove Medical Press Limited. The
full terms of this license are available at https://www.dovepress.com/terms
and incorporate the Creative Commons Attribution
- Non Commercial (unported, 3.0) License.
By accessing the work you hereby accept the Terms. Non-commercial uses of the work are permitted
without any further permission from Dove Medical Press Limited, provided the work is properly
attributed. For permission for commercial use of this work, please see paragraphs 4.2 and 5 of our Terms.
© 2022 The Author(s). This work is published and licensed by Dove Medical Press Limited. The
full terms of this license are available at https://www.dovepress.com/terms
and incorporate the Creative Commons Attribution
- Non Commercial (unported, 3.0) License.
By accessing the work you hereby accept the Terms. Non-commercial uses of the work are permitted
without any further permission from Dove Medical Press Limited, provided the work is properly
attributed. For permission for commercial use of this work, please see paragraphs 4.2 and 5 of our Terms.
Recommended articles
Identification and Validation of Ferroptosis-Related LncRNAs Signature as a Novel Prognostic Model for Chronic Lymphocytic Leukemia
Xu Z, Pan B, Li Y, Xia Y, Liang J, Kong Y, Zhang X, Tang J, Wang L, Li J, Xu W, Wu J
International Journal of General Medicine 2023, 16:1541-1553
Published Date: 26 April 2023
Identification of Ferroptosis-Related Biomarkers for Diagnosis and Molecular Classification of Staphylococcus aureus-Induced Osteomyelitis
Shi X, Tang L, Ni H, Li M, Wu Y, Xu Y
Journal of Inflammation Research 2023, 16:1805-1823
Published Date: 26 April 2023
Identification and Verification of Ferroptosis-Related Genes in Keratoconus Using Bioinformatics Analysis
Gao JF, Dong YY, Jin X, Dai LJ, Wang JR, Zhang H
Journal of Inflammation Research 2024, 17:2383-2397
Published Date: 20 April 2024
Molecular Mechanisms of Immunoinflammatory Infiltration and Ferroptosis in Arthritis Revealed by a Combination of Bioinformatics and Single-Cell Analysis
Song C, Song W, Liu Y, Zhou D, Cai W, Mei Y, Liu F, Jiang F, Chen F, Liu Z
Journal of Inflammation Research 2025, 18:2409-2432
Published Date: 18 February 2025
Machine Learning-Based Identification and Experimental Validation of Hub Ferroptosis-Related Cuproptosis Genes in Lupus Nephritis
Zhang S, Hu W, Zhang Y, Huang C, He Z, Xu J, Lin S, Yang B, Chen X
Journal of Inflammation Research 2025, 18:11335-11353
Published Date: 18 August 2025