Back to Journals » Journal of Inflammation Research » Volume 16
Characteristics of Autophagy-Related Genes, Diagnostic Models, and Their Correlation with Immune Infiltration in Keratoconus
Authors Liu Y ![]() , Yang X, Li H, Li D, Zou Y, Gong B, Yu M
, Yang X, Li H, Li D, Zou Y, Gong B, Yu M
Received 21 May 2023
Accepted for publication 23 August 2023
Published 29 August 2023 Volume 2023:16 Pages 3763—3781
DOI https://doi.org/10.2147/JIR.S420164
Checked for plagiarism Yes
Review by Single anonymous peer review
Peer reviewer comments 2
Editor who approved publication: Dr Adam Bachstetter
Yi Liu,1– 3,* Xu Yang,3,* Huan Li,3,4 Dongfeng Li,1,2 Yuhao Zou,1,2 Bo Gong,4– 6 Man Yu1,2
1Department of Ophthalmology, Sichuan Provincial People’s Hospital, University of Electronic Science and Technology of China, Chengdu, People’s Republic of China; 2Chinese Academy of Sciences Sichuan Translational Medicine Research Hospital, Chengdu, People’s Republic of China; 3School of Medicine, University of Electronic Science and Technology of China, Chengdu, People’s Republic of China; 4Department of Health Management, Sichuan Academy of Medical Sciences & Sichuan Provincial People’s Hospital, University of Electronic Science and Technology of China, Chengdu, People’s Republic of China; 5Human Disease Genes Key Laboratory of Sichuan Province and Institute of Laboratory Medicine, Sichuan Academy of Medical Sciences & Sichuan Provincial People’s Hospital, University of Electronic Science and Technology of China, Chengdu, People’s Republic of China; 6Research Unit for Blindness Prevention of Chinese Academy of Medical Sciences (2019RU026), Sichuan Academy of Medical Sciences & Sichuan Provincial People’s Hospital, University of Electronic Science and Technology of China, Chengdu, People’s Republic of China
*These authors contributed equally to this work
Correspondence: Man Yu, Department of Ophthalmology, Sichuan Provincial People’s Hospital, University of Electronic Science and Technology of China, Chengdu, 610000, People’s Republic of China, Tel/Fax +8617708130597, Email [email protected] Bo Gong, Department of Health Management, Sichuan Academy of Medical Sciences & Sichuan Provincial People’s Hospital, University of Electronic Science and Technology of China, Chengdu, Sichuan, 610000, People’s Republic of China, Tel/Fax +8617708131021, Email [email protected]
Purpose: Keratoconus (KTCN) is one of the most common degenerative keratopathies, significantly affecting vision and even leading to blindness. This study identifies potential biomarkers of KTCN based on the characterization of autophagy-related genes (ARGs) and the construction of a diagnostic model; and explores their relevance to immune infiltrating cells in KTCN.
Methods: Gene Expression Omnibus (GEO) data were downloaded and ARGs were acquired from GeneCards and Molecular Signatures Database (MSigDB). Autophagy-related differential expression genes (ARDEGs) were discovered through the integration of differentially expressed genes (DEGs) with ARGs, while hub genes of KTCN were discovered by protein-protein interaction (PPI) network analysis. The probable biological roles of these hub ARDEGs were examined using functional enrichment analysis, and a KTCN diagnostic model was generated using the least absolute shrinkage and selection operator (LASSO) regression analysis. We also employed the CIBERSORTx and ssGSEA algorithms to identify potential regulatory pathways to compare the abundance of immune cell infiltrates and their association with hub genes. Finally, the hub gene expression levels were confirmed using validation datasets as well as blood samples from KTCN and healthy individuals.
Results: In this study, we identified 12 hub ARDEGs, of which 9 genes were substantially distinct between KTCN patients and normal groups. The LASSO risk score was used to generate the nomogram, and the calibration curve evaluated the model’s effective diagnostic performance (C index of 0.961). Patients with KTCN had greater percentages of M2 Macrophages and Gamma delta T cells, according to CIBERSORTx and ssGSEA. The outcomes of the bioinformatics analysis were supported by the DDIT3 and BINP3 expression levels in KTCN patients and healthy controls, according to the qRT-PCR data.
Conclusion: Five biomarkers (CFTR, PLIN2, DDIT3, BAG3, and BNIP3) and diagnostic models offer fresh perspectives on identifying and managing KTCN.
Keywords: keratoconus, autophagy-related genes, diagnostic model, biomarker, immune infiltration, bioinformatics analysis
Introduction
Keratoconus (KTCN) is a corneal dystrophy marked by a central or paracentral corneal cone-like protrusion that causes uneven astigmatism and different degrees of visual impairment.1–3 Acute corneal edema is a potential complication of serious cases, which usually leaves a corneal scar, and it is one of the primary justifications for corneal transplantation.4–6 The incidence and prevalence of KTCN vary widely globally due to differences in race, geographic location, and diagnostic criteria, ranging from 0.2 to 4790 per 100,000 people and 1.5 to 25 per 100,000 people/per year.7 KTCN typically develops during adolescence and accelerates in the third or fourth decade of life.3 Early detection and diagnosis of preclinical KTCN are crucial for effective management, making it necessary to explore the pathogenesis of KTCN.
Numerous previous studies have shown that KTCN is a complicated disease combining both genetic and environmental components, with a prevalence of first-degree relatives amongst KTCN patients that is about 15 to 67 times greater than that of the general population.8 Given the critical role of genetic factors in KTCN pathogenesis, a large number of studies have sought to investigate the disease’s etiology at the DNA, RNA, and protein levels using bioinformatics analysis. So far, dozens of candidate genes have been proposed to increase disease susceptibility. Yet, the function of these genes, including the key candidate genes Visual System Homeobox 1 (VSX1) and Superoxide Dismutase 1 (SOD1) genes, is still controversial, and the common pathogenesis of KTCN is still uncertain.9,10
Autophagy is a highly conserved cellular response to oxidative stress that involves removing damaged cellular components and organelles, providing protection against various pathologies.11–13 It promotes cellular growth, differentiation, survival, and homeostasis.12 Several ocular diseases, such as age-related macular degeneration (AMD), cataracts, diabetic retinopathy (DR), glaucoma, and keratoconus, have been linked to dysfunction failure in preliminary research.14,15 Recent investigations have highlighted autophagy’s significance in the development of KTCN. Specifically, heightened expression of microtubule-associated protein light chain 3 (LC3) and secreted frizzled-related protein-1 (SFRP-1) indicates programmed cell death and autophagy activity, which might potentially contribute to corneal stromal thinning in KTCN.16,17 Furthermore, increased expression of LC3, an autophagy marker, correlates with disease severity, indicating its potential as a marker for monitoring disease progression and staging.17 However, further research call to assess the usefulness of LC3 expression levels in disease management. In another study, reduced levels of LC3-II and lysosomal-associated membrane protein 1 (LAMP1) were observed in both the cone and peripheral regions of KTCN patients at different clinical grades.14 These results imply that dysregulation of autophagy might be crucial in KTCN pathogenesis and progression. Hence, exploring the potential autophagy-related genes (ARGs) of KTCN would present promising novel avenues for the diagnosis and therapy of KTCN.
Although KTCN has traditionally been thought of as a non-inflammatory disease, mounting data suggests that inflammatory and immunological responses might be involved. In patients with KTCN, there is an activation of T helper cell 17 (Th17), Th1, and Th2 cells in corneal tissue and peripheral blood, activation of IL-17 signaling pathways, and high expression of multiple inflammatory mediators, including interleukin 1 (IL-1), IL-6, tumor necrosis factor-alpha (TNF-α), transforming growth factor-beta (TGF-β), and matrix metalloproteinase 9 (MMP-9) in the tear fluid.18–21 Autophagy is known to modulate immune cell function and cytokine production during immune responses,22 although some immune cells and cytokines could also inhibit autophagy signaling.23 To investigate the immune mechanisms involved in disease development, it is crucial to assess the connection between ARGs and immune cells in KTCN.
Here, with a comprehensive assessment of the ARGs expression profile in KTCN, we aimed to identify diagnostic ARGs and construct a well-performing diagnostic model. Subsequently, we analyzed the immune-infiltrating microenvironment of KTCN and explored the correlation between these immune-infiltrating cells and ARGs for the first time. Overall, this research sheds light on the function of autophagy-related genes in the pathophysiology of KTCN and underlines their possibilities as therapeutic and diagnosis targets.
Materials and Methods
Data Collection and Processing
The “GEOquery” program fetched the relevant datasets of KTCN from the Gene Expression Omnibus (GEO) database (https://www.ncbi.nlm.nih.gov/geo/),24 including training (GSE112155 and GSE151631) and validation (GSE77938) datasets.25–27 The dataset information is shown in Table 1. The batch effect of the GSE112155 and GSE151631 data sets was eliminated by sva to obtain the combined dataset, which contains a total of 29 KTCN corneal samples and 17 normal corneal samples.28
 |
Table 1 GEO Dataset Information List |
In addition, a search of the GeneCards database (https://www.genecards.org/) for “Autophagy”, with only “Protein Coding” retained, yielded 7412 ARGs. A search for “Autophagy” in the Molecular Signatures Database (MSigDB, https://www.gsea-msigdb.org/gsea/msigdb) yielded 574 ARGs. A total of 537 ARGs were obtained after merging and de-duplication, and the details are shown in folder Table S1.
Identification of ARGs with Differential Expression
Before and after the batch effect was eliminated, principal component analysis (PCA) was performed on the dataset.29 PCA is a data dimensionality reduction method that extracts feature vectors (components) from high-dimensional data, converts them to low-dimensional data, and displays these features in a two- or three-dimensional graph. R packages of “limma” were applied to assess the combined dataset. Gene expression values of |log fold change|(|log FC|)>0.5 and adjusted p <0.05 were regarded as DEGs of KTCN. Genes with log FC > 0.5 and adjusted p < 0.05 are differentially expressed genes with upregulated expression, and genes with log FC < 0.5 and adjusted p < 0.05 are differentially expressed genes with downregulated expression. DEGs and ARGs were taken as intersections and plotted in Wayne Diagram to obtain autophagy-related differential expression genes (ARDEGs). R software packages “ggplot2” and “pheatmap” were used to draw volcano maps and heatmaps.
Construction of PPI Networks of ARDEGs
Protein-protein interaction (PPI) was formed based on the STRING database, with a minimum correlation factor greater than 0.400, and visualized using Cytoscape software.30 The cytoHubba was conducted to score each node gene by five algorithms, named, Degree Correlation (Degree), Edge Percolated Component (EPC), Maximal Clique Centrality (MCC), Maximum Neighborhood Component (MNC), and Closeness Centrality (Closeness).31 The top 15 genes sorted by each algorithm were used as hub genes after taking the intersection.
Construction of mRNA-miRNA, mRNA-TF Interaction Network
The interaction between miRNAs and hub genes was predicted based on the miRDB database and ENCORI database (https://starbase.sysu.edu.cn/).32 Data having a Target Score > 85 in the miRDB database and mRNA-miRNA data in the ENCORI database were intersected to create the mRNA-miRNA interaction network. The hTFtarget database (http://bioinfo.life.hust.edu.cn/hTFtarget) and the CHIPBase database (version 3.0) (https://rna.sysu.edu.cn/chipbase/) are then used to identify transcription factors (TFs) that bind to hub genes. Using the RCircos program, we also investigated the chromosomal location of hub genes.33–35
GO and KEGG Pathway Enrichment Analysis
We conducted enrichment analysis using the Kyoto Encyclopedia of Genes and Genomes (KEGG) pathways and Gene Ontology (GO) terms with the R package clusterProfiler,36 to predict the functionality of ARDEGs in KTCN.
Diagnostic Model Based on Hub Genes
The program “glmnet” was conducted to perform least absolute shrinkage and selection operator (LASSO) regression analysis on hub genes, with parameter seed=2020, family = “binomial”.37,38 Subsequently, logistic regression models of acquired genes were constructed by logistic regression analysis, and then the rms package was employed to generate a nomogram.39 The nomogram is based on multifactor regression analysis, in which a scale is set up to characterize the variables in a multifactor regression model, and a total score is calculated to predict the probability of an event occurring. The prediction accuracy of the nomogram was assessed using the concordance index (C index) of the calibration curve. Finally, the accuracy and discriminatory power of the logistics regression model were assessed using decision curve analysis (DCA) plots by R package ggDCA.40
Immune Infiltration Analysis (CIBERSORTx and ssGSEA)
The combined dataset’s immune cell infiltration was examined using the CIBERSORTx program.41 With the help of this analysis tool, 22 immune cells’ constitutions and population could be estimated. Besides, the accumulation of 28 immune cell types infiltrated in the combined dataset was measured using the single sample gene set enrichment analysis (ssGSEA) algorithm.42 To evaluate the relationship between immune cell infiltration and hub gene expression, the Pearson correlation was carried out.
Validation of Clinical Specimens
To confirm the selected genes, we enrolled 6 KTCN patients diagnosed with KTCN (case group) and 2 age sex-matched healthy controls (HC group) from the Sichuan Provincial People’s Hospital. All participants included in the study underwent a complete history assessment, general examination, and detailed ophthalmologic examination. And their corneal surface morphology, curvature variations, and central corneal thickness were obtained using pentacam (OCULUS Optikgeräte GmbH, Wetzlar, Germany). The diagnosis of KTCN was based on the 2015 keratoconus global consensus (essential clinical manifestations: abnormal posterior corneal surface heights, abnormal distribution of corneal thicknesses, and clinical noninflammatory corneal thinning).43 A hospital-based health screening center gave two healthy volunteers, which were excluded from ocular and other systemic diseases. The study, which followed the Declaration of Helsinki, received approval by the hospital’s medical ethics committee. All participants signed written consent forms after being fully informed. All trial participants—cases and controls—had their venous blood drawn.
The hub genes were expressed quantitatively using the quantitative reverse transcription-polymerase chain reaction (qRT-PCR). Peripheral blood mononuclear cells (PBMC) were extracted from KTCN and HC blood samples using Ficoll solution (Cytiva, USA). Total RNA was isolated from PBMC using TRIZol Up reagent (TransGen Biotech, Beijing, China). Then the cDNA was generated according to TransScript® All-in-One First-Strand cDNA Synthesis SuperMix for qPCR (TransGen Biotech, Beijing, China). ABI 7500 Real-Time PCR System (Applied Bioscience, Foster City, CA, USA) was utilized to analyze the amplified cDNA after using PerfectStart® Green qPCR SuperMix(+DyeI /+Dye II). The relative expression levels were normalized to GAPDH. Table S2 includes primers (Sangon Biotech Co., Ltd, Shanghai, China). With GAPDH as the standard, the 2−ΔΔCT method was used for calculating the relative expression of mRNA.
Statistical Analysis
R software (Version 4.1.2) serves as the foundation for all data analyses, and for comparisons of two consecutive groups, the statistical significance of normally distributed variables was estimated by an independent Student’s t-test. The Kruskal–Wallis test was employed for group comparisons involving three or more. To evaluate and examine the statistical significance between two groups of categorical variables, the chi-square test or Fisher’s exact test was used. The correlation coefficients between different molecules were computed for the findings using Spearman correlation analysis. If not specifically indicated, the statistical significance threshold of 0.05 was met by all two-sided statistical P-values.
Results
Figure 1 depicts the study’s methodology.
 |
Figure 1 Flowchart of the Research Methodologies. |
Identification and Functional Enrichment Analysis of Differentially Expressed ARGs
As shown in Figure 2A and B, the batch effect of the samples of GSE112155 and GSE151631 datasets was eliminated using the R package “sva”. The combined dataset detected 1454 DEGs in total, including 676 upregulated and 777 downregulated genes, and DEGs were visualized by the volcano map (Figure 3A). After taking the intersection of DEGs and ARGs, 42 ARDEGs were found, as shown in the Wayne map (Figure 3B). Heatmap was drawn to demonstrate the differences in expression of these identified ARDEGs (Figure 3C).
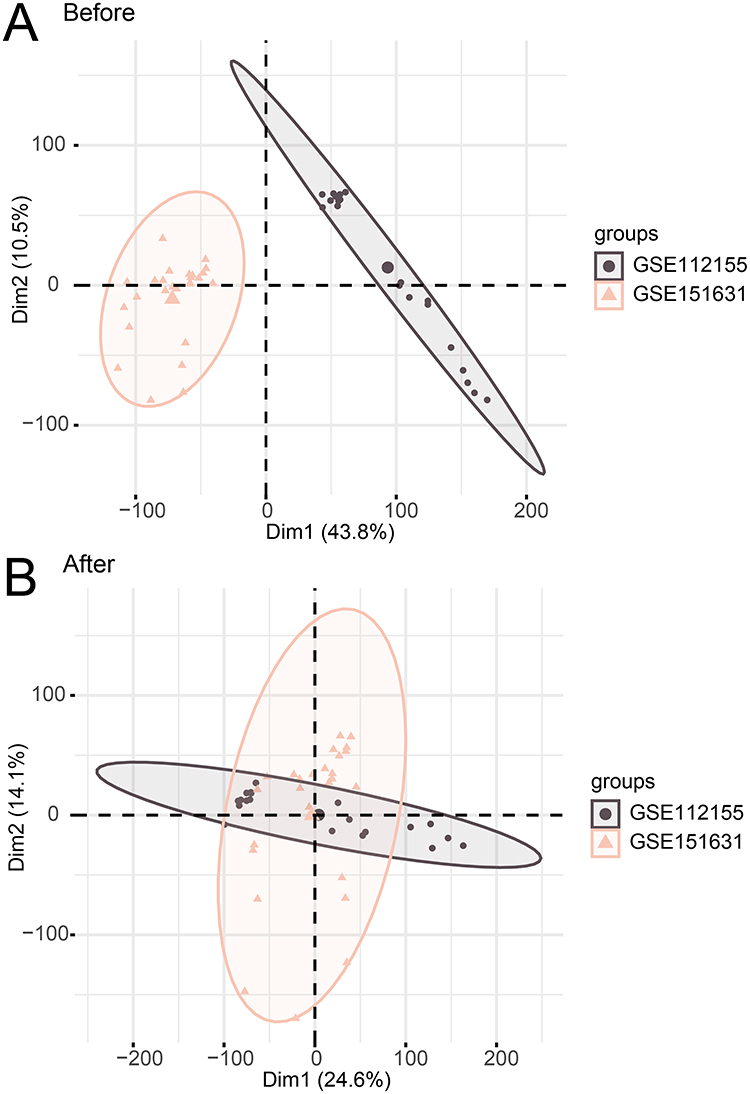 |
Figure 2 Data set integration. (A) Two-dimensional PCA of the merged dataset before correction. (B) Two-dimensional PCA of the merged dataset after correction. |
 |
Figure 3 Analysis of autophagy-related differentially expressed genes. (A) Volcano map of DEGs in the KTCN and Normal groups of the combined dataset. (B) Wayne diagram of DEGs and ARGs. (C) Heatmap of ARDEGs in the KTCN and Normal groups of the combined dataset. (D) A histogram representing the ARDEGs’ GO analysis findings. (E) A histogram representing the ARDEGs’ KEGG analysis findings. |
The biological processes and pathways of ARDEGs were elucidated using GO and KEGG analyses. As presented in Figure 3D, in the category of biological process (BP), the ARDEGs were notably enriched in terms of regulation of autophagy, autophagy, regulation of binding, and macroautophagy. In the cellular component (CC) category, the ARDEGs were markedly concentrated in terms of endosome membrane, autophagosome, outer membrane, and microtubule. The ARDEGs were noticeably enriched in the molecular function (MF) category for GTP binding, the structural constituent of cytoskeleton, and protein serine/threonine kinase activity GTPase activity. To determine the connection between DEGs and signaling pathways, KEGG analysis was performed in Figure 3E. The pathways of amyotrophic lateral sclerosis, neurodegeneration - multiple diseases, and Alzheimer’s disease were largely enriched in the ARDEGs. Overall, ARDEG might contribute to the pathogenesis of KTCN by modulating autophagy and kinases and is mainly related to degenerative diseases of the nervous system.
The PPI Network and mRNA-miRNA, mRNA-TF Interaction Network of ARDEGs
To determine the interactions between the 42 ARDEGs, the Cytoscape program was conducted to construct and display a PPI network (Figure 4A). A total of 33 ARDEGs interacted with other genes. Then we examined the ARDEG values under the five algorithms of MCC, EPC, Degree, MNC, and Closeness using the cytoHubba insert-in, and the intersection of top 15 genes sorted by each of the five algorithms was taken as the hub genes (Figure 4B). In total, 12 hub genes were selected, including SQSTM1, UBC, IL6, GFAP, CFTR, HMOX1, PLIN2, TUBB4A, DDIT3, BAG3, BNIP3, and TGFB1 (Table S3).
 |
Figure 4 PPI network and mRNA-miRNA, mRNA-TF interaction network. (A) PPI network of ARDEGs. (B) Venn diagram of shared genes for the top 15 ARDEGs selected under the five algorithms of MCC, MNC, EPC, Degree, and Closeness. (C and D) mRNA-miRNA (C), mRNA-TF (D) interactions network of hub genes. (E) The chromosome of hub genes Localization map. In C-D, green circular blocks are mRNAs; purple-pink circular blocks are miRNAs; Orange circular blocks are specific TFs. |
Then, by developing an mRNA-miRNA, mRNA-TF interaction network, we explored the regulatory process of 12 hub genes in KTCN. As shown in Figure 4C, the mRNA-miRNA interaction network consisted of 9 targeting mRNAs and 31 miRNAs. In the mRNA-TF interaction network, 11 genes and 186 TFs interacted, among which the hub gene UBC had the most interaction relationships with TFs, targeting 160 TFs at the same time (Figure 4D). Finally, by mapping the localization of 12 hub genes on human chromosomes, we discovered the hub genes were primarily distributed on chromosomes 5, 7, 9, 10, 12, 17, 19, and 22 (Figure 4E).
Diagnostic Model Based on Hub Genes
To evaluate hub genes’ diagnostic utility, we used LASSO regression analysis (Figure 5A and B) and identified six hub genes (BAG3, CFTR, DDIT3, GFAP, PLIN2, TUBB4A) according to the optimal lambda value. Figure 5C visualizes the six hub genes’ expression levels between KTCN and the control group, and the average expression of BAG3 is the highest.
 |
Figure 5 Construction of the diagnostic model of hub genes and diagnostic performance. (A) Value of the 12 genes’ log (Lambda) in the LASSO model. (B) The most proper log (Lambda) value in the LASSO model. (C) Forest plot of the six selected genes in the diagnostic model. (D) Nomogram of the LASSO risk score. (E) Nomogram of the expression of 6 hub genes. (F) Calibration plot of the LASSO risk score model. (G) DCA plot of the 6 hub genes. (H) DCA plot of the LASSO risk score. In the DCA plot, the x-axis denotes the threshold probability, and the y-axis, the net benefit. |
Logistic regression analysis was performed separately for the LASSO risk score and the 6 hub genes’ expression in the combined dataset. The diagnostic nomogram of the LASSO risk score and expression of the six hub genes was then built by nomogram analysis (Figure 5D and E). For a visual evaluation of the diagnostic model’s performance based on the LASSO risk score, the calibration plot (Figure 5F) was developed, and the result showed that the nomogram’s projected results were reliable (C-index is 0.961). In addition, two diagnostic models were evaluated using DCA plots, as a result, the diagnostic model of the LASSO risk score was superior to the model with six hub genes, and this model might improve the outcomes of patients (Figure 5G and H).
Diagnostic Value of Hub Genes in KTCN
To assess whether individual genes could be used to distinguish KTCN from healthy controls, 12 hub genes were first analyzed for differential expression in different subgroups. In Figure 6A, the expression of BAG3, CFTR, DDIT3, HMOX1, IL6, PLIN2, TGFB1, and UBC was considerably decreased in KTCN patients, while BNIP3 expression in the KTCN group was significantly elevated. Subsequently, ROC analysis of these nine genes showed that their area under the curve (AUC) values were greater than 0.70 (Figure 6B-J), indicating that they all have certain accuracy for the diagnosis of KTCN. The AUC values of BAG3, DDIT3, HMOX1, IL6, and UBC are more than 0.80, which is considered as having excellent diagnostic specificity and sensitivity.
 |
Figure 6 Expression of hub genes in the combined dataset. (A) Comparison graph of the grouping of hub genes in the KTCN and Normal groups in the combined dataset. (B-J) Correlation scatter plots of TGFB1 and BAG3 (C), SQSTM1 and HMOX1 (D), UBC and HMOX1 (E), UBC and SQSTM1 (F), CFTR and BAG3 (G), HMOX1 and CFTR (H), TGFB1 and CFTR (I), and TUBB4A and CFTR (J). *P < 0.05; ** P < 0.01; *** P < 0.001. |
The Immune Microenvironment of Keratoconus
To reveal the potential mechanisms of immune pathways in KTCN, we first analyzed the infiltration abundance of 22 immune cell types using CIBERSORTx. The results revealed that the KTCN patients had a much higher fraction of M2 Macrophages than controls, while the proportion of M0 Macrophages and T cells regulatory (Tregs) was significantly lower than in controls (Figure 7A). Figure 7B-D shows the association analysis between these immune cells and hub genes. M0 Macrophages and HMOX1 were in the highest positive correlation; M2 Macrophages and HMOX1 had the highest negative correlation; Tregs and SQSTM1 had the highest positive correlation.
 |
Figure 7 Immuno-infiltration analysis of the combined data set (CIBERSORTx). (A) Grouped comparison plots of immune cells in different subgroups in the combined dataset. (B-D) Lollipop charts of correlation of immune cells M0 Macrophages (B), M2 Macrophages (C), and Tregs (D) with hub genes. *P < 0.05, **P < 0.01, ***P < 0.001. |
Subsequently, the differences between the infiltration of 28 immune cell types in the KTCN and Normal groups were examined using the ssGSEA approach (Figure 8A), which demonstrated that KTCN patients had a higher proportion of Gamma delta T cells, whereas the proportion of plasmacytoid dendritic cells (pDC), NK cells, central memory CD8 T cells, and effector memory CD8 T cells were observably lower than those in the controls. Correlation analysis between these immune cells was then evaluated (Figure 8B-F). Among them, NK cells and central memory CD8 T cells (r=0.608, p<0.001), and central memory CD8 T cells and plasmacytoid dendritic cells (r=0.674, p<0.001) have the highest positive correlation. The highest negative correlations were found between effector memory CD8 T cells and gamma delta T cells (r=−0.392, p=0.007), and between NK cells and Gamma delta T cells (r=−0.438, p=0.003). Besides, to investigate the link between immunity and autophagy, we further analyzed the correlation between hub genes and immune cells. As shown in Figure 8G-K, pDC has the highest positive correlations with TGFB1 (Figure 8H) and UBC (Figure 8I) at the same time; the highest negative correlations were found between CFTR and pDC (Figure 8J), and DDIT3 and Gamma delta T cells (Figure 8K).
 |
Figure 8 Immuno-infiltration analysis of the combined data set (ssGSEA). (A) Grouping comparison plots of immune cells under different groupings of KTCN and Normal. B. Heatmap of correlation between immune cells. (C-F) Correlation scatter diagram of central memory CD8 T cells and Natural killer cells (C), central memory CD8 T cells and pDC (D), gamma delta T cell and effector memory CD8 T cell (E), and natural killer cell and gamma delta T cell (F). (G) Heatmap of correlation between hub genes and immune cells. (H-K) Correlation scatter diagram of TGFB1 and pDC (H), UBC and pDC (I), CFTR and pDC (J), DDIT3 and gamma delta T cell (K). ns, not significant, * P < 0.05, ** P < 0.01, *** P < 0.001. |
Expression Verification of Hub Genes by GSE77938 Dataset and qRT-PCR in Clinical Samples
To verify whether hub genes have the same differential expression and expression trends in other datasets, we analyzed the 12 hub genes’ expressions in the GSE77938 dataset (Figure 9A). Among them, BNIP3 and CFTR had significant (p<0.05) expression differences under KTCN and normal groupings, and the expression trends were consistent with the combined dataset. And ROC curve (Figure 9B and C) showed that BNIP3 (AUC=0.875, CI: 0.679–1.000) and CFTR (AUC=0.859, CI:0.669–1.000) had certain diagnostic specificity and sensitivity on KTCN and Normal groupings.
 |
Figure 9 Expression validation of hub genes in the GSE77938 dataset. (A) Grouping comparison plot of hub genes under KTCN grouping and normal grouping in the GSE77938 dataset. (B) ROC curve of BNIP3. (C) ROC curve of CFTR. * P < 0.05; ** P < 0.01. |
In addition, from patients (n=6) and healthy controls (n=2), we obtained blood samples for qRT-PCR. The findings demonstrated that SQSTM1, DDIT3, and BINP3 mRNA expression levels were considerably downregulating in KTCN patients. While the level of HMOX1 was significantly elevated in KTCN patients. Only the trends of DDIT3 and BINP3 were consistent with our bioinformatics analysis (Figure 10A and B). These results suggest that they might be the diagnostic biomarker for KTCN.
 |
Figure 10 Quantitative real-time PCR results for hub genes in healthy controls (HC) and KTCN patients. (A) qRT-PCR result for DDIT3 in HC and KTCN patients. (B) qRT-PCR result for BNIP3 in HC and KTCN patients. **P < 0.01, ****P < 0.0001. |
Discussion
Despite more than 160 years of research exploring the pathophysiology of KTCN since it was accurately defined by Nottingham,44 its pathogenesis remains an enigma. Although various treatment options, such as corneal cross-linking, contact lenses, and corneal transplant surgery, each has potential benefits and drawbacks, none of them can fundamentally prevent the progress of the disease. Therefore, early identification and intervention are still a great challenge to be addressed.
In recent years, the importance of autophagy has attracted more attention, as a double-edged sword, in the development of various ocular diseases.45,46 Growing amounts of research are being done on the biomarkers of KTCN. For instance, SQSTM1, an autophagy receptor, was found to increase in the cone area of KTCN patients compared to healthy controls and non-disease areas.14 Conversely, Yildiz et al, in their study, did not observe any significant difference in SQSTM1’s level in the corneal epithelium between the KTCN group and healthy controls.47 In contrast to the above findings, our study revealed lower expression levels of SQSTM1 in KTCN patients than in healthy controls. Moreover, several previous studies have reported significantly elevated IL-6 levels in the tears of KTCN patients, which has a significant correlation with disease severity and corneal structural damage.48–50 A recent study identified potential genes associated with cone corneas and allergic diseases, IL6 was identified as one of 12 hub genes, suggesting that the inflammatory environment might be critical in the pathogenesis of KTCN. In our study’s validation dataset, the AUC value of IL6 was 0.829, demonstrating its excellent diagnostic effect. Furthermore, earlier studies have reported overexpressed TGF-β1 mRNA in KTCN corneal fibroblasts, which was three times more than that in non-KTCN corneal fibroblasts,51 while our analysis found no discernible difference. In integrating text mining, TGFB1 was also discovered to be one of the hub genes of KTCN. In our study, TGFB1 had certain diagnostic accuracy as a diagnostic biomarker of KTCN. To our knowledge, only Wang et al established a diagnostic model for KTCN based on immune-related DEGs and identified eight diagnostic biomarkers, including Smad7, CDKN1A, JUN, AREG, BBC3, DUSP2, map3k8, and LIF with an AUC value of 0.860 for the combination of eight genes).52 Yet, nothing is known regarding the expression characteristics of ARGs in KTCN.
This study identified 42 potential ARDEGs and 12 hub genes of KTCN (SQSTM1, UBC, IL6, GFAP, CFTR, HMOX1, PLIN2, TUBB4A, DDIT3, BAG3, BNIP3, and TGFB1) by bioinformatics analysis. These ARDEGs’ biological functions were assessed by biological function enrichment analysis, and the results indicated that autophagy and its regulation are significant in the pathophysiology of KTCN. In addition, the KEGG pathway was enriched in various neurodegenerative diseases, suggesting that the pathogenesis of KTCN might have similar characteristics to degenerative diseases. Subsequently, using the LASSO risk score, we constructed a nomogram, including 6 hub ARDEGs (BAG3, CFTR, DDIT3, GFAP, PLIN2, TUBB4A), and calibration plots (C-index of 0.961) and DCA validated this nomogram’s the effective performance and confirmed its ability to effectively predict patients. To further search for diagnostic biomarkers of KTCN, we compared the expression variations of 12 hub genes within the KTCN and normal groups. As a result, we identified 9 biomarkers: BAG3, BNIP3, CFTR, DDIT3, HMOX1, IL6, PLIN2, TGFB1, and UBC, all of which had great diagnostic specificity and sensitivity.
Notably, CFTR, PLIN2, DDIT3, and BAG3 showed exceptional diagnostic values in the LASSO risk score and ROC curve. Additionally, the diagnostic value of down-regulation of BINP3 expression in KTCN has been verified through the validation dataset and qRT-PCR. As a cystic fibrosis gene, cystic fibrosis transmembrane conductance regulator (CFTR) is a unique ATP-binding cassette transporter family member. It is not only an anion channel that is vital in the pathogenesis of cystic fibrosis, but also an important regulator of the development of several tumors.53 CFTR is overexpressed in ocular surface epithelial cells and is vital in chloride ion-driven tear secretion.54 CFTR activators are potential targets for current therapy for dry eye diseases (DED).55 In our study, CFTR exhibited remarkable diagnostic performance in both test and validation datasets, which might be a valuable biomarker for the diagnosis of KTCN.
The Perilipin2 (PLIN2) gene encodes a lipid droplet protein marker whose absence enhances autophagy and affects lipid metabolism in the liver.56 PLIN2 has been identified as a potential diagnostic and therapeutic biomarker for gastric cancer through gene regulation involved in ferroptosis and lipid metabolism.57 Nevertheless, there is much little known about the role of PLIN2 in ocular diseases. We proposed that, for the first time, PLIN2 might be a potential biomarker of KTCN. Although our results demonstrate the value of PLIN2 in the nomogram and ROC curve analysis, it was neither verified through qRT-PCR nor in the validation dataset. Thus, further investigation is necessary to confirm its potential role as a reliable KTCN biomarker.
DNA Damage Inducible Transcript 3 (DDIT3) is a typical endoplasmic reticulum stress marker and a vital downstream gene for autophagy initiation.58 It has been demonstrated in earlier research that the transcription factor DDIT3 regulates retinal ganglion cell damage in a variety of neurodegenerative disorders, including glaucoma.59,60 In addition, DDIT3 is also known to be involved in mediating corneal epithelial death, thereby contributing to the pathogenesis of DED.61 In our study, DDIT3 had the highest diagnostic efficacy in the training dataset, and qRT-PCR verified its excellent ability to differentiate KTCN patients and healthy controls. It is also meaningful in the LASSO diagnostic model. We speculate that DDIT3, a pro-apoptosis gene, might control or indicate the balance between autophagy and apoptosis in KTCN; additional research is required to determine if this is cause or effect.
Bcl2-associated athanogene-3 (BAG3) is a multi-structural domain protein belonging to the BAG family that restricts apoptosis by coupling to B-cell lymphoma-2 (bcl2).62 Among the family, BAG3 is the only protein identified so far responsible for determining cell fate due to its important paracrine role in the autophagic process.63 Extensive research has focused on BAG3’s role in various cancers, heart diseases, and degenerative diseases, given that targeting BAG3 is an emerging strategy to regulate autophagy processes.64–67 In our established LASSO diagnostic model, BAG3 exhibited the highest average expression and was also accurate as an independent diagnostic biomarker. There are no reports about BAG3 in KTCN yet, and further exploring the autophagy regulation of BAG3 in KTCN might provide us with novel therapeutic strategies.
BCL2 interacting protein 3 (BNIP3), an atypical member of the BCL-2 family, encodes a direct receptor for mitochondrial autophagy. It regulates apoptosis through the BH3 structural domain and also induces mitochondrial autophagy through the LC3 interacting region (LIR).68 BINP3-mediated mitochondrial autophagy has been demonstrated to be necessary for the preservation and acquisition of stem cell pluripotency.69 BINP3 was significantly upregulated in human keratoconus cells after different subtypes of TGF-β treatment, suggesting that mitochondrial dysfunction is a key factor in KTCN.70 However, a recent study found no discernible difference in the expression of BNIP3 between KTCN patients and the control group.47 In our study, apart from great diagnostic efficacy in the training dataset, BINP3 also showed the best diagnostic effect in the validation dataset. What’s more, peripheral blood samples from KTCN patients and healthy controls provided further supporting evidence. Aberrant BINP3 expression might suggest the presence of mitochondrial dysregulation in KTCN patients and is expected to be a valid biomarker for KTCN. Taken together, these genes might be important markers in KTCN, and further work is needed to elucidate their potential molecular mechanisms.
To provide potential mechanistic studies for future interventions, mRNA-miRNA and mRNA-TF interaction networks have been constructed. Among these genes, UBC exhibited the highest number of interactions with TFs, and we hypothesize that it is a major regulatory target in the transcriptional regulation of autophagy-related genes, which is crucial for the development of KTCN. More research is required to explore the RNA targets and particular mechanisms of miRNAs and TFs involved in regulating DEARGs in KTCN.
Based on the vital function of immunity in KTCN, Wang’s study compared immune infiltrating cells in KTCN with controls using ssGEEA and identified 18 significantly different immune cells.52 However, there have been no systematic studies elucidating the interaction between autophagy and immune cells in KTCN. Therefore, we first performed a comprehensive assessment of ARDEGs and immune infiltrating cells in KTCN using CIBERSORTx and ssGSEA. Our findings revealed that the proportion of gamma delta T cells and M2 Macrophages was significantly higher in KTCN patients than in controls. However, compared to the controls, the proportion of M0 Macrophages, Tregs, pDC, NK cells, central memory CD8 T cells, and effector memory CD8 T cells was much lower. Among these cells, gamma delta T cells, Tregs, NK cells, and effector memory CD8 T cells expression was consistent with the results of Wang’s study.52 The difference in some results might be attributed to the different datasets we selected for analysis. Gamma delta T cells are central to local immunity in the conjunctiva,71 which highly expresses IL-17A. A previous study reported ocular surface gamma delta T cells proportion in patients with KTCN is much higher, consistent with our results.50 Conversely, another study reported the proportion of NK cells in the ocular surface of KTCN is much higher, which requires further validation.50 Except for gamma delta T cells and NK cells, the remaining sic immune cells must be further investigated in vivo and in vitro investigations since they have not been previously reported in KTCN. Then the correlation between hub genes and the infiltration abundance of the above eight immune cells was analyzed. Our results revealed a correlation between them, and pDC had a good positive correlation with TGFB1 and UBC respectively (r > 0.7, P < 0.001). These findings indicate that the interaction between autophagy and immune response might be vital in the pathogenesis of KTCN, and further researches need to elucidate the mechanism of their interaction.
Unavoidably, this study has some limitations. First, our study is a secondary mining and analysis of a previously published dataset, and prospective data are necessary to validate its clinical value. Second, the nomogram we created did not incorporate clinical parameters, and its predictive capacity may improve if clinical factors were added. Third, it is unclear whether the diagnostic model based on ARDEGs is specific to KTCN only. For example, it is not clear whether the model could differentiate between patients with KTCN and corneal dilatation. Fourth, the limited number of clinical samples we used and the fact that these ARDEGs’ expression was validated using patients’ blood, while corneal tissue derived from our bioinformatics analysis, might have confounded the factors in our analysis and need to be confirmed further in multicenter, large-scale clinical trials and prospective studies for further validation.
Conclusion
In conclusion, we identified four ARGs (CFTR, PLIN2, DDIT3, and BAG3) as potential characteristic biomarkers of KTCN. In addition, the KTCN diagnostic model constructed using the LASSO risk score might provide a reliable predictive method for the diagnosis of KTCN patients. Finally, immune cell infiltration and correlation analysis of KTCN suggested that the interaction between the immune response and autophagy might be involved in the pathogenesis of KTCN. These findings not only provide potential diagnostic biomarkers for KTCN patients but also enhance our understanding of the regulatory mechanisms of ARDEGs and immune cells in KTCN, which helps to develop more effective therapeutic strategies.
Data Sharing Statement
The data of KTCN was downloaded from the Gene Expression Omnibus (GEO) database (https://www.ncbi.nlm.nih.gov/geo/). The data of autophagy-related genes were yield from GeneCards database (https://www.genecards.org/) and Molecular Signatures Database (MSigDB, https://www.gsea-msigdb.org/gsea/msigdb).
Ethics Approval and Informed Consent
The study, which followed the Declaration of Helsinki, was approved by the Ethics Committee of Sichuan Academy of Medical Sciences · Sichuan Provincial People’s Hospital (2023-108). All participants gave their consent in writing after being fully informed.
Acknowledgments
This study is supported by the National Natural Science Foundation of China (82070928 M.Y. and 82371060 B.G.), and Huanhua Talent Program of Sichuan Provincial People’s Hospital (SY2022023), Chengdu Science and Technology Bureau (2022-YF05-01936-SN), and the Department of Science & Technology of Sichuan Province(2022JDTD0024).
Disclosure
The authors report no conflicts of interest in this work.
References
1. Ferrari G, Rama P. The keratoconus enigma: a review with emphasis on pathogenesis. Ocul Surf. 2020;18(3):363–373. doi:10.1016/j.jtos.2020.03.006
2. Hashemi H, Heydarian S, Hooshmand E, et al. The prevalence and risk factors for keratoconus: a systematic review and meta-analysis. Cornea. 2020;39(2):263–270. doi:10.1097/ico.0000000000002150
3. Rabinowitz Y. Keratoconus. Surv Ophthalmol. 1998;42(4):297–319. doi:10.1016/s0039-6257(97)00119-7
4. Fan Gaskin J, Patel D, McGhee C. Acute corneal hydrops in keratoconus - new perspectives. Am J Ophthalmol. 2014;157(5):921–928. doi:10.1016/j.ajo.2014.01.017
5. Gao H, Huang T, Pan Z, et al. Survey report on keratoplasty in China: a 5-year review from 2014 to 2018. PLoS One. 2020;15(10):e0239939. doi:10.1371/journal.pone.0239939
6. Gain P, Jullienne R, He Z, et al. Global Survey of Corneal Transplantation and Eye Banking. JAMA Ophthalmol. 2016;134(2):167–173. doi:10.1001/jamaophthalmol.2015.4776
7. Santodomingo-Rubido J, Carracedo G, Suzaki A, Villa-Collar C, Vincent S, Wolffsohn J. Keratoconus: an updated review. J Br Contact Lens Assoc. 2022;45(3):101559. doi:10.1016/j.clae.2021.101559
8. Wang Y, Rabinowitz Y, Rotter J, Yang H. Genetic epidemiological study of keratoconus: evidence for major gene determination. Am J Med Genet. 2000;93(5):403–409. doi:10.1002/1096-8628(20000828)93:5
9. Héon E, Greenberg A, Kopp K, et al. VSX1: a gene for posterior polymorphous dystrophy and keratoconus. Hum Mol Genet. 2002;11(9):1029–1036. doi:10.1093/hmg/11.9.1029
10. Udar N, Atilano S, Brown D, et al. SOD1: a candidate gene for keratoconus. Invest Ophthalmol Vis Sci. 2006;47(8):3345–3351. doi:10.1167/iovs.05-1500
11. Kiffin R, Bandyopadhyay U, Cuervo A. Oxidative stress and autophagy. Antioxid Redox Signal. 2006;8:152–162. doi:10.1089/ars.2006.8.152
12. Levine B, Kroemer G. Autophagy in the pathogenesis of disease. Cell. 2008;132(1):27–42. doi:10.1016/j.cell.2007.12.018
13. Mariño G, Madeo F, Kroemer G. Autophagy for tissue homeostasis and neuroprotection. Curr Opin Cell Biol. 2011;23(2):198–206. doi:10.1016/j.ceb.2010.10.001
14. Shetty R, Sharma A, Pahuja N, et al. Oxidative stress induces dysregulated autophagy in corneal epithelium of keratoconus patients. PLoS One. 2017;12(9):e0184628. doi:10.1371/journal.pone.0184628
15. Chai P, Ni H, Zhang H, Fan X. The evolving functions of autophagy in ocular health: a double-edged sword. Int J Biol Sci. 2016;12(11):1332–1340. doi:10.7150/ijbs.16245
16. Sutton G, Madigan M, Roufas A, McAvoy J. Secreted frizzled-related protein 1 (SFRP1) is highly upregulated in keratoconus epithelium: a novel finding highlighting a new potential focus for keratoconus research and treatment. Clin Experiment Ophthalmol. 2010;38(1):43–48. doi:10.1111/j.1442-9071.2009.02216.x
17. Iqbal O, Fisher G, Vira S, et al. Increased expression of secreted frizzled-related protein-1 and microtubule-associated protein light chain 3 in keratoconus. Cornea. 2013;32(5):702–707. doi:10.1097/ICO.0b013e318282987a
18. Lema I, Durán J. Inflammatory molecules in the tears of patients with keratoconus. Ophthalmology. 2005;112(4):654–659. doi:10.1016/j.ophtha.2004.11.050
19. Lema I, Sobrino T, Durán J, Brea D, Díez-Feijoo E. Subclinical keratoconus and inflammatory molecules from tears. Br J Ophthalmol. 2009;93(6):820–824. doi:10.1136/bjo.2008.144253
20. Jun A, Cope L, Speck C, et al. Subnormal cytokine profile in the tear fluid of keratoconus patients. PLoS One. 2011;6(1):e16437. doi:10.1371/journal.pone.0016437
21. Sun X, Zhang H, Shan M, et al. Comprehensive transcriptome analysis of patients with keratoconus highlights the regulation of immune responses and inflammatory processes. Front Genet. 2022;13:782709. doi:10.3389/fgene.2022.782709
22. Ma Y, Galluzzi L, Zitvogel L, Kroemer G. Autophagy and cellular immune responses. Immunity. 2013;39(2):211–227. doi:10.1016/j.immuni.2013.07.017
23. Jiang G, Tan Y, Wang H, et al. The relationship between autophagy and the immune system and its applications for tumor immunotherapy. Mol Cancer. 2019;18(1):17. doi:10.1186/s12943-019-0944-z
24. Davis S, Meltzer P. GEOquery: a bridge between the Gene Expression Omnibus (GEO) and BioConductor. Bioinformatics. 2007;23(14):1846–1847. doi:10.1093/bioinformatics/btm254
25. You J, Corley S, Wen L, et al. RNA-Seq analysis and comparison of corneal epithelium in keratoconus and myopia patients. Sci Rep. 2018;8(1):389. doi:10.1038/s41598-017-18480-x
26. Shinde V, Hu N, Mahale A, et al. RNA sequencing of corneas from two keratoconus patient groups identifies potential biomarkers and decreased NRF2-antioxidant responses. Sci Rep. 2020;10(1):9907. doi:10.1038/s41598-020-66735-x
27. Kabza M, Karolak J, Rydzanicz M, et al. Collagen synthesis disruption and downregulation of core elements of TGF-β, Hippo, and Wnt pathways in keratoconus corneas. Eur J Hum Genet. 2017;25(5):582–590. doi:10.1038/ejhg.2017.4
28. Leek J, Johnson W, Parker H, Jaffe A, Storey J. The sva package for removing batch effects and other unwanted variation in high-throughput experiments. Bioinformatics. 2012;28(6):882–883. doi:10.1093/bioinformatics/bts034
29. Ringnér M. What is principal component analysis? Nat Biotechnol. 2008;26(3):303–304. doi:10.1038/nbt0308-303
30. Shannon P, Markiel A, Ozier O, et al. Cytoscape: a software environment for integrated models of biomolecular interaction networks. Genome Res. 2003;13(11):2498–2504. doi:10.1101/gr.1239303
31. Chin C, Chen S, Wu H, Ho C, Ko M, Lin C. cytoHubba: identifying hub objects and sub-networks from complex interactome. BMC Syst Biol. 2014;S11. doi:10.1186/1752-0509-8-s4-s11
32. Li J, Liu S, Zhou H, Qu L, Yang J. starBase v2.0: decoding miRNA-ceRNA, miRNA-ncRNA and protein-RNA interaction networks from large-scale CLIP-Seq data. Nucleic Acids Res. 2014;42:D92–7. doi:10.1093/nar/gkt1248
33. Zhang Q, Liu W, Zhang H, et al. hTFtarget: a Comprehensive Database for Regulations of Human Transcription Factors and Their Targets. Genomics Proteomics Bioinformatics. 2020;18(2):120–128. doi:10.1016/j.gpb.2019.09.006
34. Zhou K, Liu S, Sun W, et al. ChIPBase v2.0: decoding transcriptional regulatory networks of non-coding RNAs and protein-coding genes from ChIP-seq data. Nucleic Acids Res. 2017;45:D43–D50. doi:10.1093/nar/gkw965
35. Zhang H, Meltzer P, Davis S. RCircos: an R package for Circos 2D track plots. BMC Bioinform. 2013;14:244. doi:10.1186/1471-2105-14-244
36. Yu G, Wang L, Han Y, He Q. clusterProfiler: an R package for comparing biological themes among gene clusters. OMICS. 2012;16(5):284–287. doi:10.1089/omi.2011.0118
37. Engebretsen S, Bohlin J. Statistical predictions with glmnet. Clin Epigenetics. 2019;11(1):123. doi:10.1186/s13148-019-0730-1
38. Cai W, van der Laan M. Nonparametric bootstrap inference for the targeted highly adaptive least absolute shrinkage and selection operator (LASSO) estimator. Int J Biostat. 2020. doi:10.1515/ijb-2017-0070
39. Park S. Nomogram: an analogue tool to deliver digital knowledge. J Thorac Cardiovasc Surg. 2018;155(4):1793. doi:10.1016/j.jtcvs.2017.12.107
40. Tataranni T, Piccoli C. Dichloroacetate (DCA) and Cancer: an Overview towards Clinical Applications. Oxid Med Cell Longev. 2019;2019:8201079. doi:10.1155/2019/8201079
41. Steen C, Liu C, Alizadeh A, Newman A. Profiling Cell Type Abundance and Expression in Bulk Tissues with CIBERSORTx. Methods Mol Biol. 2020;2117:135–157. doi:10.1007/978-1-0716-0301-7_7
42. Newman A, Liu C, Green M, et al. Robust enumeration of cell subsets from tissue expression profiles. Nat Methods. 2015;12(5):453–457. doi:10.1038/nmeth.3337
43. Gomes J, Tan D, Rapuano C, et al. Global consensus on keratoconus and ectatic diseases. Cornea. 2015;34(4):359–369. doi:10.1097/ico.0000000000000408
44. Grzybowski A, McGhee C. The early history of keratoconus prior to Nottingham’s landmark 1854 treatise on conical cornea: a review. Clin Exp Optom. 2013;96(2):140–145. doi:10.1111/cxo.12035
45. Hyttinen J, Blasiak J, Felszeghy S, Kaarniranta K. MicroRNAs in the regulation of autophagy and their possible use in age-related macular degeneration therapy. Ageing Res Rev. 2021;67:101260. doi:10.1016/j.arr.2021.101260
46. Feng L, Liang L, Zhang S, Yang J, Yue Y, Zhang X. HMGB1 downregulation in retinal pigment epithelial cells protects against diabetic retinopathy through the autophagy-lysosome pathway. Autophagy. 2022;18(2):320–339. doi:10.1080/15548627.2021.1926655
47. Yıldız E, Aydemir D, Zibandeh N, et al. Investigation of Mitophagy Biomarkers in Corneal Epithelium of Keratoconus Patients. Curr Eye Res. 2022;47(5):661–669. doi:10.1080/02713683.2022.2025846
48. Stival L, Avila L, Araujo D, et al. Correlation of hair cortisol and interleukin 6 with structural change in the active progression of keratoconus. J Cataract Refract Surg. 2022;48(5):591–598. doi:10.1097/j.jcrs.0000000000000809
49. Moura G, Santos A, Cenedeze M, et al. Increased lacrimal inflammatory mediators in patients with keratoconus. Mol Vis. 2021;27:656–665.
50. D’Souza S, Nair A, Sahu G, et al. Keratoconus patients exhibit a distinct ocular surface immune cell and inflammatory profile. Sci Rep. 2021;11(1):20891. doi:10.1038/s41598-021-99805-9
51. Saee-Rad S, Raoofian R, Mahbod M, et al. Analysis of superoxide dismutase 1, dual-specificity phosphatase 1, and transforming growth factor, beta 1 genes expression in keratoconic and non-keratoconic corneas. Mol Vis. 2013;19:2501–2507.
52. Wang L, Wang Y, Liu J, Zhao W. Identification of Important Genes of Keratoconus and Construction of the Diagnostic Model. Genet Res (Camb). 2022;2022:5878460. doi:10.1155/2022/5878460
53. Zhang J, Wang Y, Jiang X, Chan H. Cystic fibrosis transmembrane conductance regulator-emerging regulator of cancer. Cell Mol Life Sci. 2018;75(10):1737–1756. doi:10.1007/s00018-018-2755-6
54. Lee H, Park J, Kim B, Jun I, Kim T, Namkung W. Isorhamnetin Ameliorates Dry Eye Disease via CFTR Activation in Mice. Int J Mol Sci. 2021;22(8):3954. doi:10.3390/ijms22083954
55. Jeon D, Jun I, Lee H, et al. Novel CFTR Activator Cact-3 Ameliorates Ocular Surface Dysfunctions in Scopolamine-Induced Dry Eye Mice. Int J Mol Sci. 2022;23(9):5206. doi:10.3390/ijms23095206
56. Tsai T, Chen E, Li L, et al. The constitutive lipid droplet protein PLIN2 regulates autophagy in liver. Autophagy. 2017;13(7):1130–1144. doi:10.1080/15548627.2017.1319544
57. Sun X, Yang S, Feng X, et al. The modification of ferroptosis and abnormal lipometabolism through overexpression and knockdown of potential prognostic biomarker perilipin2 in gastric carcinoma. Gastric Cancer. 2020;23(2):241–259. doi:10.1007/s10120-019-01004-z
58. Woehlbier U, Hetz C. Modulating stress responses by the UPRosome: a matter of life and death. Trends Biochem Sci. 2011;36(6):329–337. doi:10.1016/j.tibs.2011.03.001
59. Huang H, Miao L, Liang F, et al. Neuroprotection by eIF2α-CHOP inhibition and XBP-1 activation in EAE/optic neuritiss. Cell Death Dis. 2017;8(7):e2936. doi:10.1038/cddis.2017.329
60. Marola O, Syc-Mazurek S, Libby R. DDIT3 (CHOP) contributes to retinal ganglion cell somal loss but not axonal degeneration in DBA/2J mice. Cell Death Discov. 2019;5:140. doi:10.1038/s41420-019-0220-4
61. Guindolet D, Woodward A, Gabison E, Argüeso P. Alleviation of Endoplasmic Reticulum Stress Enhances Human Corneal Epithelial Cell Viability under Hyperosmotic Conditions. Int J Mol Sci. 2022;23(9):4528. doi:10.3390/ijms23094528
62. Haudek S, Taffet G, Schneider M, Mann D. TNF provokes cardiomyocyte apoptosis and cardiac remodeling through activation of multiple cell death pathways. J Clin Invest. 2007;117(9):2692–2701. doi:10.1172/jci29134
63. Iwasaki M, Homma S, Hishiya A, Dolezal S, Reed J, Takayama S. BAG3 regulates motility and adhesion of epithelial cancer cells. Cancer Res. 2007;67(21):10252–10259. doi:10.1158/0008-5472.Can-07-0618
64. De Marco M, Falco A, Iaccarino R, et al. An emerging role for BAG3 in gynaecological malignancies. Br J Cancer. 2021;125(6):789–797. doi:10.1038/s41416-021-01446-2
65. Kirk J, Cheung J, Feldman A. Therapeutic targeting of BAG3: considering its complexity in cancer and heart disease. J Clin Invest. 2021;131(16):e149415. doi:10.1172/JCI149415
66. Qu H, Feldman A, Hakonarson H. Genetics of BAG3: a Paradigm for Developing Precision Therapies for Dilated Cardiomyopathies. J Am Heart Assoc. 2022;11(23):e027373. doi:10.1161/jaha.122.027373
67. Ying Z, Lv Q, Yao X, et al. BAG3 promotes autophagy and suppresses NLRP3 inflammasome activation in Parkinson’s disease. Ann Transl Med. 2022;10(22):1218. doi:10.21037/atm-22-5159
68. Hamacher-Brady A, Brady N. Mitophagy programs: mechanisms and physiological implications of mitochondrial targeting by autophagy. Cell Mol Life Sci. 2016;73(4):775–795. doi:10.1007/s00018-015-2087-8
69. Liu K, Zhao Q, Sun H, et al. BNIP3 (BCL2 interacting protein 3) regulates pluripotency by modulating mitochondrial homeostasis via mitophagy. Cell Death Dis. 2022;13(4):334. doi:10.1038/s41419-022-04795-9
70. Sarker-Nag A, Hutcheon A, Karamichos D. Mitochondrial Profile and Responses to TGF-β Ligands in Keratoconus. Curr Eye Res. 2016;41(7):900–907. doi:10.3109/02713683.2015.1078361
71. St Leger A, Desai J, Drummond R, et al. An Ocular Commensal Protects against Corneal Infection by Driving an Interleukin-17 Response from Mucosal γδ T Cells. Immunity. 2017;47(1):148–158.e5. doi:10.1016/j.immuni.2017.06.014
 © 2023 The Author(s). This work is published and licensed by Dove Medical Press Limited. The
full terms of this license are available at https://www.dovepress.com/terms
and incorporate the Creative Commons Attribution
- Non Commercial (unported, 3.0) License.
By accessing the work you hereby accept the Terms. Non-commercial uses of the work are permitted
without any further permission from Dove Medical Press Limited, provided the work is properly
attributed. For permission for commercial use of this work, please see paragraphs 4.2 and 5 of our Terms.
© 2023 The Author(s). This work is published and licensed by Dove Medical Press Limited. The
full terms of this license are available at https://www.dovepress.com/terms
and incorporate the Creative Commons Attribution
- Non Commercial (unported, 3.0) License.
By accessing the work you hereby accept the Terms. Non-commercial uses of the work are permitted
without any further permission from Dove Medical Press Limited, provided the work is properly
attributed. For permission for commercial use of this work, please see paragraphs 4.2 and 5 of our Terms.
Recommended articles
Identification of KRBA1 as a Potential Prognostic Biomarker Associated with Immune Infiltration and m6A Modification in Hepatocellular Carcinoma
Liu Y, Fu B, Yu Z, Song G, Zeng H, Gong Y, Ding Y, Huang D
Journal of Hepatocellular Carcinoma 2022, 9:497-516
Published Date: 31 May 2022
Expression, Clinical Significance, Immune Infiltration, and Regulation Network of miR-3940-5p in Lung Adenocarcinoma Based on Bioinformatic Analysis and Experimental Validation
Lin Z, Huang W, Xie Z, Yi Y, Li Z
International Journal of General Medicine 2022, 15:6451-6464
Published Date: 6 August 2022
CSTF2 Acts as a Prognostic Marker Correlated with Immune Infiltration in Hepatocellular Carcinoma
Zhang W, Wan Y, Zhang Y, Liu Q, Zhu X
Cancer Management and Research 2022, 14:2691-2709
Published Date: 12 September 2022
Downregulation of ST6GAL1 Promotes Liver Inflammation and Predicts Adverse Prognosis in Hepatocellular Carcinoma
Liu R, Cao X, Liang Y, Li X, Jin Q, Li Y, Du H, Zao X, Ye Y
Journal of Inflammation Research 2022, 15:5801-5814
Published Date: 10 October 2022
PPIH Expression Correlates with Tumor Aggressiveness and Immune Dysregulation in Hepatocellular Carcinoma
Bei J, Sun Z, Fu R, Huang X, Huang J, Luo Y, Li Y, Chen Y, Wei Z
Journal of Hepatocellular Carcinoma 2024, 11:2453-2470
Published Date: 11 December 2024