Back to Journals » Neuropsychiatric Disease and Treatment » Volume 15
Cerebrospinal Fluid Proteomics For Identification Of α2-Macroglobulin As A Potential Biomarker To Monitor Pharmacological Therapeutic Efficacy In Dopamine Dictated Disease States Of Parkinson’s Disease And Schizophrenia
Authors Gupta AK, Pokhriyal R, Khan MI, Kumar DR, Gupta R, Chadda RK, Ramachandran R, Goyal V, Tripathi M, Hariprasad G ![]()
Received 2 May 2019
Accepted for publication 13 August 2019
Published 2 October 2019 Volume 2019:15 Pages 2853—2867
DOI https://doi.org/10.2147/NDT.S214217
Checked for plagiarism Yes
Review by Single anonymous peer review
Peer reviewer comments 2
Editor who approved publication: Dr Roger Pinder
Ashish Kumar Gupta,1,* Ruchika Pokhriyal,1,* Mohd Imran Khan,1 Domada Ratna Kumar,1 Rishab Gupta,2 Rakesh Kumar Chadda,2 Rashmi Ramachandran,3 Vinay Goyal,4 Manjari Tripathi,4 Gururao Hariprasad1
1Department of Biophysics; 2Department of Psychiatry; 3Department of Anaesthesia; 4Department of Neurology, All India Institute of Medical Sciences, New Delhi 110029, India
*These authors contributed equally to this work
Correspondence: Gururao Hariprasad
Department of Biophysics, All India Institute of Medical Sciences, Ansari nagar, New Delhi 110029, India
Tel +91 11 26594029
Fax +91 11 26588663
Email [email protected]
Aim: Parkinson’s disease and schizophrenia are clinical end points of dopaminergic deficit and excess, respectively, in the mid-brain. In accordance, current pharmacological interventions aim to restore normal dopamine levels, the overshooting of which culminates in adverse effects which results in psychotic symptoms in Parkinson’s disease and extra-pyramidal symptoms in schizophrenia. Currently, there are no laboratory assays to assist treatment decisions or help foresee these drug side-effect outcomes. Therefore, the aim was to discover a protein biomarker that had a varying linear expression across the clinical dopaminergic spectrum.
Materials and methods: iTRAQ-based proteomic experiments along with mass spectrometric analysis was used for comparative proteomics using cerebrospinal fluid (CSF). CSF fluid was collected from 36 patients with Parkinson’s disease, 15 patients with urological diseases that served as neurological controls, and seven schizophrenic patients with hallucinations. Validation included ELISA and pathway analysis to highlight the varying expression and provide plausible molecular pathways for differentially expressed proteins in the three clinical phenotypes.
Results: Protein profiles were delineated in CSF from Parkinson’s disease patients, neurological control and schizophrenia, respectively. Ten of the proteins that were identified had a linear relationship across the dopaminergic spectrum. α-2-Macroglobulin showed to be having high statistical significance on inter-group comparison on validation studies using ELISA.
Conclusions: Non-gel-based proteomic experiments are an ideal platform to discover potential biomarkers that can be used to monitor pharmaco-therapeutic efficacy in dopamine-dictated clinical scenarios. α-2 Macroglobulin is a potential biomarker to monitor pharmacological therapy in Parkinson’s disease and schizophrenia.
Keywords: Parkinson’s disease, schizophrenia, iTRAQ proteomics, dopamine, biomarkers, therapeutic efficacy, alpha-2-macroglobulin
Introduction
Parkinson’s disease and schizophrenia are two neurological diseases that are very clinically diverse but are etiopathologically related to neurotransmitter dopamine. While the motor symptoms of Parkinson’s disease result from deficient dopamine-generating neurons, the psychotic symptoms of schizophrenia are related to an excess of dopaminergic activity.1 In accordance, the pharmacological interventions by clinicians, and their respective responses in Parkinson’s disease and schizophrenia, pertains to concentrations of dopamine in the mid-brain.2 Treatment in Parkinson’s disease is therefore given to enhance dopamine in the neurons of the brain, while medications in schizophrenia include drugs that reduce the synthesis and activity of dopamine as a signal between neurons in the mid-brain. Therefore, during the course of Parkinson’s therapy, dopamine levels tend to increase physiological levels, leading to symptoms of schizophrenia.3 Likewise, neuroleptic drugs that are used in the treatment of schizophrenia lower the amounts of dopamine and produce extra-pyramidal side effects.4 Although these side effects are slightly reduced with second-generation anti-psychotic drugs, problems that pertain to the side effects of medications continue to be reported.5
For diseases such as Parkinson’s and schizophrenia, a major hurdle is that there are currently no investigations that can guide treatment decisions or help predict adverse side effects of the drugs used. As a reason, there is a high probability of overshooting the point of normal dopaminergic state, resulting in patients succumbing to the side effects, which is a clinical state at the other end of the dopaminergic spectrum.6 The detailed neuro-anatomy, molecular pathology and side effects of current pharmacological interventions in Parkinson’s disease and schizophrenia have been comprehensively explained and reviewed by our group.7 Clinicians have to depend on patient compliance and symptoms to comprehend the efficacy of drugs that are administered.8 This causes a lot of inconvenience to patients and neurologists. This drawback also has an indirect social and economical constraint in society.
Clinical proteomics offers a platform to discover biomarkers to understand pathological states and treatment response.9–11 Potential biomarkers have been discovered in cerebrospinal fluid (CSF) using gel-based proteomic experiments for neurological diseases such as tubercular meningitis and Alzheimer’s disease.12,13 In our previous studies, we have highlighted the prospects of identifying protein biomarkers in serum and CSF to monitor the pharmaco-therapy of Parkinson’s disease and schizophrenia.14–16 In this study, we seek to identify potential biomarkers that are differentially expressed in the CSF across the dopaminergic-deficient state of Parkinson’s disease, the normal dopaminergic state, and the dopaminergic excess state of schizophrenia using isobaric Tag for Relative and Absolute Quantitation (iTRAQ). iTRAQ proteomic experiments have the following advantages: (1) they provide qualitative as well as quantitative analysis; (2) it is an amino acid independent tag labelling technology; (3) up to eight clinical phenotypes can be analyzed in a single experiment; and (4) low abundant protein quantification is possible. This should pave the way to monitor pharmacology-based therapeutic efficacy in the dopamine-mediated disorders of Parkinson’s disease and schizophrenia.
Methods
Ethics, Consent, Sample Collection
This study was approved by the ethics committee at All India Institute of Medical Sciences, New Delhi (IEC/NP-535/4.11.2013) and protocols followed were in accordance with the ethical standards formulated in the Helsinki Declaration. Screening of patients was done at neurology and psychiatry clinics at the institute as per the criteria provided below. Written informed consent was obtained from participants before obtaining CSF and for subsequent analysis. For neurological controls, patients with bladder, prostate and uterine pathologies were screened at urology and gynecology clinics, and recruited for surgeries for spinal anesthesia. Lumbar puncture was done by positioning the spinal needle between the two vertebral spines at the L4–L5 level. CSF (2 mL) was collected in sterile conditions, transported in microfuge tubes in an ice box and centrifuged at 4°C for 5 min at 3,000 rpm. The supernatant was aliquoted and stored at −80°C until further analysis. The tubes were placed on ice at the time of sample collection in the operating theaters. The samples were immediately centrifuged to eliminate any possible contamination by red blood cells (RBCs). They were then aliquoted to new sterile tubes, labeled and stored at −80°C. Quality control was ensured by CSF sample collection in sterile conditions during the operation. They were aliquoted and stored at −80°C and minimum freeze thawing of the samples was complied with to minimize protein degradation. Labeling, annotation and clinical date of collection was done in a disciplined manner. The peptide intensities on mass spectrometric analysis ensured consistent qualitative and quantitative information. The entire period of patient screening, recruitment and sample collection lasted nine months.
Patient Inclusion And Exclusion Criteria
Inclusion criteria: Patients with Parkinson’s disease were screened based on Unified Parkinson Disease Rating Scale (UPDRS), where a score of 0 represented no disability, 1 represented minimum disability and a score of 199 represented complete disability.17 The Hoehn and Yahr scale was used to describe the progress of symptoms in Parkinson’s patients and was graded from stage 1 to stage 5.18 Diagnosis of schizophrenia was made as per ICD 10.19 Naïve patients with Parkinson’s disease and schizophrenia were recruited for the discovery phase of experiments. The same naïve patients along with patients who were on pharmacological therapy were recruited for the validation phase of the study. Patients with urological disorders or pregnant women requiring surgical interventions under spinal anesthesia were admitted as neurological controls. At the time of recruitment, these patients were only taking nutritional supplements. Detailed clinical examination was carried out on these patients to rule out any neurological abnormalities. At the time of administering spinal anesthesia, lumbar puncture was done and the CSF was collected from these patients and was annotated as neurological control samples. Exclusion criteria: Patients with other co-existing pathologies and those patients on non-allopathic alternative forms of therapy were excluded from the study.
Chemicals And Consumables
Dithiothreitol (DTT), iodoacetamide and formic acid were purchased from Sigma (St. Louis, MO, USA). Trypsin (modified, sequencing grade) was purchased from Promega. The isobaric tags for relative and absolute quantitation (iTRAQ) reagents were procured from ABSciex (Foster City, CA, USA). The LC-MS grade water and acetonitrile were purchased from J. T. Baker. The cation exchange chromatography column was procured from ABSciex. ELISA conducted in this study was procured from Abcam. All other chemicals used in the experiments were of analytical grade.
Protein Quantification And Internal Standard
Two CSF samples from naïve Parkinson’s disease patients, two CSF samples from naïve schizophrenia and two CSF samples from neurological controls were taken for the discovery phase of the proteomic experiments by iTRAQ. Protein concentrations of CSF samples of each of these patients were determined using Bradford reagent (Sigma, USA). Equal concentrations of proteins from all these six samples were pooled as internal standard for the sake of normalization in each experiment.
Protein Digestion And Isobaric Tags For Relative And Absolute Quantitation Labeling
Protein (45 μg) from each sample was reduced with 25 mM DTT for 30 min at 60°C and alkylated with 55 mM iodoacetamide for 20 min at room temperature. Each of these protein samples were digested for 16 h with trypsin in a 1:10 ratio at 37°C. Digested peptides were labeled with iTRAQ reagents following the method provided by the manufacturer (ABSciex). The following experimental design used for the labeling of clinical phenotypes and internal standard. In brief, all vials of iTRAQ labeling tags 114, 115 and 116 were reconstituted in 70 μl of absolute ethanol. This was added to every sample and incubated for 2 h at room temperature, and the reaction was quenched using 50 μl milli-Q water. The three iTRAQ-labeled samples in each set were then pooled separately into a single vial and vacuum-dried using a vacuum concentrator (Eppendorf, USA). The dried samples were reconstituted in 8 mM ammonium formate buffer (pH 3) and were fractionated by cation exchange using an isotope-coded affinity tag-cartridge (ABSciex). Peptides were eluted with 500 μl of 35, 50, 75, 100, 125, 150, 250, 350, and 500 mM concentrations of ammonium formate buffer, pH 3, and vacuum-dried.
Reverse-Phase Separation And Mass Spectrometry Analysis
The peptide fractions were loaded onto a reverse-phase C18 analytical column associated with a trap column (ChromXP nano-LC Trap column 350 μm × 0.5 mm, 3 μm 120 Å). The peptide separation was performed using Eksigent nano-LC 425 coupled with triple Time-of-Flight (TOF)-6600 (ABSciex). The peptide fractions were pre-mixed in loading buffer (mobile phase A: 100% water and 0.1% formic acid) and 10 μL was loaded on a trap column with a flow rate of 2 μl/min. The retained peptides were washed isocratically by loading buffer for 45 min to remove excess salt. The peptides were resolved on an analytical column with a multi-step linear gradient of loading buffer and elution buffer (mobile phase B: 100% acetonitrile and 0.1% formic acid) at a flow rate of 250 nl/min. The gradient elution was initiated using 5% elution buffer and was held for 1 min, with linear increase of 10% for 10 min, 35% for 70 min, and 50% for 80 min. The gradient was maintained at 80% B for 8 min before being re-equilibrated to 5% B for 18 min. The Q-TOF 6600 (ABSciex) was operated in information-dependent acquisition (IDA) mode. The complete MS spectra were acquired in positive ion mode in an m/z ratio of 400–1600 Da, with a 0.25 seconds TOF-MS accumulation time, whereas the MS/MS product ion scan was performed in the mass range of 100–1,800 Da with an accumulation time of 0.07 seconds. The mass spectrometric settings were as follows: ion spray voltage floating: 2,400 V, curtain gas: 25, ion source gas 1:25, interface heater temperature: 75 °C, and declustering potential: 80 V. For 3 seconds, former target ions were excluded and 25 candidate ions were monitored per MS cycle. IDA advanced “rolling collision energy” was applied for subsequent MS and MS/MS scans.
Database Search And Analysis
Data in the constituted MS and MS/MS spectra scan were received from Triple TOF 6600 in the form of .wiff files. These .wiff files from each iTRAQ experiment were submitted for protein identification to ProteinPilot™ software (v.5.0.1, ABSciex), using a Paragon search method against Homo sapiensSwissProt database. The following search parameters were used: trypsin as the digestion enzyme with two missed cleavages, iodo-acetamide modification on cysteine residue, iTRAQ 3-plex modification of the N-termini of peptides and of the side chains of lysine, and proteins were identified with global protein false discovery rate (FDR) of 1%. From the search results obtained, the ratios with respect to internal standard were selected and the average of two sets of experiments was taken. Proteins which had a linear set of ratios across the three phenotypes of Parkinson’s disease, controls and schizophrenia were chosen for further analysis. Proteins with a total number of peptides identified with 95% confidence limit and, having a linear expression along the three phenotypes was estimated. Venny 2.1.0 (Bioinfo GP, CNB-CSIC) was used to group and compare the number of proteins across the three phenotypes on the basis of UNIPROT identifications.
Pathway Analysis
All the information about genes corresponding to identified proteins and their related functions were searched from NCBI and UNIPROT. The proteins were then studied for their biological interaction network in Parkinson’s disease and schizophrenia pathways using the KEGG and Schizo-Pi database.20 The Cytoscape v2.8.0 software21,22 and plugin Michigan Molecular Interactions (MiMI)23 were used to obtain and merge human gene regulatory interactome from well-known databases including STRING, MINT and HPRD.24–26 From this complete network, sub-networks for Parkinson’s disease and schizophrenia were extracted up to the first neighboring nodes using the plugin BiNoM v2.5. The resultant networks were merged using Cytoscape. A Venn/Euler diagram was used to delineate the intersection between Parkinson’s disease and schizophrenia and the interactions of the identified proteins were delineated.
ELISA
ELISA was carried for α2M concentrations in CSF samples of Parkinson’s disease, neurological controls, and schizophrenia as per the manufacturer’s protocol (ab108888). All reagents were equilibrated to room temperature prior to use. CSF (25 μL) was added to each well and incubated for 2 h at room temperature. The wells were washed with 200 μL of 1X wash buffer. Fifty microliters of 1X streptavidin–peroxidase conjugate was added to each well and incubated for 30 min. Fifty microliters of chromogen substrate was added to each well and incubated for 8 min. Fifty microliters of stop solution was added to each well. The absorbance was estimated at a wavelength of 450 nm. The concentrations of the protein were extrapolated from the standard curve obtained using biotinylated α2M. The concentrations of α2M in CSF from the three clinical phenotypes were represented as bar graphs. Inter-group comparisons for statistical analysis was done using Student's t-test.
Statistical Analysis
Data analysis was done using statistical software SPSS (IBM, version 23.0 Armonk, NY: IBM Corp.). For continuous variables, descriptive statistics such as mean, standard deviation (SD), median and inter-quartile range (IQR) values were calculated. For ELISA, mean of the concentrations was compared using a Student’s t-test. Because the number of study subjects in each group was small, distribution of age could not be assumed to follow normal distribution. Therefore, median values of age were compared using Mann–Whitney U-test/Kruskal–Wallis test as appropriate. Categorical variables were presented as frequency and percent values, and were compared by Chi-square/Fisher’s exact test. To see the correlation between protein concentration and study parameters such as age, gender and disease duration, a bivariate Pearson correlation coefficient was computed. One-way ANOVA was used to compare the α2M mean concentrations across the three clinical phenotypes. For all the statistical tests a two-sided probability value of p<0.05 was considered for statistical significance.
Results
Clinical Profile
A total of 58 CSF samples from 36 Parkinson’s disease patients, seven schizophrenia patients and 15 from either pregnant women or patients with urological disease were recruited as neurological controls for this study. Six of these samples were used for the discovery phase of the experiments by iTRAQ (Table 1). Pharmacological therapy was used in the treatment of 32 of these patients, whose details are provided in Table S1. All the 58 samples were used in the validation phase of the experiment by ELISA. The demographic parameters of patients recruited are provided in Table 2. The median (IQR) age of 36 Parkinson’s disease patients and 7 schizophrenia patients was 51.0 (42.5–58.5) and 23.0 (21.0–28.0) years, respectively. The difference in median age between these two groups was statistically significant (p= 0.013).
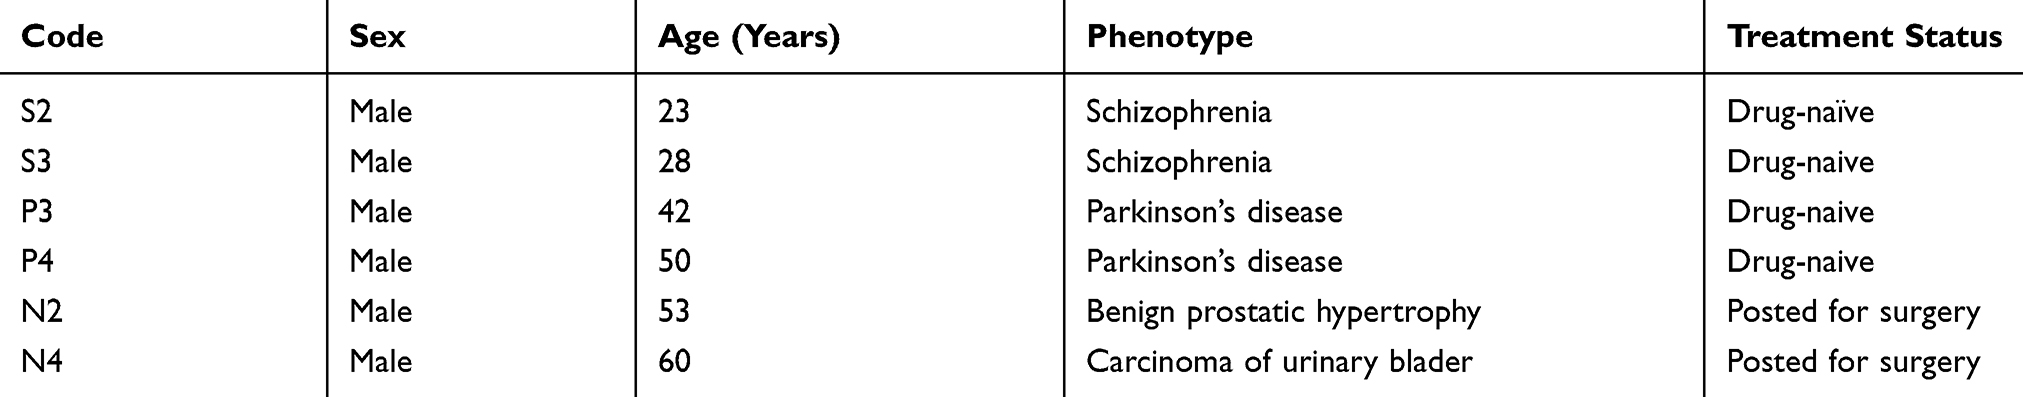 |
Table 1 Clinical Profile Of Patients Recruited For iTRAQ Experiments |
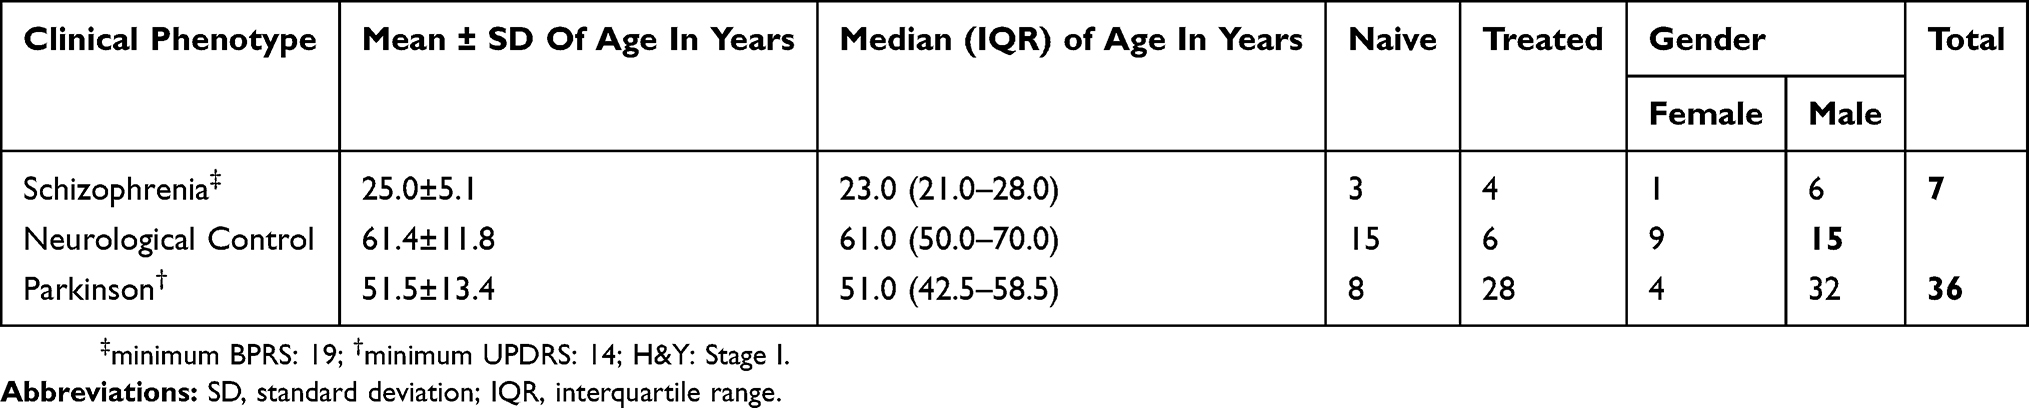 |
Table 2 Demographic Profile Of Patients Recruited For ELISA |
iTRAQ Analysis And Protein Profiling
A total of 692, 795 and 848 proteins were identified in patient CSF samples of Parkinson’s disease, healthy control and schizophrenia, respectively (Table S2). Proteins were quantified and an internal standard was made by mixing equimolar amounts of proteins from two samples each from Parkinson’s disease, neurological controls and schizophrenia. The mean ratio of protein levels across the three phenotypes was calculated using data obtained from the search results. A total of 961 proteins were identified across the three clinical phenotypes (Figure 1). A classification for protein in each clinical phenotype was made based on the number of peptides identified (Figure S1). The percentages roughly correspond to their abundance in the CSF and are dependent on sensitivity of the mass spectrometer and ionization potential of the peptides. There were 10 proteins that showed either an increase or a decrease across the three clinical phenotypes. Inter-phenotype comparisons were made and extent of correlation (m) and accuracy of linearity across the spectrum (R2) was derived from the line equations and are provided in Table 3. The identified proteomes were classified according to their role in different biological processes and molecular function (Figure 2). Seven proteins showed a linear upregulation and three proteins showed downregulation across Parkinson’s disease, neurological control and schizophrenia. The trend lines corresponding to the protein levels in the three phenotypes are shown in Figure 3 and corresponding mass spectrometric peaks as obtained from Protein Pilot software are shown in Figure S2. Pathway analysis was carried out to delineate the interacting proteins and place the differential expression with respect to dopaminergic disease in the right perspective. The salient outcomes of the network analysis are provided in Figure 4 and Table 4. The identified proteins that have a role in the dopaminergic pathways and disease outcomes are discussed in detail below.
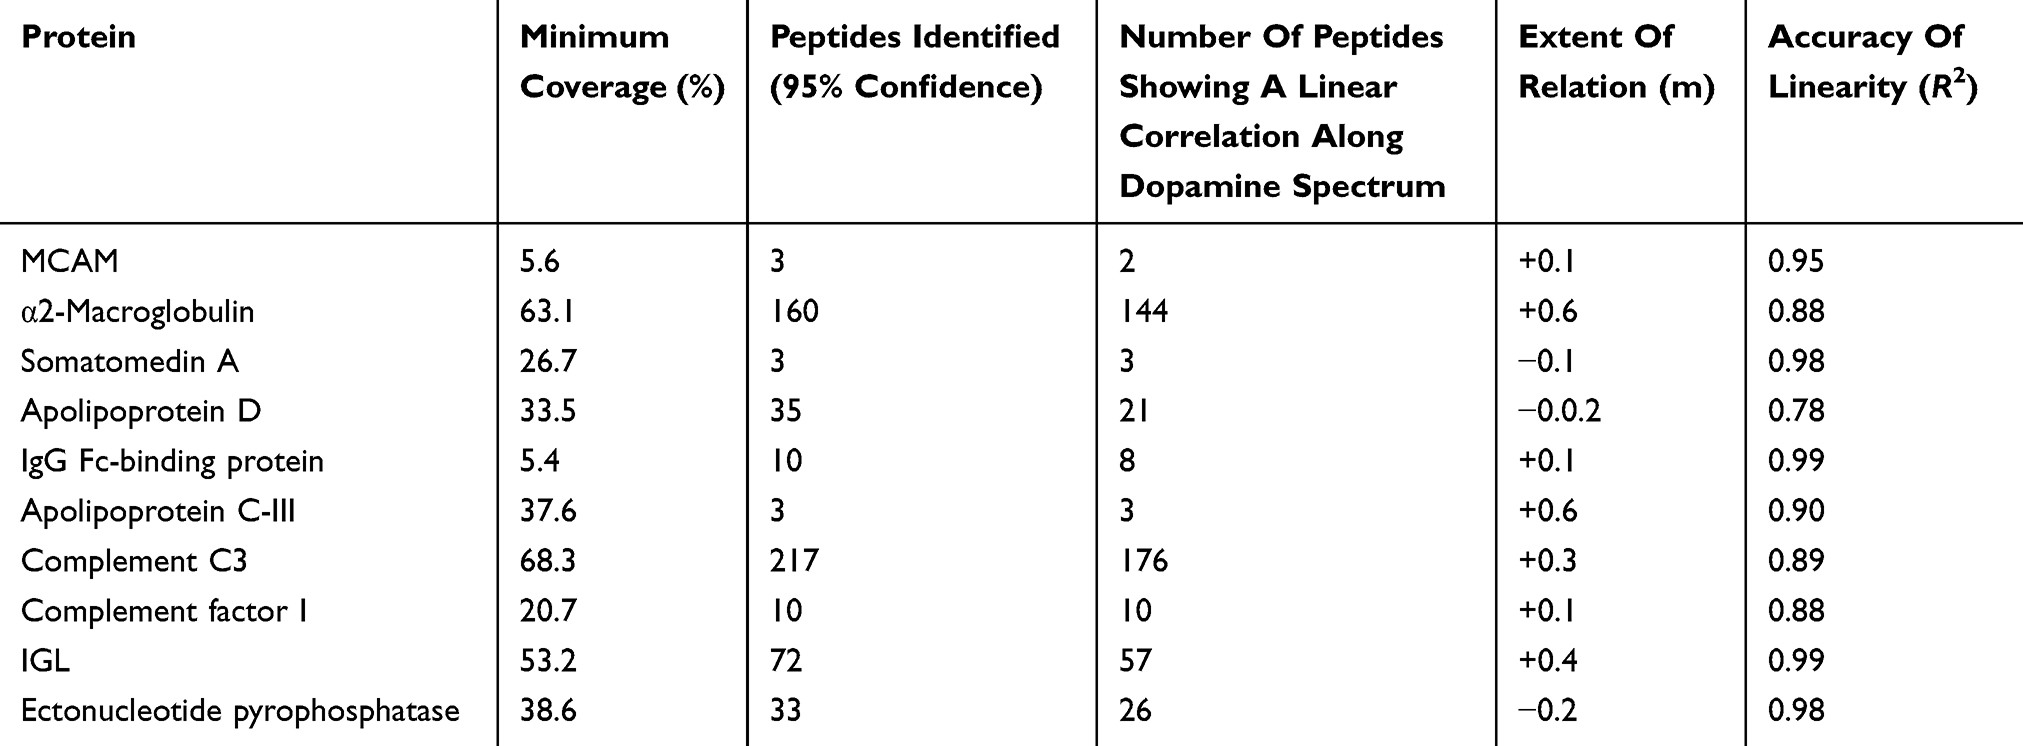 |
Table 3 Identification Of Proteins That Show Differential Expression Across The Clinical Dopaminergic Spectrum |
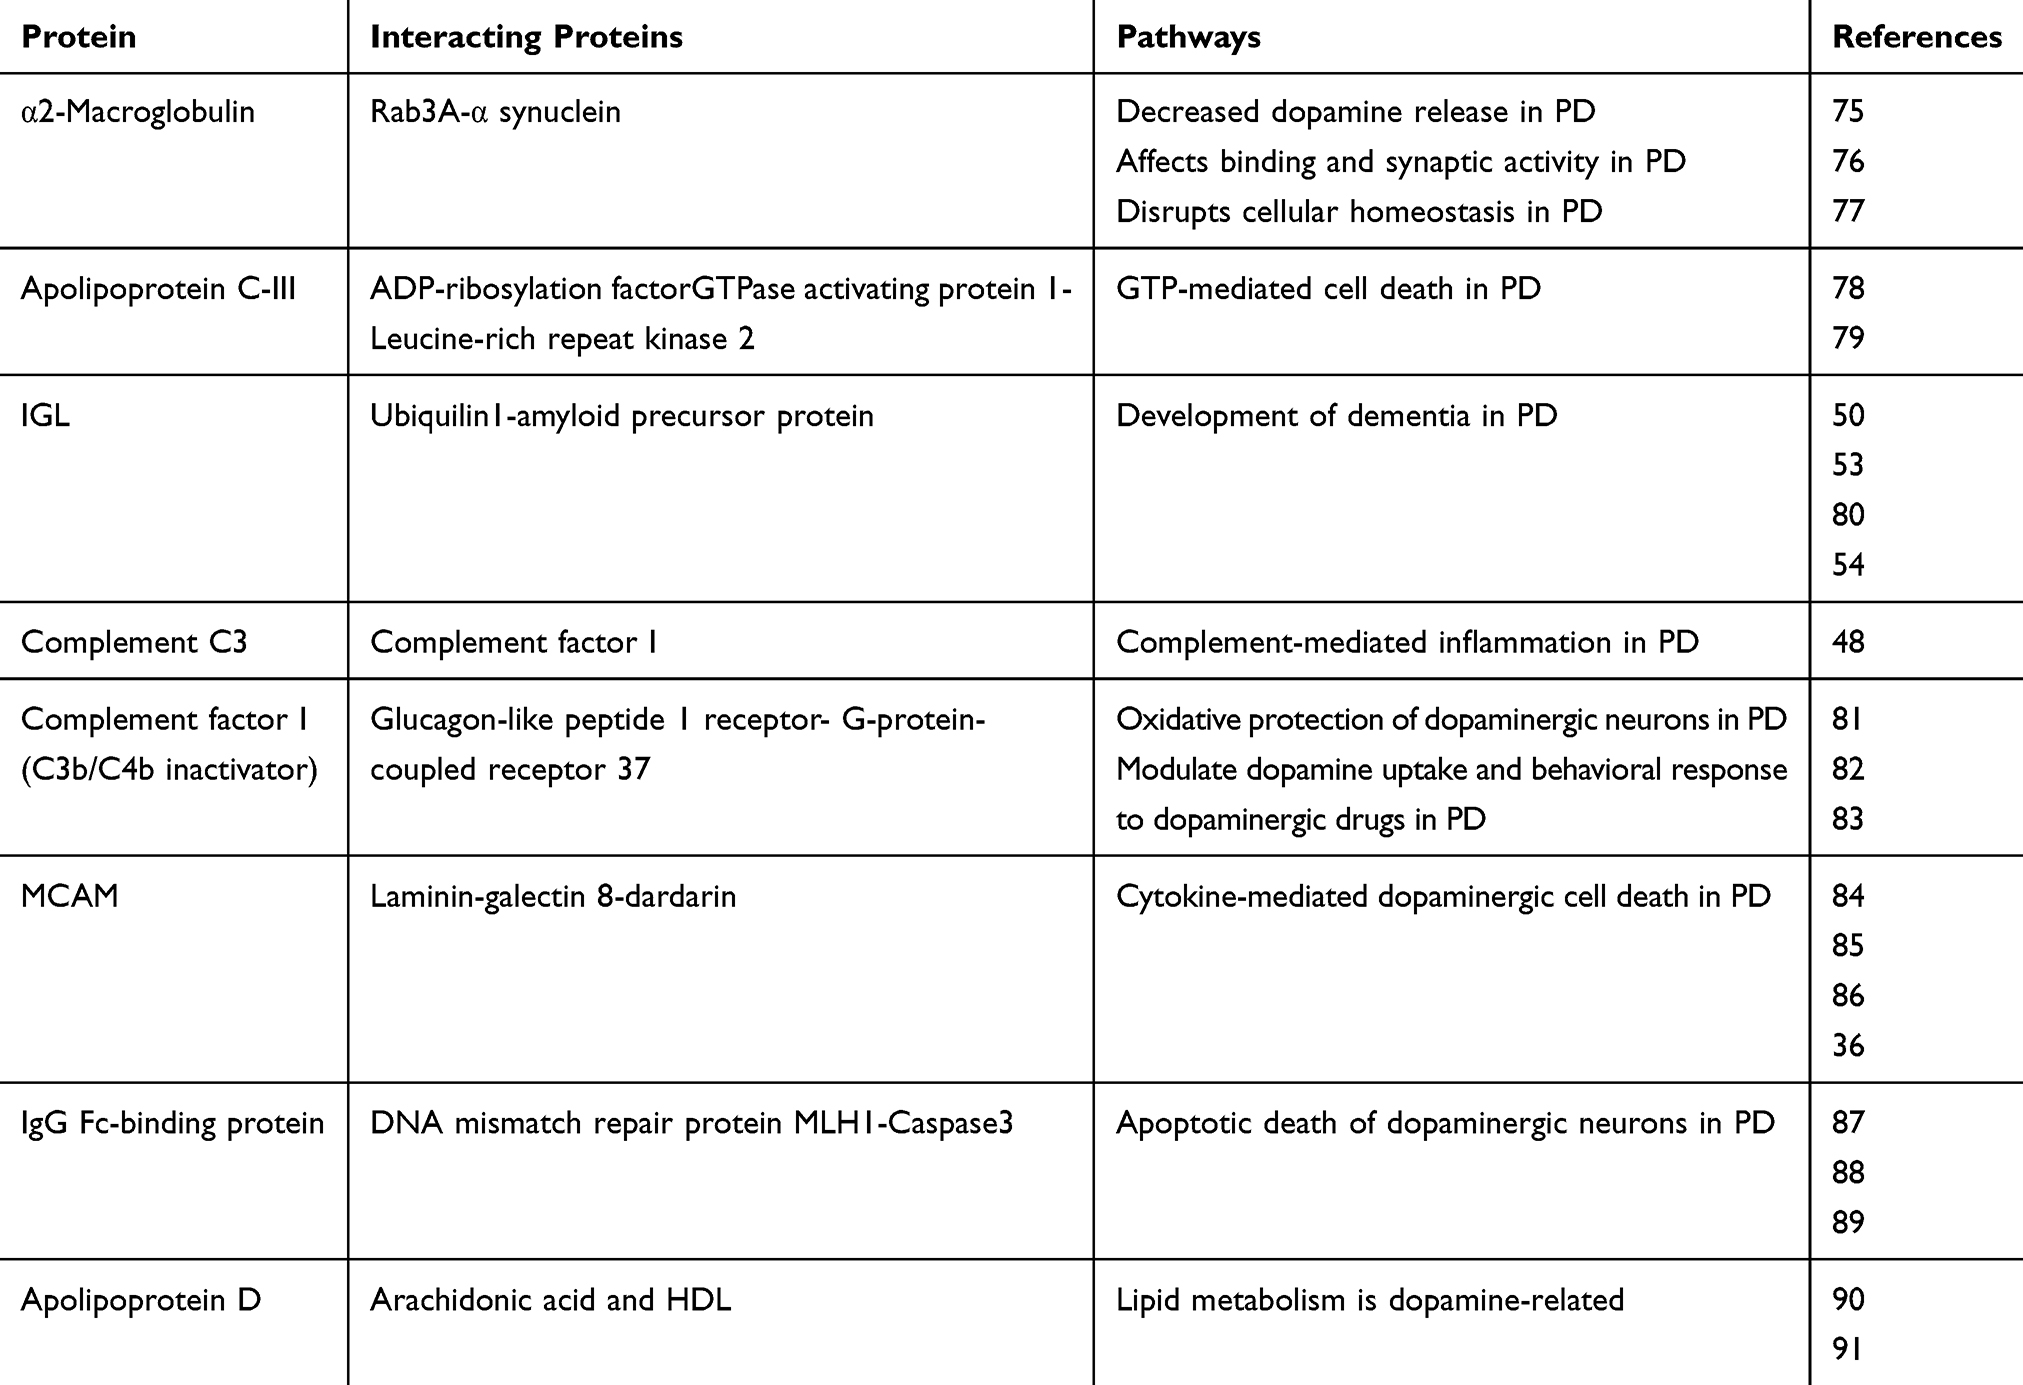 |
Table 4 Identified Proteins, Their Interactions And Implications In Dopaminergic Pathways |
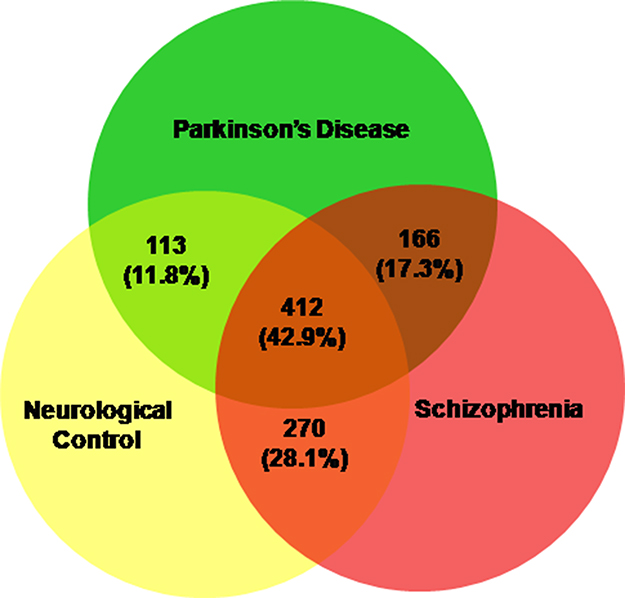 |
Figure 1 Proteins identified in the CSF of Parkinson’s disease, neurological controls and schizophrenia patients. The total numbers and their respective percentages are shown. |
 |
Figure 2 Graphical representation of the biological annotation and molecular function of identified proteins. (A) Pie chart representations in Parkinson’s disease, neurological control and schizophrenia patients. (B) Pie chart representations in Parkinson’s disease, neurological control and schizophrenia patients. Abbreviations: Im, immune process; Mp, metabolic process; Rs, response to stimulus; Lo, localization; In, interaction with cells and organisms; Dp, developmental process; Ot, others; Re, regulation; Cp, cellular processes; Ao, antioxidant activity; St, structural activity; Mt, molecular transducer activity; Ca, ctalytic activity; Bi, binding). |
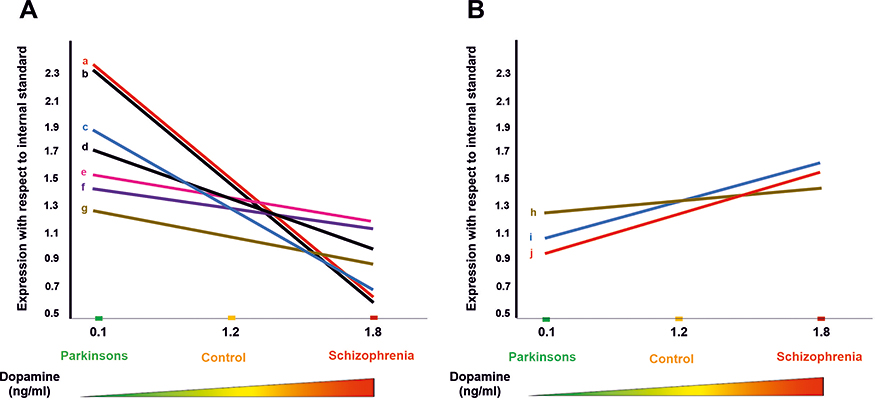 |
Figure 3 Graphical depiction of protein expression with respect to dopamine concentration in the brain. (A) Protein expressions that are inversely related to the dopamine spectrum comprising Parkinson’s disease, neurological control and schizophrenia patients. (a) Alpha-2-macroglobulin, (b) apolipoprotein C-III, (c) IGL@ protein, (d) complement C3, (e) melanoma cell adhesion molecule, (f) complement factor I light chain, and (g) IgG Fc-binding protein. (B) Protein expressions that are directly related to the dopamine spectrum comprising Parkinson’s disease, neurological control and schizophrenia patients. (h) Insulin-like growth factor 2, (i) apolipoprotein D, and (j) ectonucleotide pyrophosphatase/phosphodiesterase family member 2. Diagrammatic representation of the dopamine concentration in cerebrospinal fluid is shown along the x-axis.73,74 |
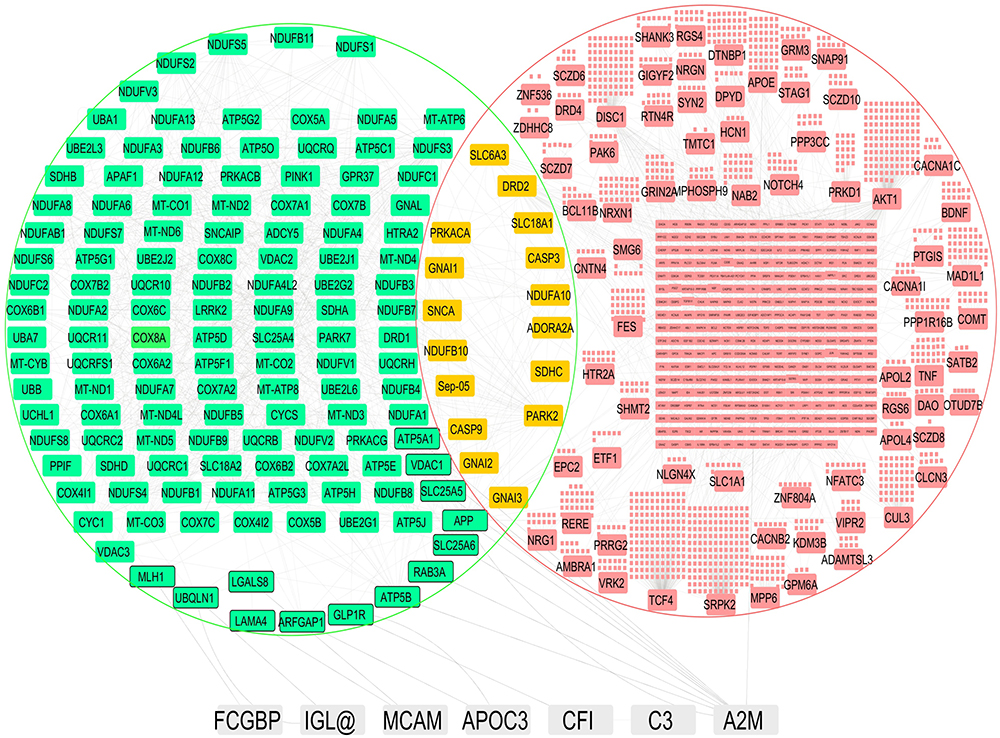 |
Figure 4 Pathway analysis shows the identified proteins and their respective interactions. The identified proteins are shown in white nodes, interacting nodes in Parkinson’s disease pathway are highlighted in green, interacting nodes in the schizophrenia pathway are highlighted in red, and nodes that are common to both groups are highlighted in yellow. Direct interacting nodes are indicated by thick-bordered nodes. Interactions of the identified proteins are shown by grey lines. |
ELISA
For the list of proteins that were differentially expressed, proteins with at least 90% of identified peptides showing a linear correlation with dopamine spectrum were considered for validation studies. ELISA was therefore conducted for α2M. The assay characterization and performance of α2M ELISA assay are: sensitivity of 2 ng; specificity for human α2M, average accuracy of 97%, and correlation variation of reproducibility of 4.6%. The mean concentrations of α2M in Parkinson’s disease control and schizophrenia was 1.2, 0.7 and 0.3 μg/mL, respectively (Figure 5). Inter-group statistical analysis clearly demonstrates the extent of significance. The ratio of Parkinson’s disease with schizophrenia and ratio of control with schizophrenia are 3.5 and 2.0, respectively. It may be noted that the ratios for the same using the iTRAQ experiment were 2.5 and 1.3, respectively. The slope of linearity across the spectrum in the ELISA and iTRAQ is 0.43 and 0.6, respectively. The results of the validation phase, therefore, reiterate the results of the discovery phase. Due to the high heterogeneity among patients with respect to severity of the disease or the quality of pharmacological intervention, intra-group comparisons yielded no significant results. However, when the concentrations were grouped based on intervention, as naïve and treated, the slope of linearity across the spectrum was in the order of 0.3 and an R2 value was 0.8. F-statistics were found to be 402.8 (P<0.01). Age, gender and duration of the disease were seen not to be having a correlation with α2M concentrations, hence ruling out these variables as confounding factors (Table 5) The pharmaco-therapeutic monitoring value of CSF α2M in Parkinson’s disease and schizophrenia can be inferred from Table 6.
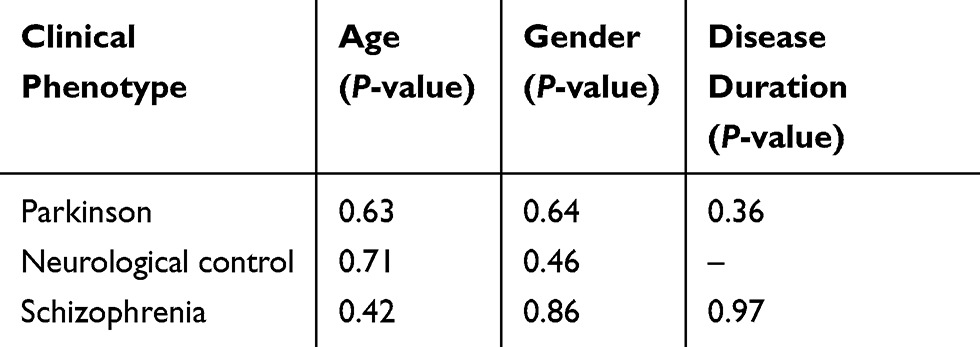 |
Table 5 Pearson’s Correlation Between α2M Concentrations And Age, Gender And Disease Duration |
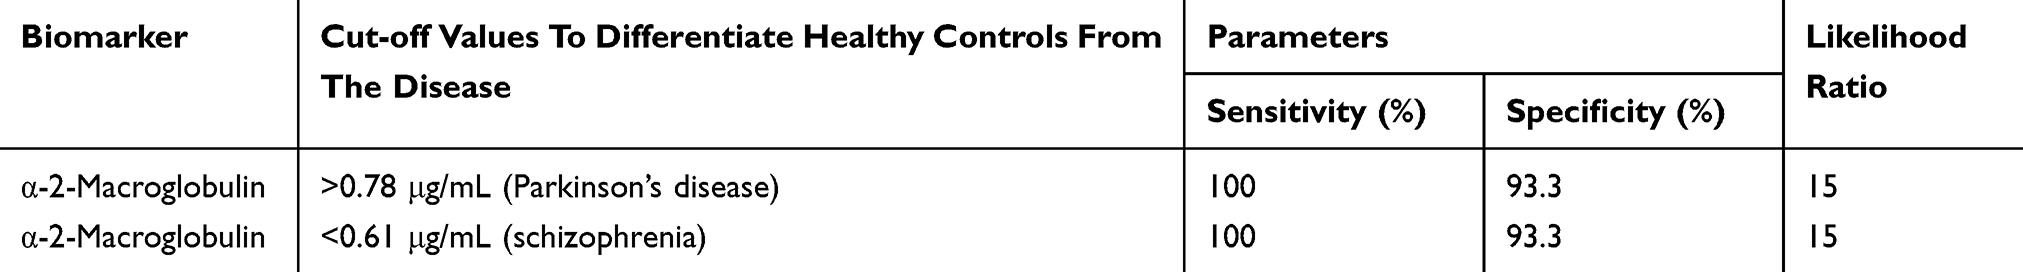 |
Table 6 Pharmaco-Therapeutic Monitoring Value Of CSF α-2-Macroglobulin In Parkinson’s Disease And Schizophrenia |
 |
Figure 5 ELISA for the expression of alpha-2-macroglobulin in the CSF of schizophrenia patients, neurological controls and Parkinson’s disease patients. Mean ± standard error of mean of the values are shown by horizontal lines. The bars represent the concentrations as the average of duplicate readings of each patient sample. The trend line across the three phenotypes is shown as a blue dotted line (y = −0.43x+ 1.58; correlation coefficient: R2 = 0.99). Diagrammatic representation of the dopamine concentration in cerebrospinal fluid is shown along the x-axis.73,74 ***Indicates statistical significance with P<0.001. |
Discussion
Clinical Profile
Parkinson’s disease and the schizophrenia groups have a higher male gender representation as compared to female gender. This observation is consistent with the fact that the incidence of these two dopamine-mediated clinical states to a large extent affects the male population.27 The median age of the schizophrenia group and the Parkinson’s disease group varied significantly in the study. It may be observed that the incidence of Parkinson’s disease increases above the age of 60 years, with only 4% who are under the age of 50 years,28 whereas the incidence of schizophrenia is 16–25 years.29
Biological Process And Molecular Function Of Identified Proteins
There are minimal variations in the number of identified proteins represented across the three clinical phenotypes of Parkinson’s disease, neurological controls and schizophrenia with respect to biological processes and molecular function. This suggests that neuronal dysfunction in Parkinson’s disease and schizophrenia is a result of an imbalance of multiple physiological cellular processes. It is therefore implied that quantitative differences in the expression of certain proteins regulation of some of the proteins is responsible for deviation from the physiological state to pathological states of Parkinson’s disease and schizophrenia.
Differentially Expressed Proteins
Melanoma Cell Adhesion Molecule
Melanoma Cell Adhesion Molecule or MCAM (CD146) is a 113-kDa cell surface adhesion glycoprotein belonging to the immunoglobulin super family and is present on T-helper cells (Th-17).30 MCAM interacts with laminin 411, an extra-cellular matrix protein expressed on the vascular endothelial basement membrane, and facilitates T-helper cell infiltration into the brain.31,32 Th-17 cells induce dopaminergic neuronal glial cell death by releasing pro-inflammatory cytokines such as IL-17.33 Interestingly, Th-17 cells play an important role in neuro-degenerative process in Parkinson’s disease experimental models.34 On the other hand, the levels of Th-17 suppressing cytokines and IL-17 are increased in schizophrenia.35 Bioinformatics analysis, in addition to explaining the detailed chain of interactions for the above function, shows MCAM to be interacting with leucine-rich repeat kinase 2, which is involved in cellular oxidative stress in Parkinson’s disease.36
IgG Fc-Binding Protein
The role of humoral response and the involvement of immunoglobulins in neuro-degeneration that is seen in Parkinson’s disease are well studied.37 These are a class of proteins that bind to Fc region of the immunoglobulin. One such protein is FcγR that promotes neuronal degeneration that is brought about by immunoglobulin IgG that are produced against dopaminergic neurons.38,39 The FcγR mediates α-synuclein intracellular trafficking and pro-inflammatory signaling that is responsible for neuro-degeneration that takes place in substantia nigra pars compacta, which is a key pathological feature in Parkinson’s disease.40–42 In accordance, there is an upregulation of IgG Fc-binding protein in the CSF of Parkinson’s disease as compared to healthy controls and schizophrenia patients.
Complement C3 And Complement Factor I
Complement C3 is a protein that was identified to be having an inverse correlation along the dopaminergic clinical phenotype system. The complement system is an integral part of the innate immune system that enables antibodies and phagocytic cells to clear microbes and damaged cells from an organism and promotes inflammation by classical and alternative pathways.43 The complement system culminates in the activation of complement C3 by C3 convertase in either of the two pathways.44 Studies have shown the implication of the complement system in the loss of dopaminergic neurons, which is a key feature of Parkinson’s disease.45 Also, proteomic studies in the Parkinson’s disease patient population have indicated a marked increase of complement C3 components C3c and C3dg.46 Similar evidence has been obtained in animal models, wherein the loss of dopaminergic neurons was induced by repeated systemic challenge with bacterial lipopolysaccharide.47 One of the proteins that was identified was Complement Factor I that inactivates C3b (iC3b), which is one of the cleaved products of Complement C3. iC3b facilitates binding of melanized neurons by activated microglia that are increased in Parkinson’s disease.48 This confirms the involvement of the complement system in neuro-degeneration.
Immunoglobulin Lambda Light Chain
The light chain component of immunoglobulins comprises of lambda chain and kappa chain. The lambda component is encoded by immunoglobulin lambda locus on chromosome 22.49 This protein interacts with ubiquilin-1, which has an important role in unfolded protein response.50,51 Ubiquilin-1 has been shown to localize in Lewy bodies in Parkinson’s disease.52 It interacts with amyloid precursor protein by acting as a molecular chaperone and its reduced activity leads to increased production of pathogenic amyloid precursor protein fragments and neuronal death.53 In summary, Parkinson’s disease occurs as a result of increased amyloid precursor protein expression leading to cerebral dopamine deficits.54 On the contrary, schizophrenia has a decreased activity of ubiquitin proteasome pathway that is implicated in its disease pathology.55–57
Alpha-2-Macroglobulin
Alpha-2-macroglobulin (α2M) is a member of the alpha-macroglobulin family having protein transport function and anti-protease activity.58 However, in the nervous system, there exists a potential relationship between α2M and degenerative dopaminergic condition of Parkinson’s disease that is intricately associated with decreased striatal dopaminergic concentrations.59,60 This has been conclusively studied in animal models in which α2M infusion in brain decreased the concentration of dopamine.60–63 In a normal cell, dopamine transporter (DAT) mediates the uptake of dopamine from the synaptic cleft to the pre-synaptic cell.64 The internalized dopamine is either stored in vesicles by vesicular monoamine transporter 2 (VMAT 2) or it is metabolized by the enzyme monoamine oxidase (MAO).65 In Parkinson’s disease, the expression of VMAT 2 is decreased, therefore causing accumulation of free dopamine in the cytoplasm.66,67 Free dopamine is rapidly oxidized to cytotoxic metabolites and reactive oxygen species (ROS), causing oxidative stress.68 α2M and its receptor LRP (low-density lipoprotein receptor-related protein) are involved in signaling pathways activated in response to damage occurring at synaptic terminals due to inflammation or oxidative stress.69,70 Therefore, there is an increase in the level of α2M in Parkinson’s disease, whereas, in the case of schizophrenia, there is less free dopamine in the cytoplasm because the majority of it is secreted from the pre-synaptic terminal.71 Therefore, there is less formation of cytotoxic oxidative metabolites of dopamine in the cytoplasm resulting in decreased oxidative stress. This explains the downregulation of α2M as observed in our experiments. CSF-α2M does not correlate with the UPDRS score. This is because CSF-α2M is the averaged reflection of events in the whole brain, while UPDRS reflects progression of Parkinson’s disease in the nigro-striatal pathway.72 The identification of α2M in the discovery phase of experiments, its validation by ELISA and pathway analysis, and the high sensitivity and specificity values for α2M make it an ideal biomarker to monitor therapeutic efficacy in dopamine-mediated disease states.
In the recent past, there have been many studies that have identified CSF proteins as biomarkers in neurological diseases. These, along with our own findings, are highlighted in Table 7.
 |
Table 7 Protein Biomarkers In CSF With Potential Use In Neurological Diseases |
Limitations Of The Study
- As our institute is a tertiary health care center, recruiting naïve patients was a limiting factor.
- Experiments have been carried out on 58 CSF samples. Validation studies on a larger cohort would be more informative for a translational product.
- Of the 10 proteins identified in the discovery phase, only α2M has been validated with reasonable linearity and statistical significance. A higher sample number would probably help to validate the expression of these proteins
Conclusion
Non-gel-based proteomic experiments are an ideal platform for the identification of proteins in CSF that are differentially expressed across varying dopaminergic clinical phenotypes of Parkinson’s disease, healthy controls and schizophrenia. The variations in expression are due to biological and functional changes that are inherent to the neurological disease and physiological condition. iTRAQ quantitation, ELISA and pathway analysis establish alpha-2-macroglobulin as a potential biomarker to monitor pharmacological efficacy in dopamine mediated states of Parkinson’s disease and schizophrenia. This is the first ever study of its kind to identify proteins as potential biomarkers of pharmacological efficacy in patients with Parkinson’s disease and schizophrenia.
Acknowledgments
GH acknowledges Department of Science and Technology, Government of India for the grant SO/BB-0122/2013. The work was carried out at the Proteomics Division of Central Core Research Facility at AIIMS, New Delhi, India. Dr. Perumal Vanamail at the Department of Biostatistics provided help with statistical analysis and his assistance is highly appreciated. The abstract of this paper entitled ‘Cerebrospinal fluid proteomics for identification of potential biomarkers to monitor pharmacological therapeutic efficacy in dopamine dictated disease states of Parkinson’s disease and schizophrenia’ was presented by Dr Gururao Hariprasad at the Experimental Biology: Annual Meeting held at San Diego, USA in April, 2018 as a poster presentation talk with interim findings and was published as an abstract in FASEB Journal, 2018: 802.4 (https://www.fasebj.org/doi/abs/10.1096/fasebj.2018.32.1_supplement.802.4).
Disclosure
The authors report no conflicts of interest in this work.
References
1. Xia R, Mao ZH. Progression of motor symptoms in Parkinson’s disease. Neurosci Bull. 2012;28(1):39–48. doi:10.1007/s12264-012-1050-z
2. Birtwistle J, Baldwin D. Role of dopamine in schizophrenia and Parkinson’s disease. Br J Nurs. 1998;7(14):
3. Yabe I, Ohta M, Egashira T, et al. Effectiveness of zonisamide in a patient with Parkinson’s disease and various levodopa-induced psychotic symptoms. Neurol Clin Neurosci. 2014;2(6):201–203. doi:10.1111/ncn3.126
4. Bohlega SA, Al-Foghom NB. Drug-induced Parkinson`s disease. A clinical review. Neurosciences (Riyadh). 2013;18(3):215–221.
5. Caligiuri MP, Teulings HL, Dean CE, Niculescu AB, Lohr JB. Handwriting movement kinematics for quantifying extrapyramidal side effects in patients treated with atypical antipsychotics. Psychiatry Res. 2010;177(1):77–83. doi:10.1016/j.psychres.2009.07.005
6. Fernández CP, Aguilar S, Viçens V, et al. ECT in a patient with Parkinson’s disease and schizophrenia, with dopamine transporter visualization using 123I-ioflupane SPET. J Neural Transm. 2011;118(4):647–650. doi:10.1007/s00702-011-0615-8
7. Gupta AK, Swarnkar S, Khunger GK, et al. Dopamine based pharmaco-therapeutics of schizophrenia and Parkinson’s disease: two ends of one spectrum. Ann Pharmacol Pharm. 2017;2(21):1109.
8. Zahodne LB, Fernandez HH. Pathophysiology and treatment of psychosis in Parkinson’s disease: a review. Drugs Aging. 2008;25(8):665–682. doi:10.2165/00002512-200825080-00004
9. Rukmangadachar LA, Kataria J, Hariprasad G, et al. Two-dimensional difference gel electrophoresis (DIGE) analysis of sera from visceral leishmaniasis patients. Clin Proteomics. 2011;8(1):4. doi:10.1186/1559-0275-8-2
10. Hariprasad G, Hariprasad R, Kumar L, Srinivasan A, Kola S, Kaushik A. Apolipoprotein A1 as a potential biomarker in the ascitic fluid for the differentiation of advanced ovarian cancers. Biomarkers. 2013;18(6):532–541. doi:10.3109/1354750X.2013.822561
11. Sehrawat U, Pokhriyal R, Gupta AK, et al. Proteomic analysis of advanced ovarian cancer tissue to identify potential biomarkers of responders and nonresponders to first-line chemotherapy of carboplatin and paclitaxel. Biomark Cancer. 2016;16(8):43–56.
12. Kataria J, Rukmangadachar LA, Hariprasad G, O J, Tripathi M, Srinivasan A. Two dimensional difference gel electrophoresis analysis of cerebrospinal fluid in tuberculous meningitis patients. J Proteomics. 2011;74(10):2194–2203. doi:10.1016/j.jprot.2011.06.020
13. Manral P, Sharma P, Hariprasad G, Chandralekha, Tripathi M, Srinivasan A. Can apolipoproteins and complement factors be biomarkers of Alzheimer’s disease? Curr Alzheimer Res. 2012;9(8):935–943.
14. Gupta AK, Rani K, Swarnkar S, et al. Evaluation of serum apolipoprotein e as a potential biomarker for pharmacological therapeutic efficacy monitoring in dopamine dictated disease spectrum of schizophrenia and Parkinson’s disease: a Preliminary Study. J Cent Nerv Syst Dis. 2018;10:
15. Gupta AK, Kumar GK, Rani K, et al. 2D-DIGE as a strategy to identify serum protein biomarkers to monitor pharmacological efficacy in dopamine dictated states of Parkinson’s disease and schizophrenia. Neuropsych Dis Treat. 2019;15:1031–1044. doi:10.2147/NDT.S198559
16. Gupta AK, Pokhriyal R, Das U, et al., Evaluation of α-synuclein and apolipoprotein E as potential biomarkers in CSF to monitor pharmaco-therapeutic efficacy in dopamine dictated disease states of Parkinson’s disease and schizophrenia. Neuropsych Dis Treat. 2019;15:2073–2085. doi:10.2147/NDT.S205550
17. Chou KL, Taylor JL, Patil PG. The MDS–UPDRS tracks motor and non–motor improvement due to sub-thalamic nucleus deep brain stimulation in Parkinson disease. Parkinsonism Relat Disord. 2013;19(11):966–969. doi:10.1016/j.parkreldis.2013.06.010
18. Goetz CG, Poewe W, Rascol O, et al. Movement disorder society task force report on the Hoehn and Yahr staging scale: status and recommendation. Mov Disord. 2004;19:1020–1028. doi:10.1002/mds.20213
19. World Health Organization Geneva. The ICD-10 Classification of Mental and Behavioural Disorders; 1993.
20. Ganapathiraju MK, Thahir M, Handen A, et al. Schizophrenia interactome with 504 novel protein-protein interactions. NPJ Schizophr. 2016;2:16012. doi:10.1038/npjschz.2016.12
21. Smoot ME, Ono K, Ruscheinski J, Wang P-L, Ideker T. Cytoscape 2.8: new features for data integration and network visualization. Bioinformatics. 2011;27(3):431–432. doi:10.1093/bioinformatics/btq675
22. Shannon P, Markiel A, Ozier O, et al. Cytoscape: a software environment for integrated models of biomolecular interaction networks. Genome Res. 2003;13(11):2498–2504. doi:10.1101/gr.1239303
23. Gao J, Ade AS, Tarcea VG, et al. Integrating and annotating the interactome using the MiMI plugin for cytoscape. Bioinformatics. 2009;25(1):137–138. doi:10.1093/bioinformatics/btn501
24. Jensen LJ, Kuhn M, Stark M, et al. STRING 8–a global view on proteins and their functional interactions in 630 organisms. Nucleic Acids Res. 2009;37(Database issue):D412–D416. doi:10.1093/nar/gkn760
25. Chatr-aryamontri A, Ceol A, Palazzi LM, et al. MINT: the molecular INTeraction database. Nucleic Acids Res. 2007;35(Databaseissue):D572–D574. doi:10.1093/nar/gkl950
26. Keshava Prasad TS, Goel R, Kandasamy K, et al. Human protein reference database–2009 update. Nucleic Acids Res. 2009;37(Databaseissue):D767–D772. doi:10.1093/nar/gkn892
27. Loke H, Harley V, Lee J. Biological factors underlying sex differences in neurological disorders. Int J Biochem Cell Biol. 2015;65:139–150. doi:10.1016/j.biocel.2015.05.024
28. Van Den Eeden SK, Tanner CM, Bernstein AL, et al. Incidence of Parkinson’s disease: variation by age, gender, and race/ethnicity. Am J Epidemiol. 2003;157(11):1015–1022. doi:10.1093/aje/kwg068
29. Sham PC, MacLean CJ, Kendler KS. A typological model of schizophrenia based on age at onset, sex and familial morbidity. Acta Psychiatr Scand. 1994;89(2):135–141. doi:10.1111/j.1600-0447.1994.tb01501.x
30. Guezguez B, Vigneron P, Lamerant N, Kieda C, Jaffredo T, Dunon D. Dual role of melanoma cell adhesion molecule (MCAM)/CD146 in lymphocyte endothelium interaction: MCAM/CD146 promotes rolling via microvilli induction in lymphocyte and is an endothelial adhesion receptor. J Immunol. 2007;179(10):6673–6685. doi:10.4049/jimmunol.179.10.6673
31. Flanagan K, Fitzgerald K, Baker J, et al. Laminin-411 is a vascular ligand for MCAM and facilitates TH17 cell entry into the CNS. PLoS One. 2012;7(7):e40443. doi:10.1371/journal.pone.0040443
32. Schneider-Hohendorf T, Rossaint J, Mohan H, et al. VLA-4 blockade promotes differential routes into human CNS involving PSGL-1 rolling of T cells and MCAM-adhesion of TH17 cells. J Exp Med. 2014;211(9):1833–1846. doi:10.1084/jem.20140540
33. Liu Z, Huang Y, Cao BB, Qiu Y-H, Peng Y-P. Th17 cells induce dopaminergic neuronal death via LFA-1/ICAM-1 Interaction in a mouse model of Parkinson’s disease. Mol Neurobiol. 2017;54(10):7762–7776. doi:10.1007/s12035-016-0249-9
34. Reynolds AD, Stone DK, Hutter JA, et al. Regulatory T cells attenuate Th17 cell-mediated nigrostriatal dopaminergic neurodegeneration in a model of Parkinson’s disease. J Immunol. 2010;184(5):2261–2271. doi:10.4049/jimmunol.0901852
35. Borovcanin M, Jovanovic I, Radosavljevic G, et al. Elevated serum level of type-2 cytokine and low IL-17 in first episode psychosis and schizophrenia in relapse. J Psychiatr Res. 2012;46(11):1421–1426. doi:10.1016/j.jpsychires.2012.08.016
36. Angeles DC, Gan BH, Onstead L, et al. Mutations in LRRK2 increase phosphorylation of peroxiredoxin 3 exacerbating oxidative stress-induced neuronal death. Hum Mutat. 2011;32(12):1390–1397. doi:10.1002/humu.21582
37. Orr CF, Rowe DB, Mizuno Y, Mori H, Halliday GM. A possible role for humoral immunity in the pathogenesis of Parkinson’s disease. Brain. 2005;128(Pt11):2665–2674. doi:10.1093/brain/awh625
38. Cao S, Theodore S, Standaert DG. Fcγ receptors are required for NF-κB signaling, microglial activation and dopaminergic neurodegeneration in an AAV-synuclein mouse model of Parkinson’s disease. Mol Neurodegener. 2010;26:5–42.
39. Ulvestad E, Williams K, Vedeler C, et al. Reactive microglia in multiple sclerosis lesions have an increased expression of receptors for the Fc part of IgG. J Neurol Sci. 1994;121(2):125–131. doi:10.1016/0022-510x(94)90340-9
40. Dauer W, Kholodilov N, Vila M, et al. Resistance of alpha -synuclein null mice to the parkinsonian neurotoxin MPTP. Proc Natl Acad Sci U S A. 2002;99(22):14524–14529. doi:10.1073/pnas.172514599
41. Lira A, Kulczycki J, Slack R, Anisman H, Park DS. Involvement of the Fc gamma receptor in a chronic N-methyl-4-phenyl-1,2,3,6-tetrahydropyridine mouse model of dopaminergic loss. J Biol Chem. 2011;286(33):28783–28793. doi:10.1074/jbc.M111.244830
42. Cao S, Standaert DG, Harms AS. The gamma chain subunit of Fc receptors is required for alpha-synuclein-induced pro-inflammatory signaling in microglia. J Neuroinflammation. 2012;9:259. doi:10.1186/1742-2094-9-259
43. Noris M, Remuzzi G. Overview of complement activation and regulation. Semin Nephrol. 2013;33(6):479–492. doi:10.1016/j.semnephrol.2013.08.001
44. Ricklin D, Hajishengallis G, Yang K, Lambris JD. Complement: a key system for immune surveillance and homeostasis. Nat Immunol. 2010;11(9):785–797. doi:10.1038/ni.1923
45. Finehout EJ, Franck Z, Lee KH. Complement protein isoforms in CSF as possible biomarkers for neurodegenerative disease. Dis Markers. 2005;21(2):93–101. doi:10.1155/2005/806573
46. Goldknopf IL, Sheta EA, Bryson J, et al. Complement C3c and related protein biomarkers in amyotrophic lateral sclerosis and Parkinson’s disease. Biochem Biophys Res Commun. 2006;342(4):1034–1039. doi:10.1016/j.bbrc.2006.02.051
47. Bodea L-G, Wang Y, Linnartz-Gerlach B, et al. Neurodegeneration by activation of the microglial complement-phagosome pathway. J Neurosci. 2014;34(25):8546–8556. doi:10.1523/JNEUROSCI.5002-13.2014
48. Loeffler DA, Camp DM, Conant SB. Complement activation in the Parkinson’s disease substantia nigra: an immunocytochemical study. J Neuroinflammation. 2006;3:29. doi:10.1186/1742-2094-3-29
49. Erikson J, Martinis J, Croce CM. Assignment of the genes for human lambda immunoglobulin chains to chromosome 22. Nature. 1981;294(5837):173–175. doi:10.1038/294173a0
50. Rolland T, Taşan M, Charloteaux B, et al. A proteome-scale map of the human interactome network. Cell. 2014;159(5):1212–1226. doi:10.1016/j.cell.2014.10.050
51. Rual JF, Venkatesan K, Hao T, et al. Towards a proteome-scale map of the human protein-protein interaction network. Nature. 2005;437(7062):1173–1178. doi:10.1038/nature04209
52. Mah AL, Perry G, Smith MA, Monteiro MJ. Identification of ubiquilin, a novel presenilin interactor that increases presenilin protein accumulation. J Cell Biol. 2000;151(4):847–862. doi:10.1083/jcb.151.4.847
53. Stieren ES, El Ayadi A, Xiao Y, et al. Ubiquilin-1 is a molecular chaperone for the amyloid precursor protein. J Biol Chem. 2011;286(41):35689–35698. doi:10.1074/jbc.M111.243147
54. Schulte EC, Fukumori A, Mollenhauer B, et al. Rare variants in β-Amyloid precursor protein (APP) and Parkinson’s disease. Eur J Hum Genet. 2015;23(10):1328–1333. doi:10.1038/ejhg.2014.300
55. Altar CA, Jurata LW, Charles V, et al. Deficient hippocampal neuron expression of proteasome, ubiquitin, and mitochondrial genes in multiple schizophrenia cohorts. Biol Psychiatry. 2005;58(2):85–96. doi:10.1016/j.biopsych.2005.03.031
56. Bousman CA, Chana G, Glatt SJ, et al. Preliminary evidence of ubiquitin proteasome system dysregulation in schizophrenia and bipolar disorder: convergent pathway analysis findings from two independent samples. Am J Med Genet B Neuropsychiatr Genet. 2010;153B(2):494–502. doi:10.1002/ajmg.b.31006
57. Rubio MD, Wood K, Haroutunian V, Meador-Woodruff JH. Dysfunction of the ubiquitin proteasome and ubiquitin-like systems in schizophrenia. Neuropsychopharmacology. 2013;38(10):1910–1920. doi:10.1038/npp.2013.84
58. Rehman AA, Ahsan H, Khan FH. α-2-Macroglobulin: a physiological guardian. J Cell Physiol. 2013;228(8):1665–1675. doi:10.1002/jcp.24266
59. Hu YQ, Koo PH. Inhibition of phosphorylation of TrkB and TrkC and their signal transduction by alpha2-macroglobulin. J Neurochem. 1998;71(1):213–220. doi:10.1046/j.1471-4159.1998.71010213.x
60. Hu YQ, Dluzen DE, Koo PH. Intracranial infusion of monoamine‐activated α2‐Macroglobulin decreases dopamine concentrations within the rat caudate putamen. J Neurosci Res. 1994;38(5):531–537. doi:10.1002/jnr.490380506
61. Koo PH, Liebl DJ, Qiu WS, Hu YQ, Dluzen DE. Monoamine-activated α2-macroglobulin inhibits neurite outgrowth, survival, choline acetyltransferase, and dopamine concentration of neurons by blocking neurotrophin-receptor (trk) phosphorylation and signal transduction. Ann N Y Acad Sci. 1994;737:460–464. doi:10.1111/j.1749-6632.1994.tb44340.x
62. Hu YQ, Liebl DJ, Dluzen DE, Koo PH. Inhibition of dopamine and choline acetyltransferase concentrations in rat CNS neurons by rat alpha 1- and alpha 2-macroglobulins. J Neurosci Res. 1998;51(4):541–550. doi:10.1002/(SICI)1097-4547(19980215)51:4<541::AID-JNR14>3.0.CO;2-6
63. Morgan DG, May PC, Finch CE. Dopamine and serotonin systems in human and rodent brain: effects of age and neurodegenerative disease. J Am Geriatr Soc. 1987;35(4):334–345. doi:10.1111/j.1532-5415.1987.tb04641.x
64. Cheng MH, Bahar I. Molecular mechanism of dopamine transport by human dopamine transporter. Structure. 2015;23(11):2171–2181. doi:10.1016/j.str.2015.09.001
65. Sidhu A, Wersinger C, Vernier P. alpha-Synuclein regulation of the dopaminergic transporter: a possible role in the pathogenesis of Parkinson’s disease. FEBS Lett. 2004;565(1–3):1–5. doi:10.1016/j.febslet.2004.03.063
66. Chen MK, Kuwabara H, Zhou Y, et al. VMAT2 and dopamine neuron loss in a primate model of Parkinson’s disease. J Neurochem. 2008;105(1):78–90. doi:10.1111/j.1471-4159.2007.05108.x
67. Pifl C, Rajput A, Reither H, et al. Is Parkinson’s disease a vesicular dopamine storage disorder? Evidence from a study in isolated synaptic vesicles of human and nonhuman primate striatum. J Neurosci. 2014;34(24):8210–8218. doi:10.1523/JNEUROSCI.5456-13.2014
68. Asanuma M, Miyazaki I, Ogawa N. Dopamine- or L-DOPA-induced neurotoxicity: the role of dopamine quinone formation and tyrosinase in a model of Parkinson’s disease. Neurotox Res. 2003;5(3):165–176.
69. Mahley RW, Ji ZS. Remnant lipoprotein metabolism: key pathways involving cell-surface heparansulfate proteoglycans and apolipoprotein E. J Lipid Res. 1999;40(1):1–6.
70. Iwai A. Properties of NACP/alpha-synuclein and its role in Alzheimer’s disease. Biochim Biophys Acta. 2000;1502(1):95–109. doi:10.1016/s0925-4439(00)00036-3
71. Howes O, McCutcheon R, Stone J. Glutamate and dopamine in schizophrenia: an update for the 21st century. J Psychopharmacol. 2015;29(2):97–115. doi:10.1177/0269881114563634
72. Shi M, Bradner J, Hancock AM, et al. Cerebrospinal fluid biomarkers for Parkinson disease diagnosis and progression. Ann Neurol. 2011;69(3):570–580. doi:10.1002/ana.22311
73. Goldstein DS, Holmes C, Sharabi Y. Cerebrospinal fluid biomarkers of central catecholamine deficiency in Parkinson disease and other synucleinopathies. Brain. 2012;35:1900–1913. doi:10.1093/brain/aws055
74. Miller C, Kirchmair R, Troger J, et al. CSF of neuroleptic-naive first-episode schizophrenic patients: levels of biogenic amines, substance P,and peptides derived from om chromogranin A (GE-25) and secretogranin II(secretoneurin). Biol Psychiatry. 1996;39(11):911–918. doi:10.1016/0006-3223(95)00098-4
75. Soler-López M, Zanzoni A, Lluís R, Stelzl U, Aloy P. Interactome mapping suggests new mechanistic details underlying Alzheimer’s disease. Genome Res. 2011;21(3):364–376. doi:10.1101/gr.114280.110
76. Chen RH, Wislet-Gendebien S, Samuel F, et al. α-Synuclein membrane association is regulated by the Rab3a recycling machinery and presynaptic activity. J Biol Chem. 2013;288(11):7438–7449. doi:10.1074/jbc.M112.439497
77. Gitler AD, Bevis BJ, Shorter J, et al. The Parkinson’s disease protein alpha-synuclein disrupts cellular Rab homeostasis. Proc Natl Acad Sci U S A. 2008;105(1):145–150. doi:10.1073/pnas.0710685105
78. Wang Y, Hancock AM, Bradner J, et al. Complement 3 and factor h in human cerebrospinal fluid in Parkinson’s disease, Alzheimer’s disease, and multiple-system atrophy. Am J Pathol. 2011;178(4):1509–1516. doi:10.1016/j.ajpath.2011.01.006
79. Xiong Y, Yuan C, Chen R, Dawson TM, Dawson VL. ArfGAP1 is a GTPase activating protein for LRRK2: reciprocal regulation of ArfGAP1 by LRRK2. J Neurosci. 2012;32(11):3877–3886. doi:10.1523/JNEUROSCI.4566-11.2012
80. Hiltunen M, Lu A, Thomas AV, et al. Ubiquilin 1 modulates amyloid precursor protein trafficking and Abeta secretion. J Biol Chem. 2006;281(43):32240–32253. doi:10.1074/jbc.M603106200
81. Huang X, Dai FF, Gaisano G, et al. The identification of novel proteins that interact with the GLP-1 receptor and restrain its activity. Mol Endocrinol. 2013;27(9):1550–1563. doi:10.1210/me.2013-1047
82. Li Y, Perry T, Kindy MS, et al. GLP-1 receptor stimulation preserves primary cortical and dopaminergic neurons in cellular and rodent models of stroke and Parkinsonism. Proc Natl Acad Sci U S A. 2009;106(4):1285–1290. doi:10.1073/pnas.0806720106
83. Marazziti D, Mandillo S, Di Pietro C, et al. GPR37 associates with the dopamine transporter to modulate dopamine uptake and behavioral responses to dopaminergic drugs. Proc Natl Acad Sci U S A. 2007;104(23):9846–9851. doi:10.1073/pnas.0703368104
84. Huttlin EL, Ting L, Bruckner RJ, et al. The BioPlex network: a systematic exploration of the human interactome. Cell. 2015;162(2):425–440. doi:10.1016/j.cell.2015.06.043
85. Huttlin EL, Bruckner RJ, Paulo JA, et al. Architecture of the human interactome defines protein communities and disease networks. Nature. 2017;545(7655):505–509. doi:10.1038/nature22366
86. John S, Mishra R. mRNA Transcriptomics of galectins unveils heterogeneous organization in mouse and human brain. Front Mol Neurosci. 2016;9:139. doi:10.3389/fnmol.2016.00139
87. Brieger A, Adryan B, Wolpert F, Passmann S, Zeuzem S, Trojan J. Cytoskeletal scaffolding proteins interact with Lynch-Syndrome associated mismatch repair protein MLH1. Proteomics. 2010;10(18):3343–3355. doi:10.1002/pmic.200900672
88. Chen TC, Lin KT, Chen CH, et al. Using an in situ proximity ligation assay to systematically profile endogenous protein-protein interactions in a pathway network. J Proteome Res. 2014;13(12):5339–5346. doi:10.1021/pr5002737
89. Hartmann A, Hunot S, Michel PP, et al. Caspase-3: a vulnerability factor and final effector in apoptotic death of dopaminergic neurons in Parkinson’s disease. Proc Natl Acad Sci U S A. 2000;97(6):2875–2880. doi:10.1073/pnas.040556597
90. Thomas EA, George RC, Sutcliffe JG. Apolipoprotein D modulates arachidonic acid signaling in cultured cells: implications for psychiatric disorders. Prostaglandins Leukot Essent Fatty Acids. 2003;69(6):421–427.
91. Horrobin DF, Ally AI, Karmali RA, Karmazyn M, Manku MS, Morgan RO. Prostaglandins and schizophrenia: further discussion of the evidence. Psychol Med. 1978;8(1):43–48. doi:10.1017/s0033291700006619
92. Martins-de-Souza D, Maccarrone G, Wobrock T, et al. Proteome analysis of the thalamus and cerebrospinal fluid reveals glycolysis dysfunction and potential biomarkers candidates for schizophrenia. J Psychiatr Res. 2010;44(16):1176–1189. doi:10.1016/j.jpsychires.2010.04.014
93. Magdalinou NK, Noyce AJ, Pinto R, et al. Identification of candidate cerebrospinal fluid biomarkers in parkinsonism using quantitative proteomics. Parkinsonism Relat Disord. 2017;37:65–71. doi:10.1016/j.parkreldis.2017.01.016
94. Abdi F, Quinn JF, Jankovic J, et al. Detection of biomarkers with a multiplex quantitative proteomic platform in cerebrospinal fluid of patients with neurodegenerative disorders. J Alzheimers Dis. 2006;9(3):293–348.
 © 2019 The Author(s). This work is published and licensed by Dove Medical Press Limited. The
full terms of this license are available at https://www.dovepress.com/terms
and incorporate the Creative Commons Attribution
- Non Commercial (unported, 3.0) License.
By accessing the work you hereby accept the Terms. Non-commercial uses of the work are permitted
without any further permission from Dove Medical Press Limited, provided the work is properly
attributed. For permission for commercial use of this work, please see paragraphs 4.2 and 5 of our Terms.
© 2019 The Author(s). This work is published and licensed by Dove Medical Press Limited. The
full terms of this license are available at https://www.dovepress.com/terms
and incorporate the Creative Commons Attribution
- Non Commercial (unported, 3.0) License.
By accessing the work you hereby accept the Terms. Non-commercial uses of the work are permitted
without any further permission from Dove Medical Press Limited, provided the work is properly
attributed. For permission for commercial use of this work, please see paragraphs 4.2 and 5 of our Terms.