Back to Journals » Journal of Inflammation Research » Volume 16
Cerebral Microstructural and Microvascular Changes in Non-Neuropsychiatric Systemic Lupus Erythematosus: A Study Using Diffusion Kurtosis Imaging and 3D Pseudo-Continuous Arterial Spin Labeling
Authors Wang X, Huang L, Guo W, Tang L, Wu A, Wu P, Zhao X, Lin Q ![]() , Yu L
, Yu L ![]()
Received 7 July 2023
Accepted for publication 31 October 2023
Published 22 November 2023 Volume 2023:16 Pages 5465—5475
DOI https://doi.org/10.2147/JIR.S429521
Checked for plagiarism Yes
Review by Single anonymous peer review
Peer reviewer comments 3
Editor who approved publication: Dr Tara Strutt
Xiaojuan Wang,1,* Lingling Huang,1,* Wenbin Guo,2,* Langlang Tang,1 Aiyu Wu,3 Peng Wu,4 Xiance Zhao,4 Qi Lin,1 Lian Yu3
1Department of Radiology, Longyan First Affiliated Hospital of Fujian Medical University, Longyan, Fujian, 364000, People’s Republic of China; 2Department of Pathology, Pingtan Comprehensive Experimental Area Hospital, Fuzhou, Fujian, 350400, People’s Republic of China; 3Department of Rheumatology, Longyan First Affiliated Hospital of Fujian Medical University, Longyan, Fujian, 364000, People’s Republic of China; 4Philips Healthcare, Shanghai, 200000, People’s Republic of China
*These authors contributed equally to this work
Correspondence: Qi Lin, Department of Radiology, Longyan First Affiliated Hospital of Fujian Medical University, No. 105, Jiu Yi North Road, Xin Luo District, Longyan City, 364000, People’s Republic of China, Tel + 86 13950881931, Email [email protected] Lian Yu, Department of Rheumatology, Longyan First Affiliated Hospital of Fujian Medical University, No. 105, Jiu Yi North Road, Xin Luo District, Longyan City, 364000, People’s Republic of China, Email [email protected]
Purpose: The purpose of this study was to observe cerebral microstructure and microcirculation features, as well as changes in white matter (WM) and gray matter (GM) among patients with non-neuropsychiatric systemic lupus erythematosus (non-NPSLE).
Methods: We compared 36 female patients with non-NPSLE and 20 age- and gender-matched healthy controls (HCs) who underwent 3.0T MRI imaging with diffusion kurtosis imaging (DKI) and 3D pseudo-continuous Arterial Spin Labeling (pCASL). Mean kurtosis (MK), mean kurtosis tensor (MKT), and cerebral blood flow (CBF) values were obtained from 25 brain regions, including WM and GM. We analyzed the correlation between imaging indicators and clinical data.
Results: When compared with HCs, patients with non-NPSLE had reduced MK and MKT values in regional WM, deep GM, and the left frontal lobe cortical GM, and increased CBF in the right parietal lobe WM and right semioval center (SOC). The MK and MKT values were weakly correlated with CBF in some regions, including WM and GM. Complement 3 (C3) and Complement 4 (C4) showed a weak positive correlation with MK and MKT in some regions, including WM and deep GM, while platelet (PLT) was positively correlated with MKT in the left frontal lobe WM; dsDNA antibody was correlated negatively with MK in the right occipital lobe WM; and erythrocyte sedimentation rate (ESR) was correlated negatively with CBF in the left SOC.
Conclusion: Our findings revealed the presence of brain microstructural and microvascular abnormalities in non-NPSLE patients, indicating microstructural damage in the cortical GM, which was less commonly reported. We found DKI and pCASL useful in detecting early brain lesions, and MK was a more sensitive and beneficial indicator.
Keywords: arterial spin labeling, cerebral blood flow, diffusion kurtosis imaging, gray matter, systemic lupus erythematosus, white matter
Introduction
Systemic lupus erythematosus (SLE) is a chronic, recurring, female-predominant autoimmune connective tissue disorder that affects various organ systems, including the central nervous system. In non-neuropsychiatric SLE (non-NPSLE), the patient does not have associated neuropsychiatric clinical symptoms. However, studies have shown that such patients have abnormal functional systems such as working memory, attention, learning and memory, and language processing,1–4 which may increase the burden of study and work to some extent. Studies have shown that cerebral microstructural and microcirculatory abnormalities occur in patients with non-NPSLE5–8 but the results have been inconsistent. Such alterations are difficult to detect and diagnose using conventional MRI, which simply shows abnormal signals in white matter (WM) areas and lacks specificity. We designed this study to better understand and observe cerebral microstructural and microvascular changes in non-NPSLE patients. These have been studied using advanced brain imaging methods such as MRI diffusion imaging and perfusion imaging.
Diffusion tensor imaging (DTI) is a diffusion-weighted technique for visualizing cerebral WM injury. Jung et al observed a reduction of the fractional anisotropy (FA) value within WM in all patients with SLE.9,10 In another study, a topology model that was created showed significantly lowered global and local network efficiency, prolonged feature path length, and reduced strength of connections.11 Furthermore, DTI indicated that the extent of brain impairment was related to the severity, activity, and course of the disease.12 In comparison with DTI, diffusional kurtosis imaging (DKI) is a more accurate and noninvasive imaging technology that can accurately detect changes in tissue structure, particularly in non-homogenous tissue.13 It is unaffected by environmental anisotropies and can quantify diffusion and non-Gaussian distributions within intricate living tissues. The mean kurtosis (MK) is defined as the average of the kurtosis coefficients in all spatial directions, analogous to the mean diffusivity (MD) in DTI. The determination relies on the diffusion and kurtosis tensors. The mean kurtosis tensor (MKT) is an averaged kurtosis measure, distinct from the diffusion tensor.14 Both the MK and the MKT display directional diffusion limitations and intricate organization. More pronounced diffusion limitation and more complex organization are indicated by higher MK and MKT values. In DKI, the MK and MKT are measured in vivo to reveal microstructure changes both in gray matter (GM) and WM.14–16 It has been extensively used in several studies, including in both pathological and normal conditions such as cerebral infarction, aging, neurodegeneration, brain injury, and tumors.17–20 There are a few reports on using DKI techniques to explore microstructural features in patients with SLE.21,22
Perfusion imaging has been utilized to assess cerebral microvasculature changes in patients with SLE. The use of invasive dynamic susceptibility contrast-enhanced T2*-weighted perfusion MRI (DSC-MRI) to determine cerebral perfusion in SLE has been studied more frequently, but the results have been inconsistent.23–25 Pseudo-continuous arterial spin labeling (pCASL) MRI-perfusion is a quantitative technique to measure cerebral blood flow (CBF) by continuously labeling blood flowing into an artery with a series of discontinuous short radiofrequency (RF) pulses, and applying a gradient wave during the RF inter-emission interval to mimic a continuous pulse labeling method. Rapid whole-brain imaging is performed after the labeled blood has flowed into the brain tissue, and perfusion-weighted CBF images are obtained by calculating whole-brain perfusion changes through labeling control imaging,26 and offers several advantages over traditional perfusion imaging. These benefits include the fact that no contrast agent is necessary, the procedure is noninvasive, and repeatable scans that provide similar information can be obtained. To date, pCASL has been used in a variety of neurological and psychiatric diseases, including tumors, injuries, and ischemic diseases,27–29 but few studies have investigated its utility in assessing microcirculation changes in patients with SLEs.
In this study, we compared and investigated differences in the brain microstructure and microcirculation in non-NPSLE patients and healthy controls (HCs) using DKI and pCASL parameters (MK, MKT, and CBF), as well as explored the potential relationship between MRI findings and clinical data.
Materials and Methods
Patients and Healthy Controls
The experimental group patients were identified from the Department of Rheumatology, Longyan First Affiliated Hospital of Fujian Medical University, Fujian, China, as per the American College of Rheumatology (ACR) criteria and without any neuropsychiatric syndromes,30 diagnosed as non-NPSLE, and without any comorbidities such as other types of connective tissue diseases, cerebrovascular lesions, and a variety of conditions that cause brain damage, etc. (eg, hypertension, diabetes mellitus, stroke, and traumatic injuries), and those who met the above diagnostic criteria were included in the study. Individuals comprising the healthy control group were enlisted from the Department of Physical Examination, and were excluded if they had any autoimmune disease, serious vascular disease, head trauma, tumor, alcoholism, or any other neurological disorder. All study participants were 18–60 year old females, right-handed, Han nationality, had at least 9 years of education, and able to fully cooperate with MRI scans, and their conventional MRI scanning revealed no significant abnormalities.
Clinical and Laboratory Data
Clinical and laboratory data were obtained from outpatient and inpatient medical records and then carefully reviewed by two researchers (Xiaojuan and Lingling) to ensure that there were no errors in the data. In this study, we collected details pertaining to the duration of disease, activity, serological and immunological indexes such as hemoglobin (HGB), platelet (PLT), erythrocyte sedimentation rate (ESR), complement 3 (C3), complement 4 (C4), antinuclear antibodies, ds-DNA antibody, and 24-hour proteinuria. Laboratory results for all subjects were completed within three days before and after the MRI scan, and disease activity was calculated within the same time frame.
MRI Acquisition and Processing
All the volunteers underwent scanning on a 3.0 T MR scanner (Ingenia CX, Philips Healthcare, Best, the Netherlands) with a 16-channel head coil. For each participant, foam pads were used to keep the head immobile. T1-weighted imaging (T1WI), 3D pCASL, and DKI images were acquired. For the 3D pCASL images, a GraSE sequence was used, with TSE factor = 32, EPI factor = 15, TR/TE =4116/12ms, field of view (FOV) = 240*240*84 mm3, acquisition voxel size = 3.75*3.75*5 mm3, post-labeling delay = 1800 ms, and total acquisition time = 2 min. 36s. The pCASL images were processed with IntelliSpace Portal (v9, Philips Healthcare, Best, the Netherlands) to get the CBF map. For the DKI images, EPI factor = 41, TR/TE = 5709/99 ms, FOV = 222*222 mm2, voxel size = 2.7*2.7 mm2, slice thickness = 2.7 mm, 45 slices. 3 b-values (0, 1000, and 2000s/mm2) with 32 directions, SENSE factor = 2, total acquisition time: 8 min. 33s. To get the parameter maps (including MK and MKT). The DKI images were processed with ISMS (IntelliSpace Medicina Scientia), a software developed in-house based on the open-source tool DIPY (https://dipy.org).
We registered CBF, MK, and MKT maps to the T1WI structure image using the SPM12 toolbox (https://www.fil.ion.ucl.ac.uk/spm/). The Coregister function was used here. T1WI images were selected as the reference images, MK, MKT and CBF images were selected as the source images for the registration. MK, MKT, and CBF were calculated using the ImageJ software (https://imagej.nih.gov/ij/). Regions of interest (ROIs) were placed on T1WI and copied to the MK, MKT, and CBF images to obtain the corresponding MK, MKT, and CBF values. All participants were evaluated by two experienced radiologists (Xiaojuan and Lingling), who have over seven years of relevant experience. Based on some previous articles on studying brain microcirculation and microstructure,8,25 these 25 ROIs were finalized for this study, including the frontal lobe, temporal lobe, occipital lobe, parietal lobe, splenium of the corpus callosum (SCC), semioval center (SOC), thalamus, caudate nucleus, and lenticular nucleus (LN). Each ROI was manually mapped three times in a row, with each measurement spaced 3–5 days apart, and the average was taken as the result. Each ROI was measured in a circular range of approximately 14–20 mm2. All image data measurements were completed within two months.
Statistical Analysis
All statistical analyses were performed using R software (version 4.2.2). The intraclass correlation coefficient (ICC) test was performed to evaluate the imaging data collected by both radiologists, and the data were considered reliable when the ICC was ≥ 0.9. The Shapiro–Wilk test was used to check for normal distribution of all continuous variable data, and Levene’s test was used for checking homogeneity of variance. The Student’s t-test was used if the data followed a normal distribution and satisfied the variance homogeneity test; otherwise Wilcoxon test was used. MK, MKT, and CBF mean values were utilized to compare the non-NPSLE group and the HCs group, t-tests and Wilcoxon tests were used based on their normality tests and homogeneity of variance results. Spearman and Pearson correlation analyses were used to calculate the relationship between imaging measurements and clinical and laboratory data. For continuous variables that conformed to a normal distribution (eg, Age, Education, C3, C4, HGB, etc.), we used Pearson correlation analyses, and for all others, Spearman was used. All measurement data were presented as mean ± standard deviation if they conformed to the normal distribution; otherwise, they were presented as median [1st quartile, 3rd quartile] values. Grades were expressed as percentages. A P-value of < 0.05 was considered statistically significant.
Results
General Demographics and Clinical Characteristics
We included 36 patients and 20 HCs in this study from a total of 38 non-NPSLE patients and 21 HCs after excluding 1 due to image artifacts and 2 due to significant signal abnormalities in the brain. All study participants were female and aged between 18 and 60 years. There was no statistically significant difference in age or education between the two groups. The overall demographic features and clinical details are shown in Table 1. We selected one patient as a representative to show the image maps and the ROI-outlined area, as shown in Figure 1.
 |
Table 1 Demographic Feature and Clinical Information of Non-NPSLE Patients and the Healthy Controls (HC) in This Study |
 |
Figure 1 Representative images and measurements within 25 brain regions of a non-NPSLE patient. A1–5, T1WI, level of RIOs in different brain regions; B1–5, CBF, cerebral blood flow (in unit mL/100g/min); C1–5, MK, mean kurtosis; D1–5, MKT, mean kurtosis tensor. The temporal lobe ROIs were selected at the level of the transcerebral horn in the region of the middle temporal gyrus. The frontal lobe ROIs were selected in the region of the middle and inferior frontal gyrus at the level where the distance between the anterior horns of the bilateral lateral ventricles was greatest. The occipital lobe ROIs were selected as the posterior occipital region at the level of the lateral ventricular triangle. The parietal lobe ROIs were selected from the precuneus region in axial section through the cingulate gyrus. The caudate nucleus, thalamus, and lenticular nucleus (LN) ROIs were chosen to be outlined in the corresponding brain regions of the inner capsule in a better section, and the splenium of the corpus callosum (SCC) ROIs were chosen to be outlined in the near midline region at the same level. The semioval center (SOC) ROIs were located in the white matter area adjacent to the body of the lateral ventricle at the upper level. |
DKI and 3D pCASL Data and Analysis
In DKI, when compared with HCs, non-NPSLE study participants had lower MK and MKT levels in all WM ROIs; both MK and MKT decreased in the left frontal lobe WM and bilateral SOC; MK decreased in the right temporal and occipital lobe, and MKT decreased in the left temporal and occipital lobe, which were statistically significant. Despite this, lower MK of cerebral cortex GM was detected only in the left frontal lobe. Furthermore, the MK and MKT values decreased in deep GM, including the bilateral thalamus and LN, whereas the MK value decreased in SCC.
In 3D pCASL, when compared with HCs, non-NPSLE study participants showed increased CBF values in WM, which were significantly elevated in the right parietal lobe WM and right SOC, but there were no significant differences in CBF values in other regions. The differences between the two groups with a P value < 0.05 are shown in Table 2. A comparison of the mean MK, MKT, and CBF values in all ROIs between the two groups is shown in Table S1.
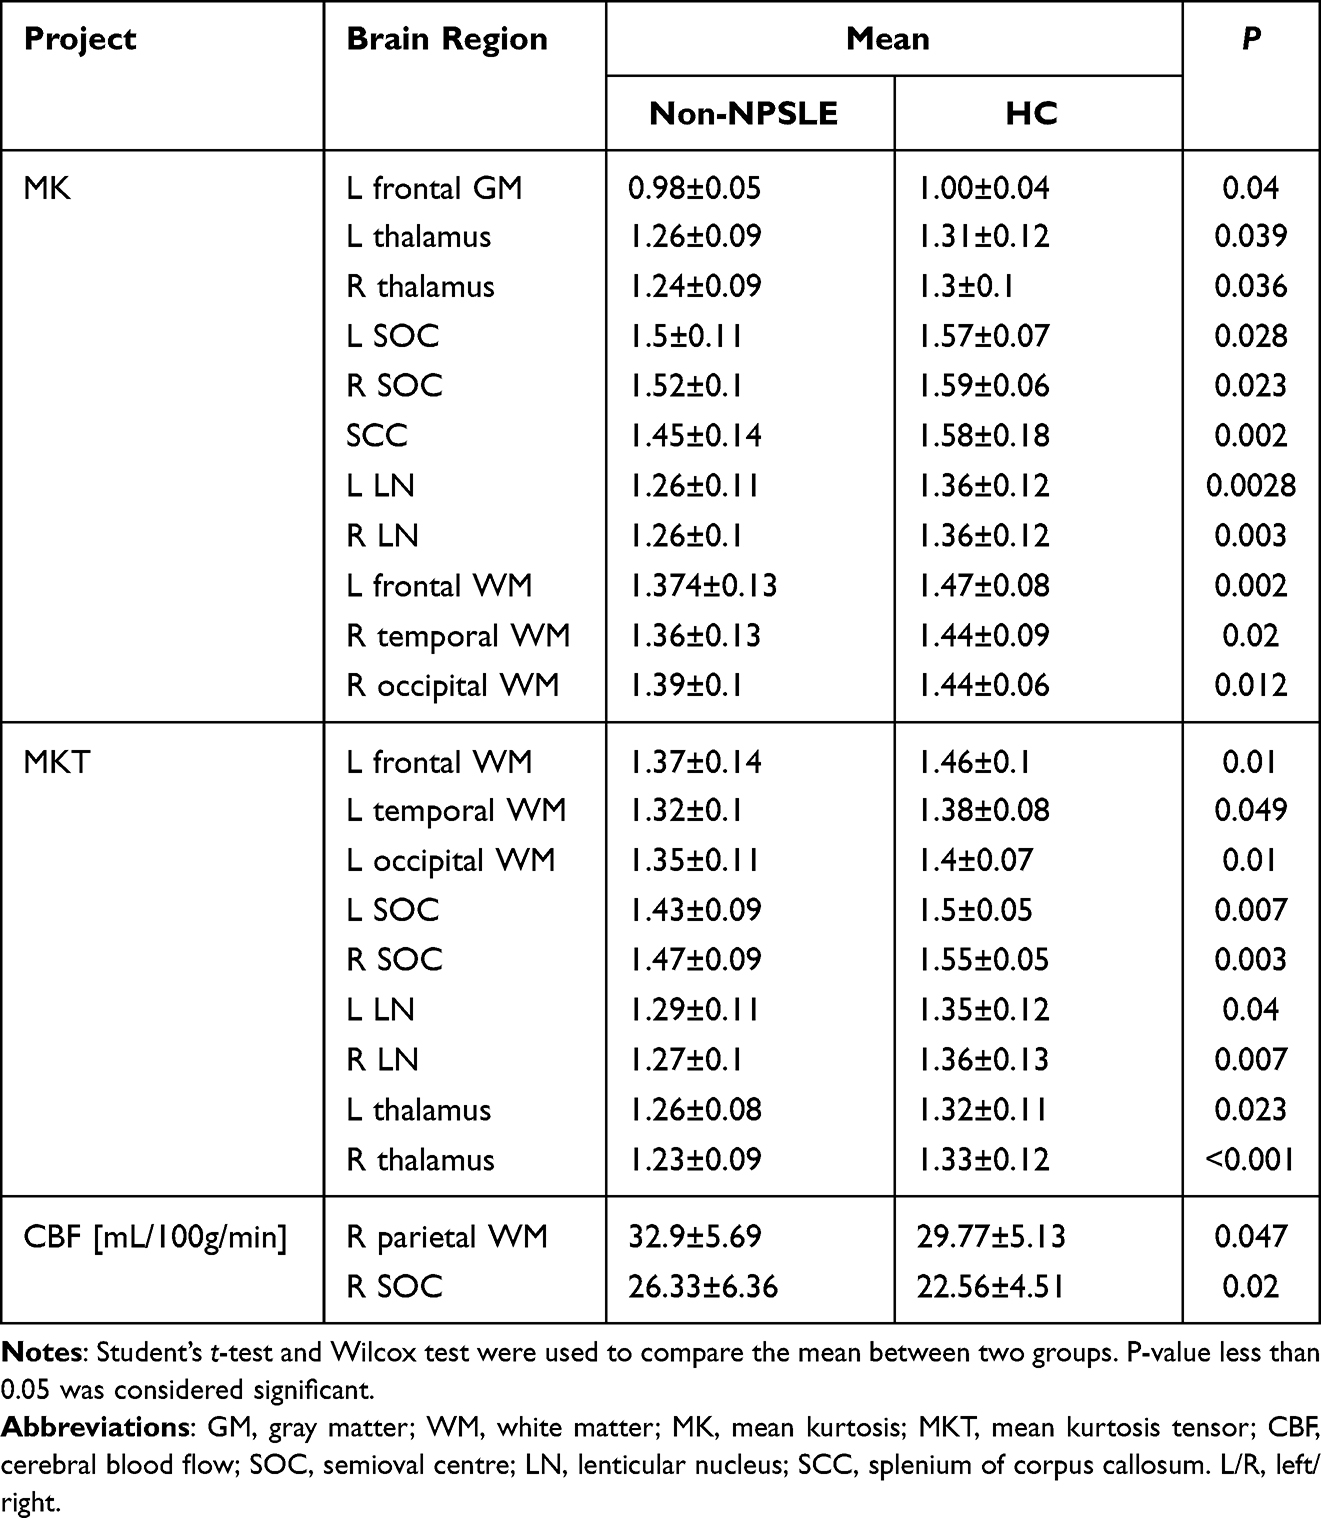 |
Table 2 MK, MKT and CBF Values Achieved Statistically Significant Differences Between Non-NPSLE Patients and Healthy Controls |
Correlation Between DKI and 3D pCASL and Between Imaging Metrics and Clinical Features
The MKT value was weakly positively correlated with CBF in the right parietal lobe WM (P = 0.045, r = 0.34), left thalamus (P = 0.028, r = 0.37), and the right temporal lobe GM (P = 0.032, r = 0.36), but negatively in the left parietal lobe GM (P = 0.01, r = −0.42). The MK value was weakly positively correlated with CBF in the right occipital lobe GM (P = 0.044, r = 0.34), as shown in Figure 2. There were no other significant correlations between MK, MKT, and CBF.
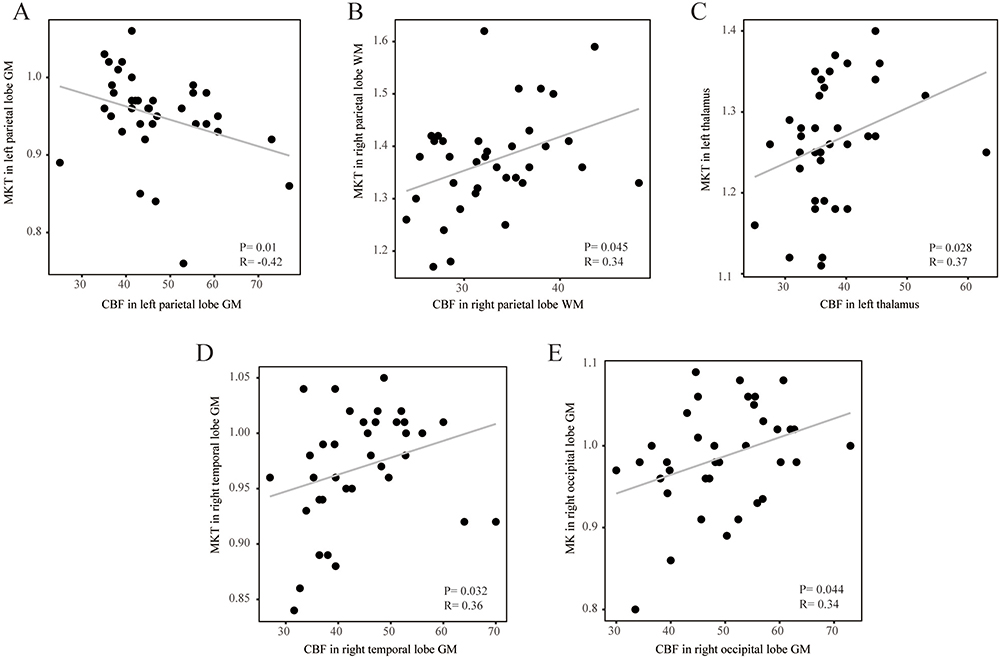 |
Figure 2 The correlation analysis of MK and CBF as well as MKT and CBF, coefficient R and the p-value <0.05 are show in above. GM, gray matter; WM, white matter; MK, mean kurtosis; MKT, mean kurtosis tensor; CBF, cerebral blood flow; Spearman’s and Pearson’s correlation was used between the imaging measurements, and a P value < 0.05 was considered to be significant. (A) The correlation analysis of MKT and CBF in left parietal lobe GM. (B) The correlation analysis of MKT and CBF in right parietal lobe WM. (C) The correlation analysis of MKT and CBF in left thalamus. (D) The correlation analysis of MKT and CBF in right temporal lobe GM. (E) The correlation analysis of MK and CBF in right occipital lobe GM. |
In non-NPSLE, PLT correlated positively with MKT in the left frontal WM (P = 0.04, r = 0.34). C3 correlated positively with MKT in the left temporal lobe WM (P = 0.04, r = 0.34), and MK values in some regions, including the right occipital lobe WM (P = 0.01, r = 0.4), right temporal lobe WM (P = 0.012, r = 0.41), left LN (P = 0.01, r = 0.42), and the right thalamus (P = 0.017, r = 0.39); C4 correlated positively with MK in the right occipital lobe WM (P = 0.03, r = 0.36); ds-DNA antibody correlated negatively with MK in the right occipital lobe WM (P = 0.02, r = −0.35), and ESR correlated negatively with CBF in the left SOC (P = 0.03, r = −0.35), as shown in Table 3. No other significant correlations were observed between imaging metrics and clinical data.
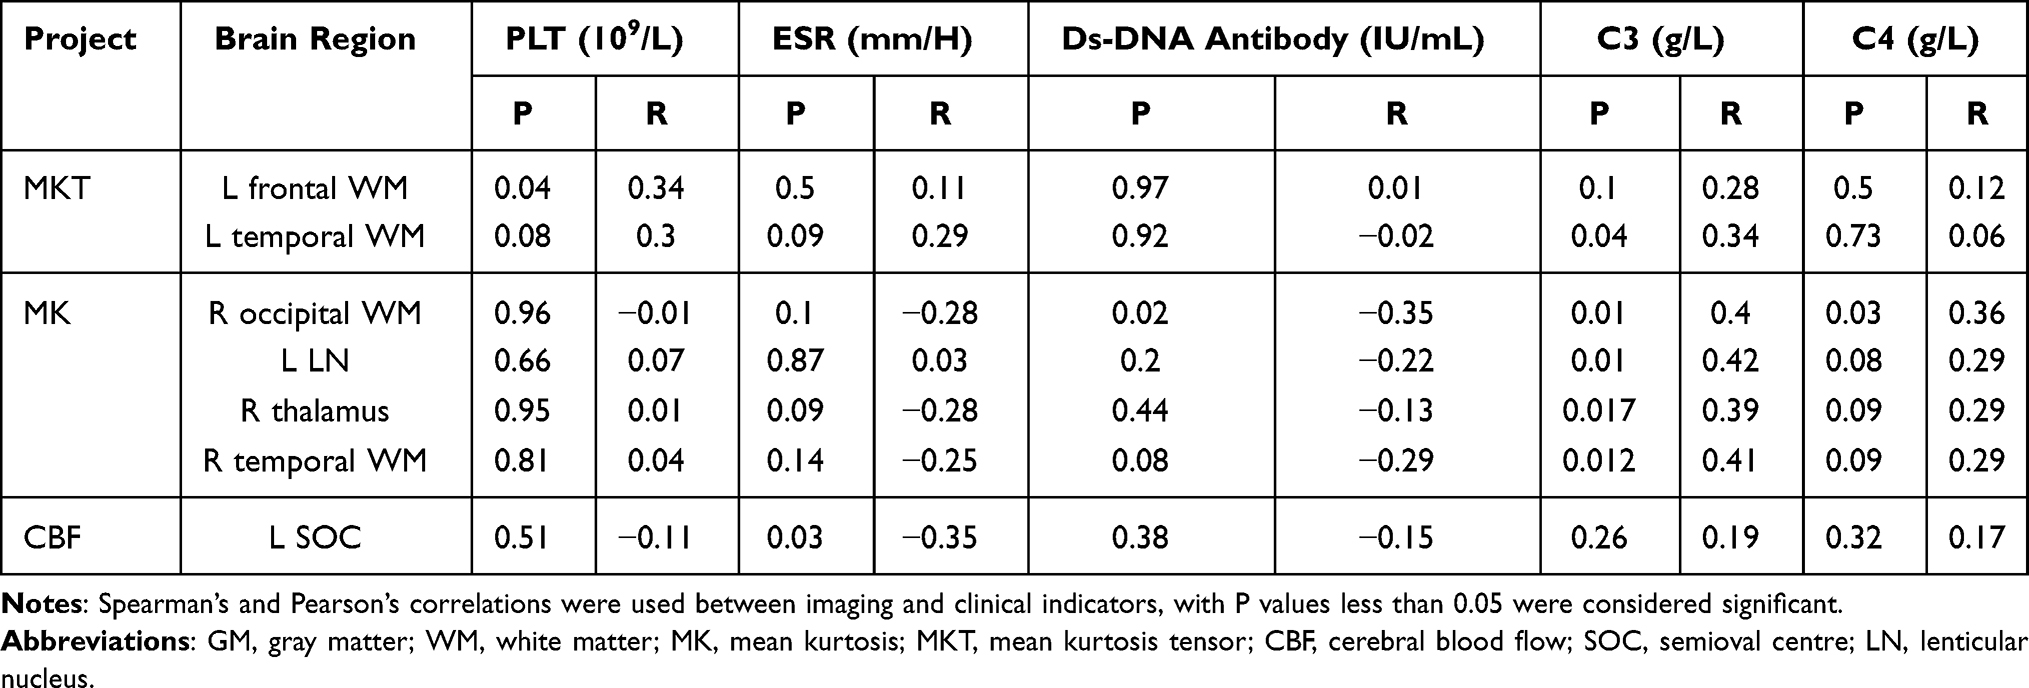 |
Table 3 Correlation Between MK, MKT, CBF and Clinical Indicators in Non-NPSLE Group (n = 36) Within Abnormal Brain Regions ROIs, Significant Correlations Were Shown in Below |
Discussion
In this study, we used diffusion and perfusion-weighted imaging techniques to describe the early microstructural and microcirculatory alterations in GM and WM in the brain of non-NPSLE patients without obvious abnormal signals.
To begin with, we used DKI to evaluate brain microstructure damage in patients with non-NPSLE. MK and MKT values were mainly decreased in the WM and deep GM of the brain, which was consistent with previous findings.22 In most earlier reports, SLE brain microstructural changes were mainly concentrated in the WM and decreased FA values in the network fiber.12,25,31 Furthermore, it has been demonstrated that the network link efficiency and homotopic connectivity were significantly lowered while the feature path was lengthened in non-NPSLE.32,33 These brain damages may be due to a reduction in the structural complexity of the tissue and may be related to degenerative processes caused by axonal and myelin changes and neuronal contraction,15,34 which can be indicated by MK and MKT levels.
A notable finding of our study was the decreased MK value of the left frontal GM and the associated fiber of the SCC in non-NPSLE compared with HCs, which is in line with some previous reports, they proposed that reduced cortical GM volume and cortical thickness of the frontal cortex and frontal super cortex were mainly involved in cognitive and executive functions.35,36 The CC is the largest transverse fiber structure connecting the hemispheric projection fibers. Lower FA and higher MD values have been confirmed in the CC of patients with non-NPSLE, suggesting impairment of CC integrity,37 and our results were consistent with this. In another study, the function of the temporal lobe, which plays an important role in mood modulation, was visibly lower in non-NPSLE patients within the default mode network (DMN).38 The frontal cortex plays a key and not negligible role in social cognition and emotional regulation, and in our study, we found that the MK value in the left frontal GM was decreased, suggesting that DKI may be useful in investigating the relationship between cortical injury and cognitive impairments in SLE.
Furthermore, the study found that brain volume reduction was significant in the SLE group compared to the control group. GM volume atrophy was more widespread and evident than WM, affecting multiple lobes and the limbic cortex.36 We hypothesized that the GM volume loss was primarily caused by neuronal cell body, synapse, and dendrite damage and death, and that these changes would lead to the increase of extracellular space and lower the complexity and integrity of this tissue. MK and MKT have similar capabilities to represent the complexity of tissue microstructure, which was calculated using two different approaches.14 Interestingly, in this study, they showed varied outcomes; for instance, with respect to the temporal and occipital lobe WM, MK values decreased in the right in both, while MKT values decreased in the left in both. Furthermore, MK showed more abnormal information in the brain regions when compared to MKT, implying that MK may be more sensitive in detecting microstructural lesions. We speculated that the different analysis methods may be one of the reasons for this discrepancy.39
Minor vascular disease or vasculitis, immune complex deposition, autoantibody-mediated damage, and cytokine-mediated inflammation can all contribute to tissue disruption.40 As a result, we used 3D pCASL to evaluate cerebral microvascular lesions in non-NPSLE and found that the CBF value was significantly increased in the right parietal WM and right SOC and showed a tendency to increase in WM. These results were partly consistent with Gasparovic,41 and similar to the findings of Zhuo,7 who concluded that brain microcirculation changes are a dynamic development process due to hyperperfusion in patients with non-NPSLE but hypoperfusion in neuropsychiatric SLE (NPSLE) patients. Our findings were inconsistent with results indicated in some previous studies where there was a tendency for perfusion to decrease in non-NPSLE patients compared with HCs in SPECT reports.42,43 In a DSC-MRI imaging study, the values of CBF and cerebral blood volume (CBV) in WM were assessed in non-NPSLE, NPSLE, and HCs; the perfusion reduction was evident in all NPSLE patients and more prominent in primary NPSLE, but there was no difference between non-NPSLE and HCs.8 Nonetheless, in a recent report, it was confirmed that the CBF value was elevated within both the GM and WM of non-NPSLE patients.7
As shown by a histopathologic study, focal vasculopathy occurred in the brain tissues of all patients with SLE and non-NPSLE, characterized by non-specific focal small vasculopathy, while NPSLE impairments were more obvious, including diffuse vasculopathy and microthrombi.38,44 However, the results of our study were consistent with other similar findings in previous studies, such as raised CBF in the right parietal WM and right SOC in non-NPSLE, which contradicted the above histopathological findings. It was unclear why these discrepancies arose. We proposed that this result could be ascribed to a similar blood vessel compensatory mechanism in response to ischemia or damage, which was consistent with a previous fMRI study.7 Another possibility was that the hyperperfusion inside the WM might have been triggered by a probable vascular dysfunction resulting from the increase in blood pressure.45
We analyzed the correlation between the results of DKI and 3D pCASL measurements and found that in some regions composed of WM and GM, the values of MK and MKT were weakly correlated with CBF. Studies have shown that neuronal activity may lead to accelerated redirection of CBF to ensure blood supply to active areas, which is important for maintaining brain vitality and function,46 but another study pointed out that cerebral hemodynamic disturbance caused by cerebral microvascular disease may lead to decreased WM perfusion and concomitant posterior axonal impairment. Furthermore, cerebral microvascular injury leads to reduced vascular reactivity, which may be related to microstructural changes in glial cells, and glial cells are involved in the regulation of the blood-brain barrier and CBF.47 Another study of brain function in non-NPSLE patients found increased connectivity in the DMN and sensorimotor areas and increased hemodynamic delay in the corresponding areas.48 Moreover, in intra-voxel incoherent motion (IVIM) studies, regional changes in brain microvasculature and microstructure have been observed in SLE patients prior to adult onset, demonstrating that increased CBF can lead to enhanced diffusion parameters in the corresponding regions.49 In summary, the relationship between microstructure and microcirculation is complex and unclear, and further research is needed to corroborate these findings.
Finally, our results showed a weak positive correlation between C3, C4, and DKI metrics (including MK and MKT) in some brain regions. In a histopathologic study, it was found that classical and terminal complement components (including C1q and C4d) were frequently significant, and coexistence appeared in small vessels in the brain tissue of patients with NPSLE and non-NPSLE when compared with HCs.44 This indicates that this mechanism may progress the development of brain impairment, and serum complement levels could be used to assess brain microstructural lesions in the future. We also observed a negative correlation between MK in the right occipital lobe WM and ds-DNA antibody in non-NPSLE patients, implying that the antibody titer probably exacerbates brain lesions. Furthermore, we found a weak negative correlation between CBF in the left SOC and ESR and a positive correlation between MKT in the left frontal lobe WM and PLT. As is well known, ESR is related to the degree of disease activity and is usually elevated clinically during disease onset or progression. PLT, as immune regulatory elements, can participate in immune function by releasing mediators or interacting with immune cells and can enhance immune function by combining with mononuclear cells in SLE.50 In SLE, thrombocytopenia is one of the indicators used to evaluate disease activity, indicating that it may be useful in evaluating brain microstructure lesions.
To the best of our knowledge, this is the first study to combine DKI and pCASL in patients with non-NPSLE. In our study, we have demonstrated incipient microscopic injury in both the GM and WM, as well as microvascular changes in the WM and evidence of cortical damage in the GM. However, there are some limitations in our study: it was a cross-sectional study with a relatively small sample size involving only non-NPSLE patients, and all the ROIs were manually measured. A multicenter study with a larger sample size consisting of non-NPSLE and NPSLE with an evaluation of the entire brain area is required to corroborate our findings. Additionally, a longitudinal and dynamic study of brain microstructure and microcirculatory changes will also help us to understand the evolution of the disease, identify and diagnose brain damage early using imaging technology, and intervene to treat it.
Conclusion
In conclusion, using the non-invasive DKI and pCASL techniques, we found abnormal cerebral microstructural and microvascular changes in non-NPSLE patients, we have demonstrated the impairment of GM in the left frontal cortex. In our opinion, DKI is a beneficial and promising method to detect brain microstructural damage. MK is a more sensitive indicator. In this study, we found that MK has the potential to evaluate non-NPSLE brain microstructural damage, which indicates that MK may be a useful biomarker reflecting microstructural lesions and may be used to identify NPSLE in the future, contributes to early clinical detection and diagnosis, and early intervention and treatment; or can be used for routine or dynamic detection of SLE brain injury to identify factors (drugs, illness, etc.) that aggravate or alleviate brain injury, which is of great significance for the identification and diagnosis of early changes in brain damage in SLE patients.
Institutional Review Board Statement
The study was conducted in accordance with the Declaration of Helsinki and approved by the Institutional Review Board of Longyan First Affiliated Hospital of Fujian Medical University before conducting the experiment. Approval Number: (2019) Ethical Review Scientific Research No. 37.
Data Sharing Statement
The datasets used and/or analysed during the current study available from the corresponding author on reasonable request. We declared that materials described in the manuscript, including all relevant raw data, will be freely available to any scientist wishing to use them for non-commercial purposes, without breaching participant confidentiality.
Informed Consent Statement
Informed consent was obtained from all volunteers involved in the study.
Acknowledgments
We would like to acknowledge the hard and dedicated work of all the staff that implemented the intervention and evaluation components of the study.
Funding
This study was supported by Startup Fund for scientific research, Fujian Medical University (Grant number 2019QH1210) and Sponsored by Fujian Province Natural Science Foundation (Grant number 2021J011440).
Disclosure
The authors report no conflicts of interest in this work.
References
1. Mackay M, Bussa MP, Aranow C, et al. Differences in regional brain activation patterns assessed by functional magnetic resonance imaging in patients with systemic lupus erythematosus stratified by disease duration. Mol Med. 2011;17(11–12):1349–1356. doi:10.2119/molmed.2011.00185
2. DiFrancesco MW, Holland SK, Ris MD, et al. Functional magnetic resonance imaging assessment of cognitive function in childhood-onset systemic lupus erythematosus: a pilot study. Arthritis Rheum. 2007;56(12):4151–4163. doi:10.1002/art.23132
3. Hou J, Lin Y, Zhang W, et al. Abnormalities of frontal-parietal resting-state functional connectivity are related to disease activity in patients with systemic lupus erythematosus. PLoS One. 2013;8(9):e74530. doi:10.1371/journal.pone.0074530
4. Shapira-Lichter I, Vakil E, Litinsky I, et al. Learning and memory-related brain activity dynamics are altered in systemic lupus erythematosus: a functional magnetic resonance imaging study. Lupus. 2013;22(6):562–573. doi:10.1177/0961203313480399
5. Costallat BL, Ferreira DM, Lapa AT, et al. Brain diffusion tensor MRI in systematic lupus erythematosus: a systematic review. Autoimmun Rev. 2018;17(1):36–43. doi:10.1016/j.autrev.2017.11.008
6. Schmidt-Wilcke T, Cagnoli P, Wang P, et al. Diminished white matter integrity in patients with systemic lupus erythematosus. Neuroimage Clin. 2014;5:291–297. doi:10.1016/j.nicl.2014.07.001
7. Zhuo Z, Su L, Duan Y, et al. Different patterns of cerebral perfusion in SLE patients with and without neuropsychiatric manifestations. Hum Brain Mapp. 2020;41(3):755–766. doi:10.1002/hbm.24837
8. Papadaki E, Fanouriakis A, Kavroulakis E, et al. Neuropsychiatric lupus or not? Cerebral hypoperfusion by perfusion-weighted MRI in normal-appearing white matter in primary neuropsychiatric lupus erythematosus. Ann Rheum Dis. 2018;77(3):441–448. doi:10.1136/annrheumdis-2017-212285
9. Emmer BJ, Veer IM, Steup‐Beekman GM, et al. Tract-based spatial statistics on diffusion tensor imaging in systemic lupus erythematosus reveals localized involvement of white matter tracts. Arthritis Rheum. 2010;62(12):3716–3721. doi:10.1002/art.27717
10. Jung RE, Caprihan A, Chavez RS, et al. Diffusion tensor imaging in neuropsychiatric systemic lupus erythematosus. BMC Neurol. 2010;10(1):65. doi:10.1186/1471-2377-10-65
11. Zhao L, Tan X, Wang J, et al. Brain white matter structural networks in patients with non-neuropsychiatric systemic lupus erythematosus. Brain Imaging Behav. 2018;12(1):142–155. doi:10.1007/s11682-017-9681-3
12. Sarbu N, Toledano P, Calvo A, et al. Advanced MRI techniques: biomarkers in neuropsychiatric lupus. Lupus. 2017;26(5):510–516. doi:10.1177/0961203316674820
13. Kamagata K, Tomiyama H, Hatano T, et al. A preliminary diffusional kurtosis imaging study of Parkinson disease: comparison with conventional diffusion tensor imaging. Neuroradiology. 2014;56(3):251–258. doi:10.1007/s00234-014-1327-1
14. Henriques RN, Correia MM, Marrale M, et al. Diffusional kurtosis imaging in the diffusion imaging in python project. Front Hum Neurosci. 2021;15:675433. doi:10.3389/fnhum.2021.675433
15. Bester M, Jensen JH, Babb JS, et al. Non-Gaussian diffusion MRI of gray matter is associated with cognitive impairment in multiple sclerosis. Mult Scler. 2015;21(7):935–944. doi:10.1177/1352458514556295
16. Hansen B, Shemesh N, Jespersen SN. Fast imaging of mean, axial and radial diffusion kurtosis. Neuroimage. 2016;142:381–393. doi:10.1016/j.neuroimage.2016.08.022
17. Wang J-J, Lin W-Y, Lu C-S, et al. Parkinson disease: diagnostic utility of diffusion kurtosis imaging. Radiology. 2011;261(1):210–217. doi:10.1148/radiol.11102277
18. Delgado Y, Palacios R, Henningsen K, et al. Diffusion kurtosis imaging and high-resolution MRI demonstrate structural aberrations of caudate putamen and amygdala after chronic mild stress. PLoS One. 2014;9(4):e95077. doi:10.1371/journal.pone.0095077
19. Hall ED, Sullivan PG, Gibson TR, et al. Spatial and temporal characteristics of neurodegeneration after controlled cortical impact in mice: more than a focal brain injury. J Neurotrauma. 2005;22(2):252–265. doi:10.1089/neu.2005.22.252
20. Jensen JH, Falangola MF, Hu C, et al. Preliminary observations of increased diffusional kurtosis in human brain following recent cerebral infarction. NMR Biomed. 2011;24(5):452–457. doi:10.1002/nbm.1610
21. Silvagni E, Bortoluzzi A, Borrelli M, et al. Cerebral microstructure analysis by diffusion-based MRI in systemic lupus erythematosus: lessons learned and research directions. Brain Sci. 2021;12(1):70. doi:10.3390/brainsci12010070
22. Zhang Z, Wang Y, Shen Z, et al. The neurochemical and microstructural changes in the brain of systemic lupus erythematosus patients: a multimodal MRI study. Sci Rep. 2016;6(1):19026. doi:10.1038/srep19026
23. Borrelli M, Tamarozzi R, Colamussi P, et al. Evaluation with MR, perfusion MR and cerebral flowSPECT in NPSLE patients. Radiol Med. 2003;105(5–6):482–489.
24. Emmer BJ, van Osch MJ, Wu O, et al. Perfusion MRI in neuro-psychiatric systemic lupus erthemathosus. J Magn Reson Imaging. 2010;32(2):283–288. doi:10.1002/jmri.22251
25. Zimny A, Szmyrka-Kaczmarek M, Szewczyk P, et al. In vivo evaluation of brain damage in the course of systemic lupus erythematosus using magnetic resonance spectroscopy, perfusion-weighted and diffusion-tensor imaging. Lupus. 2014;23(1):10–19. doi:10.1177/0961203313511556
26. Järnum H, Steffensen EG, Knutsson L, et al. Perfusion MRI of brain tumours: a comparative study of pseudo-continuous arterial spin labelling and dynamic susceptibility contrast imaging. Neuroradiology. 2010;52(4):307–317. doi:10.1007/s00234-009-0616-6
27. Batalov AI, Afandiev RM, Zakharova NE, et al. 3D pseudo-continuous arterial spin labeling-MRI (3D PCASL-MRI) in the differential diagnosis between glioblastomas and primary central nervous system lymphomas. Neuroradiology. 2022;64(8):1539–1545. doi:10.1007/s00234-021-02888-4
28. Oura D, Kawabori M, Niiya Y, et al. The validity of the acute stroke assessment using rapid pseudo-continuous arterial spin labeling (ASAP-ASL) method for acute thrombectomy. J Neurosurg Sci. 2021;65(5):480–485. doi:10.23736/S0390-5616.18.04607-6
29. Le Heron CJ, Wright SL, Melzer TR, et al. Comparing cerebral perfusion in Alzheimer’s disease and Parkinson’s disease dementia: an ASL-MRI study. J Cereb Blood Flow Metab. 2014;34(6):964–970. doi:10.1038/jcbfm.2014.40
30. Liang MH, Corzillius M, Bae SC, et al. The American College of Rheumatology nomenclature and case definitions for neuropsychiatric lupus syndromes. Arthritis Rheum. 1999;42(4):599–608. doi:10.1002/1529-0131(199904)42:4<599::AID-ANR2>3.0.CO;2-F
31. Mackay M, Vo A, Tang CC, et al. Metabolic and microstructural alterations in the SLE brain correlate with cognitive impairment. JCI Insight. 2019;4(1). doi:10.1172/jci.insight.124002
32. Xu M, Tan X, Zhang X, et al. Alterations of white matter structural networks in patients with non-neuropsychiatric systemic lupus erythematosus identified by probabilistic tractography and connectivity-based analyses. Neuroimage Clin. 2017;13:349–360. doi:10.1016/j.nicl.2016.12.021
33. Wang YL, Jiang M-L, Huang L-X, et al. Disrupted resting-state interhemispheric functional connectivity in systemic lupus erythematosus patients with and without neuropsychiatric lupus. Neuroradiology. 2022;64(1):129–140. doi:10.1007/s00234-021-02750-7
34. Zhang H, Li Q, Liu L, et al. Altered microstructure of cerebral gray matter in neuromyelitis optica spectrum disorder-optic neuritis: a DKI Study. Front Neurosci. 2021;15:738913. doi:10.3389/fnins.2021.738913
35. Niu C, Tan X, Liu X, et al. Cortical thickness reductions associate with abnormal resting-state functional connectivity in non-neuropsychiatric systemic lupus erythematosus. Brain Imaging Behav. 2018;12(3):674–684. doi:10.1007/s11682-017-9729-4
36. Appenzeller S, Bonilha L, Rio PA, et al. Longitudinal analysis of gray and white matter loss in patients with systemic lupus erythematosus. Neuroimage. 2007;34(2):694–701. doi:10.1016/j.neuroimage.2006.09.029
37. Shapira-Lichter I, Weinstein M, Lustgarten N, et al. Impaired diffusion tensor imaging findings in the corpus callosum and cingulum may underlie impaired learning and memory abilities in systemic lupus erythematosus. Lupus. 2016;25(11):1200–1208. doi:10.1177/0961203316636471
38. Su L, Zhuo Z, Duan Y, et al. Structural and functional characterization of gray matter alterations in female patients with neuropsychiatric systemic lupus. Front Neurosci. 2022;16:839194. doi:10.3389/fnins.2022.839194
39. Khan AR, Chuhutin A, Wiborg O, et al. Biophysical modeling of high field diffusion MRI demonstrates micro-structural aberration in chronic mild stress rat brain. Neuroimage. 2016;142:421–430. doi:10.1016/j.neuroimage.2016.07.001
40. Zardi EM, Taccone A, Marigliano B, et al. Neuropsychiatric systemic lupus erythematosus: tools for the diagnosis. Autoimmun Rev. 2014;13(8):831–839. doi:10.1016/j.autrev.2014.04.002
41. Gasparovic CM, Roldan CA, Sibbitt WL, et al. Elevated cerebral blood flow and volume in systemic lupus measured by dynamic susceptibility contrast magnetic resonance imaging. J Rheumatol. 2010;37(9):1834–1843. doi:10.3899/jrheum.091276
42. Zhang X, Zhu Z, Zhang F, et al. Diagnostic value of single-photon-emission computed tomography in severe central nervous system involvement of systemic lupus erythematosus: a case-control study. Arthritis Rheum. 2005;53(6):845–849. doi:10.1002/art.21591
43. Chen JJ, Yen R-F, Kao A, et al. Abnormal regional cerebral blood flow found by technetium-99m ethyl cysteinate dimer brain single photon emission computed tomography in systemic lupus erythematosus patients with normal brain MRI findings. Clin Rheumatol. 2002;21(6):516–519. doi:10.1007/s100670200126
44. Cohen D, Rijnink EC, Nabuurs RJA, et al. Brain histopathology in patients with systemic lupus erythematosus: identification of lesions associated with clinical neuropsychiatric lupus syndromes and the role of complement. Rheumatology. 2017;56(1):77–86. doi:10.1093/rheumatology/kew341
45. Gasparovic C, Qualls C, Greene ER, et al. Blood pressure and vascular dysfunction underlie elevated cerebral blood flow in systemic lupus erythematosus. J Rheumatol. 2012;39(4):752–758. doi:10.3899/jrheum.110538
46. Presa JL, Saravia F, Bagi Z, et al. Vasculo-neuronal coupling and neurovascular coupling at the neurovascular unit: impact of hypertension. Front Physiol. 2020;11:584135. doi:10.3389/fphys.2020.584135
47. Abutarboush R, Gu M, Kawoos U, et al. Exposure to blast overpressure impairs cerebral microvascular responses and alters vascular and astrocytic structure. J Neurotrauma. 2019;36(22):3138–3157. doi:10.1089/neu.2019.6423
48. Papadaki E, Simos NJ, Kavroulakis E, et al. Converging evidence of impaired brain function in systemic lupus erythematosus: changes in perfusion dynamics and intrinsic functional connectivity. Neuroradiology. 2022;64(8):1593–1604. doi:10.1007/s00234-022-02924-x
49. DiFrancesco MW, Lee G, Altaye M, et al. Cerebral microvascular and microstructural integrity is regionally altered in patients with systemic lupus erythematosus. Arthritis Res Ther. 2020;22(1):135. doi:10.1186/s13075-020-02227-7
50. Mariscal A, Zamora C, Magallares B, et al. Phenotypic and functional consequences of PLT binding to monocytes and its association with clinical features in SLE. Int J Mol Sci. 2021;22(9):4719. doi:10.3390/ijms22094719
 © 2023 The Author(s). This work is published and licensed by Dove Medical Press Limited. The
full terms of this license are available at https://www.dovepress.com/terms
and incorporate the Creative Commons Attribution
- Non Commercial (unported, 3.0) License.
By accessing the work you hereby accept the Terms. Non-commercial uses of the work are permitted
without any further permission from Dove Medical Press Limited, provided the work is properly
attributed. For permission for commercial use of this work, please see paragraphs 4.2 and 5 of our Terms.
© 2023 The Author(s). This work is published and licensed by Dove Medical Press Limited. The
full terms of this license are available at https://www.dovepress.com/terms
and incorporate the Creative Commons Attribution
- Non Commercial (unported, 3.0) License.
By accessing the work you hereby accept the Terms. Non-commercial uses of the work are permitted
without any further permission from Dove Medical Press Limited, provided the work is properly
attributed. For permission for commercial use of this work, please see paragraphs 4.2 and 5 of our Terms.